Comparative Modeling of Cod-Capelin Dynamics in the Newfoundland-Labrador Shelves and Barents Sea Ecosystems
 Mariano Koen-Alonso
 Ulf Lindstrøm
 Andrew Cuff
- 1Northwest Atlantic Fisheries Centre (NAFC), Fisheries and Oceans Canada (DFO), St. John’s, NL, Canada
- 2Institute of Marine Research (IMR), Tromsø, Norway
- 3Department of Arctic and Marine Biology, Arctic University of Norway, Tromsø, Norway
The Atlantic cod (Gadus morhua) stocks in the Newfoundland-Labrador Shelves (NL) and Barents Sea (BS) ecosystems have shown divergent trajectories over the last 40 years. Both stocks experienced either an important decline (BS) or a collapse (NL) in the mid-1980s and early 1990s, respectively. After these population reductions, the BS stock quickly rebounded and it is currently at record high levels, while the NL stock, despite showing some improvement since the mid-2000s, remains at low levels. Fishing and environmental conditions are known to be important drivers of cod dynamics in both ecosystems, especially the availability of high energy prey like capelin (Mallotus villosus), however, the question of how different or similar these two stocks truly are remains. Could, for example, the NL cod stock rebuild if presented to conditions like the ones experienced by BS cod? To explore such questions, we developed a simple biomass dynamic model for cod using a bioenergetic-allometric approach. This model includes fisheries catches and capelin availability as external drivers and was implemented for both ecosystems. Despite the contrasting trends, the model produced very good fits, and showed some remarkably similar estimated parameters in both systems. We explored these similarities by (a) performing the thought experiment of transferring cod stocks between ecosystems by switching estimated key parameters between models and comparing the output, and (b) implementing an integrated model architecture which allowed fitting common parameters for both stocks to evaluate the similarity of key vital rates. Our results indicate that cod trajectories in NL and BS can be reliably described using simple bioenergetic-allometric arguments, fishery catches, and capelin availability. Model parameters that encapsulate intrinsic vital rates were not significantly different between stocks. This indicates that NL and BS cod stocks are biologically similar, and that the differences in their trajectories are driven by the ecosystem context in which these stocks are embedded, and suggests that the NL stock would be expected to rebuild if enough capelin were available. This also indicates that capelin status and trend should be an important consideration for effective management of these cod stocks.
Introduction
The Newfoundland and Labrador Shelves (NL) and the Barents Sea (BS) are considered typical high-latitude shelf ecosystems (Figure 1), implying strong seasonality in physics (e.g., sea ice, temperature) and biological production, high productivity, and low biological diversity (e.g., Dayton et al., 1994; Wassmann et al., 2006; Gaichas et al., 2014). Both regions have marine communities historically dominated by groundfish, with Atlantic cod (Gadus morhua) as the dominant fish predator, small pelagic fish like capelin (Mallotus villosus) and herring (Cuplea harengus) acting as key forage species by connecting primary and secondary production with upper trophic levels, and with marine mammals as important top predators (e.g., Wassmann et al., 2006; Gaichas et al., 2014; Bernier et al., 2018; Koen-Alonso and Cuff, 2018). The annual production cycle in both ecosystems is dominated by the spring bloom, where sea ice dynamics play an important regulatory role, and characterized by an important bentho-pelagic coupling (e.g., Wassmann et al., 2006; Thompson et al., 2008; Bernier et al., 2018).
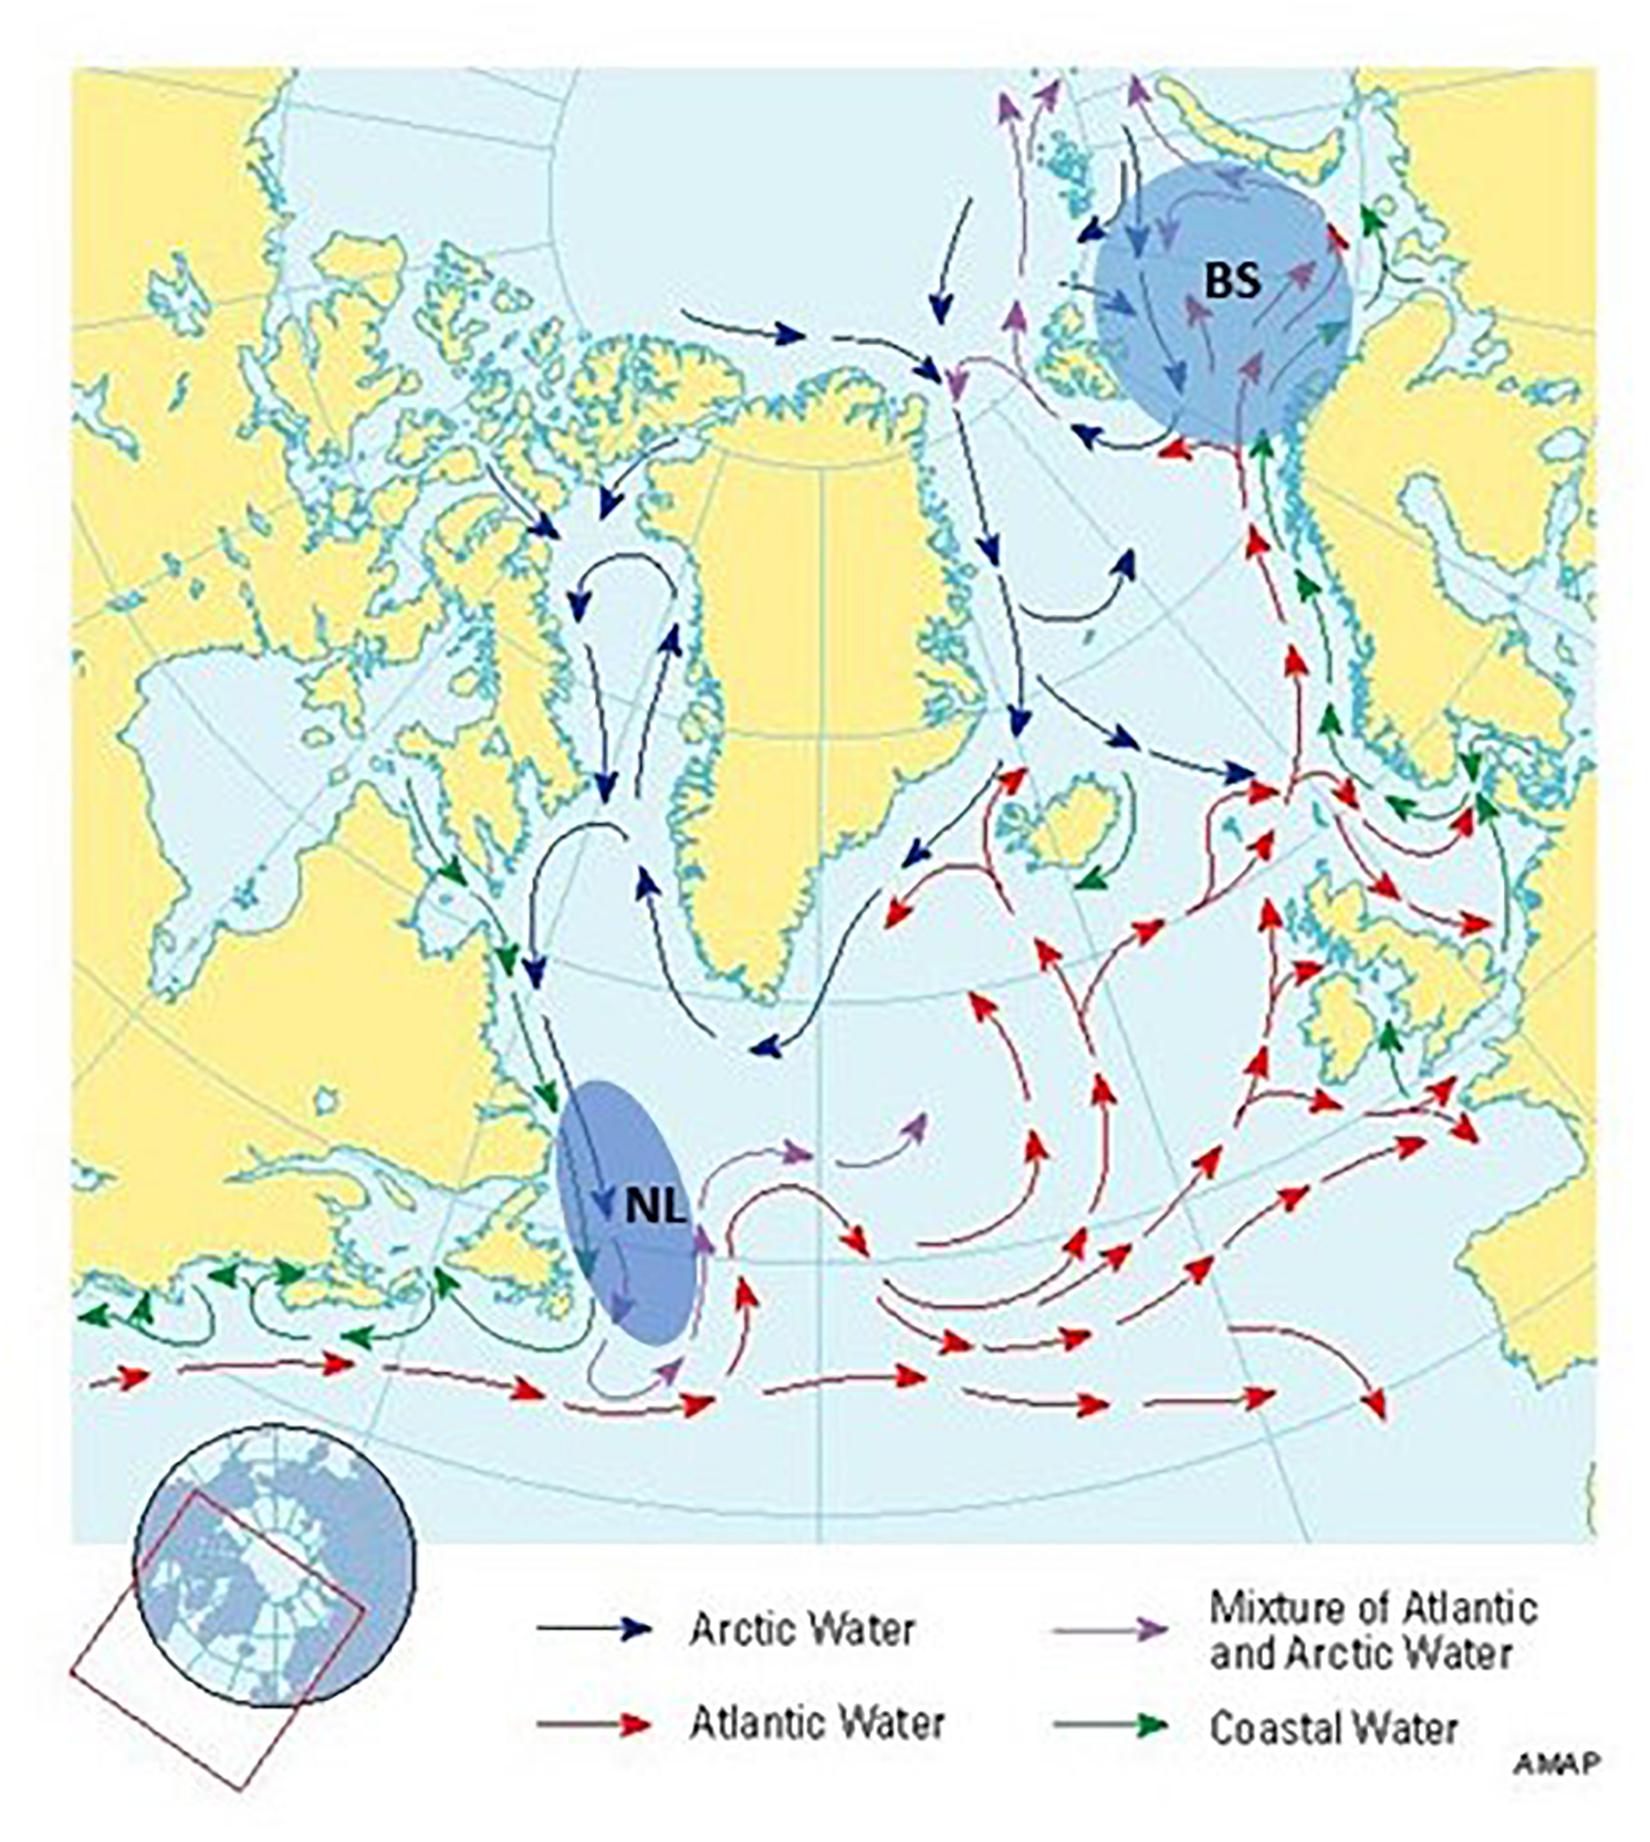
Figure 1. Location of the two ecosystems, Newfoundland-Labrador shelves (NL) and Barents Sea (BS) (marked with ellipses), for which cod stocks are being compared in this study, with indication of major surface currents in the north Atlantic Ocean (AMAP 1998).
While similar in many respects, these two ecosystems also display major physical differences (Drinkwater et al., 2013). The oceanography of the NL ecosystem is characterized by the unidirectional north to south flow of the cold Labrador current, while the BS oceanography is characterized by a more counter-clockwise flow within its basin, defined by the warm continuation of the Atlantic current, the Norwegian current, and inflows from the Arctic (Figure 1). Another important difference is that, while both ecosystems are showing warming signals in recent decades, NL has shown a more cyclic pattern in ocean conditions, with a very cold period in the late 1980s and early 1990s, clear warming trends from the mid-2000s to the mid-2010s, and a return to average conditions since (e.g., Colbourne, 2004; Drinkwater et al., 2013; Lind et al., 2018; Cyr et al., 2020). On the other hand, the BS ecosystem also experienced a cold period in ocean conditions in the 1980s but has seen a strong and directional warming since the mid-2000s. This change has led to a reduction in the domain of Arctic waters in BS, triggering an expansion of boreal fish communities and a reduction in Arctic ones (Fossheim et al., 2015).
Another important contrast between these two ecosystems is the trajectory and status of their fish communities. Both ecosystems have a long history of fishing, traditionally targeting Atlantic cod as the staple catch, but also other groundfish and pelagic fishes (e.g., flatfishes, capelin, herring). They both experienced significant fishing pressure to the point of overfishing resources between the 1960s and 1980s (e.g., Hutchings and Myers, 1994; Myers et al., 1996; Lilly et al., 2013; Koen-Alonso et al., 2013; Haug et al., 2017; Popov and Zeller, 2018; ICES, 2019). The compounding effects of environmental conditions and fishing led to a regime shift in NL, with the collapse of groundfish stocks and capelin, and the increase in shellfish species like Northern shrimp (Pandalus borealis) and snow crab (Chionoecetes opilio) (e.g., Koen-Alonso et al., 2010; Buren et al., 2014a; Pedersen et al., 2017; Koen-Alonso and Cuff, 2018). Today, after experiencing two decades of shellfish dominance, the NL fish community is showing modest signals of groundfish rebuilding, likely tied to an also modest capelin rebuilding, and is still far below its pre-collapse levels (Koen-Alonso and Cuff, 2018). In contrast, the BS capelin stock typically displays decadal fluctuation (Gjøsæter et al., 2009; Carscadden et al., 2013; ICES, 2019). This stock has “collapsed” four times in the past four decades (mid-1980s, 1990s, 2000s, and 2010s; ICES, 2020) but it is only the capelin collapse in the mid-1980s that had major ecosystem consequences. During this time significant reductions in groundfish abundance, and an invasion of southern areas by starving harp seals (Pagophilus groenlandicus) were observed (Haug et al., 1991; Gjøsæter et al., 2009). Unlike NL, the BS fish community recovered in a few years after these collapses (Johannesen et al., 2012), and has built-up record levels of groundfish biomass despite the four capelin collapses.
Against this backdrop of broader ecosystem change, the cod stocks in NL and BS have played a central role in defining these changes, showing very divergent trajectories over the last 40 years (Cadigan, 2015; ICES, 2018, 2019, 2020; DFO, 2019, 2020). Both stocks experienced either a significant decline (BS) or a collapse (NL) in the mid-1980s and early 1990s, respectively. After these important population declines, the BS stock quickly rebounded and it is currently experiencing an all times high level (e.g., Bogstad et al., 2015; ICES, 2019). The NL stock, despite showing improvements since the mid-2000s, continues to be at a low level to this day (DFO, 2019, 2020).
While there is little question that fishing played a significant role in the declines of these stock (e.g., Hutchings and Myers, 1994; Myers et al., 1996; Lilly et al., 2013), current understanding also indicates that environmental conditions are important drivers of cod dynamics in both ecosystems, especially the availability of high energy prey like capelin (Rose and O’Driscoll, 2002; Buren et al., 2014b; Mullowney and Rose, 2014; Bogstad et al., 2015). These general similarities, together with the major differences in their trajectories, beg the question about how different or similar these two stocks truly are. Are these different responses more linked to ecosystem conditions, or are there more intrinsic biological/physiological differences between these stocks what have allowed BS cod to rebuild while preventing recovery of NL cod? To explore these questions, we did a comparative analysis of the NL and BS cod dynamics using the same modeling framework for both stocks, and contrasted the results obtained between ecosystems. More specifically, we modeled the biomass dynamics using a bioenergetic-allometric approach (Yodzis and Innes, 1992; Koen-Alonso and Yodzis, 2005; Buren et al., 2014b), and considered the same external drivers for both cod stocks (i.e., fisheries catches and capelin availability). Furthermore, we proceeded to imagine transferring cod stocks between ecosystems by switching estimated parameter between models and comparing the output. Further, we investigated more formally the similarities in vital rates between stocks by implementing an integrated model architecture which allowed estimating common parameters between stocks.
Materials and Methods
Concept and Modeling Approach
There are many possible ways in which the NL and BS cod stocks could be compared, from traditional morphometric analyses, genetics, and reproductive biology, effectively focusing on fish biological characteristics and traits, all the way to population and ecosystem modeling analyses focused on the dynamics of the stocks, and how they have responded to specific combinations of external drivers and perturbations (e.g., Cole et al., 1991). Our analysis here follows the latter, but also considers some intrinsic biological characteristics, more in line with the former, by using a bioenergetic-allometric rationale to approach model structure and parameterization (Yodzis and Innes, 1992; Yodzis, 1998; Koen-Alonso and Yodzis, 2005; Buren et al., 2014b).
The basic premise of this analysis is to describe the biomass dynamics of each cod stock by fitting the same simple biomass dynamic model to both stocks and comparing the resulting model fits and estimated parameters. The model describes the changes in cod stock biomass as a function of losses through respiration, density-dependent natural mortality, and harvesting (i.e., fishing), and gains from consumption of capelin and other prey. Both capelin biomass and fishery catches are inputs into the model, serving as external drivers of the cod dynamics. Some model parameters are fixed using the bioenergetic-allometric rationale (Yodzis and Innes, 1992; Yodzis, 1998; Koen-Alonso and Yodzis, 2005; Buren et al., 2014b), while others are estimated by fitting the model to data (see below). The basic model equation is:
where is the predicted cod biomass in year t+1, and , Ct, and H_t are the observed biomasses of cod and capelin, and the cod catch in year t, respectively. This model implementation assumes a multiplicative process errorεt following a lognormal distribution (the process error assumption is the reason behind the use of observed cod biomass in year t, , to predict cod biomass in year t+1, ). The parameters in this equation are either fixed based on the bioenergetic-allometric framework used or estimated by the model fitting procedure.
The fixed parameters are T, the mass-specific respiration rate for the stock, and Jmax, the maximum mass-specific ingestion rate for the stock. Both rates are derived from allometric equations (Yodzis and Innes, 1992; Koen-Alonso and Yodzis, 2005; Buren et al., 2014b) and assuming an average individual cod body mass of 1 kg in NL and 1.23 kg in BS, derived from data (Buren et al., 2014b; ICES, 2019). The resulting values of T and Jmax were 2.30 and 8.9 for NL, and 2.18 and 8.44 for BS respectively. The estimated parameters are e, a, cpr, and m, which denote the fraction of the ingested energy/biomass available at the metabolizable level (“assimilation coefficient”), the functional response coefficient (“attack rate”), alternative prey biomass (i.e., the “capelin prey replacement”), and the density-dependent mortality coefficient, respectively, as well as the initial cod biomass at the beginning of the time series (B0), which is an initialization parameter, and the standard deviation of the process error (S).
Some key assumptions embedded in the model structure are a type 3 functional response for cod, an always available and constant alternative food source for cod, and a quadratic density-dependent natural mortality. While these are important assumptions, they are in line with what we know about cod, and high trophic level predators more generally (e.g., Smout and Lindstrøm, 2007; Kempf et al., 2008; Buren et al., 2014b). Capelin is a key prey for cod, but is certainly not the only cod prey, and type 3 is therefore a fairly common phenomenological emergent form for functional responses under a diverse range of ecological mechanisms (e.g., prey switching, prey refuges; Koen-Alonso, 2007). Quadratic density-dependent mortality is a standard representation for density-dependent mortality and consistent with similar modeling exercises (Koen-Alonso and Yodzis, 2005; Buren et al., 2014b).
The bioenergetic-allometric modeling approach used here has been previously applied to the study of the main drivers of NL cod (Buren et al., 2014b). While this analysis builds on this prior work, the models are different. In contrast to Buren et al. (2014b), the model used here incorporates alternative prey, and it is implemented as a discrete model formulation (instead of using differential equations) assuming a different error structure (process error in this analysis vs. observation error in the previous study).
Model Fitting
The model was implemented assuming a multiplicative lognormal process error as mentioned above (i.e., additive Gaussian residuals in log scale), and was fitted to data using a maximum likelihood approach. The model was coded using R (R Core Team, 2017) and TMB (Kristensen et al., 2016), and the minimization of the negative loglikelihood was done using the nlminb function within R.
Considering a process error only formulation effectively creates a more restricted parameter space during the fitting procedure, which markedly improves convergence. The associated cost of this modeling choice is the assumption that there is no observation error in cod biomass, which is not correct. While an in-depth examination of model error structure and assumptions is beyond this study, a quick examination of the operational implications of different error structures can help understand the choice made here. Assuming process error only implies that cod biomass is measured without error, and that the differences between predicted and observed cod biomasses for a given year fully reflect real changes driven by factors not included in the model. On the other hand, assuming observation error only implies that the differences between predicted and observed cod biomasses are purely driven by problems in our way of measuring cod biomass, while effectively assuming that the model captures all relevant factors that drive the underlying cod dynamics. A state-space approach is the most realistic one, assuming that both types of errors occur, but splitting the variance between the two types of error requires highly informative and contrasting data. Without sufficiently contrasting data achieving convergence and/or reliable parameter estimates within a state-space framework can be problematic (e.g., Auger-Méthé et al., 2016), and preliminary explorations using a state-space approach to this analysis showed convergence problems (i.e., our data is not informative enough to reliably split the process and observation variances within this model architecture without imposing additional constrains on the magnitude of the variances).
The prior study on NL cod using this modeling approach but considering observation error only estimated that the catchability coefficient for total biomass was no different than 1 (Buren et al., 2014b), indicating that scientific surveys typically sample very well medium to large size fish, which are the ones that mostly define the total biomass index used as response variable in the analysis. This indicates that the scaling associated with the observation process (i.e., catchability) does not appear to be a substantial issue for the total biomass estimates used here, and suggests that assuming total biomass survey estimates as reasonable proxies for total stock biomass does not present major shortcomings for this analysis. Also, given the simple structure of the model, it is reasonable to expect that some other factors not included in the model (e.g., temperature, ocean climate) can also influence cod dynamics. Therefore, using a process error only structure would allow considering these other effects on cod, at least in terms of capturing their influence on the variability of total cod biomass. Given all these considerations, assuming process error only emerges as a sensible and practical choice for this analysis. The adequacy of the model fits was evaluated using standard procedures like the coefficient of determination (r2), and the examination of the standardized residuals. In addition, the consistency of the model predictions was examined through a retrospective pattern analysis (Mohn, 1999; Hurtado-Ferro et al., 2015), comparing the model fit obtained for the full times series, with those obtained by fitting the model to subsets of the full dataset obtained by sequentially removing the data for the terminal year, 1 year at a time. The subsets considered for this analysis removed (“peeled off”) the last 1–5 years of data. Mohn’s rho statistic for predicted cod biomass, calculated as Hurtado-Ferro et al. (2015), was the metric used for this analysis, and the rules of thumb for this statistic developed by Hurtado-Ferro et al. (2015) were used to gauge the consistency/stability of model predictions. These rules of thumb, developed from age-structure model simulations, indicate that, for long live species like cod, Mohn’s rho values outside the −0.15 to 0.2 range are likely indicative of retrospective patterns in the model (i.e., instability/inconsistency in model prediction in the terminal year).
Comparisons Between Ecosystems
The evaluation of similarities and differences between NL and BS cod was done in an iterative way. The first step involved fitting independent models to each cod stock and evaluating the ability of the model to describe the cod dynamics, while comparing the estimated parameter values. If the common model structure can reasonably describe both NL and BS cod stock trajectories, the basic idea that both stocks are effectively driven by availability of key prey (i.e., capelin) and fishing would be supported. A simple comparison of the estimated parameters also provides an initial insight on how similar or different the biology of these stocks may be; some estimated parameters like the assimilation coefficient (e), and the attack rate (a) would be expected to be more reflective of the cod biology and behavior (i.e., more intrinsic to the stock), while others like the capelin prey replacement (cpr) (i.e., availability of alternative prey) and the density-dependent mortality coefficient (m) would be expected to be more influenced by ecological factors associated to the ecosystem where the stocks are embedded.
Considering this nominal distinction between parameters intrinsic to the stock, and parameters more associated to ecosystem conditions, the second step was simply to run these models with some parameters exchanged between them. For example, running the NL model using the T, Jmax, e, and a estimated for BS cod would be a modeling proxy for transplanting BS cod into the NL ecosystem and seeing how that stock would have fared under NL conditions (more accurately, it reflects transplanting the biology and behavioral characteristics of BS cod). Similarly, running the BS model using these parameters as estimated from the NL case would approximate how NL cod would have responded to BS ecosystem conditions.
Finally, a more formal comparison was implemented by integrating the equations for each stock into a single model architecture and fitting both models together and simultaneously, and where the function being minimized in the model fitting procedure was the sum of the negative loglikelihood from each of the originally independent models. When this integrated model is fitted to data assuming fully independent stocks (i.e., no common parameter values between stocks), the results are, as it should be, identical to those obtained from the independent model fits. However, this integrated architecture permits estimating common parameters for both stocks, which allows testing hypothesis of similar parameter values between stocks by using likelihood ratio tests. More specifically, two hypotheses were compared this way; the first one was that e, a, and m were common to both stocks, which implies that basic biological intrinsic parameters and the background density-dependent natural mortality were similar between ecosystems, and the second one where only e, and a were assumed common between stocks, implying that the basic biological and behavioral characteristics of the two stocks were similar after accounting for differences in fish body size.
Data
The data used to fit these models were total cod biomass, capelin biomass, and cod fisheries catches (Figure 2). Data series are displayed in log scale to facilitate visualization of the dynamics at both high and low biomass levels. In the NL ecosystem cod biomass was estimated as the total standard biomass index for random stratified survey designs calculated from Fisheries and Oceans Canada (DFO) fall bottom trawl surveys in the Northwest Atlantic Fisheries Organization (NAFO) divisions 2J3KL for the period 1981–2017, and where the data for the 1981–1994 period were adjusted to correct for a change in gear in the research survey (e.g., Buren et al., 2014b). Capelin availability was obtained from the DFO spring capelin acoustic survey in NAFO Div. 3L (Buren et al., 2014b, 2019), and where the gaps (1983–1984, 1993–1995, 1997–1998, 2006, and 2016) in this time series were filled by simple linear interpolation (see Buren et al., 2014b), or assumed similar to a nearby year (1981 assumed similar to 1982). Cod catches were obtained from DFO and NAFO catch statistics.
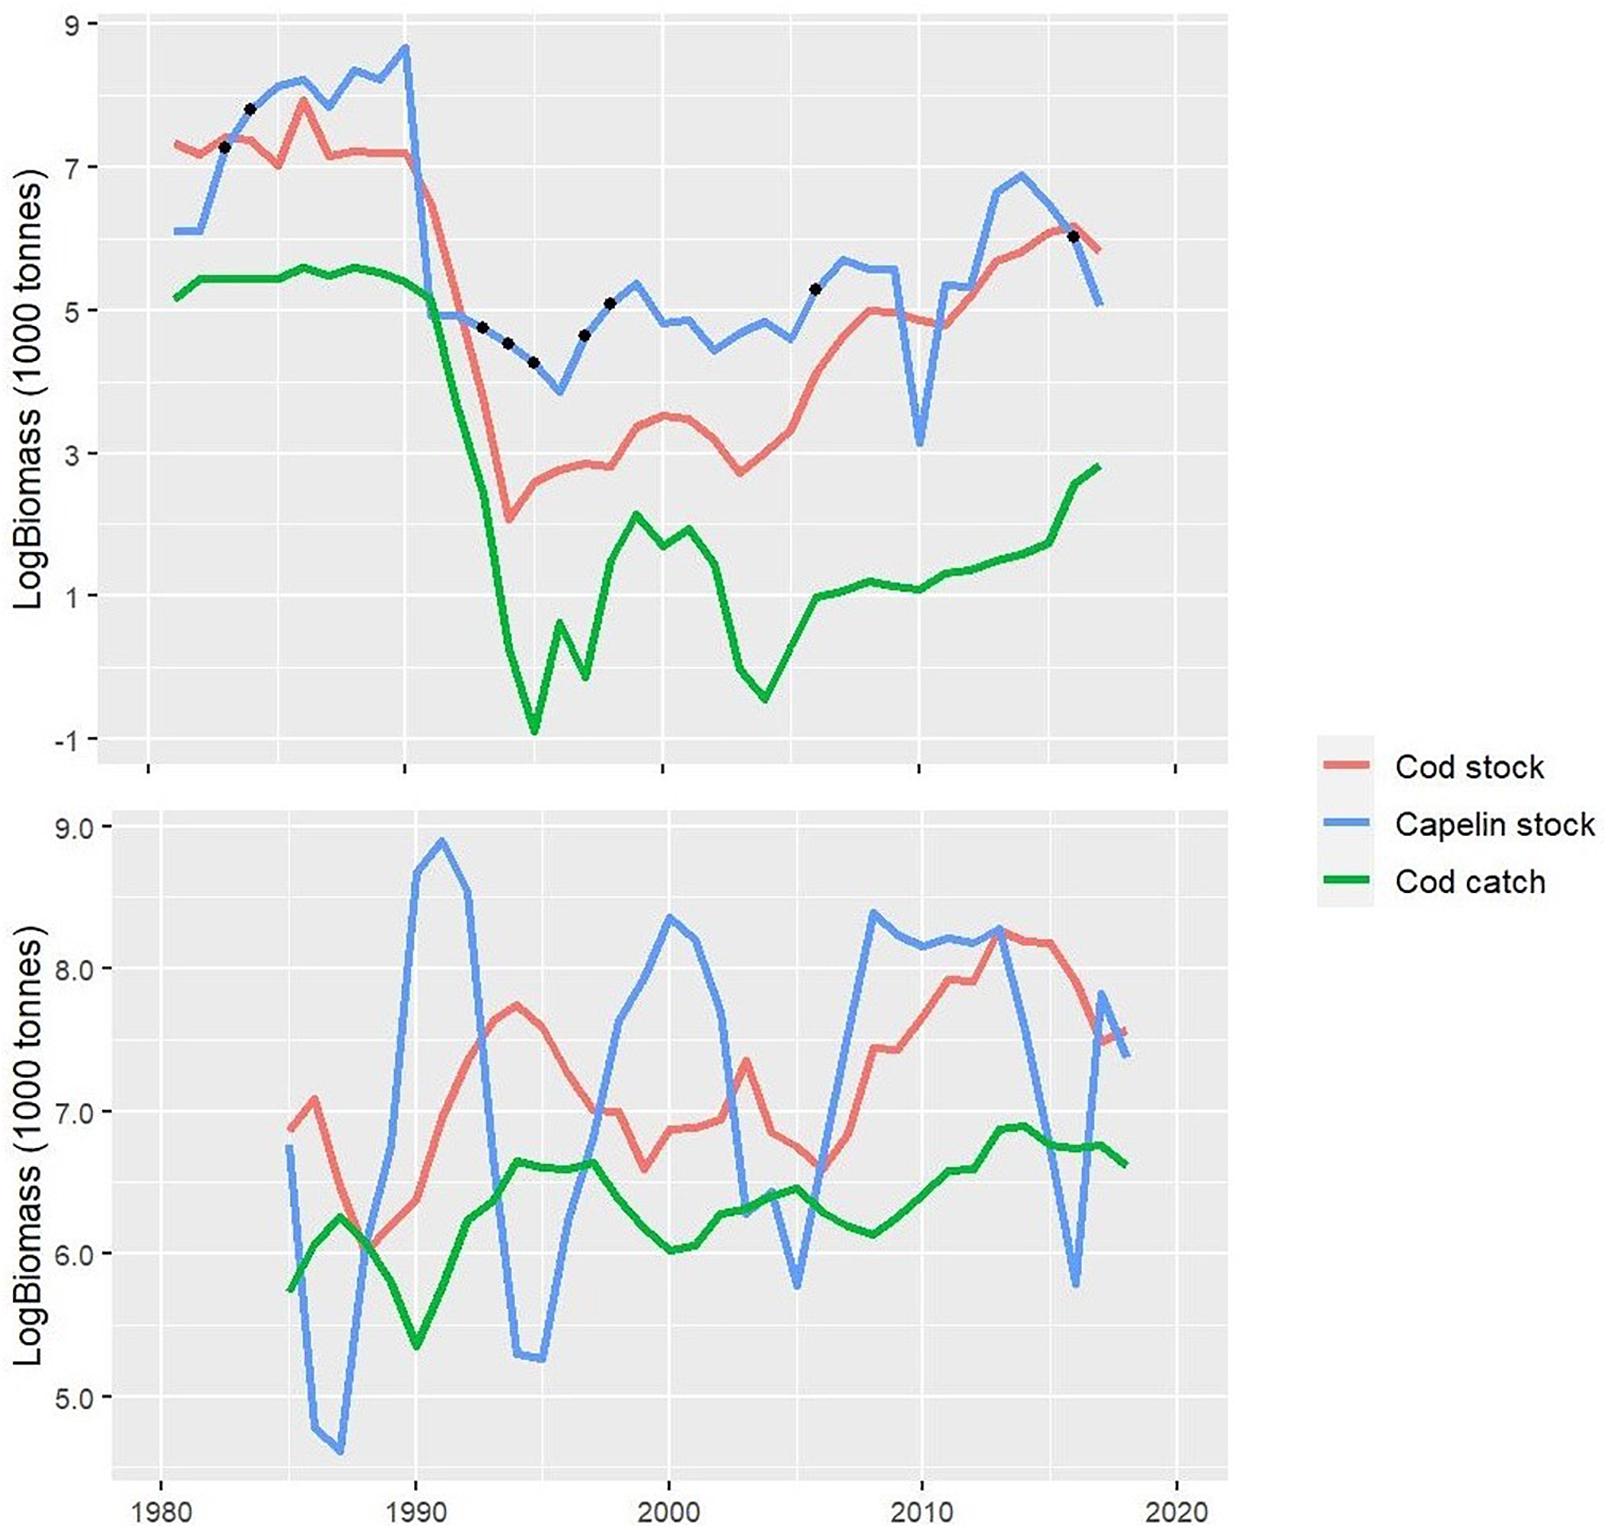
Figure 2. Input time series data (log scale) for cod, capelin, and cod catches used for the Newfoundland-Labrador shelves (NL) (top panel) and Barents Sea (BS) (bottom panel) cod models. The black dots in the capelin time series in NL represent the interpolated years (see text for details).
In the BS ecosystem cod biomass was estimated using data from the Norwegian acoustic survey of North East Arctic cod on the spawning grounds off Lofoten (Korsbrekke, 1997) and the joint Norwegian-Russian winter bottom trawl survey (e.g., Fall et al., 2020), which has been conducted annually since 1982 and 1981, respectively. Because the Lofoten survey cover the mature stock and the winter bottom trawl survey in the Barents Sea cover the immature stock, the biomass estimates (swept area and acoustic) derived from these surveys were added in order to get an estimate of the entire cod stock. The capelin biomass time series was obtained from the stock assessment report (ICES, 2019).
The timing/season of the different surveys and fisheries were considered when defining the proper time index for the different inputs and outputs in the modeling exercise. For example, the NL cod survey takes place at the end of the calendar year, so it more closely reflects the cod biomass state at the beginning of the following year (i.e., the fishing within that calendar year and the impact of capelin in that calendar year have already impacted the cod stock at the time of the survey), while this is not the case in BS. These technical aspects were considered when setting up the models for each ecosystem.
Results
Model Fit
The results indicate good model fits for the NL and BS cod stocks (Figure 3). Both models explain more than 80% of the variance in their respective datasets ( and ), and show reasonable distributions of the residuals (Figure 4). Most residuals are contained within the one standard deviation envelope; the only ones departing beyond that are the negative residuals for NL cod in 1992–1994, which correspond to the aftermath of the stock collapse; even these residuals are contained within two standard deviations. Both models show high stability/consistency in their predictions (Supplementary Appendix), with Mohn’s rho values (NL: 0.025, BS: −0.014) well within the range associated with no retrospective pattern problems (−0.15 to 0.2), indicating that there is stability/consistency in the terminal year predictions.
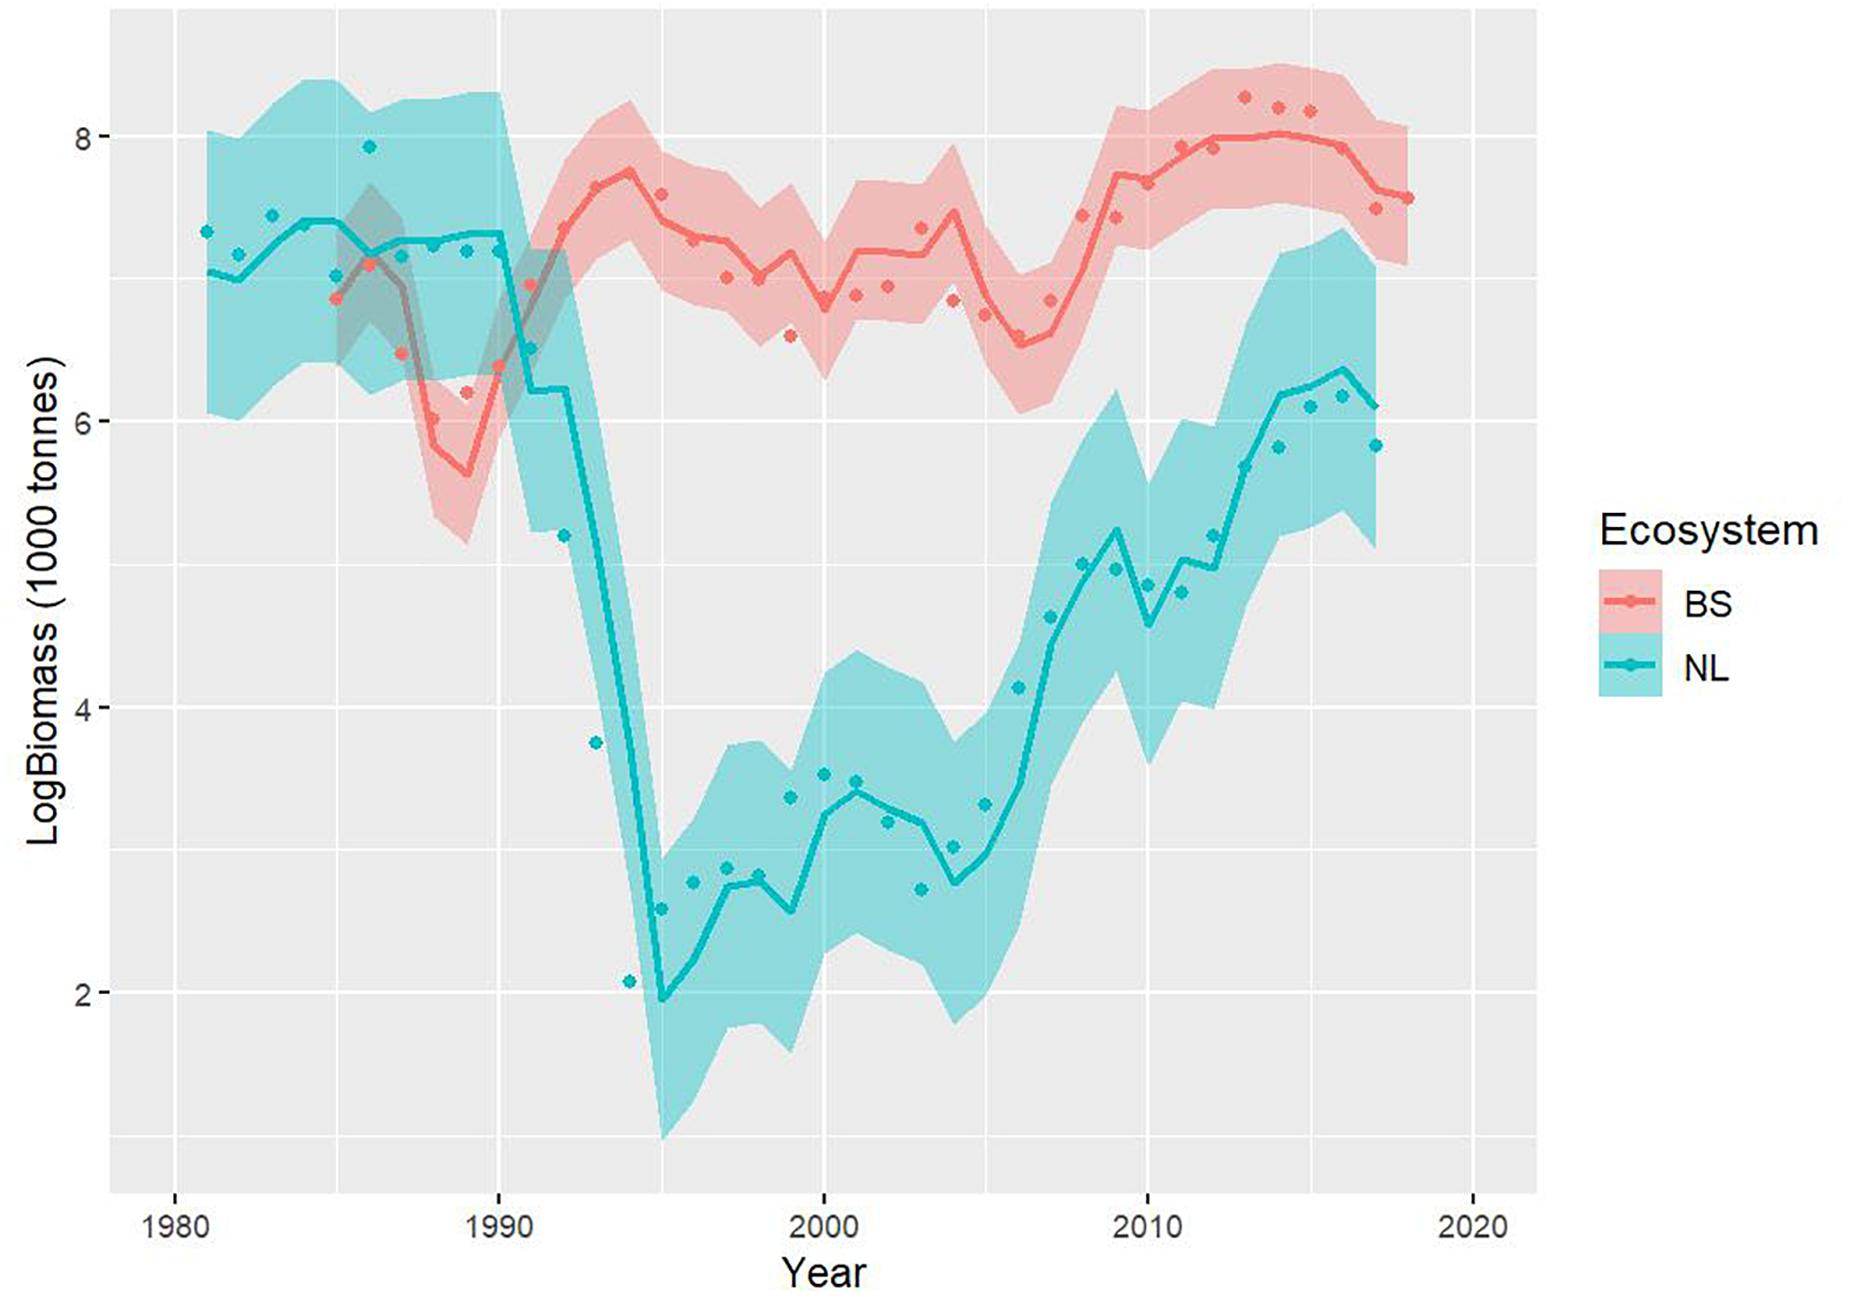
Figure 3. Model fits (log scale) for the Newfoundland-Labrador shelves (NL) (blue line) and Barents Sea (BS) (red line) cod stocks and 95% confidence intervals (shaded areas). These fits correspond to fully independent stocks (i.e., no common parameters between stocks).
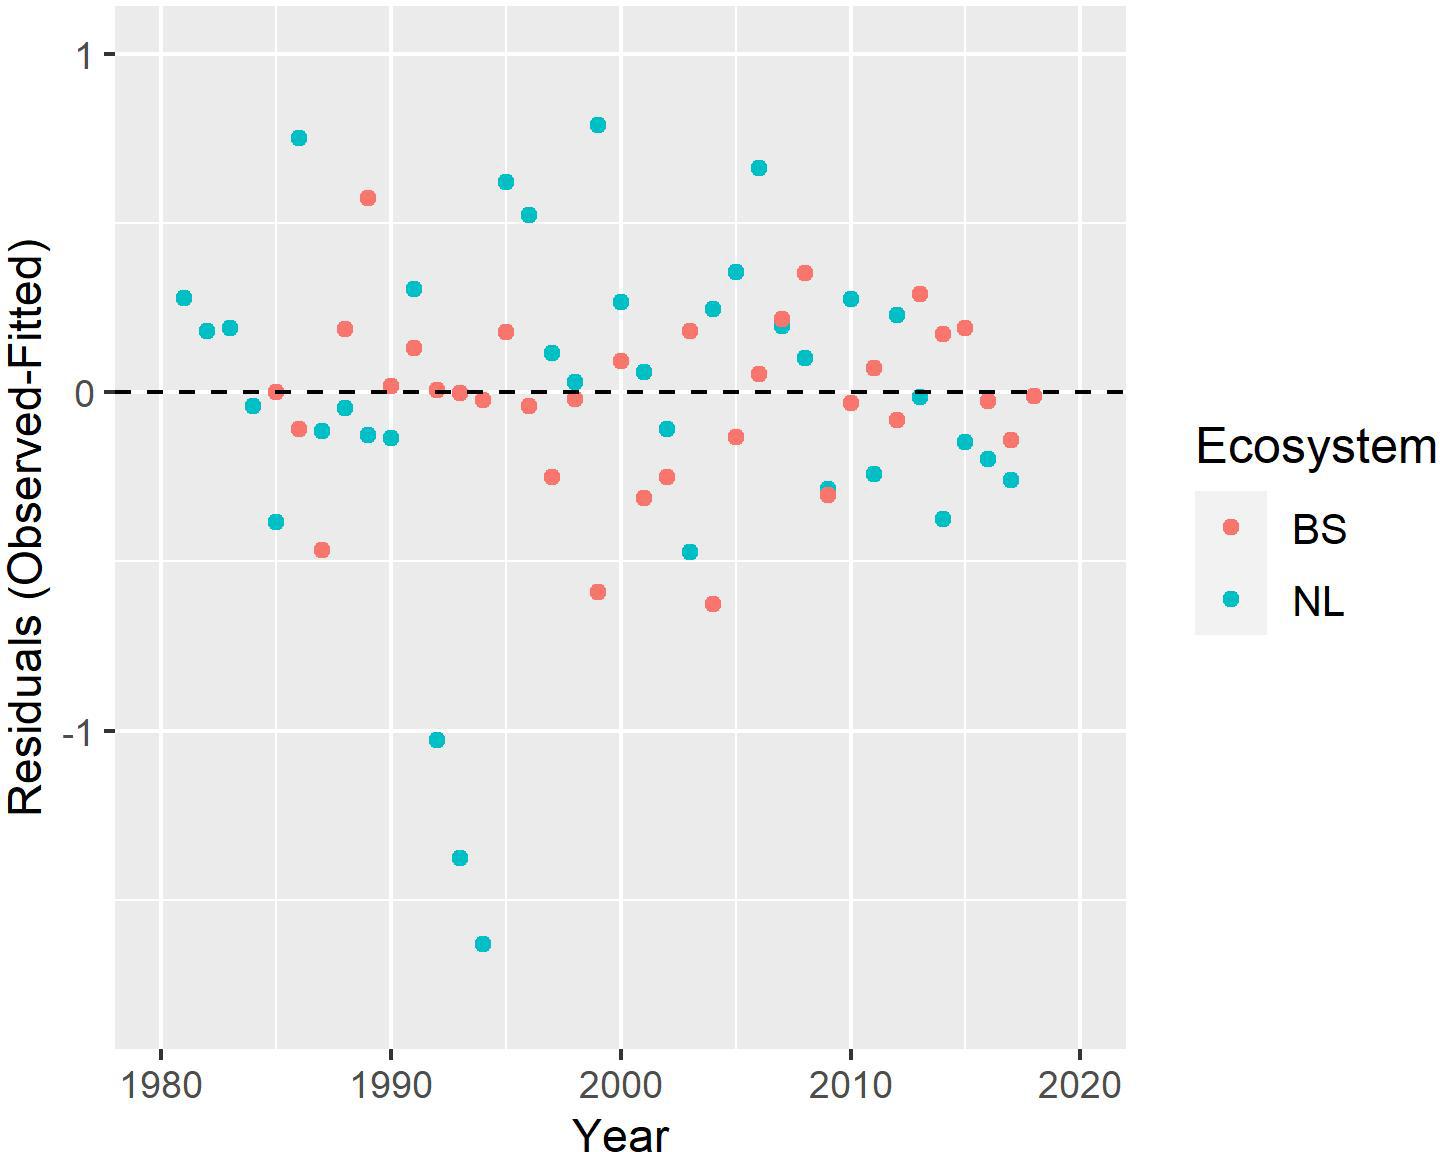
Figure 4. Standardized residuals for the Newfoundland-Labrador shelves (NL) (blue dots) and Barents Sea (BS) (red dots) cod models assuming fully independent stocks (i.e., no common parameters between stocks).
While the underlying structure is simple and uses basic representations of core biological/ecological rates (i.e., respiration, food consumption, mortality), the model is still capable of adequately describing two very contrasting stock trajectories, indicating that the key processes and drivers that define cod dynamics are reasonably captured by the model structure and consistent between the NL and BS ecosystems. Several of the parameters related to intrinsic factors of the stocks (i.e., species biology and behavior), like the assimilation coefficient, and attack rate, have very similar estimated values in both models, while those parameters more related to extrinsic factors (mortality coefficient, process error) show more clear differences between models (Table 1). This indicates that both stocks respond to the drivers considered (capelin availability and fishing) in very similar ways, and the differences in cod trajectory between NL and BS are more associated to external factors (i.e., ecosystem conditions, fishing) than intrinsic biological differences between the stocks.
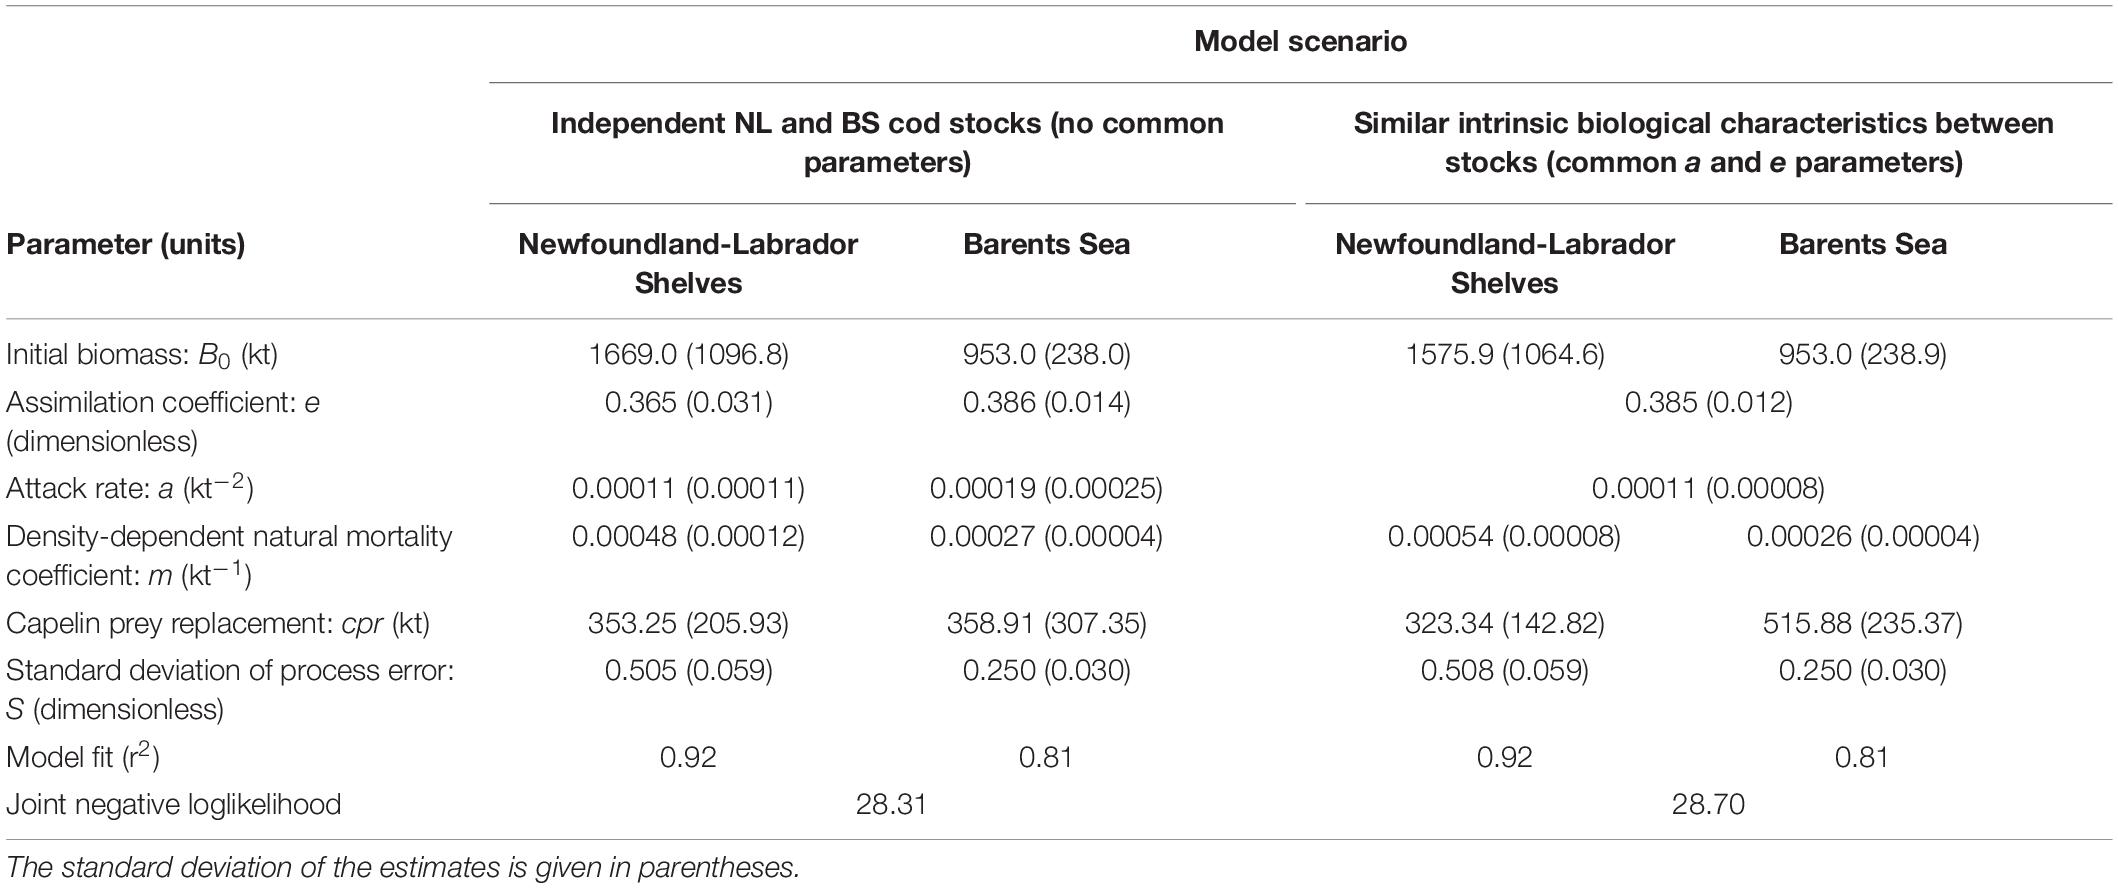
Table 1. Estimated parameters and goodness of fit for the general integrated model, assuming fully independent NL and BS cod stocks (no common parameters between stocks), and the restricted model assuming similar intrinsic biological traits between stocks (common a and e parameters).
Comparisons Between Ecosystems
The similarity in the estimated values for parameters more associated with intrinsic factors (i.e., cod biology and behavior), prompts the question of how these stocks may have responded if exposed to each other’s ecological contexts. We explored this thought experiment by switching some parameters between models and observing how different the predicted trajectories were. More specifically, switching the parameter values for T, Jmax, e, and a between models allows characterizing the response to drivers in one ecosystem with the key biological/behavioral traits of the cod stock from the other ecosystem, while keeping the original estimates for the remaining parameters (and data) represents the ecosystem context in which the “switched stock behavior” is being embedded. This exploration approximates the thought experiment of putting NL cod in the BS ecosystem, and vice versa.
The results of this exploration indicate that the BS cod would have been expected to collapse if exposed to the conditions in the NL ecosystem, while the NL cod would have been expected to rebuild in the more favorable conditions of the BS ecosystem (Figure 5). Still, this simple exploration also suggests that the larger sized cod from BS would have sustained a larger biomass in the pre-collapse period and recovered better than NL cod did in the NL ecosystem, while NL cod showed more severe declines and weaker increases in the BS ecosystem than BS cod did in its own system (Figure 5). As thought provoking and informative as this exploration can be, it remains illustrative. A more statistically sound approach is needed to further investigate these observations.
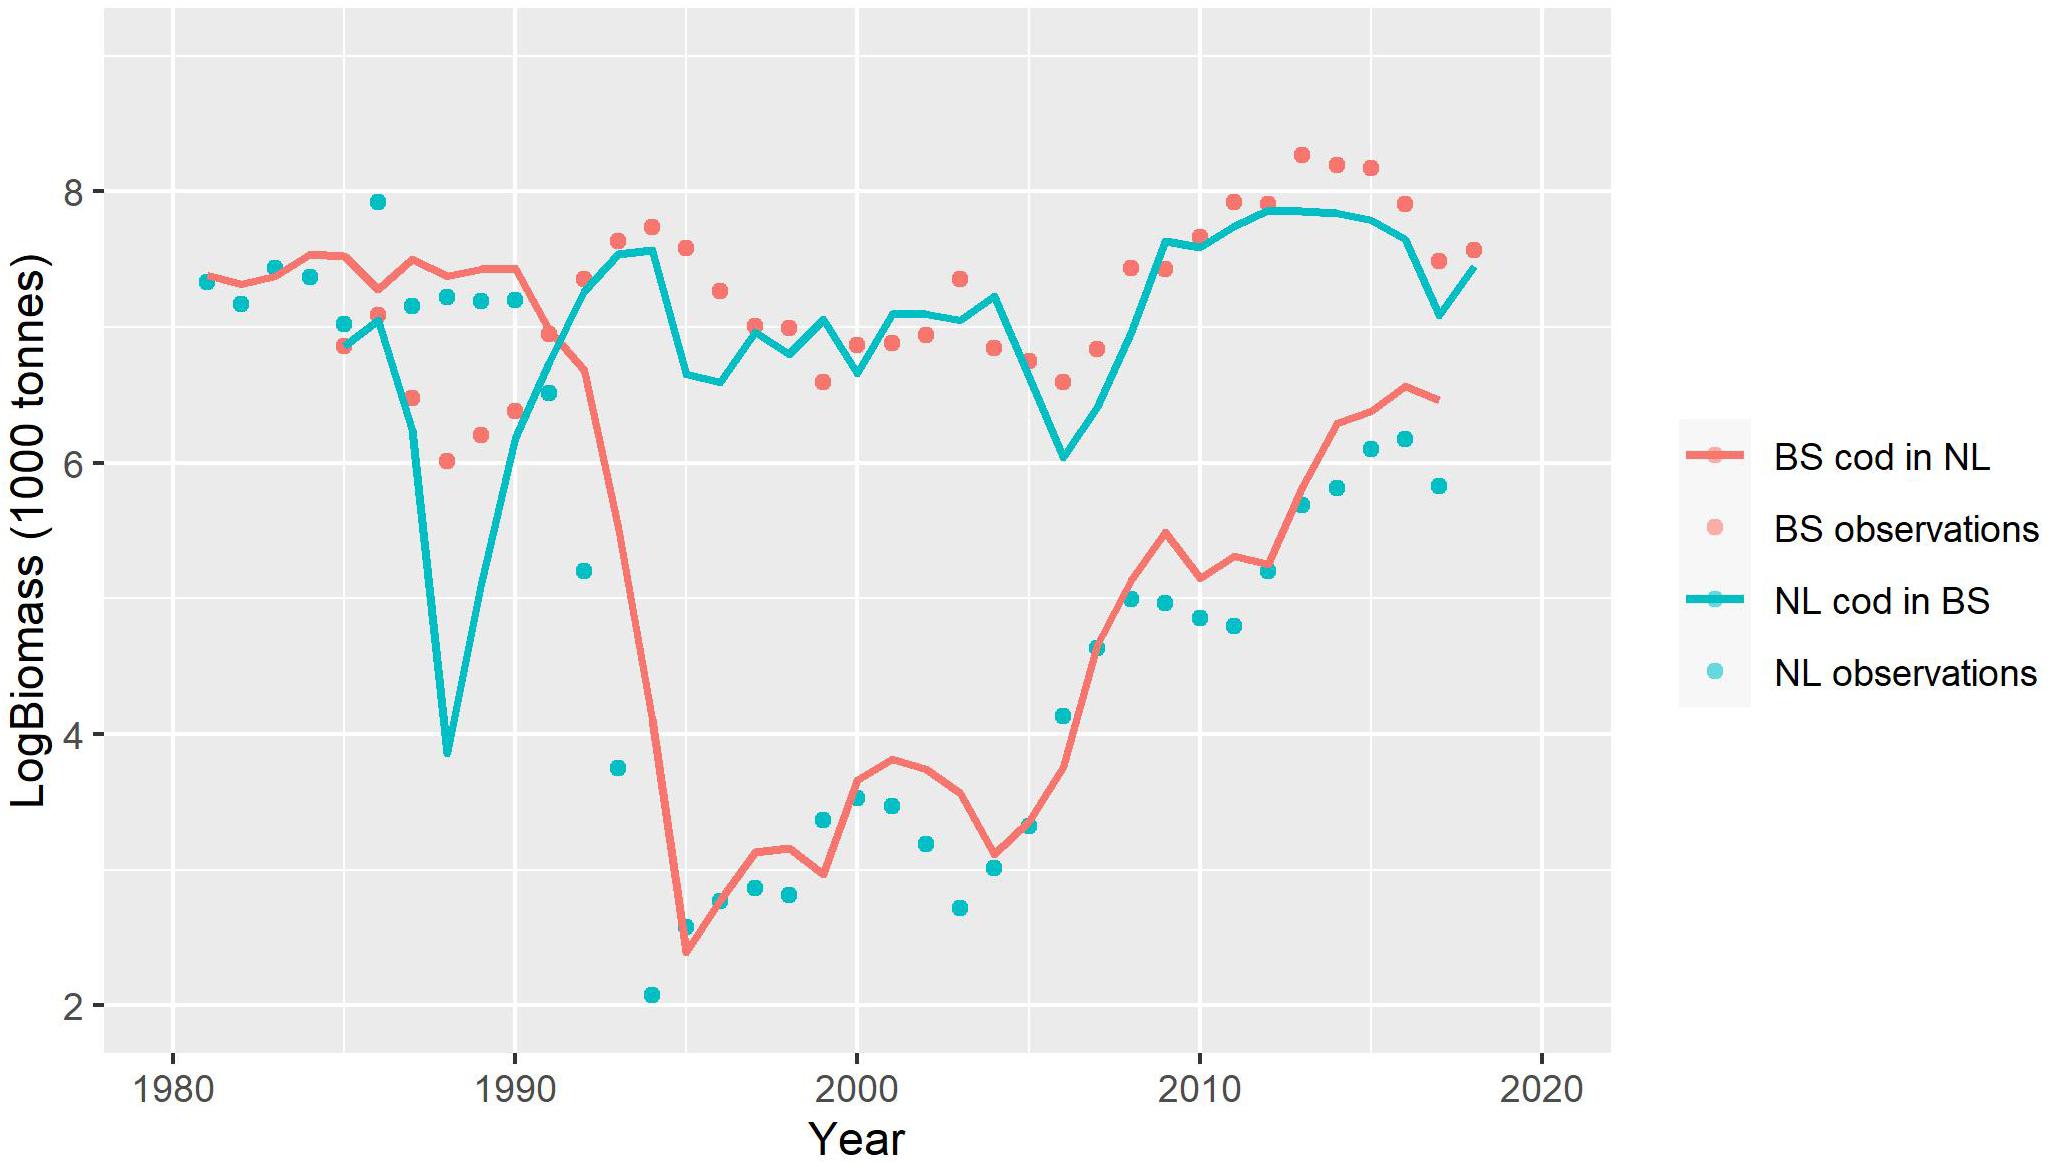
Figure 5. Exploration of the thought experiment of transferring NL cod (blue line) into the Barents Sea (BS) ecosystem and BS cod (red line) into the Newfoundland-Labrador shelves (NL) ecosystem by switching intrinsic parameters (T, Jmax, e, and a) of the corresponding models between areas (see text for details).
A formal evaluation of the similarities and differences in parameter values between stocks was done using likelihood ratio tests based on an integrated implementation of the NL and BS cod models. This architecture allows estimating parameters simultaneously for both stocks and implementing restrictions in model parameters (i.e., estimating common/shared parameter values for both stocks). Within this approach, the estimation of parameters assuming fully independent stocks correspond to a general model, while estimations assuming common parameter values between stocks correspond to a restricted version of the general model, and hence, the adequacy of likelihood ratio tests for this analysis.
Two hypotheses were evaluated using likelihood ratio tests. The first one considered that intrinsic parameters (e and a) and a key extrinsic parameter (m) were common to both stocks; the second one corresponded to only the intrinsic parameters being similar between stocks. The results show that the first hypothesis (common e, a and m) can be rejected, but not the second one (common e, and a) (Table 2). The “common e and a” model explained as much as the independent stocks model ( and ), and did not show any indication of potential retrospective pattern problems (Mohn’s rho values of 0.013 for NL and −0.013 for BS, see Supplementary Figure A1). This indicates that there is no support in the data for assuming differences in the intrinsic parameters e and a between stocks, suggesting a common scaling of the corresponding vital rates with body size, and no significant improvement in model fit from assuming fully independent stocks (Figures 3, 6). These results imply that the basic biology and behavior of NL and BS cod stocks, at least as summarized by these model parameters, is similar, while the differences in stock trajectory are driven by the ecosystem context in which these stocks are embedded.
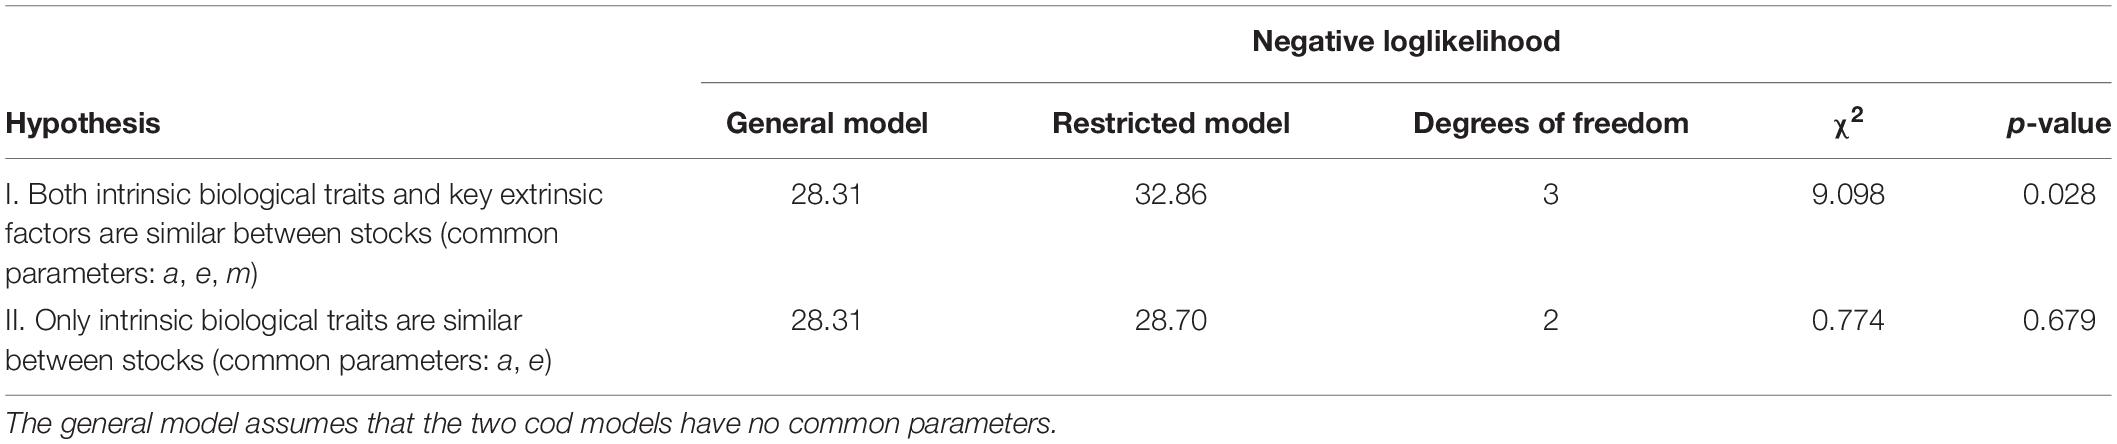
Table 2. Test of hypothesis for common parameters between the NL and BS cod models using likelihood ratio tests.
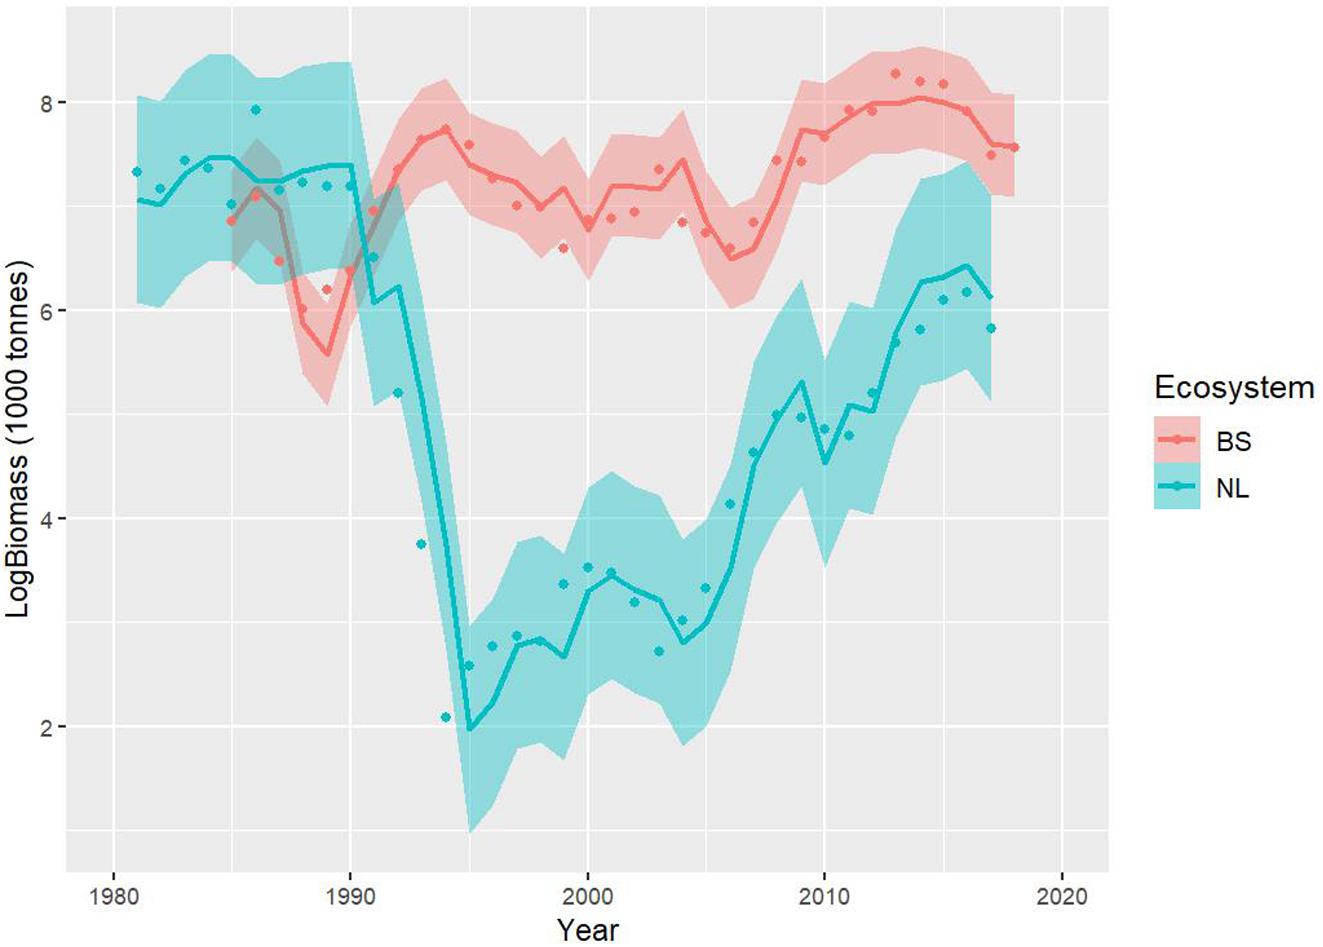
Figure 6. Model fits (log scale) for the Newfoundland-Labrador shelves (NL) (blue line) and Barents Sea (BS) (red line) cod stocks and 95% confidence intervals (shaded areas). These fits correspond to the model assuming a and e as common parameters to both stocks.
Discussion
Understanding how ecosystems respond to change, and the underlying mechanisms behind these responses, are not just fundamental questions in ecology, but also key practical questions in our pursuit for more sustainable ways of managing renewable natural resources (e.g., Fogarty, 2014; Link, 2017; Koen-Alonso et al., 2019). Within fisheries, ecosystem approaches are slowly but surely complementing and broadening the scope of traditional single species management frameworks (Fogarty, 2014; Link, 2017; Koen-Alonso et al., 2019). At the core of these transitions is the recognition that, beyond the direct effects of fishing, changes in ecosystem conditions play a major role in defining stock responses and trajectories (e.g., Cushing, 1982; Glantz, 1992; Koen-Alonso et al., 2010; Fossheim et al., 2015; Dempsey et al., 2017; Pedersen et al., 2017; Koen-Alonso and Cuff, 2018).
Given the complexity of natural ecosystems, elucidating what are the main drivers of ecosystem change, and understanding the mechanisms behind these changes, are often approached using comparative analyses (e.g., Cole et al., 1991; Megrey et al., 2009; Murawski et al., 2010; Bundy et al., 2012; Gaichas et al., 2012; Holsman et al., 2012). These studies typically involve using similar methods in different ecosystems, different analytical and/or modeling approaches applied to a single ecosystem, or some combination of the two (Murawski et al., 2010; Mantzouni et al., 2010). The basic premise behind these comparative approaches is simple; those conclusions that remain valid across ecosystems and/or methodological approaches are more likely to be robust and reliable. It separates the ecological chaff from the wheat.
While studies of NL and BS cod dynamics typically take demographic approaches (i.e., age structured population models) (e.g., Shelton and Lilly, 2000; Cadigan, 2015; Rose and Walters, 2019; ICES, 2019, 2020), our study relies upon a bioenergetic-allometric framework (Yodzis and Innes, 1992). This theoretical approach is one of the pillars of the metabolic theory of ecology, which has proven useful in describing general ecological patterns, ecosystem organization, and dynamics (e.g., Gillooly et al., 2001; Brown et al., 2004; Brose et al., 2008; Brose, 2010; Schramski et al., 2015). A fundamental feature of this approach is the basic concept that metabolic rates scale allometrically with individual body mass (Peters, 1983; Yodzis and Innes, 1992; Gillooly et al., 2001), which helps simplifying model parameterization, but more fundamentally focuses on physiological constraints expected to be shared across species and/or levels of biological and ecological organization (Yodzis and Innes, 1992; Brown et al., 2004; Vasseur and McCann, 2005; Brose, 2010; Schramski et al., 2015).
Our results provide further support of the utility of this general theoretical approach to ecological functioning and organization. The commonality found in key model parameters associated with intrinsic traits of the stocks indicates that NL and BS cod are more similar than different in their basic functional biology once accounting for variation in body size (i.e., reflecting the differences in size structure between stocks), while their differences appear more associated to factors related to the specific ecosystem conditions experienced by each stock. Furthermore, these models explain a large fraction of the variance in cod biomass (Table 1), suggesting that the basic relationships and external factors considered here are sufficient to characterize the key processes that regulate the dynamics of these stocks.
Capelin availability and fishing are common and important drivers of cod dynamics in NL and BS (e.g., Rose and O’Driscoll, 2002; Lilly et al., 2013; Buren et al., 2014b; Kjesbu et al., 2014; Mullowney and Rose, 2014). While excessive fishing has been an historical problem for both stocks (Lilly et al., 2013; Cadigan, 2015), important declines in BS cod and the collapse of the NL stock have occurred at times of capelin collapses, while stock build-ups often follow from improvements in capelin (Figure 2).
After its collapse in the early 1990s, the NL cod stock showed consistent signals of rebuilding only after modest increases in capelin started to be observed in the mid-2000s (Buren et al., 2019). In the intervening years, the forage species pool in the NL ecosystem was dominated by northern shrimp, which constituted the main prey in cod diets (Dawe et al., 2012; Mullowney and Rose, 2014). In terms of nutritional quality, northern shrimp has lower energy density than capelin, and thus, a shrimp dominated diet is expected to impose additional energetic constraints to the scope for growth of the NL cod stock (Lawson et al., 1998; Rose and O’Driscoll, 2002; Sherwood et al., 2007; Dawe et al., 2012; Buren et al., 2014b; Mullowney and Rose, 2014). Another way of looking at this question is by considering the ratio of capelin availability to total food availability derived from the model results for each ecosystem, crt = Ct/(Ct + cpr), as a coarse approximation to the proportion or energy coming from capelin vs. other sources in year t. While the distribution of these capelin ratios indicate that both stocks show an important reliance on capelin as prey, they also indicate that NL cod, which is the stock that has yet to rebuild, has derived a lower fraction of energy from capelin than BS cod has over the time periods considered in this study (Figure 7). These differences in capelin ratios are also generally consistent with the proportions of capelin observed in the diet compositions of cod in these ecosystems (e.g., Dawe et al., 2012; ICES, 2018).
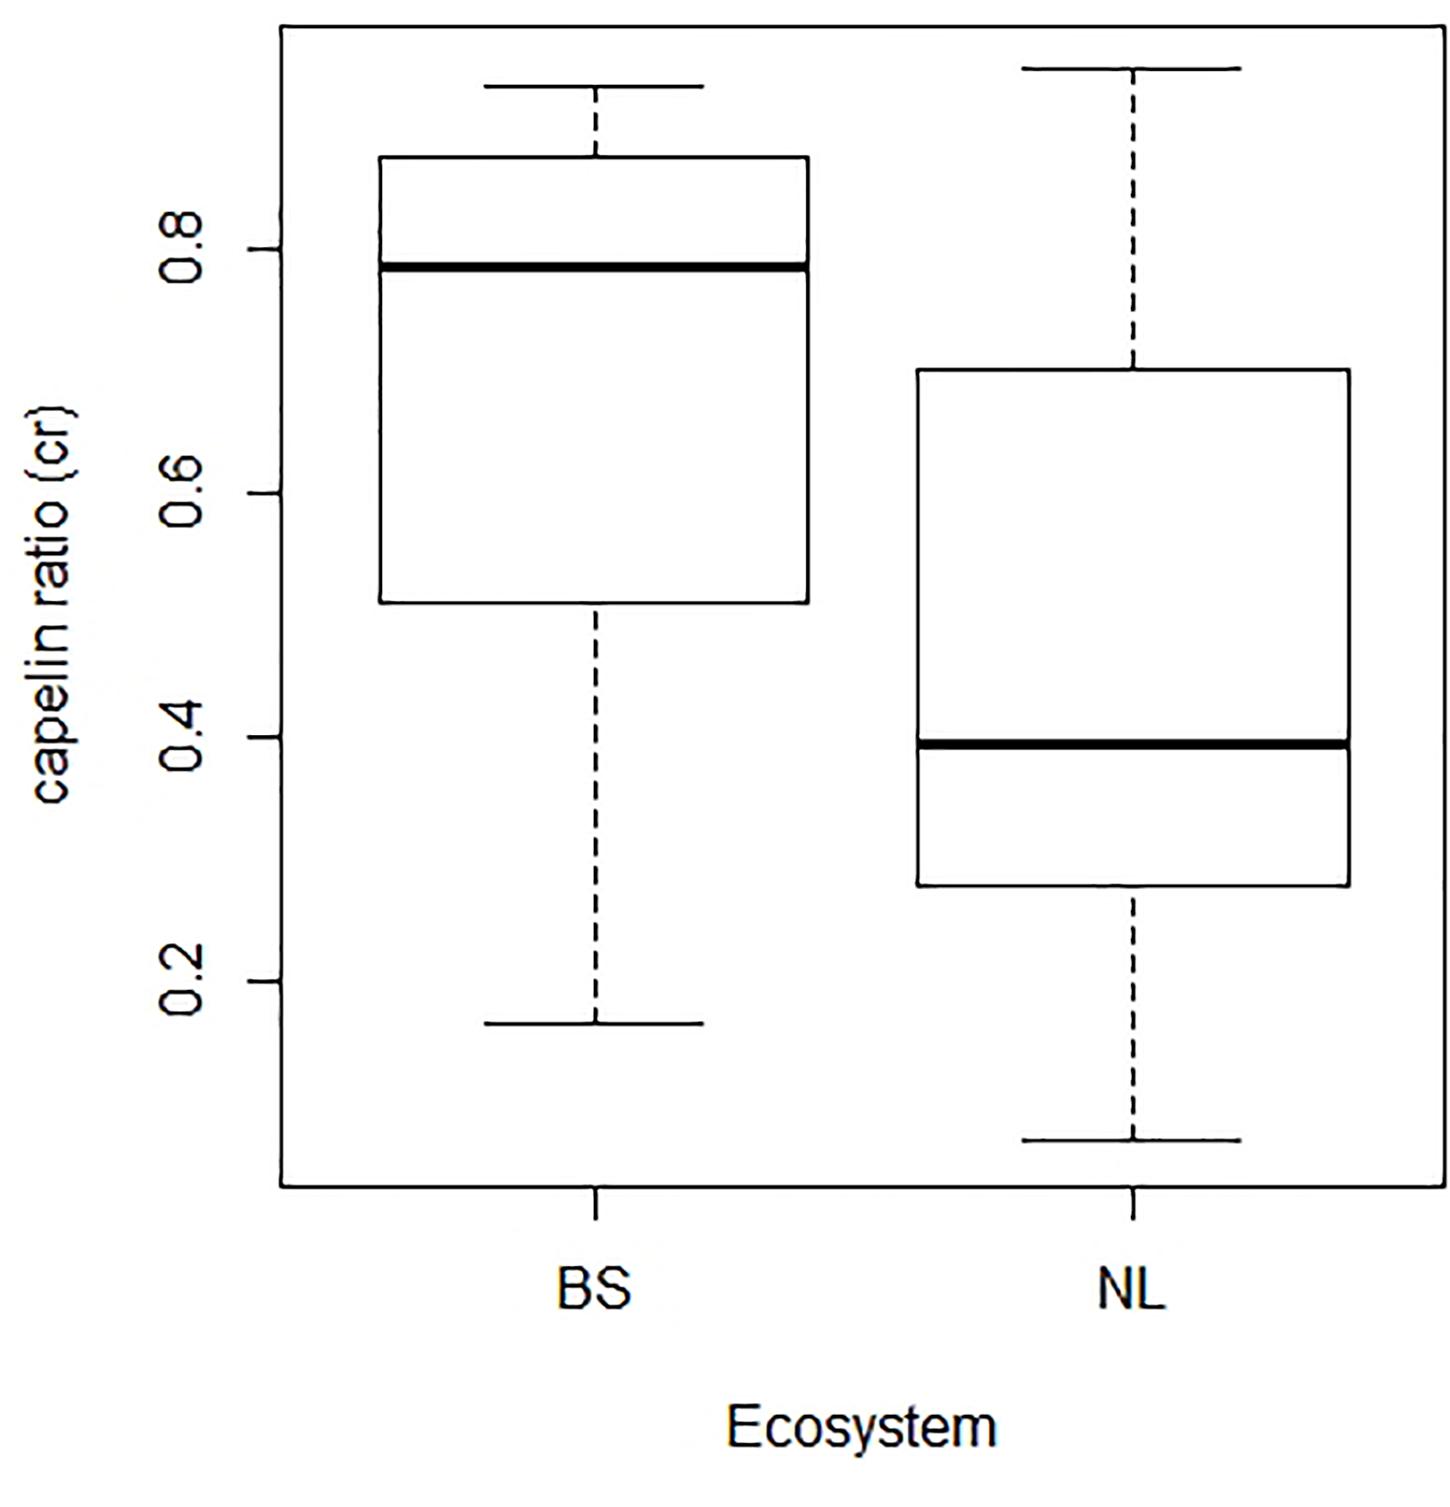
Figure 7. Box plots of the annual capelin ratios (i.e., the fraction of capelin in relation to total food availability for cod derived from model results) in the Barents Sea (BS) and Newfoundland-Labrador shelves (NL) ecosystems. These ratios correspond to the model assuming a and e as common parameters to both stocks, and can be interpreted a coarse approximation to the proportion of energy that cod derives from capelin in each ecosystem.
While BS cod showed an important decline in the 1980s which was associated to both fishing and a capelin collapse (1985–1989), the next three capelin collapses observed in this ecosystem (1993–1997, 2003–2007, and 2014–2016) did not trigger comparable cod declines (Gjøsæter et al., 2009; ICES, 2020). The likely reason behind this difference, in addition to lower fishing mortalities, especially during the last two capelin collapses (the level of cod fishing mortality in the mid-late 1990s was comparable to the one in the 1970s and early 1980s) (Lilly et al., 2013), is that during the most recent capelin collapses, suitable prey replacements for capelin were available in BS; herring, polar cod (Boreogadus saida), and juvenile fishes (0-group) remained abundant in these periods, while if we consider herring and polar cod as indicators, this alternative prey pool was also low during the 1980s capelin collapse (Eriksen et al., 2011, 2017; Jelmert et al., 2020).
These differences in availability of alternative prey to capelin appear reflected in two ways in the model results. The BS model has a slightly higher cpr estimate than the NL model (Table 1), suggesting a somewhat higher average biomass of alternative prey in the BS ecosystem than in the NL ecosystem. However, this difference is rather marginal and it also dependents on how comparable the capelin estimates truly are between NL and BS. The capelin estimates used here are both derived from acoustic surveys (Buren et al., 2019; ICES, 2019), and reliably reflect the relative changes in capelin level, but they are not intended to be precise estimates of absolute biomass. In our work here, these estimates are assumed to be good indicators of the order of magnitude of the capelin biomass level, and in this sense, comparable enough between ecosystems for the use given within these models. The fact that estimates of cpr are similar for both ecosystems, but nominally larger for BS, is consistent with this assumption about the capelin indices, and with the expectations of a better alternative prey availability in BS in comparison to NL (e.g., Eriksen et al., 2011, 2017; Buren et al., 2019; Jelmert et al., 2020).
The other result that can also be interpreted as evidence of better foraging conditions in BS is the lower density-dependent natural mortality coefficient estimated for BS cod (Tables 1, 2). If low prey availability is an issue, poor cod condition would be on average more prevalent, and expected to increase the odds of dying by natural causes, chiefly starvation, but also through increased susceptibility to diseases, and predation. This could also affect reproductive performance (e.g., reduced egg quality, quantity, and/or survival). All these factors, in the context of the simple model structure used here, are expected to be reflected in a larger m, and this is what was found for NL cod (Tables 1, 2).
This result is also consistent with available observations. During the collapse, the NL cod showed clear signals of reduced condition, especially in the northern areas (NAFO divisions 2J3K) (Buren et al., 2014b; Morgan et al., 2018), providing compelling evidence that food availability was a likely factor in the stock collapse. Condition signals improved by 2006–2012, a period when the stock was starting to show signals of rebuilding and capelin was showing modest improvement, and while the role of condition (and related mechanisms) in limiting stock growth at present remains a matter of debate (Morgan et al., 2018), there is little question that the stock has experience low productivity since the collapse (Shelton et al., 2006; Sherwood et al., 2007; Fudge and Rose, 2008). On the other hand, despite its considerable stock size, the BS cod has not displayed any sign of starvation in the past decades, in contrast to some of its competitors (e.g., Durant et al., 2014; Bogstad et al., 2015), however, this appears to be changing because the growth of juvenile cod has dropped much in 2020 (Bogstad pers. comm.) suggesting reduced feeding conditions.
The above interpretation of m is consistent with the expectations from differences in the prey field between these ecosystems (i.e., natural mortality mainly driven by bottom-up processes), but the role of predation by marine mammals is a frequent argument put forward to explain high natural mortality and/or lack of recovery in cod stocks (e.g., Hansen and Harding, 2006; Trzcinski et al., 2006; Swain and Benoît, 2015; Swain et al., 2015). On this issue, the evidence on the role of marine mammal predation in controlling cod stocks does not paint a uniform picture. Studies on the likely causes for the lack of recovery of the cod stock in the southern Gulf of St Lawrence, Canada, have found that predation by gray seals (Halichoerus grypus) is the most likely driver (Chouinard et al., 2005; Benoît et al., 2011; Swain and Benoît, 2015), and predation by harp seals can become a factor for cod recovery in the northern Gulf of St. Lawrence under certain environmental conditions (Chassot et al., 2009; Bousquet et al., 2014). On the other hand, an examination of this issue in BS focused on harp seal and minke whale (Balaenoptera acutorostrata) predation concluded that marine mammals were more likely to influence BS cod through competition for food than predation (e.g., Øigård et al., 2013; Bogstad et al., 2015). In the case of NL cod, a direct examination of harp seal predation, capelin availability, and fishing as drivers concluded that in contrast to capelin availability and fishing, seal predation was not a significant driver of the dynamics of NL cod (Buren et al., 2014b). The importance of marine mammal predation in controlling cod dynamics appears to be ecosystem-specific, and likely dependent on the history of the ecosystem and prevailing environmental conditions. In the case of NL and BS cod stocks, predation by marine mammals does not appear to be a major driver, with our results further supporting that prey availability in general, and capelin availability in particular, together with fishing, are the dominant factors in controlling their dynamics.
These results are also relevant in a practical sense. After the collapse of the NL cod stock, a commercial fishing moratorium was established in 1992, which has remained in place since. In practice this has implied that the NL cod fishery has been essentially restricted to a stewardship fishery and a recreational fishery for the past three decades (Lilly et al., 2013; Cadigan, 2015; DFO, 2019, 2020). Notwithstanding this moratorium the NL stock has not recovered, but it has been showing signals of rebuilding since 2006 (Buren et al., 2014b; Cadigan, 2015; DFO, 2019, 2020), and the start of this recovery coincided with a modest improvement in the availability of capelin (Buren et al., 2014a, 2019). In recent years the role of capelin and food availability is becoming a frequent topic of discussion in NL cod stock-assessments (e.g., DFO, 2020), and the current assessment-model for NL cod allows for time-varying natural mortality (Cadigan, 2015), but the model projections used for advice provision are not capelin-informed (DFO, 2019), and the management framework for the stock does not explicitly account for capelin level (or any other explicit ecosystem consideration) as a control lever. Fisheries and Oceans Canada (DFO), the federal department in Canada responsible for fisheries management, is formally committed to the adoption of ecosystem approaches, but implementation on the ground remains patchy and limited. Even though many scientific assessments do include and discuss ecosystem effects (e.g., DFO, 2020), most stock-level decision-making management frameworks to date remain traditional single-species approaches. While work toward implementation of ecosystem approaches in DFO is ongoing, our findings here emphasize the importance for this transition to gain momentum by making evident that management and rebuilding plans for NL cod would benefit from formally incorporating capelin as an explicit factor in these plans.
In contrast, the size of the capelin stock has been part of the decision-making process for the management of the BS cod fishery since 1989–1990, after the Total Allowable Catch (TAC) for BS cod was significantly reduced in response to the collapse of capelin and low availability of other forage species (Lilly et al., 2013). Since then, reference points for BS cod have been set conservatively to accommodate for ecosystem conditions. Both environmental and biological factors have for many years been included in predictions of cod recruitment (ICES, 2020). Cod cannibalism and its inverse relationship with capelin abundance is one important factor affecting cod recruitment (e.g., Yaragina et al., 2009, 2018). More generally, considerations of trophic interactions and their impacts on important stocks like cod, haddock, and capelin, and their incorporation into stock-assessment and/or strategic models, have been in operation in fisheries decision-making frameworks in the BS since the 1990s (Howell and Bogstad, 2010; Bogstad and Filin, 2011).
Conclusion
The NL and BS cod stocks have shown very contrasting trajectories over the past 40 years; the NL cod stock collapsed in the 1990s and has not recovered despite a long lasting commercial fishing moratorium, while the BS cod stock has rapidly recovered after an important decline in the late 1980s and 1990’s, and has increased to record high levels in the 2010s. These differences have been attributed to the impacts of fishing, and to changes in stock productivity linked to ecosystem and environmental conditions.
This analysis supports this general perspective. It shows that simple bioenergic-allometric models, accounting for capelin availability and fisheries catches as drivers, can adequately describe the biomass dynamics of both stocks. Furthermore, this study shows that basic biological and behavioral traits appear similar between the stocks, implying that NL cod would be expected to recover under favorable ecosystem conditions, namely sufficiently large availability of capelin, while BS cod would be expected to decline if low availability of capelin and low alternative prey occur simultaneously, as was the case in the 1980s and, to some extent in the 1990s.
These clear dependencies between predator and prey further emphasize the need to address ecosystem interactions in the context of fisheries management. While specific details are expected to be case-dependent (i.e., type of interaction, data availability), decision-making management frameworks need to formally and explicitly incorporate ecosystem interactions more broadly. Paradoxically, the widespread overfishing of the past meant that controlling fishing was often enough to reverse declining stock trajectories; we had made fishing the dominant driver of many exploited fish stocks. As we reduce fishing pressure and learn to fish more sustainably, the importance of ecosystem factors as regulators of stock productivity and its variability over time becomes more prominent. Sustainable fisheries are no longer just about which level of fishing pressure is acceptable, but also how that level may need to change when ecosystem conditions and interactions change. This also implies that fishing on multiple interacting stocks requires explicit management of the emergent trade-offs between the corresponding fisheries. To no one’s surprise, these are basic tenets of ecosystem approaches (e.g., Fogarty, 2014; Link, 2017; Koen-Alonso et al., 2019), and their implementation is never simple nor easy (Koen-Alonso et al., 2019). However, in a world rapidly changing due to climate change, it is not only important to implement ecosystem-based management, it is rather urgent too.
Data Availability Statement
The raw data supporting the conclusions of this article will be made available by the authors, without undue reservation.
Ethics Statement
Ethical review and approval was not required for the animal study because this was a modeling study using historical fish data and as such we did not need ethical review and approval.
Author Contributions
MKA and UL contributed equally to the ideas in this manuscript, implemented the models for NL and BS, and drafted the manuscript. MKA developed the initial model concept and structure. AC and MKA integrated the NL and BS models into a single architecture. MKA, UL, and AC contributed to the data. AC provided edits to the manuscript. All authors contributed to the article and approved the submitted version.
Funding
The Norway-Canada collaborative project “A Transatlantic innovation arena for sustainable development in the Arctic” (CoArc) provided partial support for this work (project number 8048 at Akvaplan-niva and QZA-15/0457 at Norwegian Ministry of Foreign Affairs). Additional support was provided by Fisheries and Oceans Canada (DFO), and the Norwegian Institute of Marine Research (IMR) through operating and project funds to MKA and UL, respectively.
Conflict of Interest
The authors declare that the research was conducted in the absence of any commercial or financial relationships that could be construed as a potential conflict of interest.
Acknowledgments
This study builds upon the work of many people, and benefited from the many discussions we have had on cod, capelin, seals, and fisheries over the years in different fora, particularly a series of workshops on cod-seal interactions organized by DFO in 2007–2008, the annual meetings of the Northwest Atlantic Fisheries Organization (NAFO) Scientific Council (SC) Working Group on Ecosystem Science and Assessment (WGESA) since 2008, and most recently the CoArc project workshops in 2016–2019. We are especially grateful to G. Stenson, T. Haug, A. Buren, F. Mowbray, G. Evans, P. Regular, E. Pedersen, P. Pepin, M. Fogarty, A. Bundy, and P. Renaud for their insights, contributions, and willingness to serve as sounding board as the ideas contained this paper took shape. We also thank to the reviewers of this manuscript for their input and suggestions.
Supplementary Material
The Supplementary Material for this article can be found online at: https://www.frontiersin.org/articles/10.3389/fmars.2021.579946/full#supplementary-material
References
Auger-Méthé, M., Field, C., Albertsen, C. M., Derocher, A. E., Lewis, M. A., Jonsen, I. D., et al. (2016). State-space models’ dirty little secrets: even simple linear Gaussian models can have estimation problems. Sci. Rep. 6:26677. doi: 10.1038/srep26677
Benoît, H. P., Swain, D. P., Bowen, W. D., Breed, G. A., Hammill, M. O., and Harvey, V. (2011). Evaluating the potential for grey seal predation to explain elevated natural mortality in three fish species in the southern Gulf of St. Lawrence. Mar. Ecol. Prog. Ser. 442, 149–167. doi: 10.3354/meps09454
Bernier, R. Y., Jamieson, R. E., and Moore, A.M. (eds.) (2018). State of the Atlantic Ocean Synthesis Report. Canadian Technical Report of Fisheries and Aquatic Sciences 3167. Moncton, NB: Fisheries and Oceans Canada, iii, 149.
Bogstad, B., and Filin, A. A. (2011). “Chapter 12.1: multispecies and ecosystem modelling as tools for fishery management,” in The Barents Sea. Ecosystem, resources, management. Half a century of Russian-Norwegian cooperation, eds T. Jakobsen and V. K. Ozhigin (Trondheim: Tapir Academic Press), 647–664.
Bogstad, B., Gjøsæter, H., Haug, T., and Lindstrøm, U. (2015). A review of the battle for food in the Barents Sea: cod vs. marine mammals. Front. Ecol. Evol. 3:29. doi: 10.3389/fevo.2015.00029
Bousquet, N., Chassot, E., Duplisea, D. E., and Hammill, M. O. (2014). Forecasting the major influences of predation and environment on cod recovery in the northern Gulf of St. Lawrence. PLoS One 9:e82836. doi: 10.1371/journal.pone.0082836
Brose, U. (2010). Body-mass constraints on foraging behavior determine population and food-web dynamics. Funct. Ecol. 24, 28–34. doi: 10.1111/j.1365-2435.2009.01618.x
Brose, U., Ehnes, R. B., Rall, B. C., Vucic-Pestic, O., Berlow, E. L., and Scheu, S. (2008). Foraging theory predicts predator-prey energy fluxes. J. Anim. Ecol. 77, 1072–1078. doi: 10.1111/j.1365-2656.2008.01408.x
Brown, J. H., Gillooly, J. F., Allen, A. P., Savage, V. M., and West, G. B. (2004). Metabolic theory of ecology. Ecology 87, 1771–1789.
Bundy, A., Bohaboy, E. C., Hjermann, D. O., Mueter, F. J., Fu, C., and Link, J. S. (2012). Common patterns, common drivers: comparative analysis of aggregate surplus production across ecosystems. Mar. Ecol. Prog. Ser. 459, 203–218. doi: 10.3354/meps09787
Buren, A. D., Koen-Alonso, M., Pepin, P., Mowbray, F., Nakashima, B., Stenson, G., et al. (2014a). Bottom-up regulation of capelin, a keystone forage species. PLoS One 9:e87589. doi: 10.1371/journal.pone.0087589
Buren, A. D., Koen-Alonso, M., and Stenson, G. (2014b). The role of harp seals, fisheries and food availability in driving the dynamics of northern cod. Mar. Ecol. Prog. Ser. 511, 265–284. doi: 10.3354/meps10897
Buren, A. D., Murphy, H. M., Adamack, A. T., Davoren, G. K., Koen-Alonso, M., Montevecchi, W. A., et al. (2019). The collapse and continued low productivity of a keystone forage fish species. Mar. Ecol. Prog. Ser. 616, 155–170. doi: 10.3354/meps12924
Cadigan, N. (2015). A state-space stock assessment model for northern cod, including under-reported catches and variable natural mortality rates. Can. J. Fish. Aquat. Sci. 73, 296–308. doi: 10.1139/cjfas-2015-0047
Carscadden, J. E., Gjøsæter, H., and Vilhjálmsson, H. (2013). Recruitment in the Barents Sea, Icelandic, and eastern Newfoundland/Labrador capelin (Mallotus villosus) stocks. Prog. Oceanogr. 114, 84–96. doi: 10.1016/j.pocean.2013.05.006
Chassot, E., Duplisea, D., Hammill, M. O., Caskenette, A., Bousquet, N., Lambert, Y., et al. (2009). The role of predation by harp seals (Pagophilus groenlandicus) in the collapse and non-recovery of northern Gulf of St. Lawrence cod (Gadus morhua). Mar. Ecol. Prog. Ser. 379, 279–297. doi: 10.3354/meps07897
Chouinard, G. A., Swain, D. P., Hammill, M. O., and Poirier, G. A. (2005). Correspondence between changes in grey seal population abundance and variation in natural mortality of southern Gulf of St. Lawrence cod. Can. J. Fish. Aquat. Sci. 62, 1991–2000. doi: 10.1139/f05-107
Colbourne, E. B. (2004). Decadal changes in the ocean climate in Newfoundland and Labrador waters from the 1950s to the 1990s. J. Northwest Atl. Fish. Sci. 34, 43–61. doi: 10.2960/j.v34.m478
Cole, J. J., Lovett, G., and Findlay, S. E. G. (1991). Comparative analysis of ecosystems: Patterns, Mechanisms, and Theory. New York, NY: Springer Verlag, 375.
Cyr, F., Colbourne, E., Galbraith, P. S., Gibb, O., Snook, S., Bishop, C., et al. (2020). Physical Oceanographic Conditions on the Newfoundland and Labrador Shelf during 2018. DFO Canadian Science Advisory Secretariat Research. Document No. 2020/018. Ottawa ON: Fisheries and Oceans Canada, iv, 48.
Dawe, E., Koen-Alonso, M., Chabot, D., Stansbury, D., and Mullowney, D. (2012). Trophic interactions between key predatory fishes and crustaceans: comparison of two Northwest Atlantic systems during a period of ecosystem change. Mar. Ecol. Prog. Ser. 469, 233–248.
Dayton, P. K., Mordida, B. J., and Bacon, F. (1994). Polar marine communities. Am. Zool. 34, 90–99. doi: 10.1093/icb/34.1.90
Dempsey, D. P., Koen-Alonso, M., Gentleman, W. C., and Pepin, P. (2017). Compilation and discussion of driver, pressure, and state indicators for the Grand Bank ecosystem, Northwest Atlantic. Ecol. Indic. 75, 331–339. doi: 10.1016/j.ecolind.2016.12.011
DFO (2019). Stock Assessment of Northern Cod (NAFO divisions 2J3KL) in 2019. Canadian Science Advisory Secretariat Report. 2019/050. Ottawa ON: Fisheries and Oceans Canada.
DFO (2020). Stock Status Update for Northern Cod. DFO Canadian Science Advisory Secretariat Research No. 2020/nnn. Ottawa ON: Fisheries and Oceans Canada.
Drinkwater, K., Colbourne, E., Loeng, H., Sundby, S., and Kristiansen, T. (2013). Comparison of the atmospheric forcing and oceanographic responses between the Labrador Sea and the Norwegian and Barents seas. Prog. Oceanogr. 114, 11–25. doi: 10.1016/j.pocean.2013.03.007
Durant, J. M., Skern-Mauritzen, M., Krasnov, Y. V., Nikolaeva, N. G., Lindstrøm, U., and Dolgov, A. (2014). Temporal Dynamics of Top Predators Interactions in the Barents Sea. PLoS One 9:e110933. doi: 10.1371/journal.pone.0110933
Eriksen, E., Bogstad, B., and Nakken, O. (2011). Ecological significance of 0-group fish in the Barents Sea ecosystem. Polar. Biol. 34, 647–657. doi: 10.1007/s00300-010-0920-y
Eriksen, E., Skjoldal, H. R., Gjøsæter, H., and Primicerio, R. (2017). Spatial and temporal changes in the Barents Sea pelagic compartment during the recent warming. Progr. Oceanogr. 151, 206–226. doi: 10.1016/j.pocean.2016.12.009
Fall, J., de Lange Wenneck, T., Bogstad, B., Fuglebakk, E., Gjøsæter, H., Seim, S. E., et al. (2020). Fish Investigations in the Barents Sea Winter 2020. Joint Report. Series. (https://www.hi.no/resources/Winter_survey_report_2020_IMR_PINRO.pdf)*****accessqur
Fogarty, M. (2014). The art of ecosystem-based fishery management. Can. J. Fish. Aquat. Sci. 71, 479–490. doi: 10.1139/cjfas-2013-0203
Fossheim, M., Primicerio, R., Johannesen, E., Ingvaldsen, R. B., Aschan, M., and Dolgov, A. V. (2015). Recent warming leads to a rapid borealization of fish communities in the Arctic. Nat. Clim. Change 5, 673–677. doi: 10.1038/nclimate2647
Fudge, S. B., and Rose, G. A. (2008). Life history co-variation in a fishery depleted Atlantic cod stock. Fish. Res. 92, 107–113. doi: 10.1016/j.fishres.2008.02.005
Gaichas, S., Gamble, R., Fogarty, M., Benoit, H., Essington, T., Fu, C., et al. (2012). Assembly rules for aggregate-species production models: simulations in support of management strategy evaluation. Mar. Ecol. Prog. Ser. 459, 275–292. doi: 10.3354/meps09650
Gaichas, S., Reiss, C., and Koen-Alonso, M. (2014). “Chapter 10: ecosystem-Based Management in High Latitude Ecosystems,” in The Sea, Vol. 16, eds M. J. Fogarty and J. J. McCarthy (Cambridge: Harvard University Press), 277–324.
Gillooly, J. F., Brown, J. H., West, G. B., Savage, V. M., and Charnov, E. L. (2001). Effects of size and temperature on metabolic rate. Science 293, 2248–2251. doi: 10.1126/science.1061967
Gjøsæter, H., Bogstad, B., and Tjelmeland, S. (2009). Ecosystem effects of the three capelin stock collapses in the Barents Sea. Mar. Biol. Res. 5, 40–53. doi: 10.1080/17451000802454866
Glantz, M. H. (1992). Climate Variability, Climate Change and Fisheries. Cambridge: UniversityPress, Cambridge.
Hansen, J. L., and Harding, K. C. (2006). On the potential impact of harbour seal predation on the cod population in the eastern North Sea. J. Sea Res. 56, 329–337. doi: 10.1016/j.seares.2006.06.004
Haug, T., Bogstad, B., Chierici, M., Gjøsæter, H., Hallfredsson, E. H., Høines, A. S., et al. (2017). Future harvest of living resources in the Arctic Ocean north of the Nordic and Barents Seas: a review of possibilities and constraints. Fish. Res. 188, 38–57. doi: 10.1016/j.fishres.2016.12.002
Haug, T., Krøyer, A. B., Nilssen, K. T., Ugland, K. I., and Aspholm, P. E. (1991). Harp seal (Phoca groenlandica) invasions in Norwegian coastal waters: age composition and feeding habits. ICES J. Mar. Sci. 48, 363–371. doi: 10.1093/icesjms/48.3.363
Holsman, K. K., Essington, T., Miller, T. J., Koen-Alonso, M., and Stockhausen, W. J. (2012). Comparative analysis of cod and herring production dynamics across 13 northern hemisphere marine ecosystems. Mar. Ecol. Prog. Ser. 459, 231–246. doi: 10.3354/meps09765
Howell, D., and Bogstad, B. (2010). A combined Gadget/FLR model for management strategy evaluations of the Barents Sea fisheries. ICES J. Mar. Sci. 67, 1998–2004. doi: 10.1093/icesjms/fsq135
Hurtado-Ferro, F., Szuwalski, C. S., Valero, J. L., Anderson, S. C., Cunningham, C. J., Johnson, K. F., et al. (2015). Looking in the rear-view mirror: bias and retrospective patterns in integrated, age-structured stock assessment models. ICES J. Mar. Sci. 72, 99–110. doi: 10.1093/icesjms/fsu198
Hutchings, J. A., and Myers, R. A. (1994). What can be learned from the collapse of a renewable resource? Atlantic Cod, Gadus morhua, of Newfoundland and Labrador. Can. J. Fish. Aquat. Sci. 51, 2126–2146. doi: 10.1139/f94-214
ICES (2018). Interim Report of the Working Group on the Integrated Assessments of the Barents Sea (WGIBAR). WGIBAR 2018 REPORT 9-12 March 2018. ICES CM 2018/IEASG:04. Tromsø: ICES, 210.
ICES (2019). Report of the Arctic Fisheries Working Group (AFWG). ICES Scientific. Report No. 30. Burnaby, BC: ICES, 934.
ICES (2020). Arctic Fisheries Working Group (AFWG). ICES Scientific. Report No. 2:52. Burnaby, BC: ICES, 577. doi: 10.17895/ices.pub.6050
Jelmert, A., Sandø, A. B., Bogstad, B., Frie, A. K., Grøsvik, B. E., Eriksen, E., et al. (2020). Status of the Environment of the Barents Sea (eds. P. Arneberg, Gro van der Meeren, Sylvia Frantzen and Ida Vee). Report. Institute. Marine. Resarch., no. 2020-13. Bergen: Norwegian Institute of Marine Research, 114.
Johannesen, E., Ingvaldsen, R. B., Bogstad, B., Dalpadado, P., Eriksen, E., Gjøsæter, H., et al. (2012). Changes in Barents Sea ecosystem state, 1970–2009: climate fluctuations, human impact, and trophic interactions. ICES J. Mar. Sci. 69, 880–889. doi: 10.1093/icesjms/fss046
Kempf, A., Floeter, J., and Temming, A. (2008). Predator–prey overlap induced Holling type III functional response in the North Sea fish assemblage. Mar. Ecol. Prog. Ser. 367, 295–308. doi: 10.3354/meps07555
Kjesbu, O. S., Bogstad, B., Devine, J. A., Gjøsæter, H., Howell, D., Ingvaldsen, R. B., et al. (2014). Synergies between climate and management for Atlantic cod fisheries at high latitudes. Proc. Nat. Acad. Sci. U.S.A. 111, 3478–3483. doi: 10.1073/pnas.1316342111
Koen-Alonso, M. (2007). “A process-oriented approach to the multispecies functional response,” in From Energetics to Ecosystems: The dynamics and structure of ecological systems, eds N. Rooney, K. S. McCann, and D. L. G. Noakes (Dordrecht: Springer Netherlands), 1–36. doi: 10.1007/978-1-4020-5337-5_1
Koen-Alonso, M., and Cuff, A. (2018). Status and trends of the fish community in the Newfoundland Shelf (NAFO Div. 2J3K), Grand Bank (NAFO Div. 3LNO) and Southern Newfoundland Shelf (NAFO Div. 3Ps) Ecosystem Production Units. NAFO SCR Document 18/070. Dartmouth, NS: Northwest Atlantic Fisheries Organization, 1–11.
Koen-Alonso, M., Fogarty, M., Pepin, P., Hyde, K., and Gamble, R. (2013). Ecosystem production potential in the Northwest Atlantic. NAFO SCR 13/075. Dartmouth, NS: Northwest Atlantic Fisheries Organization, 1–13.
Koen-Alonso, M., Pepin, P., Fogarty, M. J., Kenny, A., and Kenchington, E. (2019). The northwest Atlantic fisheries organization roadmap for the development and implementation of an ecosystem approach to fisheries: structure, state of development, and challenges. Mar. Pol. 100, 342–352. doi: 10.1016/j.marpol.2018.11.025
Koen-Alonso, M., Pepin, P., and Mowbray, F. (2010). Exploring the Role of Environmental and Anthropogenic Drivers in the Trajectories of Core Fish Species of the Newfoundland-Labrador Marine Community. NAFO SCR 10/37. Dartmouth, NS: Northwest Atlantic Fisheries Organization, 1–16.
Koen-Alonso, M., and Yodzis, P. (2005). Multispecies modelling of some components of the marine community of northern and central Patagonia. Can. J. Fish. Aquat. Sci. 62, 1490–1512. doi: 10.1139/f05-087
Korsbrekke, K. (1997). Norwegian Acoustic Survey of Norteast Arctic Cod on the Spawning Grounds off Lofoten. ICES CM 1997/Y:18. Burnaby, BC: ICES, 18.
Kristensen, K., Nielsen, A., Berg, C. W., Skaug, H., and Bell, B. M. (2016). TMB: automatic differentiation and laplace approximation. J. Stat. Softw. 70, 1–21.
Lawson, J. W., Magalhães, A. M., and Miller, E. H. (1998). Important prey species of marine vertebrate predators in the northwest Atlantic: proximate composition and energy density. Mar. Ecol. Prog. Ser. 164, 13–20. doi: 10.3354/meps164013
Lilly, G. R., Nakken, O., and Brattey, J. (2013). A review of the contributions of fisheries and climate variability to contrasting dynamics in two Arcto-boreal Atlantic cod (Gadus morhua) stocks: persistent high productivity in the Barents Sea and collapse on the Newfoundland and Labrador Shelf. Prog. Oceanogr. 114, 106–125. doi: 10.1016/j.pocean.2013.05.008
Lind, S., Ingvaldsen, R. B., and Furevik, T. (2018). Arctic warming hotspot in the northern Barents Sea linked to declining sea-ice import. Nat. Clim. Change 8, 634–639. doi: 10.1038/s41558-018-0205-y
Link, J. S. (2017). System-level optimal yield: increased value, less risk, improved stability, and better fisheries. Can. J. Fish. Aquat. Sci. 75, 1–16. doi: 10.1139/cjfas-2017-0250
Mantzouni, I., Sørensen, H., O’Hara, R. B., and MacKenzie, B. R. (2010). Hierarchical modelling of temperature and habitat size effects on population dynamics of North Atlantic cod. ICES J. Mar. Sci. 67, 833–855. doi: 10.1093/icesjms/fsp291
Megrey, B. A., Link, J. S., Hunt, G. L., and Moksness, E. (2009). Comparative marine ecosystem analysis: applications, opportunities, and lessons learned. Progr. Oceanogr. 81, 2–9. (and associated papers in this special issue), doi: 10.1016/j.pocean.2009.04.002
Mohn, R. (1999). The retrospective problem in sequential population analysis: an investigation using cod fishery and simulated data. ICES J. Mar. Sci. 56, 473–488. doi: 10.1006/jmsc.1999.0481
Morgan, J. M., Koen-Alonso, M., Rideout, R. M., Buren, A. D., and Maddock Parsons, D. (2018). Growth and condition in relation to the lack of recovery of northern cod. ICES J. Mar. Sci. 75, 631–641. doi: 10.1093/icesjms/fsx166
Mullowney, D. R. J., and Rose, G. A. (2014). Is recovery of northern cod limited by poor feeding? The capelin hypothesis revisited. ICES J. Mar. Sci. 71, 784–793. doi: 10.1093/icesjms/fst188
Murawski, S. A., Steele, J. H., Taylor, P., Fogarty, M. J., Sissenwine, M. P., Ford, M., et al. (2010). Why compare marine ecosystems? ICES J. Mar. Sci. 67, 1–9. doi: 10.1093/icesjms/fsp221
Myers, R. A., Barrowman, N. J., Hoenig, J. M., and Quhe, Z. (1996). The collapse of cod in Eastern Canada: the evidence from tagging data. ICES J. Mar. Sci. 53, 629–640. doi: 10.1006/jmsc.1996.0083
Øigård, T. A., Lindstrøm, U., Nilssen, K. T., and Haug, T. (2013). Functional relationship between harp seal body condition, environment and prey in the Barents Sea. Mar. Ecol. Prog. Ser. 484, 287–301. doi: 10.3354/meps10272
Pedersen, E. J., Thompson, P. L., Aaron Ball, R., Fortin, M.-J., Gouhier, T. C., Link, H., et al. (2017). Signatures of the collapse and incipient recovery of an overexploited marine ecosystem. R. Soc. Open Sci. 4:170215. doi: 10.1098/rsos.170215
Peters, R. H. (1983). The Ecological Implications of Body Size. Cambridge: Cambridge University Press.
Popov, S., and Zeller, D. (2018). Reconstructed Russian fisheries catches in the Barents Sea: 1950-2014. Front. Mar. Sci. 5:266. doi: 10.3389/fmars.2018.00266
R Core Team (2017). R: A language and Environment for Statistical Computing. Vienna: R Foundation for Statistical Computing.
Rose, G. A., and O’Driscoll, R. L. (2002). Capelin are good for cod: can the northern stock rebuild without them? ICES J. Mar. Sci. 59, 1018–1026. doi: 10.1006/jmsc.2002.1252
Rose, G. A., and Walters, C. J. (2019). The state of Canada’s iconic Northern cod: a second opinion. Fish. Res. 219:105314. doi: 10.1016/j.fishres.2019.105314314
Schramski, J. R., Dell, A. I., Grady, J. M., Sibly, R. M., and Brown, J. H. (2015). Metabolic theory predicts whole-ecosystem properties. Proc. Natl. Acad. Sci. U.S.A. 112, 2617–2622. doi: 10.1073/pnas.1423502112
Shelton, P. A., and Lilly, G. R. (2000). Interpreting the collapse of the northern cod stock from survey and catch data. Can. J. Fish. Aquat. Sci. 57, 2230–2239. doi: 10.1139/f00-191
Shelton, P. A., Sinclair, A. F., Chouinard, G. A., Mohn, R., and Duplisea, D. E. (2006). Fishing under low productivity conditions is further delaying recovery of Northwest Atlantic cod (Gadus morhua). Can. J. Fish. Aquat. Sci. 63, 235–238. doi: 10.1139/f05-253
Sherwood, G. D., Rideout, R. M., Fudge, S. B., and Rose, G. A. (2007). Influence of diet on growth, condition and reproductive capacity in Newfoundland and Labrador cod (Gadus morhua): insights from stable carbon isotopes (δ13C). Deep-Sea Res. 2 Top. Stud. Oceanogr. 54, 2794–2809. doi: 10.1016/j.dsr2.2007.08.007
Smout, S., and Lindstrøm, U. (2007). Multispecies functional response of the minke whale Balaenoptera acutorostrata based on small-scale foraging studies. Mar. Ecol. Prog. Ser. 341, 277–291. doi: 10.3354/meps341277
Swain, D. P., and Benoît, H. P. (2015). Extreme increases in natural mortality prevent recovery of collapsed fish populations in a Northwest Atlantic ecosystem. Mar. Ecol. Prog. Ser. 519, 165–182. doi: 10.3354/meps11012
Swain, D. P., Benoît, H. P., and Hammill, M. O. (2015). Spatial distribution of fishes in a Northwest Atlantic ecosystem in relation to risk of predation by a marine mammal. J. Anim. Ecol. 84, 1286–1298. doi: 10.1111/1365-2656.12391
Thompson, R. J., Deibel, D., Redden, A. M., and McKenzie, C. H. (2008). Vertical flux and fate of particulate matter in a Newfoundland fjord at sub-zero water temperatures during spring. Mar. Ecol. Prog. Ser. 357, 33–49. doi: 10.3354/meps07277
Trzcinski, M. K., Mohn, R., and Bowen, W. D. (2006). Continued decline of an Atlantic cod population: how important is gray seal predation? Ecol. Appl. 16, 2276–2292. doi: 10.1890/1051-0761(2006)016[2276:cdoaac]2.0.co;2
Vasseur, D. A., and McCann, K. S. (2005). A mechanistic approach for modeling temperature-dependent consumer-resource dynamics. Am. Nat. 166, 184–198. doi: 10.1086/431285
Wassmann, P., Reigstad, M., Haug, T., Rudels, B., Carroll, M. L., Hop, H., et al. (2006). Food webs and carbon flux in the Barents Sea. Prog. Oceanogr. 71, 232–287. doi: 10.1016/j.pocean.2006.10.003
Yaragina, N. A., Bogstad, B., and Kovalev, Y. (2009). Variability in cannibalism in Northeast Arctic cod (Gadus morhua) during the period 1947–2006. Mar. Biol. Res. 5, 75–85. doi: 10.1080/17451000802512739
Yaragina, N. A., Kovalev, Y., and Chetyrkin, A. (2018). Extrapolating predation mortalities back in time: an example from North-east Arctic cod cannibalism. Mar. Biol. Res. 14, 1–14. doi: 10.1080/17451000.2017.1396342
Yodzis, P. (1998). Local trophodynamics and the interaction of marine mammals and fisheries in the Benguela ecosystem. J. Anim. Ecol. 67, 635–658. doi: 10.1046/j.1365-2656.1998.00224.x
Keywords: trophic interactions, predator-prey, ecosystem approach to fisheries, bottom-up regulation, food web ecology, bioenergetic-allometric model
Citation: Koen-Alonso M, LindstrØm U and Cuff A (2021) Comparative Modeling of Cod-Capelin Dynamics in the Newfoundland-Labrador Shelves and Barents Sea Ecosystems. Front. Mar. Sci. 8:579946. doi: 10.3389/fmars.2021.579946
Received: 03 July 2020; Accepted: 03 February 2021;
Published: 09 March 2021.
Edited by:
Maria Grazia Pennino, Spanish Institute of Oceanography, SpainReviewed by:
Tommaso Russo, University of Rome Tor Vergata, ItalyVadim Karatayev, University of Guelph, Canada
Copyright © 2021 Koen-Alonso, Lindstrøm and Cuff. This is an open-access article distributed under the terms of the Creative Commons Attribution License (CC BY). The use, distribution or reproduction in other forums is permitted, provided the original author(s) and the copyright owner(s) are credited and that the original publication in this journal is cited, in accordance with accepted academic practice. No use, distribution or reproduction is permitted which does not comply with these terms.
*Correspondence: Mariano Koen-Alonso, Mariano.Koen-Alonso@dfo-mpo.gc.ca; Ulf Lindstrøm, ulf.lindstroem@hi.no
†These authors have contributed equally to this work