Microstructural Consequences of Blast Lung Injury Characterized with Digital Volume Correlation
 Hari Arora1,2*
 Alex Nila3
Kalpani Vitharana2
Alex Nila3
Kalpani Vitharana2
 Joseph M. Sherwood2
Thuy-Tien N. Nguyen2
Angelo Karunaratne4
Idris K. Mohammed2
Joseph M. Sherwood2
Thuy-Tien N. Nguyen2
Angelo Karunaratne4
Idris K. Mohammed2
 Andrew J. Bodey5
Peter J. Hellyer2
Darryl R. Overby2
Robert C. Schroter2
Dave Hollis3
Andrew J. Bodey5
Peter J. Hellyer2
Darryl R. Overby2
Robert C. Schroter2
Dave Hollis3
- 1Swansea University, Swansea, United Kingdom
- 2Imperial College London, London, United Kingdom
- 3LaVisionUK Ltd., Oxford, United Kingdom
- 4University of Moratuwa, Moratuwa, Sri Lanka
- 5Diamond Light Source, Didcot, United Kingdom
This study focuses on microstructural changes that occur within the mammalian lung when subject to blast and how these changes influence strain distributions within the tissue. Shock tube experiments were performed to generate the blast injured specimens (cadaveric Sprague-Dawley rats). Blast overpressures of 100 and 180 kPa were studied. Synchrotron tomography imaging was used to capture volumetric image data of lungs. Specimens were ventilated using a custom-built system to study multiple inflation pressures during each tomography scan. These data enabled the first digital volume correlation (DVC) measurements in lung tissue to be performed. Quantitative analysis was performed to describe the damaged architecture of the lung. No clear changes in the microstructure of the tissue morphology were observed due to controlled low- to moderate-level blast exposure. However, significant focal sites of injury were observed using DVC, which allowed the detection of bias and concentration in the patterns of strain level. Morphological analysis corroborated the findings, illustrating that the focal damage caused by a blast can give rise to diffuse influence across the tissue. It is important to characterize the non-instantly fatal doses of blast, given the transient nature of blast lung in the clinical setting. This research has highlighted the need for better understanding of focal injury and its zone of influence (alveolar interdependency and neighboring tissue burden as a result of focal injury). DVC techniques show great promise as a tool to advance this endeavor, providing a new perspective on lung mechanics after blast.
Introduction
Trauma research is a vast and rapidly growing field and blast injuries represent the most extreme level of trauma. Nowadays, blast injuries present a concern, not only for military personnel in the context of combat but also civilians. This is due to a host of explosive threats that injure unprotected civilians in everyday life, such as industrial accidents, legacies from war (landmines), and terrorism. The importance of blast injury research is further heightened by the fact that blast injuries are far more complex and severe than conventional civilian trauma, such as road traffic accidents. The nature of the blast threat (blast loading) is constantly evolving, meaning the nature and mechanisms of the injuries will differ, depending on a range of variables associated with the explosive event. The chasm in knowledge surrounding blast injuries is created by the sheer number of variables present in a blast event (weight/type/shape of explosive, the position relative to the victim, the surrounding environment, etc.). Hence, new approaches are required to identify the underlying mechanism and effects of injury associated with blast lung trauma.
Clinical and postmortem data collected during the recent conflict in Afghanistan revealed that blast lung injury (BLI) was found in 6–11% of survivors, increasing to 80% in non-survivors (17% dying from BLI alone) (Scott, 2016). BLI incidence increases to more than 90% in terrorist attacks occurring in enclosed spaces such as trains. However, BLI is not thoroughly understood with some casualties being undiagnosed, leading to complications with treatment or even, preventable and avoidable, death. Models exist in the literature, with many more being proposed each year to tackle or address new aspects of the pathology (CR Bass et al., 2008; Garner et al., 2010; Kohsuke et al., 2016). One study presents 2,550 large animal (sheep, pig, monkey, goat, dog, and burro) experiments on blast lethality (CR Bass et al., 2008). This collection of work is not the norm in terms of experimental numbers, which typically range from 20 to 200 per study; animal models range from pigs (large) (Garner et al., 2010) down to mice (small) (Kohsuke et al., 2016). While much research focuses on global effects of trauma, which contributes significantly to knowledge of patient outcome, lung injuries actually range from diffuse and sparse regions of visible tissue damage to non-detectable damage (by conventional imaging techniques) (Scott et al., 2017).
The lung is a dynamic, hierarchical organ with strain- and strain-rate-sensitive mechanical properties. The microarchitecture resembles that of foam, built from constituents, including collagen, elastin, extracellular matrix, and endothelial and epithelial cells, in varying proportions throughout the lung and across species (Hoppin et al., 1975; Matsuda et al., 1987; Mercer et al., 1994; Yuan et al., 1997; Black et al., 2005; Suki et al., 2005; Andrikakou et al., 2016). Alveoli form tightly packed networks that expand and contract during respiration, influencing each other while stretching, compressing and straining with their neighbors. Tethering stresses that exist between neighboring groups of alveoli promote non-uniformity in deformation during respiration (Sera et al., 2004; Denny and Schroter, 2006). This study uses high-resolution synchrotron imaging to facilitate improved understanding of micro-scale lung mechanics in trauma.
Digital volume correlation (DVC) is a powerful technique used to explore true three-dimensional strain fields within a given deforming object. It is achieved in conjunction with various powerful volumetric imaging techniques and obeys the principles of all image correlation or tracking methods (Schreier et al., 2009). DVC has been performed in structural biomaterials such as bone (Bay et al., 1999; Gillard et al., 2014; Roberts et al., 2014; Palanca et al., 2015), characterizing microstructural mechanics and the accuracy of the technique itself. This study aims to explore microstructural deformation in lung tissue using DVC, specifically showing how differing levels of blast loading can affect the behavior of lung tissue during respiration. This is to determine whether the observed loss of lung function is a time-related mechanical effect, e.g., plasticity causing abnormal wall characteristics, leading to possible fatigue in the long term.
The interdependency of healthy tissue on neighboring damaged tissue units is also considered in this study. Local defects can develop into larger injury sites over a period of time. Scans were performed for different volumetric pre-strain (i.e., levels of inflation) to calculate wall strain during respiration. Damaged and injured lung tissue mechanics are characterized in a greater depth than previously reported.
Materials and Methods
An overview of the experiment is given in Figure 1, showing the three key elements of this study. The specimen is ventilated, subject to blast, and then excised and prepared for imaging. Airway pressure is set to 10 cmH2O prior to the first scan and then increased to 20 cmH2O for the second scan. Based on the local deformations between the two pressure states, strains can be resolved using DVC algorithms. Details of these procedures are provided in the following sections.
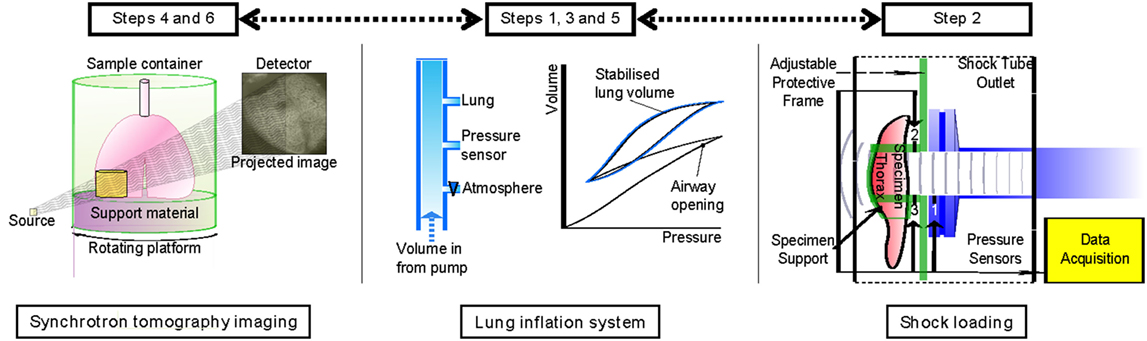
Figure 1. Experimental summary indicating the order of each experimental step: ventilation, blast loading, and tomographic imaging.
Sample Preparation and Handling
Female cadaveric Sprague-Dawley rats (200–280 g), purchased from Charles River, Kent, UK, were delivered within 4–6 hours of sacrifice during this study. No live animals or human subjects were tested in this study. Cadaveric tissue was obtained from animals from a registered animal supplier. Procedures were approved by the Imperial College London ethical review process and strictly conformed to the Animals (Scientific Procedures) Act 1986 UK Home Office guidelines, which also fulfill the US NIH Guide for the Care and Use of Laboratory Animals. Previous research within the group established the in vivo model (Barnett-Vanes et al., 2016) and found it exhibited comparable physical behavior to freshly harvested tissue. Therefore, it was deemed appropriate to proceed with cadaveric tissue for the experimental program to establish the feasibility of this strain measurement technique.
Specimens were weighed before and after each procedure to monitor superficially any major water loss during the experiment. Pre-experimentation, a tracheostomy was performed to enable the lungs to be ventilated. A series of ventilation cycles were performed to minimize airway closure and degradation, which is commonly reported to occur rapidly after death in unventilated lungs. A Harvard PHD Ultra syringe pump was used to deliver a controlled volume of air, while tracheal pressure was monitored via a sensor (Omegadyne PX309) mounted in the circuit (between pump and lung). Compliance of the air in the ventilation system was corrected for to enable representative pressure-volume characteristics of the lung to be captured. The setup was controlled using LabVIEW, and pressure-volume data were visualized and monitored during each experiment. Ventilation was performed under pressure control (0–20 cmH2O) to ensure open airways were not overpressurized, while promoting airway reopening of any collapsed airways via cyclic loading. Once the monitored pressure-volume loops of the lungs stabilized, i.e., no further progressive volume changes recorded, the samples were ready for blast experimentation.
Samples were held at a predetermined lung volume, equating to the peak pressure 20 cmH2O, prior to single blast wave loading. Relaxation from this initial set-point condition was expected, monitored, and accounted for during the timings of each test. There was typically a 10% drift in reduced pressure during the relaxation phase. All other organs were shielded from the blast (head, abdomen and limbs). The efficiency of blast wave isolation to a target region of the specimen has been established previously (Eftaxiopoulou et al., 2015; Barnett-Vanes et al., 2016). The high lung volume was used to replicate the pre-tension of breathing lung tissue during a blast event. Controls did not receive a blast wave but were otherwise treated identically, undergoing all procedures including being mounted on the shock tube for the equivalent period of time.
After the procedure, rats were re-mounted on the ventilation system for the assessment of injury and to restore any collapsed airways. Once stabilized, the thorax of the specimen was dissected and the lung was isolated, while lung volume was maintained by the ventilator. The lung was then mounted within a sealable polymer tube, which contained ballast for stability during imaging and phosphate buffer solution to maintain surface moisture of the specimen.
Specimen Loading Device: Shock Tube
A shock tube was employed to generate blast wave pressure pulses of controlled intensity and duration. This shock tube is formed of sections of stainless steel tube (3.8 m total length), with an internal diameter of 59 ± 1 mm. Compressed air is used to pressurize the driver section. The driven section remains at atmospheric pressure. For this study, the minimum driver volume was used, equivalent to 2.2 × 10⁻⁴ m3 of air per test shot. The system was operated in a single-diaphragm configuration, using thin film polymer (Mylar) diaphragms of varying thickness (50–100 µm). Blast waves with magnitudes up to 180 kPa were produced during this study. The setup used here promoted the formation of blast waves that approximate the Friedlander waveform due to the small driver volumes and open-loading configuration.
Three pressure gauges were mounted along the shock tube and around the test specimen to monitor the loading experienced by the specimen during each blast test. Sensor 1 was mounted radially at the shock tube outlet to ensure that the incident wave produced is repeatable and consistent in single-diaphragm firing mode. Two further sensors were attached to the specimen mount. The specimen mount was designed to allow for near consistent loading conditions to be achieved for each specimen. The opening for the specimen is adaptable to account for the small variations in size from animal to animal. The blast wave is isolated to the thorax alone and shielded distal to the thorax, leading to a repeatable loading conditions (Barnett-Vanes et al., 2016). Sensors 2 and 3 were installed on the loading platform above and below the incident blast pressure loading site of the specimen. These sensors recorded the transient pressure state in front of the thorax. A combination of incident and reflected overpressure was recorded, due to the proximity of the sensors to the thorax. High-speed photography was employed to ensure the setup and desired loading condition was maintained throughout the duration of each test. A Phantom V210 camera (208 × 128 pixels at 53,000 fps) was used, positioned square-on to the sample and loading direction.
Two blast conditions were studied alongside the control case: (1) low-intensity blast (peak overpressure 100 kPa) and (2) a moderate-intensity blast (peak overpressure 180 kPa). This moderate case is known to approach the upper bound of survivability in live animals (Barnett-Vanes et al., 2016). Therefore, this case was included in this cadaveric study to highlight any tissue changes that may have occurred (tissue stiffness), which are not visibly shown to be damaging, i.e., no hemorrhage, but may cause structural changes potentially visible in the strain fields.
Tomographic Image Acquisition
Synchrotron X-ray microtomography experiments were conducted at the Diamond-Manchester Imaging Branchline I13-2 of Diamond Light Source (DLS), UK. Synchrotron light sources enable tomographic data sets to be collected with higher signal-to-noise ratio and higher spatial and temporal resolution more quickly than micro-focus tube sources (“laboratory CT”) and also provide phase contrast more readily. Inflated lungs are very prone to tissue creep, and the high flux of X-rays at I13-2 enabled data of good signal-to-noise ratio to be collected quickly enough for creep to be kept acceptably low. Total scan time to collect all projections was 30 s. A partially coherent, polychromatic “pink” beam (photon energy range: 5–35 keV) of parallel geometry was generated by an undulator from electrons in a storage ring of 3.0 GeV current. The undulator gap was set to 5 mm for data collection and, to limit sample damage, 11 mm for alignment. The beam was reflected from the Pt stripe of a grazing-incidence focusing mirror and, to limit sample damage, high-pass filtered with 1.3 mm pyrolytic graphite and 3.11 mm aluminum. Images were acquired at equally spaced angles over 180° of continuous rotation (“fly scan”) by a ZnWO4 scintillator-coupled pco.edge 5.5 (PCO AG, Germany) detector, with a sCMOS sensor of 2,560 × 2,160 pixels. With 2.5× total magnification, this gave a field of view of 6.7 mm × 5.6 mm and an effective pixel size of 2.6 µm. Various propagation distances were studied to determine the optimal inline phase contrast, and 150 mm was chosen. Images recorded at 180° were compared to those recorded at 0° to check for (potentially subtle) experimental problems including sample deformation and damage (Atwood et al., 2015). To balance the signal-to-noise ratio and angular sampling with tissue damage and deformation via tissue creep, various exposure times and numbers of projections were trialed; data sets were then collected with 1,801 projection images of 30 ms exposure time. Prior to reconstruction via filtered back projection with DAWN 1.7 (Basham et al., 2015), projection images were flat- and dark-field corrected, and ring artifact suppression was performed (Titarenko, 2016).
Samples were scanned and then cycled again on the ventilator, prior to being scanned a second time. The pilot study (MT10583-1) concluded that to avoid excessive tissue dehydration, which could augment the tissue mechanics, samples should be kept in a fully humidified chamber. The lung was imaged intact to allow a fixed volume of air to be kept within the tissue during each scan. Imaging parameters were further optimized for the whole intact set of lungs. Lungs were subject to ventilation, and prior to each scan, they were stopped at mid- and low-lung volumes. Imaging biopsies would not allow for airway control in this manner. Care was taken to ensure minimal movement of the lung between original and second mounting position. The relatively large field of view meant correlation between sub-volumes in each scan was possible. An overview of the full experimental procedure is provided in Figure 1.
Image Processing
Image stacks were imported into the DaVis software for DVC to be performed. Rigid body translations were expected given the sample had been removed from the imaging platform between scans (to ventilate and set to the second lung pressure/volume). Rigid body motion was removed from the strain computation via a transformation matrix computed within the DaVis software. The DVC process is mapped out schematically in Figure 2, illustrating the use of sub-volume tracking of regions to compute the strain vector between neighbors. The computed strain result was produced by a final correlation sub-volume size pass of 32 × 32 × 32 voxels. The DVC software employs piecewise linear shape functions when matching sub-volume deformation between the reference and the deformed image. The number of “pieces” in that piecewise linear shape function is determined by the overlap percentage. Therefore, a higher overlap (75%) results in more (linear) pieces to describe the sub-volume deformation; the higher the percentage overlap, the closer the shape function gets to a second order approximation (compared to purely first order for zero overlap). With more overlap, the ability to detect discontinuities is enhanced, and the algorithm can more accurately describe the high-gradient displacement changes expected in lung tissue.
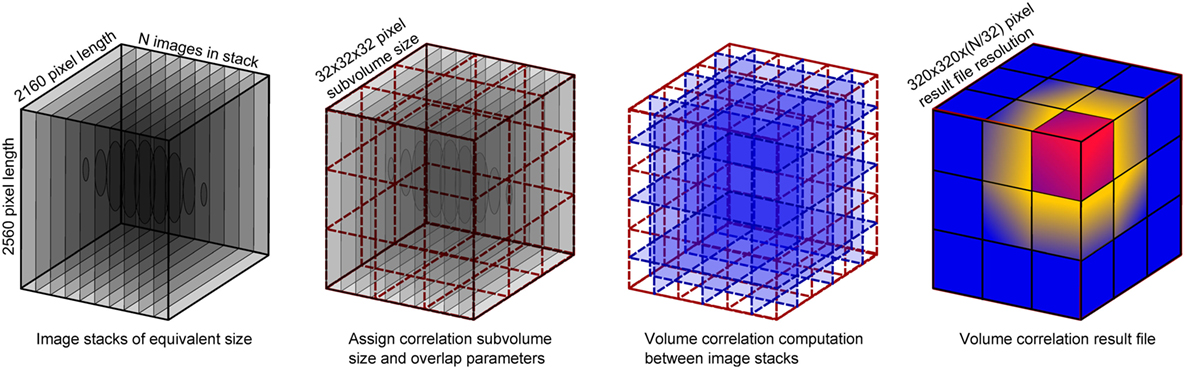
Figure 2. Schematic of the volume correlation process, including details of the input volume size versus the result file size.
The correlation was performed between an image stack acquired at one pressure state and another image stack acquired at the second pressure state. This creates one set of strain data representing the deformation between the two pressure states. Maximum three-dimensional strain (maximum principal) was exported for further analysis in MATLAB. Analysis was performed on each result file to compare blast conditions in terms of visual differences and spatial variation. Subregions within each specimen were studied in relation to the global volume characteristics.
Results and Analysis
Sample blast wave profiles from the two blast conditions are shown in Figure 3. Peak blast wave pressures of 100 kPa for the low-level blast and 180 kPa for the moderate-level blast were measured at the outlet of the shock tube. Figure 3 illustrates the near instantaneous rise time and characteristic decay associated with a blast wave. When monitoring the local pressure history in front of the thorax of the specimen, local lateral pressures initially peaked at 50 and 100 kPa for the two test cases. To extend the analysis of the loading conditions on each specimen, studies have correlated lateral and head-on (reflected) pressures for this shock tube under both the open- and closed-tube configuration (Nguyen et al., 2014; Nguyen, 2016).1 The closed-tube configuration can approximate the maximum pressure that the test specimens would observe. Therefore, in the case for a lateral pressure recorded at the outlet of 100 kPa, this results in a peak reflected pressure of 320 kPa. For an open-tube configuration, this peak reflected pressure reduction to 265 kPa. Similarly, for the moderate blast loading, the closed- and open-tube configurations would deliver peak reflected pressures of 575 and 480 kPa respectively. In reality, the peak loading on the sample lies within this range as the specimen is positioned at the outlet. There are local variations in the pressures measured at the top of the thorax compared to the base, due to differences in structural compliance along from the apex to the base of the thorax. This structural compliance of the system will result in a differing decay characteristic in the loading and therefore comments on the peak are presented here with reference to the open- and closed-tube configurations (Nguyen et al., 2014; Nguyen, 2016; see text footnote 1). The pressure values lie within the range of the commonly reported threshold for lung injury (CR Bass et al., 2008).
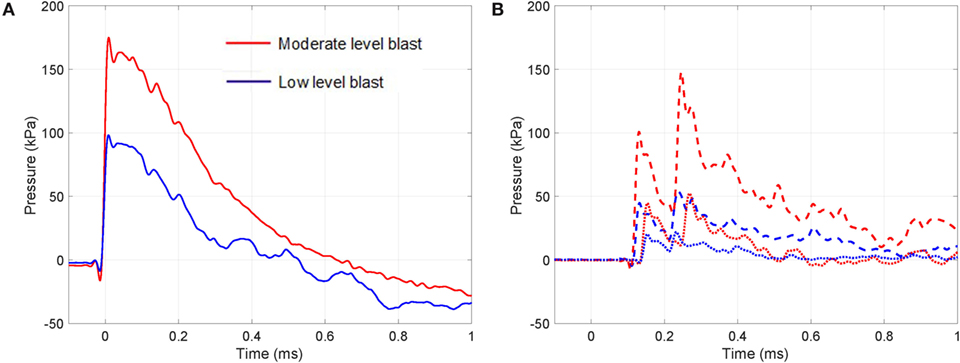
Figure 3. Transient pressure measured during the moderate and low-intensity blasts: (A) at outlet of the shock tube (solid line) and (B) at the top (dashed line) and bottom (dotted line) regions in front of the thorax.
An example of the process to convert the tomography image to the computed strain field is shown for a control (un-blasted) sample in Figure 4. Here, a sub-volume of the acquired image stack and the resultant extracted strain contours is shown. This highlights the nature of strain banding aligned to the stretched alveolar walls. Although the strain overlay plots help to visualize how the lung volume has deformed, for interpretation of the strain fields, specific strain vectors were extracted for direct analysis seen in Figure 4. Color and gray plots are included to show the origins of the strain plots, analyzed later in the article.
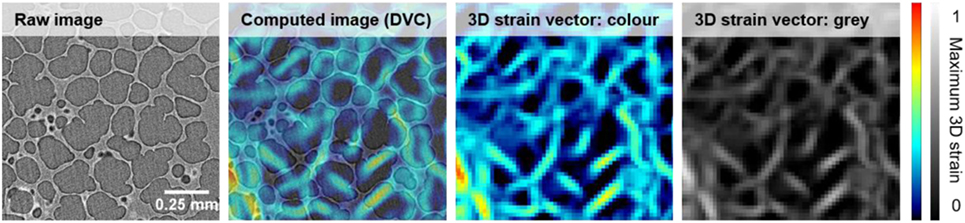
Figure 4. Volume correlation process applied to a control sample. Images show the steps from a raw volume image to the extracted maximum three-dimensional strain field.
To characterize the healthy lung, the entire volume of the control specimen was computed. Figure 5 presents the central plane of the three-dimensional strain contour plot for maximum three-dimensional strain, the maximum three-dimensional shear strain, and the probability distribution functions relating to these two contour plots.
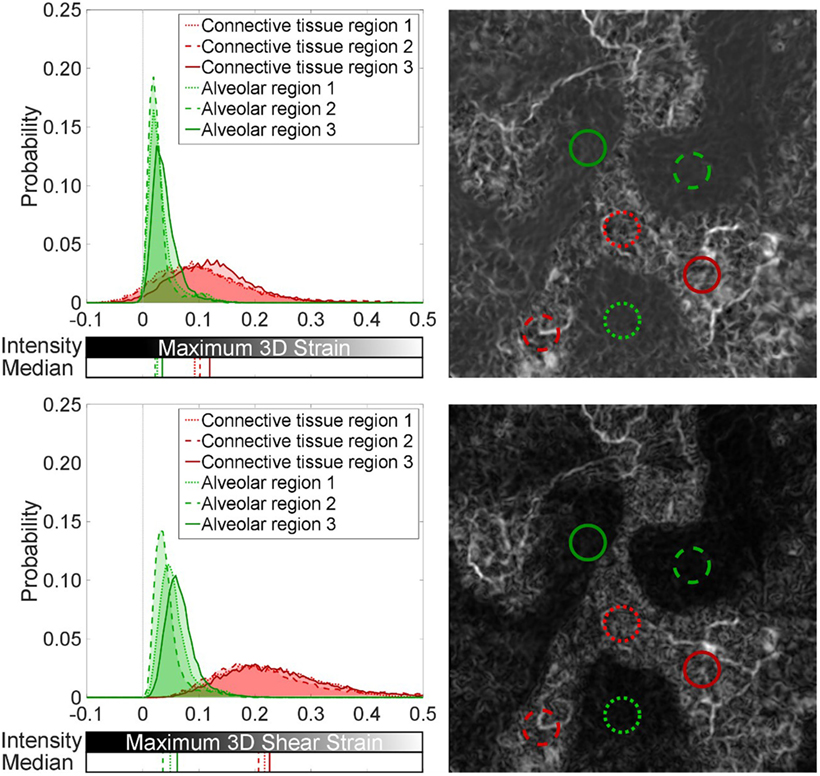
Figure 5. Spatial analysis of strain field in the control: (top) maximum three-dimensional strain and (bottom) maximum three-dimensional shear strain. Sub-volumes (0.26-mm radius) within the control specimen were analyzed to highlight uniform low-level strains in alveolar regions (green) and a dense network of higher strains in connective tissue between lobular regions of alveoli (red). The median for each distribution is also plotted.
Maximum three-dimensional strain here equates to the maximum principal (normal) three-dimensional strain. Principal/normal strain are the Eigenvalues of the Matrix:
To get the derivative Ezz you need a multi plane vector field (more than one z-planes). The Eigenvectors ex, ey, and ez of that Matrix define the coordinate system where no shear is present, and the deformation can be described by using only strain along ex, ey, and ez. The biggest Eigenvalue is called maximum (normal) three-dimensional strain. Maximum 3D shear strain is defined as the maximum Eigenvalue minus the minimum Eigenvalue of the strain tensor.
Subsections of the contour plots were analyzed in Figure 5 for differences between alveolar and connective regions of the control lung. The probability distribution functions present a fair means of normalizing the distribution of strain components found within equivalent sized regions of the global volume. These distributions show how the volume is behaving, supporting the visual two-dimensional slice contour map, which was taken at the central plane of the three-dimensional data. Medians of their distributions are presented to highlight regional variation.
Figure 5 reveals local regions of strain uniformity within the alveolar-dense regions (airspaces) of ~2–5% in magnitude. However, there are also connective regions between lobular sections of airspace networks, which exhibit higher strains (~10%). Since regions (lobes) of the parenchyma are inflating next to each other, this causes relative movement between neighboring lobes. The ventilation of each region and the asymmetries present in the structure of these lobes will cause these lobular regions of airspaces to move relative to each other, i.e., not cohesively as one global unit, leading to higher strains between these independent clusters of alveoli (airspaces). The strains were discretized into component of normal and shear. The relative movement of the lobes within the parenchyma causes strain bands (white regions) within the tissue to be composed primarily of shear strains (~20%) within the connective tissue regions.
A Mann–Whitney U-test was performed on the distributions in the article. All alveolar regions were statistically significantly different when compared to the connective regions for both the maximum three-dimensional shear and normal strain distributions (p < 0.001). The differences from the alveolar regions are indicated by the major shifts in the medians (~10% for maximum 3D strain and ~15% in maximum 3D shear) and spread of the distributions for the connective regions plotted in Figure 5.
Blast loaded specimens were then analyzed—a sample planar (or slice) view of the three-dimensional strain field is presented for each case in Figure 6. Comparing the control (un-blasted) specimen to the blast cases, there is a clear difference in global strain magnitude and the localization of high strain regions.
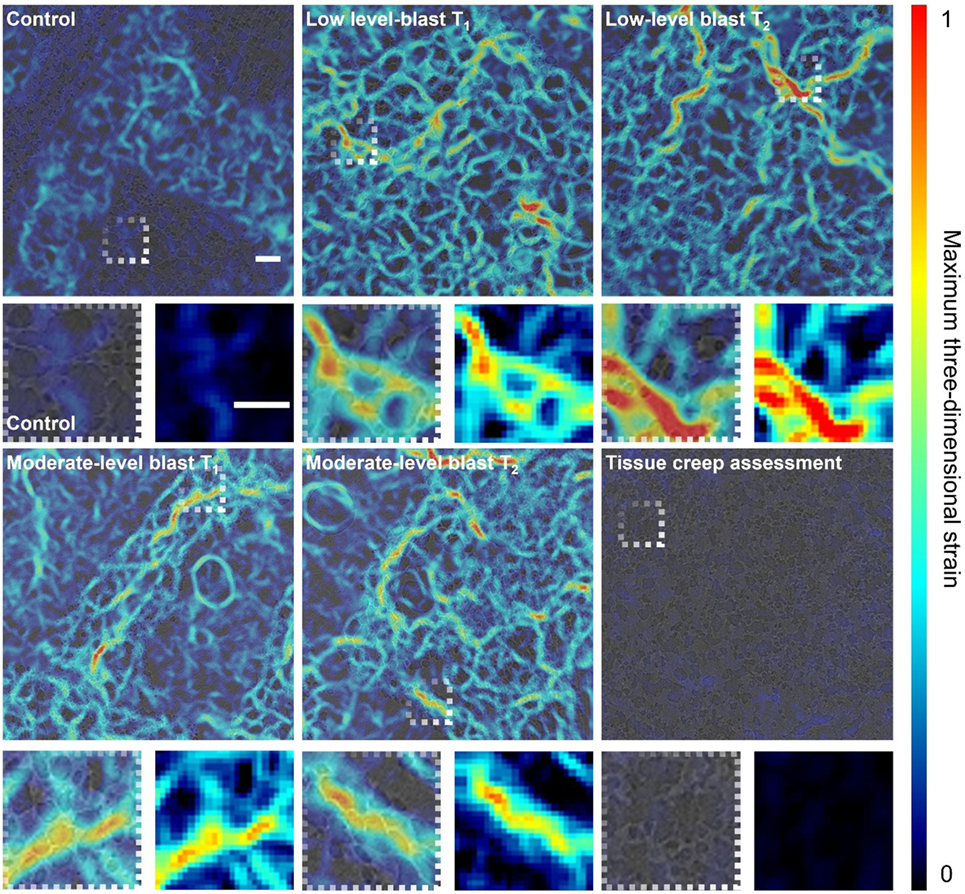
Figure 6. Digital volume correlation results displaying the maximum three-dimensional strain at a given plane within the lung volume for each loading case: control, low-level blast and moderate-level blast. T1 and T2 denote repeat experiments. In addition, one blast specimen was scanned twice with a time delay between scans to highlight the maximum level of tissue creep during the imaging process as a proxy measure of noise and error in strain measurement. Scale bar indicates 200 µm.
Both low- and moderate-blast cases observed in peak strains of ~100%. This localization of high strain indicates regions of overstrain, overdistension, during the ventilation procedure. To ensure the strains observed were independent of imaging artifact, one sample was imaged repeatedly on the beam line with a delay between scans greater than the length of a given experiment (5 min) to assess the maximum level of tissue creep that might be observed during imaging process. The lungs are viscoelastic in nature and therefore are susceptible to relaxation. This tissue creep assessment shows that, even after a 5-min delay between scans, strains barely peak over a few percent. Imaging for all specimens was conducted within a 30-s period to mitigate creep effects, keeping most likely well below the creep strain levels recorded during this exaggerated creep assessment. The color maps highlight the general network of strains seen in the tissue providing an overview of the entire sample and how it deforms. Strain localization occurred in regions inset from the boundary and along branch-way connections within the moderate-blast specimens. To obtain an improved perspective on the nature of tissue strain in health and injury, further analysis was performed on the distributions of strains.
Figure 7 analyzes the entire lung volumes and shows the probability distribution function for the strain content within each of the specimens shown in Figure 6. There are significant differences in the distributions from the control to the blast injured specimens, as expected from the visual strain maps presented in Figure 6 (p < 0.001). A shift of ~10% was observed in the median for all blast samples compared to the control. The spread of the distribution was seen to increase as well for each blast case, indicating that sites of higher tensile strain induce an effect on surrounding regions. There were no discernible differences overall between the two blast cases in terms of the global distribution, averaged over the whole specimen volume.
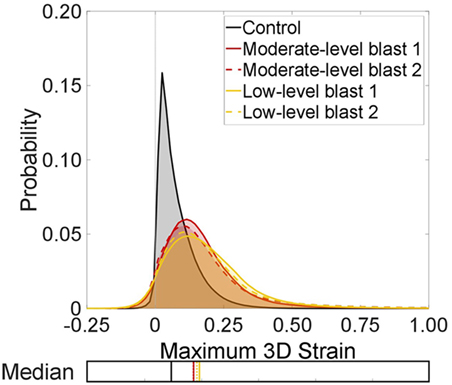
Figure 7. Probability distributions for the strain content of each test case to show the global trends between each lung volume in terms of maximum three-dimensional strains. The median for each distribution is also plotted.
It is interesting to note the greater presence of negative strains in the blast cases. This is due to the net balance in strain within a given volume of tissue. Sites of damage may augment local mechanics. This can lead to some regions, healthy or injured, observing extra tension (overdistension), which may compress neighboring regions, which may also be damaged or occluded upstream and not ventilating well, causing a local compression. This is unlike healthy lungs, where alveoli are seen to expand more uniformly, stretching together, leading to small but generally tensile strains. To study these strain fields in detail, sub-volumes were explored within the global (entire) scan.
Figure 8 presents the same probability distribution analysis, this time applied to sub-volumes (zones) within the full volume image. Regions of high strain localization were targeted for the smallest sub-volume (Zone 1), which is a 0.26-mm radius sphere of the specimen/data. Larger shells surrounding Zone 1 and the focal strain site of interest were also computed. Distributions corresponding to those measured within Zone 1 (0–0.26 mm), Zone 2 (0.26–0.44 mm), Zone 3 (0.44–0.61 mm), and the full volume were processed and are presented in Figure 8.
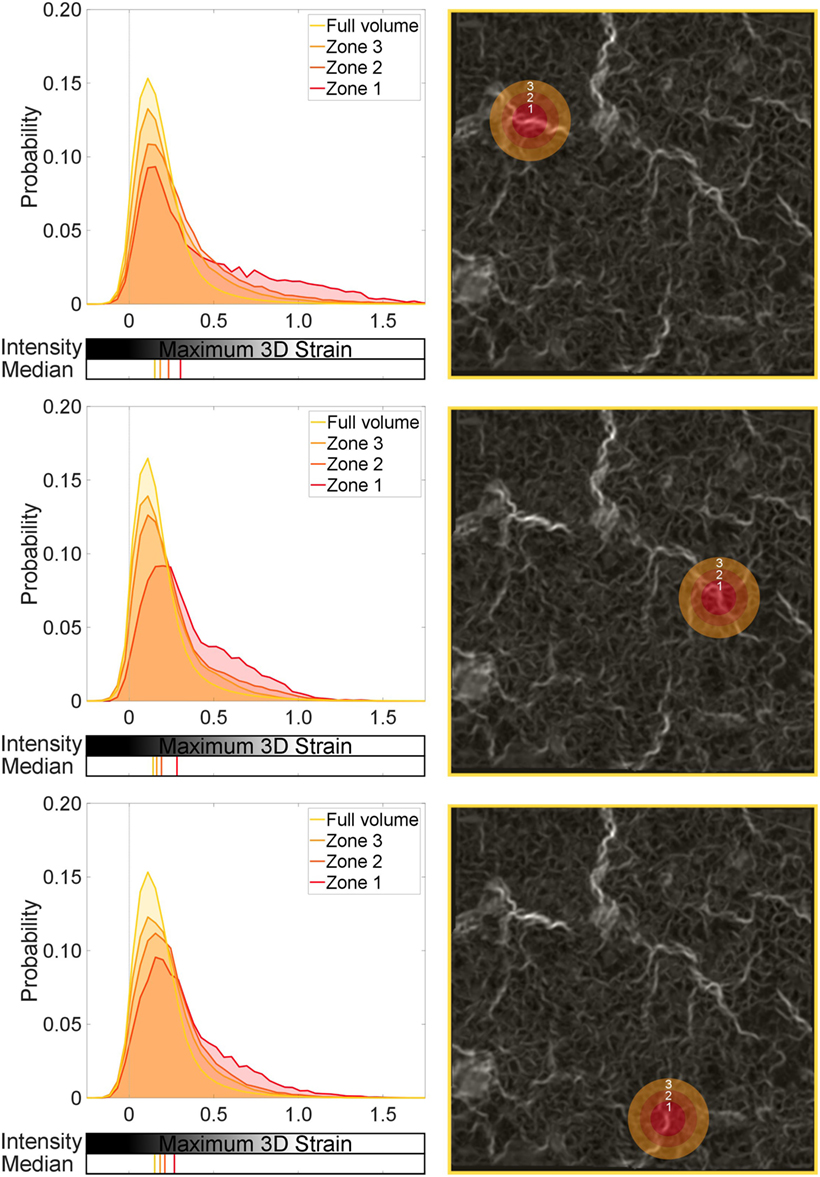
Figure 8. Global and local strain distributions around a strain concentration: low-level blast. Three regions are selected, with sequential spherical shell volumes analyzed to show the effect of the local strain discontinuity on the surrounding tissue. Zone 1 is the central sphere focused on a given strain concentration. Zones 2 and 3 are shells leading from Zone 1. The median for each distribution is also plotted.
Zones 1, 2, and 3 in each region studied in Figure 8 exhibit significant differences in distributions compared to the full volume, or global behavior (p < 0.001). This supports the visual interpretation from Figure 8 that these sites of observed different mechanical behavior are focal. There is an observable offset in the median in Zone 1 compared to the full volume across the three regions (~10–15%). However, there are no statistical differences among Zones 1, 2, and 3 in each image, implying that these regions are behaving in a similar fashion to each other (still different to the global behavior, i.e., full volume). This analysis enforces that these focal zones are composed of higher than usual strains in parts and are behaving differently to the global volume within that 0.61-mm radius zone.
In each region of focus, the observable influence of the central defect region (Zone 1) begins to diminish, shown by the progressive shift of the median toward the control value for Zones 2 and 3. Where the defect is having an influence, Zones 2 and 3 have the tail of their distributions shifted away from the global. Figure 8 and the zonal analysis indicate that the tissue is not uniformly damaged.
When studying the moderate-blast level, the sub-volumes showed similar deviation from the global average. A significant shift in the distributions was observed in Zones 1–3 in each region of focus in Figure 9 (p < 0.001). However, the magnitude of influence on the surrounding tissue that each focal defect showed was in one case different to the rest (see the first region analyzed in Figure 9). Comparing Zones 1 and 3 (p < 0.01) and Zones 1 and 2 (p < 0.05) indicates local differences between Zone 1 and its immediate surroundings. This particular defect is perhaps more focal in nature to the others studied. There is not just a shift in the distribution, given the final region analyzed in Figure 9 exhibits the largest difference in the medians (~25%). However, the tail was broadly composed of higher strained regions implying some subtle differences in strain or damage intensity. This zonal analysis is one way in which these regional effects on tissue mechanics can be quantified and analyzed.
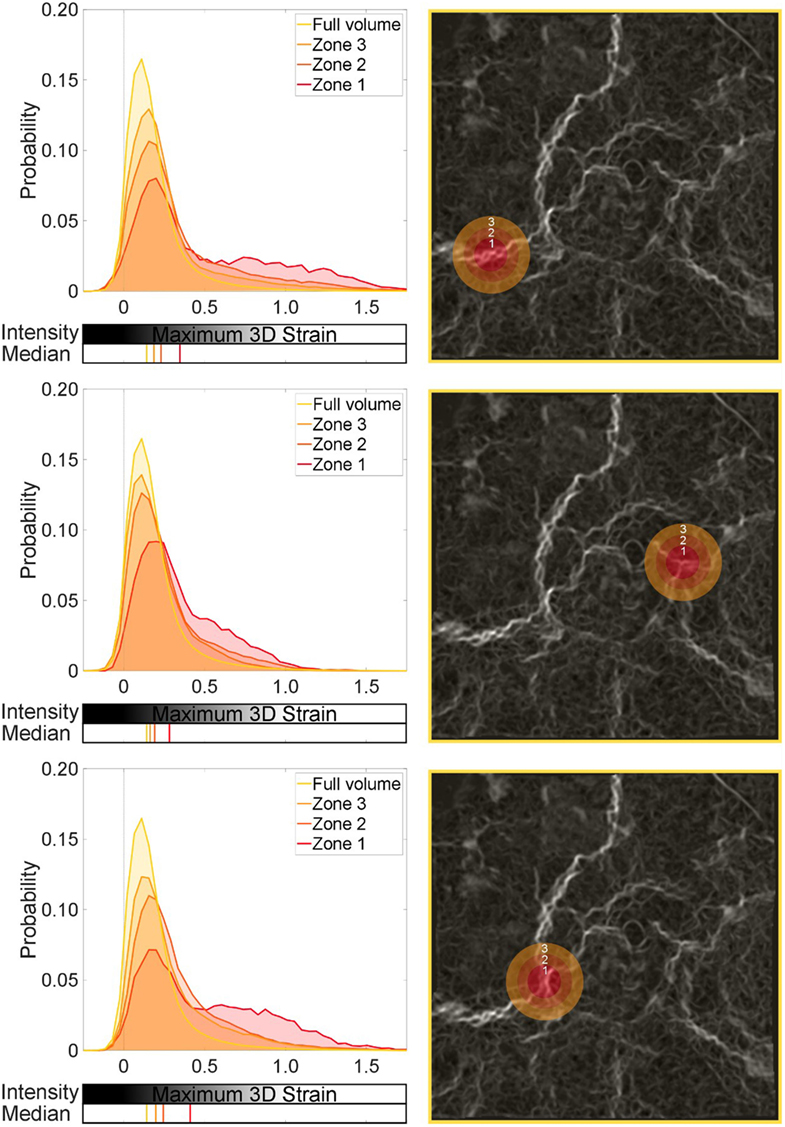
Figure 9. Global and local strain distributions around a strain concentration: moderate-level blast. Three regions are selected, with sequential spherical shell volumes analyzed to show the effect of the local strain discontinuity on the surrounding tissue. Zone 1 is the central sphere focused on a given strain concentration. Zones 2 and 3 are shells leading from Zone 1. The median for each distribution is also plotted.
This set of analysis implies no diffuse injury is present, but a localized event with a mild but significant effect on the neighboring tissue. Here, a focal zone (Zone 1 ~ 0.26-mm radius sphere) of blast injured tissue, indicated here by a region of high strains, can affect the surrounding region. This zone can modify the local strain distribution and shift it away from the global average, and even further away from the healthy conditions (referring to Figure 7). In real terms, this equates to a small region ~0.1 mm3 (Zone 1) that may be obviously damaged by the blast, potentially compromising a region 10 times that size in terms of the mechanics. The fact this is not observed throughout the specimen nor affecting the greater surrounding region of this lung volume (100% or full volume) supports the fact that this is a moderate-blast condition and a non-lethal dose (Barnett-Vanes et al., 2016).
Discussion
In this study, intact cadaveric rats were subjected to a range of blast exposures generated by a laboratory shock tube device. The specimens were preconditioned using a ventilator before and after blast to mitigate airway closure due to handling and inactivity. Lungs were excised ready for imaging and were ventilated between tomographic scans performed at DLS (I13-2 branch line). This allowed for the relative effects of any damage to be highlighted through use of DVC computation.
Studying the control (un-blasted) specimens, it was clear that the strain distributions were uniform for the most part in the air-filled regions. This experiment took advantage of the high-spatial resolution and relatively large field of view when performing tomography imaging with synchrotron sources. A larger lung volume was imaged at much higher acquisition speeds, compared to that achievable with conventional micro-CT methods, and lobular regions of the parenchyma were identified and studied.
Digital volume correlation enabled the interactions not only of the alveoli to be visualized but also the bulk parenchyma, including interactions between lobular regions. On a local scale, Figures 4 and 5 show the strains present in the microarchitecture. Here, the low levels of tension in the alveolar walls are visible. When expanding the field of view, interactions between lobes are also visible. Figure 5 highlighted how these more macroscopic interactions occur during simulated respiration, recording lung microstructure at two instantaneous lung volumes. Ventilation of the airways is a heterogeneous process. For slow or normal respiration conditions, the expansion of airways overall is uniform. The pathways associated with the microarchitecture are asymmetrical, and each path may not see the same local flow characteristics at a given instant. Therefore, it is very interesting to extract this level of detail about not only the alveoli on the microscale but also the surrounding interaction of airway structures on a macroscale.
The idealized model of uniform inflation within a given acinus, or group of alveoli, was confirmed by these low-level strain maps. However, where the tissue microstructure has been grossly affected by trauma, there was considerable strain concentration and an expansion in distribution of strains within the global tissue. Applied blast pressures (Figure 3) were in or below the level of the reported thresholds for lung injury (CR Bass et al., 2008). Previous research on BLI suggested the moderate blast case is survivable with no observable structural damage (Barnett-Vanes et al., 2016).
When lung is subject to blast, a large and dynamic pressure change is forced through the tissues and within the various airway paths. Each path has its own differing parallel pathway resistance. This would cause inhomogeneous loading (possible damage) and subsequent inflation between nearby alveolar ducts/acini. There are multiple interlinking processes in terms of solid and fluid mechanics, which are being studied here in terms of the tissue mechanics after blast. The strain differentials highlighted, although local, could cause problems in the long term, if not immediately disruptive.
This experiment aimed to explore beyond the visible damage and focus on the structural mechanics, studying the residual tissue mechanics of the lung via DVC. It was clear from Figure 6 how the structural organization and accommodation of the tissue changed in response to the same ventilation cycle, since regions of the blast injured lungs for both the low and moderate cases were hyperstrained. Signs from both blast cases indicated that there had not been any diffuse level of major damage. Spatial analysis of the strain fields highlighted the local zone of influence that these focal defects (high strained regions) had on the surrounding tissue. This reflects the usual experience that these are survivable injuries, since local tissue mechanics did not affect the surroundings to a major extent.
The strain concentrations observed could stabilize and remain constant. Alternatively, due to fatigue, it may cause deleterious effects, and this focal injury may spread within the lung. It is difficult to quantify at this stage how this focal injury may progress, but this process is certainly a possibility. BLI has been reported to exhibit non-visible lung damage soon after blast but, over a period of 24–48 hours, it may progress toward a critical and life-threatening injury (Scott et al., 2017). Potentially the augmentation of structural mechanics reported here plays a role in the degradation of the tissue, alongside the resulting physiological consequences.
Conclusion
This study has initiated a new fine resolution way to assess focal injury and novel methods for quantifying alveolar interdependency. Synchrotron tomography imaging was performed on blast injured lung tissue, and DVC was performed for the first time on these types of specimens. New insight on the subsequent effect of blast trauma on tissue mechanics at a microlevel was presented.
Three-dimensional strain maps within the lungs were analyzed to highlight alveolar interactions and how they differ in health and injury. The zone of influence of focal sites of hyperstraining tissue was quantified for blast loaded lung tissue. The effect of non-instantly fatal blast waves was explored and showed that the mechanical behavior of the lung has been significantly distorted in these cases. In the clinical context of BLI, this information provides new possible explanations as to why people may present delayed extreme symptoms of lung injury (combined with the known inflammatory pathway) or suffer exacerbated injury during treatment (mechanical ventilation).
This study was successful, and the data support the applicability of the technique to explore more blast conditions to further characterize the nature of BLI and identify potentially higher risk diffuse injury processes via this novel applied powerful imaging and image analysis method.
Ethics Statement
This study was performed on cadaveric tissue and is therefore exempt from approval required for in vivo experiments. However, all procedures were still approved by the Imperial College London ethical review process and strictly conformed to the Animals (Scientific Procedures) Act 1986 UK Home Office guidelines, which also fulfill the US NIH Guide for the Care and Use of Laboratory Animals.
Author Contributions
Conception of study: HA. Beam time application: RS, AB, AK, and HA. Shock loading development: T-TN, KV, and HA. Ventilation system development: JS, DO, KV, and HA. Image acquisition: AB, IM, AK, T-TN, KV, and HA. Image processing: DH, RS, PH, AN, and HA. Data analysis; reviewing and editing the manuscript: all authors. Writing the manuscript: HA.
Conflict of Interest Statement
The authors declare that the research was conducted in the absence of any commercial or financial relationships that could be construed as a potential conflict of interest.
Acknowledgments
The authors would like to thank Diamond Light Source for beamtime at I13-2 under proposal MT12864 and time at its associated data beamline (Bodey and Rau, 2016).
Funding
This work was conducted under the auspices of the Royal British Legion Centre for Blast Injury Studies at Imperial College London. The authors would like to acknowledge the financial support of the Royal British Legion. The authors would also like to acknowledge the Royal Society for their financial support of the image analysis portion of the study through their Research Grant Scheme.
Footnote
- ^Nguyen, T.-T. N., Brown, K. A., and Proud, W. G. (in preparation). Part I: a highly versatile shock tube system for cell, tissue and whole animal models of damage and blast injury. Appl. Phys. Lett. Bioeng.
References
Andrikakou, P., Vikraman, K., and Arora, H. (2016). On the behaviour of lung tissue under tension and compression. Sci. Rep. 6, 36642. doi: 10.1038/srep36642
Atwood, R. C., Bodey, A. J., Price, S. W. T., Basham, M., and Drakopoulos, M. (2015). A high-throughput system for high-quality tomographic reconstruction of large datasets at Diamond Light Source. Phil. Trans. R. Soc. A 373. doi:10.1098/rsta.2014.0398
Barnett-Vanes, A., Sharrock, A., Eftaxiopoulou, T., Arora, H., Macdonald, W., Bull, A. M. J., et al. (2016). CD43Lo classical monocytes participate in the cellular immune response to isolated primary blast lung injury. J. Trauma Acute Care Surg. 81, 500–511. doi:10.1097/TA.0000000000001116
Basham, M., Filik, J., Wharmby, M. T., Chang, P. C. Y., El Kassaby, B., Gerring, M., et al. (2015). Data Analysis WorkbeNch (DAWN). J. Synchrotron Radiat. 22, 853–858. doi:10.1107/S1600577515002283
Bay, B. K., Smith, T. S., Fyhrie, D. P., and Saad, M. (1999). Digital volume correlation: three-dimensional strain mapping using x-ray tomography. Exp. Mech. 39, 217–226. doi:10.1007/BF02323555
Black, L., Brewer, K. K., Morris, S. M., Schreiber, B. M., Toselli, P., Nugent, M. A., et al. (2005). Effects of elastase on the mechanical and failure properties of engineered elastin-rich matrices. J. Appl. Physiol. (1985) 98, 1434–1441. doi:10.1152/japplphysiol.00921.2004
Bodey, A. J., and Rau, C. (2016). Launch of the I13-2 data beamline at the Diamond Light Source synchrotron. J. Phys. Conf. Ser. 849. doi:10.1088/1742-6596/849/1/012038
CR Bass, K. A., Rafaels, K. A., and Salzar, R. S. (2008). Pulmonary injury risk assessment for short-duration blasts. J. Trauma 65, 604–615. doi:10.1097/TA.0b013e3181454ab4
Denny, E., and Schroter, R. C. (2006). A model of non-uniform lung parenchyma distortion. J. Biomech. 39, 652–663. doi:10.1016/j.jbiomech.2005.01.010
Eftaxiopoulou, T., Barnett-Vanes, A., Arora, H., Macdonald, W., Nguyen, T.-T. N., Sharrock, A. E., et al. (2015). Prolonged but not short-duration blast waves elicit acute inflammation in a rodent model of primary blast limb trauma. Injury 47, 625–632. doi:10.1016/j.injury.2016.01.017
Garner, J., Watts, S., Parry, C., Bird, J., Cooper, G., and Kirkman, E. (2010). Prolonged permissive hypotensive resuscitation is associated with poor outcome in primary blast injury with controlled hemorrhage. Ann. Surg. 251, 1131–1139. doi:10.1097/SLA.0b013e3181e00fcb
Gillard, F., Boardman, R., Mavrogordato, M., Hollis, D., Sinclair, I., Pierron, F., et al. (2014). The application of digital volume correlation (DVC) to study the microstructural behaviour of trabecular bone during compression. J. Mech. Behav. Biomed. Mater. 29, 480–499. doi:10.1016/j.jmbbm.2013.09.014
Hoppin, F. G. Jr., Lee, G. C., and Dawson, S. V. (1975). Properties of lung parenchyma in distortion. J. Appl. Physiol. (1985) 39, 742–751.
Kohsuke, H., Manabu, K., Hiroki, M., Shunichi, S., Hiromi, M., Shinji, T., et al. (2016). Fibrinogen γ-chain peptide-coated adenosine 5’ diphosphate-encapsulated liposomes rescue mice from lethal blast lung injury via adenosine signaling. Crit. Care Med. 44, 827–837. doi:10.1097/CCM.0000000000001707
Matsuda, M., Fung, Y. C., and Sobin, S. S. (1987). Collagen and elastin fibers in human pulmonary alveolar mouths and ducts. J. Appl. Physiol. (1985) 63, 1185–1194.
Mercer, R. R., Russell, M. L., and Crapo, J. D. (1994). Alveolar septal structure in different species. J. Appl. Physiol. (1985) 77, 1060–1066.
Nguyen, T.-T. N. (2016). The Characterisation of a Shock Tube System for Blast Injury Studies. Doctoral Thesis, United Kingdom: Imperial College London.
Nguyen, T.-T. N., Wilgeroth, J. M., and Proud, W. G. (2014). Controlling blast wave generation in a shock tube for biological applications. J. Phys. Conf. Ser. 500, 142025. doi:10.1088/1742-6596/500/14/142025
Palanca, M., Tozzi, G., Cristofolini, L., Viceconti, M., and Dall’Ara, E. (2015). 3D local measurements of bone strain and displacement: comparison of three digital volume correlation approaches. J. Biomech. Eng. 137, 1–14. doi:10.1115/1.4030174
Roberts, B. C., Perilli, E., and Reynolds, K. J. (2014). Application of the digital volume correlation technique for the measurement of displacement and strain fields in bone: a literature review. J. Biomech. 47, 923–934. doi:10.1016/j.jbiomech.2014.01.001
Schreier, H., Orteu, J.-J., and Sutton, M. A. (2009). Image Correlation for Shape, Motion and Deformation Measurements: Basic Concepts, Theory and Applications. Springer.
Scott, T. E. (2016). Primary Blast Lung Injury, Blast Injury Science and Engineering, a Guide for Clinicians and Researchers. Birmingham: Springer.
Scott, T. E., Kirkman, E., Haque, M., Gibb, I. E., Mahony, P., and Hardman, J. G. (2017). Primary blast lung injury – a review. Br. J. Anaesth. 118, 311–316. doi:10.1093/bja/aew385
Sera, T., Fujioka, H., Yokota, H., Makinouchi, A., Himeno, R., Schroter, R. C., et al. (2004). Localized compliance of small airways in excised rat lungs using microfocal X-ray computed tomography. J. Appl. Physiol. (1985) 96, 1665–1673. doi:10.1152/japplphysiol.00624.2003
Suki, B., Ito, S., Stamenovic, D., Lutchen, K. R., and Ingenito, E. P. (2005). Biomechanics of the lung parenchyma: critical roles of collagen and mechanical forces. J. Appl. Physiol. (1985) 98, 1892–1899. doi:10.1152/japplphysiol.01087.2004
Titarenko, V. (2016). Analytical formula for two-dimensional ring artefact suppression. J. Synchrotron Radiat. 23, 1447–1461. doi:10.1107/S160057751601479X
Keywords: digital volume correlation, blast lung injury, synchrotron tomography, lung microstructure, shock tube, lung biomechanics
Citation: Arora H, Nila A, Vitharana K, Sherwood JM, Nguyen T-TN, Karunaratne A, Mohammed IK, Bodey AJ, Hellyer PJ, Overby DR, Schroter RC and Hollis D (2017) Microstructural Consequences of Blast Lung Injury Characterized with Digital Volume Correlation. Front. Mater. 4:41. doi: 10.3389/fmats.2017.00041
Received: 27 August 2017; Accepted: 20 November 2017;
Published: 13 December 2017
Edited by:
Gianluca Tozzi, University of Portsmouth, United KingdomReviewed by:
Stephane Avril, Centre Ingénierie et Santé, Ecole des Mines de Saint-Étienne, FranceSourav Chatterjee, Facebook, United States
Copyright: © 2017 Arora, Nila, Vitharana, Sherwood, Nguyen, Karunaratne, Mohammed, Bodey, Hellyer, Overby, Schroter and Hollis. This is an open-access article distributed under the terms of the Creative Commons Attribution License (CC BY). The use, distribution or reproduction in other forums is permitted, provided the original author(s) or licensor are credited and that the original publication in this journal is cited, in accordance with accepted academic practice. No use, distribution or reproduction is permitted which does not comply with these terms.
*Correspondence: Hari Arora, hari.arora@swansea.ac.uk