 Rosanna Coates-Brown
 Josephine C. Moran†
 Alistair C. Darby
 Malcolm J. Horsburgh
- Institute of Integrative Biology, University of Liverpool, Liverpool, United Kingdom
The bacterial genus Staphylococcus comprises diverse species with most being described as colonizers of human and animal skin. A relational analysis of features that discriminate its species and contribute to niche adaptation and survival remains to be fully described. In this study, an interspecies, whole-genome comparative analysis of 21 Staphylococcus species was performed based on their orthologues. Three well-defined multi-species groups were identified: group A (including aureus/epidermidis); group B (including saprophyticus/xylosus) and group C (including pseudintermedius/delphini). The machine learning algorithm Random Forest was applied to prioritize orthologs that drive formation of the Staphylococcus species groups A-C. Orthologues driving staphylococcal intrageneric diversity comprised regulatory, metabolic and antimicrobial resistance proteins. Notably, the BraSR (NsaRS) two-component system (TCS) and its associated BraDE transporters that regulate antimicrobial resistance showed limited distribution in the genus and their presence was most closely associated with a subset of Staphylococcus species dominated by those that colonize human skin. Divergence of BraSR and GraSR antimicrobial peptide survival TCS and their associated transporters was observed across the staphylococci, likely reflecting niche specific evolution of these TCS/transporters and their specificities for AMPs. Experimental evolution, with selection for resistance to the lantibiotic nisin, revealed multiple routes to resistance and differences in the selection outcomes of the BraSR-positive species S. hominis and S. aureus. Selection supported a role for GraSR in nisin survival responses of the BraSR-negative species S. saprophyticus. Our study reveals diversification of antimicrobial-sensing TCS across the staphylococci and hints at differential relationships between GraSR and BraSR in those species positive for both TCS.
Background
Staphylococcus Species and Genomics
The existence of taxonomically distinct species groups was first proposed for Staphylococcus based on differential DNA–DNA hybridization methods (Kloos et al., 1991). These groups were supported by 16S rDNA sequence analysis of 38 taxa (Takahashi et al., 1999) and multilocus sequence data of around 60 species and subspecies (Lamers et al., 2012).
A comparative analysis that utilized next generation genome sequencing data of staphylococci to probe phylogenetic relationships with 491 shared orthologues across 12 Staphylococcus species (Suzuki et al., 2012) proposed S. pseudintermedius and S. carnosus as the most basal lineages. Moreover, with 10 species in their analysis being residents of human skin, the authors proposed that evolution selected for human adaptation after branching from S. carnosus. The relationships between the strains generated from shared orthologues were maintained using total gene content (Suzuki et al., 2012). However, in contrast to the conclusions of 16S rDNA and multilocus data (Takahashi et al., 1999; Lamers et al., 2012) their analysis revealed discrete clustering of Staphylococcus species. In contrast with this analysis, no distinct clustering of S. hominis with S. haemolyticus was observed, and S. saprophyticus was assigned to the S. epidermidis group of species (Suzuki et al., 2012). Currently, there is a knowledge gap in Staphylococcus species comparisons with a need to determine if this clustering of staphylococcal species is supported using whole genome data. Our findings here begin to close this gap.
Two Component Systems
Prokaryotes are receptive to environmental stimuli through diverse sensory and transducing two component systems (TCS). These TCS archetypically comprise a sensor histidine kinase (HK) that spans the cell membrane to interact with the external environment. Stimulus perception causes conditional autophosphorylation that is relayed to an interacting response regulator (RR) to enable DNA-binding directed transcription modulation (Stock et al., 2000).
While TCS are widespread and diverse across prokaryotes, the intramembrane-sensing histidine kinases (IM-HK) are specific to the Firmicutes. This family of small HKs has a short, 25 amino acid linker region between each 400 amino acid transmembrane helix. S. aureus GraSR uses a IM-HK to regulate a global network responsible for resistance to antimicrobial peptides (AMPs). GraSR modulates the expression of DltABCD and MprF that in concert alter the S. aureus surface charge to evade electrostatic interaction-mediated targeting of cationic AMPs (Falord et al., 2011).
An orthologous TCS to GraSR described in S. aureus was concurrently designated BraSR and NsaSR by two different groups (Blake et al., 2011; Hiron et al., 2011). Serial passage in sub-MIC concentrations of the lantibiotic nisin was shown to select increased nisin MIC due to a SNP in nsaS gene encoding sensor histidine kinase of NsaRS (nisin susceptibility-associated sensor regulator) (Blake et al., 2011). The TCS was separately designated BraSR (bacitracin resistance-associated sensor regulator) from the reduced MIC of bacitracin and nisin determined for the TCS gene mutant (Hiron et al., 2011). BraR binding sites were revealed upstream of the ABC transporter genes braDE and vraDEH (Popella et al., 2016) that were not transcribed in the mutant but induced in the presence of bacitracin. The transporter BraDE contributes to the detection of nisin and bacitracin and subsequent signal transduction via BraSR, whereas VraDE is more directly involved in detoxification by efflux (Hiron et al., 2011). Transcription of braSR is increased following exposure to multiple antibiotics, including ampicillin, phosphomycin and nisin. Inactivation of braS (nsaS) revealed differential transcription of 245 genes (Kolar et al., 2011), revealing the TCS might report cell envelope stress to directly regulate biofilm formation, cellular transport and responses to anoxia.
In this study, a comparative genome analysis of 21 Staphylococcus species was performed based upon their orthologous gene content. Species groups were revealed and then interrogated using the Random Forest algorithm to identify group-contributing genes. The operon encoding the BraSR TCS was found to differentiate the S. aureus/S. epidermidis species group from other species groups determined in the study and the TCS was found to have restricted distribution across 49 species of Staphylococcus. Experimental evolution of representative braSR-positive and -negative species with nisin selection identified differential selection of BraSR and GraSR to produce resistance to this AMP.
Results and Discussion
Analysis of Orthologous Gene Content Across the Staphylococci
The orthologous gene content of 21 sequenced staphylococcal species’ genomes (Table 1) was determined using OrthoMCL to group orthologous genes (homologues separated by speciation) into clusters across the different species. The number of shared orthologous clusters between the different species’ genomes was then represented as a heatmap (Figure 1). The output from this analysis revealed the assembly of three major groups of species, each with high numbers of shared orthologous clusters. An associated cladogram supported three groups (groups A, B, and C) when defined as containing three or more species (Figure 1). This supported previous reported groupings from 16S rDNA and multilocus analyses (Takahashi et al., 1999; Lamers et al., 2012). Additionally, three species pairs showed a high degree of shared orthologous clusters of genes and branched together in the cladogram: S. aureus/S. simiae, S. simulans/S. carnosus, and S. lentus/S. vitulinus. S. aureus and S. simiae were proposed as members of the S. aureus group of staphylococci from gene content (Takahashi et al., 1999).
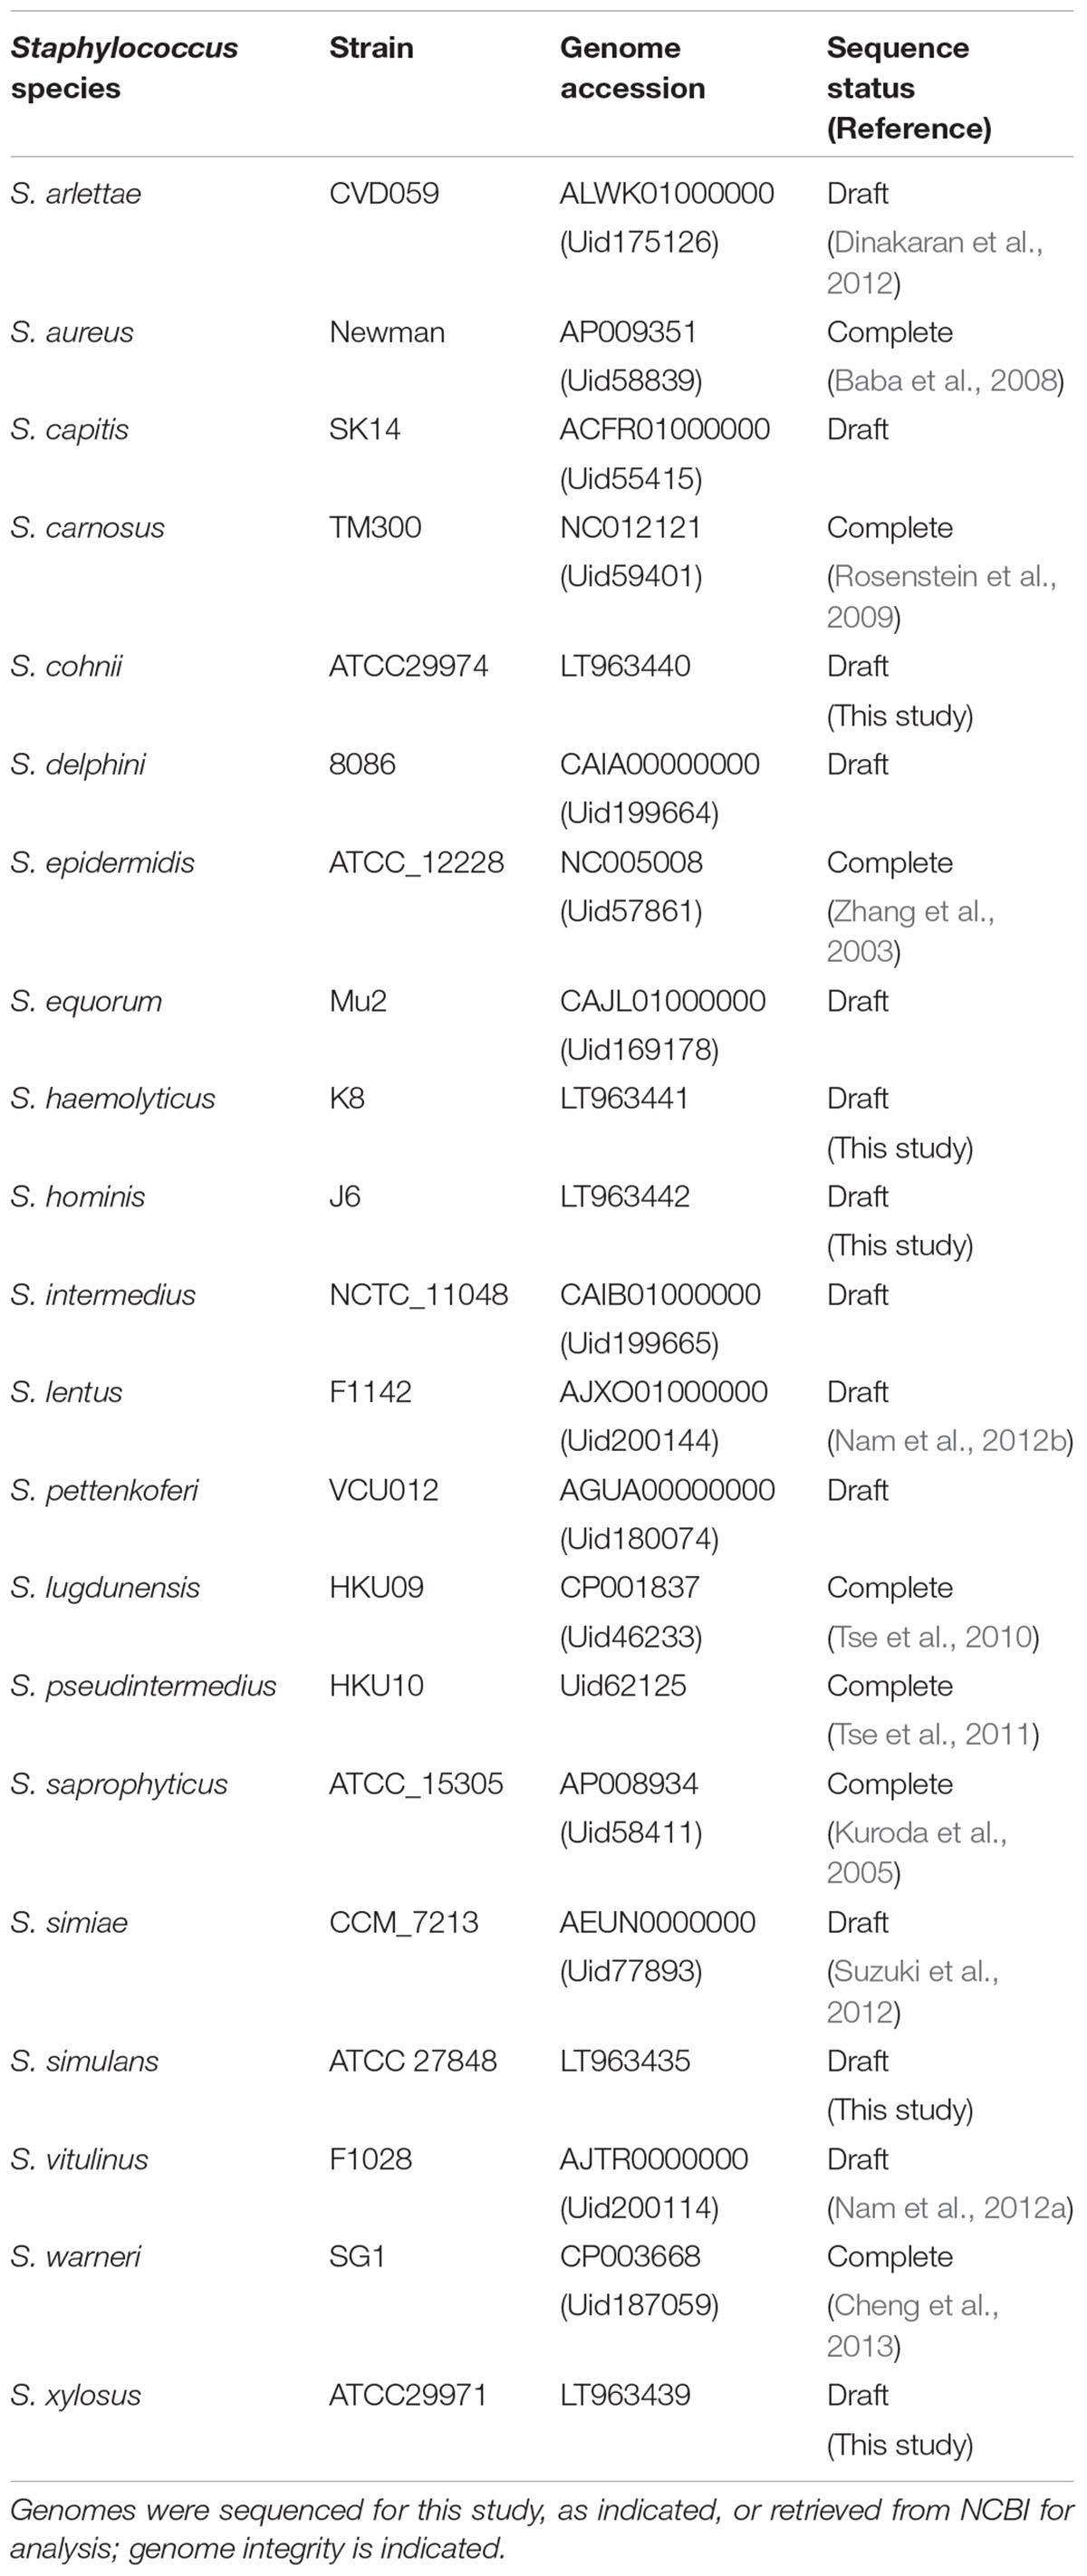
TABLE 1. Staphylococcus species and strains included in OrthoMCL analysis.
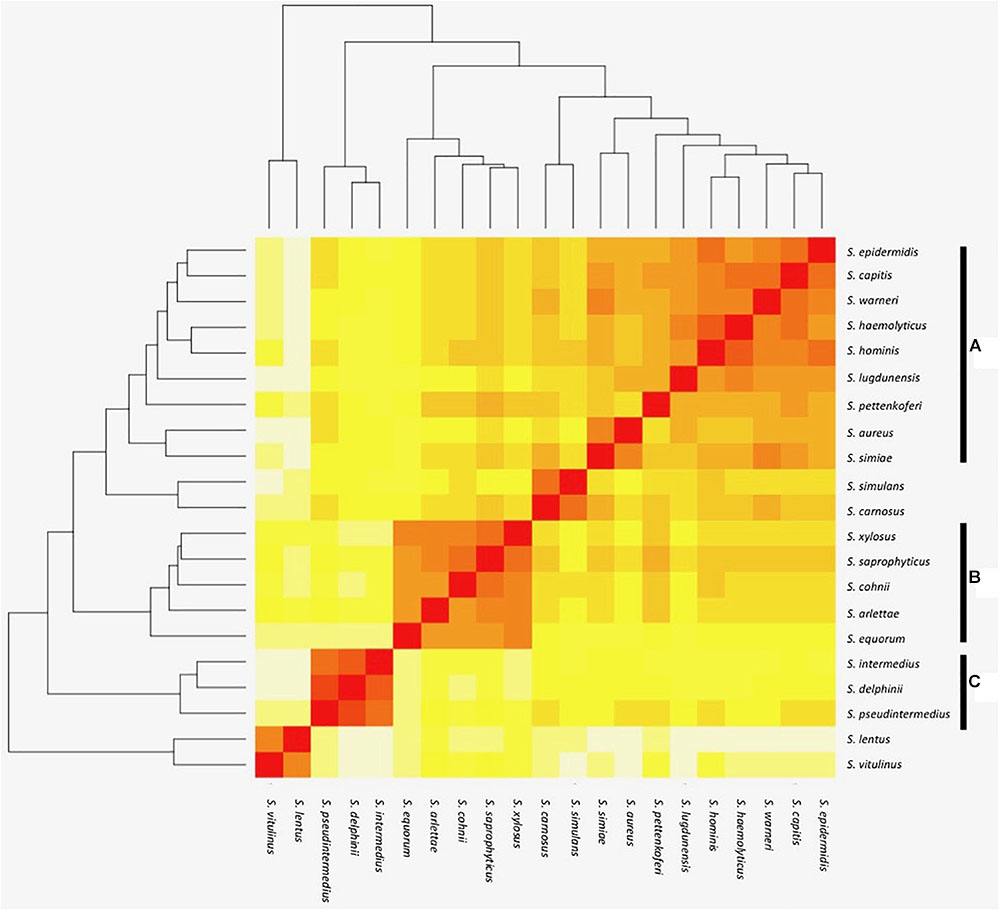
FIGURE 1. Heat map representation of shared orthologous proteins across Staphylococcus species. Presence is indicated using a color scale from red (highest number of shared clusters of orthologous proteins) to white (lowest number). Major groups of species observed in the analysis are highlighted as groups A–C.
The largest and least well-defined, species group comprises S. epidermidis, S. capitis, S. warneri, S. haemolyticus, S. hominis, S. lugdunensis, S. pettenkoferi, S. aureus, and S. simiae (Figure 1). Designated group A, it is dominated by species that colonize human skin (Kloos, 1980; Schleifer and Bell, 2015). The likelihood of a strain-dependent effect structuring group A was investigated by substituting S. epidermidis, S. hominis, and S. aureus strains based on multiple available genomes (Table 1 and Supplementary File S1). Substituting these individual species with alternative strains and repeating the OrthoMCL analysis did not alter species groupings. Groups B and C were similarly unaffected by switching strains of S. saprophyticus and S. pseudintermedius, respectively.
The smaller species group B comprises S. equorum, S. arlettae, S. cohnii, S. saprophyticus, and S. xylosus (Figure 1). Though not universal, a frequent lifestyle identified in the group B species is human or animal host colonization; several species are associated with meat products and novobiocin resistance (Devriese et al., 1985; Bannerman et al., 1991) with commonalities in their cell wall composition (Schleifer et al., 1984).
Species group C comprises S. pseudintermedius, S. delphini, and S. intermedius and this collective was previously designated the S. intermedius group (SIG); the species cause opportunistic infection of companion animals and equids (Devriese et al., 1985). Emerging antibiotic resistance in the SIG species group is a clinical veterinary concern (Stull et al., 2014) and their routine speciation is complicated by their high degree of 16S rRNA locus sequence identity (Slettemeås et al., 2010).
While preserving known species groupings, the whole genome analysis identified discrete species groups of staphylococci (A-C) and an explanation for their formation was sought. Genetic determinants directing the formation of species group A were tested in R using machine learning with the Random Forests algorithm for classification (Breiman, 2001). This algorithm was used to identify variables, in this case OrthoMCL clusters (data not shown), that contributed to formation of the groups, based on a forest of trees generated from these variables. A gene from each cluster was then determined and mapped back to a representative genome and the PROKKA annotation of each protein coding sequence was verified using BLAST, for group A this representative was S. epidermidis. Contributing variables were investigated for group A, based on the strain set described in Table 1, where permutations were used to verify the existence and reproducibility of species groups (Supplementary File S1).
Clusters Driving Formation of Group a Species
The presence of 7 and absence of 6 OrthoMCL clusters collectively contribute to defining group A, with differing levels of support (Mean Decrease in Accuracy [MDA] values) (Table 2 and Supplementary File S2). Four orthologs that are sequentially encoded in the genome as an operon (epi_02134 - epi_02137; MDA 3.2, 3.0, 2.6, 2.2, respectively) were also the most strongly supported in this analysis (Table 2). The latter cluster pair epi_02136/epi_02137 was annotated by PROKKA as a TCS sensor/regulator (Table 2 and Supplementary File S2) and shares ∼100% similarity with BraSR (SA2417/SA2418 of S. aureus N315), a TCS associated with resistance to AMPs nisin and bacitracin (Hiron et al., 2011). The adjacent clusters encoded in the same operon (epi_02134, epi_02135) comprise the BraD/BraE ABC transporter subunits with 98 and 99% similarity with SA2415/SA2416 of S. aureus N315, respectively (Hiron et al., 2011). We demonstrate as a key finding of our analysis that BraSR and BraDE are associated with genomes of group A Staphylococcus species.
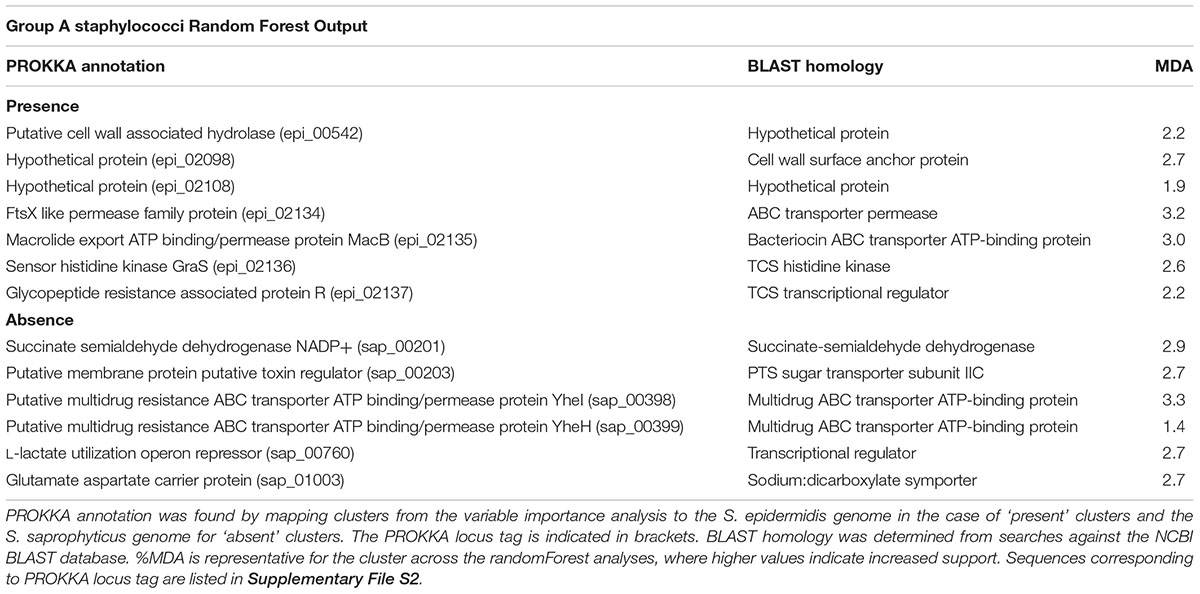
TABLE 2. Proteins driving formation of species group A.
The presence of orthologue epi_00542 (MDA 2.2; Table 2 and Supplementary File S2) contributes to species group A, with support that the protein functions as a putative cell wall hydrolase from the Nlp-P60 family hydrolase domain that is associated with hydrolysis of peptidoglycan. Also, contributing to defining group A are the absences of two orthologue clusters (sap_00398; MDA 3.3 and sap_00399; MDA 1.4; Table 2 and Supplementary File S2) that are annotated as multidrug ABC transporters. A range of cytotoxic molecules are mobilized across the cell membrane by multidrug ABC transporters where certain families of these can also act as sensors (Stock et al., 2000; Rietkötter et al., 2008). Across staphylococcal groups, differential repertoires of ABC transporters associated with antimicrobial survival are consistent with the importance of community competition in species evolution.
Sequence variation of the NADP-dependent succinate semialdehyde dehydrogenase (SSADH) between group A staphylococci versus groups B and C was identified by the association of cluster sap_00201 (MDA 2.9, Table 2 and Supplementary File S2) with group A species; this variation might be allied to differences in glutamate metabolism across the genus. Glutamate is involved in multiple metabolic processes and bacterial glutamate dehydrogenase catabolizes glutamate, which contributes to acid tolerance. NADP-SSADH catalyzes catabolism of γ-aminobutyrate, a product of glutamate dehydrogenase activity (Feehily and Karatzas, 2013); this pathway is oxidative stress sensitive owing to the catalytic cysteine residue of SSADH.
With respect to clusters driving formation of group B and C species, the size of species input groups B and C (Figure 1) limit use of the random forest algorithm. Consequently, a similar species-defined analysis of groups B and C is not included and a broader species comparison of staphylococci could be considered in future.
Diversity of Cationic AMP Survival Loci Across the Staphylococci
The described comparative genomic analysis revealed that while BraSR TCS is associated with group A species of staphylococci, the GraSR TCS is distributed across all species groups. Supporting predictions from the Random Forest analysis, low sequence identity of BraR/BraS with GraR/GraS was confirmed. BraR mean sequence identity with GraR of group A (44%) and group B/C species (40%) was greater than that of BraS compared with GraS of group A and groups B/C (mean ∼30% and ∼26%, respectively) (Table 3).
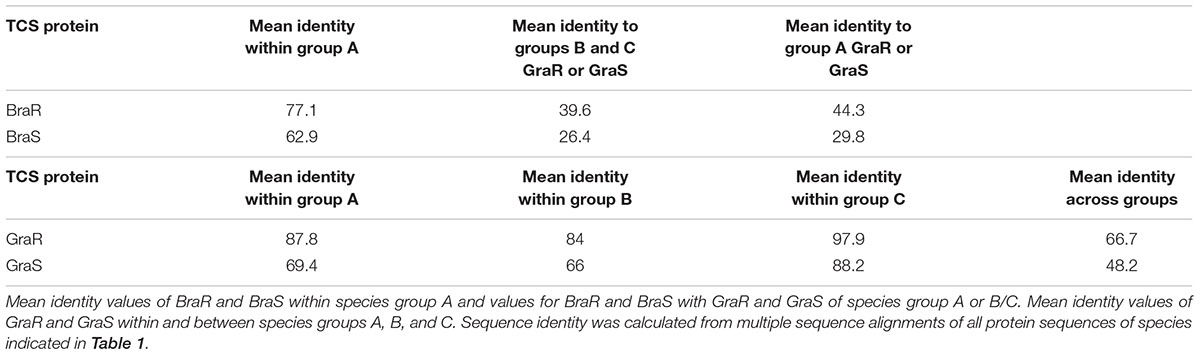
TABLE 3. Comparative sequence identity of the BraRS and GraRS TCS across species groups A–C.
High mean sequence identity (84–98%) of GraR regulator protein occurs within each of the three species groups (Table 3) with divergence of GraR between species groups identified by lower mean sequence identity (67%). GraS sensor histidine kinase was less conserved within species groups A (mean 69%) and B (mean 66%), compared with GraS of species group C that shared greatest mean sequence identity (88%), albeit that group C defined here is a small, related species set. Both BraS and GraS sensor proteins have lower sequence conservation across staphylococci than BraR and GraR (Table 3). The reduced divergence of these response regulators might reflect their relative isolation from selection by the external environment and differential stimuli.
Responses to cationic AMPs in the staphylococci are complex (Peschel and Collins, 2001; Herbert et al., 2007) and ligand specificity could account for species divergence of GraSR and BraSR TCS. This evolutionary outcome could be explained with strong selection pressure driven by ubiquity and diversity of cAMPs in staphylococcal niches. One intrigue in our analysis is the absence of GraSR and presence of only BraSR TCS in the group A species, S. pettenkoferi, with the sole related sensor protein having a mean sequence identity of 27% with group A GraS but 58% with group A BraS. S. pettenkoferi BraR has a mean sequence identity of 47% with GraR and 73% with BraR from group A. These values support the S. pettenkoferi TCS is a BraSR ortholog. GraSR was also absent and BraSR present in the four additional publicly available S. pettenkoferi genome sequences (strains 1286_SHAE, 589_SHAE, UMB0834 and CCUG 51270). The absence of GraSR in S. pettenkoferi raises questions about the evolution of BraSR in group A staphylococci. Gene duplication of GraSR in a group A species, with subsequent sequence divergence over time to BraSR and spread throughout group A species by horizontal gene transfer, is tempting to suggest. S. pettenkoferi having BraSR but not GraSR presents a challenge to this paralog hypothesis. We propose two possibilities; S. pettenkoferi may have suffered deletion of graSR following acquisition of braSR, or S. pettenkoferi never acquired braSR, but rather its TCS evolved from ancestral genes. Such a scenario would enable group A organisms to acquire braSR from S. pettenkoferi as an additional and sufficiently divergent TCS locus.
Staphylococcus species genomes sequenced recently were investigated for their encoded GraS and BraS protein homologues, which supported the limited distribution of BraS in staphylococci as identified in the Random Forest analysis (Table 4 and Supplementary File S3). Furthermore, it revealed additional species encoding BraSR but not GraSR (S. agnetis, S. auricularis, S. chromogenes, S. hyicus, S. massiliensis). Regardless of the origins of both TCSs, the divergence between and within GraSR and BraSR likely reflect specificities for their ligands and selection driven by the niches to which the staphylococci are specialized.
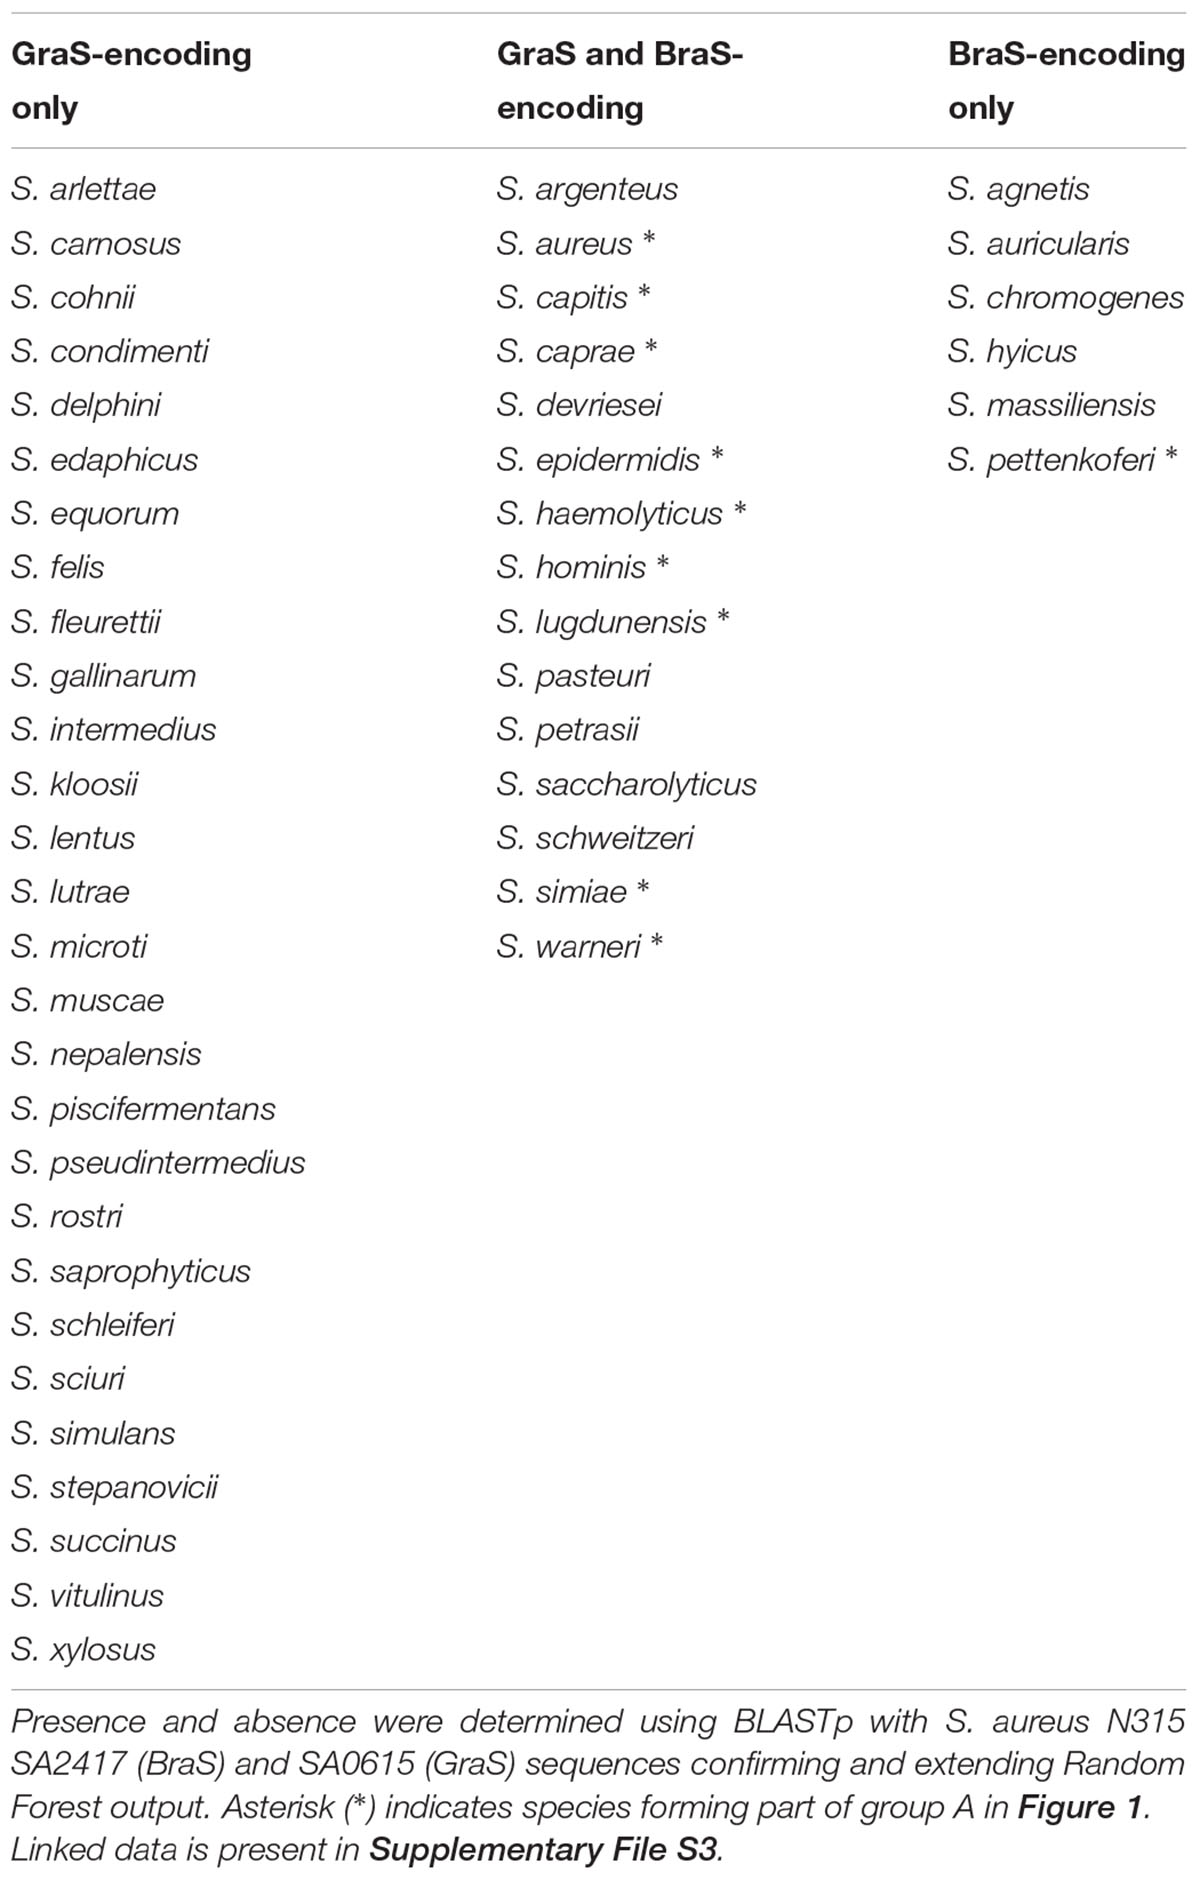
TABLE 4. Presence and absence of GraS and BraS across 49 Staphylococcus species.
GraSR and BraSR-Associated ABC Transporters
Both GraSR and BraSR, as members of the BceS-like IM-HK family of TCS, are activated by AMP ligand bound to an associated ABC transporter (Mascher, 2014). Given the important function of these TCS, the conservation of their associated transporter protein sequences was compared across the staphylococci.
VraFG is the GraSR-associated ABC transporter (Meehl et al., 2007) and in the genomes encoding VraFG (absent from group B species and S. pettenkoferi) there is a high degree of shared protein sequence conservation. VraF has a mean sequence identity of 68% across the staphylococci examined (Table 1), with greatest conservation within species groups (group A, 79% identity; group B, 85.3% identity; group C, 96.8% identity). Shared sequence identity among the VraG proteins was 47.5%, with 88%, 65.2 and 61.9% identity within groups A, B, and C, respectively. The BraDE ABC transporter associated with BraSR was identified in group A species and, similar to VraFG, revealed greater identity (68.4%) across BraD sequences compared with BraE (38.9%) protein sequences. Divergence within BraSR and GraSR-associated transporters has likely arisen from concurrent evolution of the ABC transporter specificities for AMPs.
Experimental Evolution of Nisin Resistance in S. aureus, S. hominis and S. saprophyticus
Previous studies demonstrated that selection by experimental evolution identified mutations conferring antimicrobial resistance in overarching regulators, notably SNPs in braS revealed roles for BraSR in nisin sensing and survival (Hiron et al., 2011). Following our identified species association of BraSR to group A staphylococci, we adopted an experimental evolution strategy to interrogate the contributions of GraSR and BraSR TCS under selection for nisin resistance.
Strains of group A species, S. aureus and S. hominis plus group B S. saprophyticus were each serially passaged in triplicate cultures with increasing concentrations of nisin using a microtiter plate method, with an equivalent sodium citrate buffer control passaged in parallel. Stepwise increases in nisin MIC were observed for all strains tested with no obvious pattern in the rate of resistance acquisition between the species. After selection, both S. aureus 171 and S. aureus SH1000 strains exhibited ∼100-fold increases in nisin MIC, a greater fold increase in resistance than that observed by Blake et al (2011; Hiron et al., 2011), which may be due to experimental design differences. Selection of both S. hominis strains increased nisin MIC ∼25-fold, and S. saprophyticus strains CCM_883 and CCM_349 showed 80-fold and 5-fold increases, respectively. Multiple clones of S. aureus 171, S. hominis J31 and S. saprophyticus CCM883 were genome sequenced to identify sequence variants that potentially contributed to increased nisin MIC. T0 genomes were assembled and annotated, then reads from three pools (each comprising 5 independent clones) and one individual clone of each experimentally evolved species were aligned to their respective assembled genomes to identify sequence variants (SNPs, insertions/deletions) specific to nisin selection (Tables 5–7).
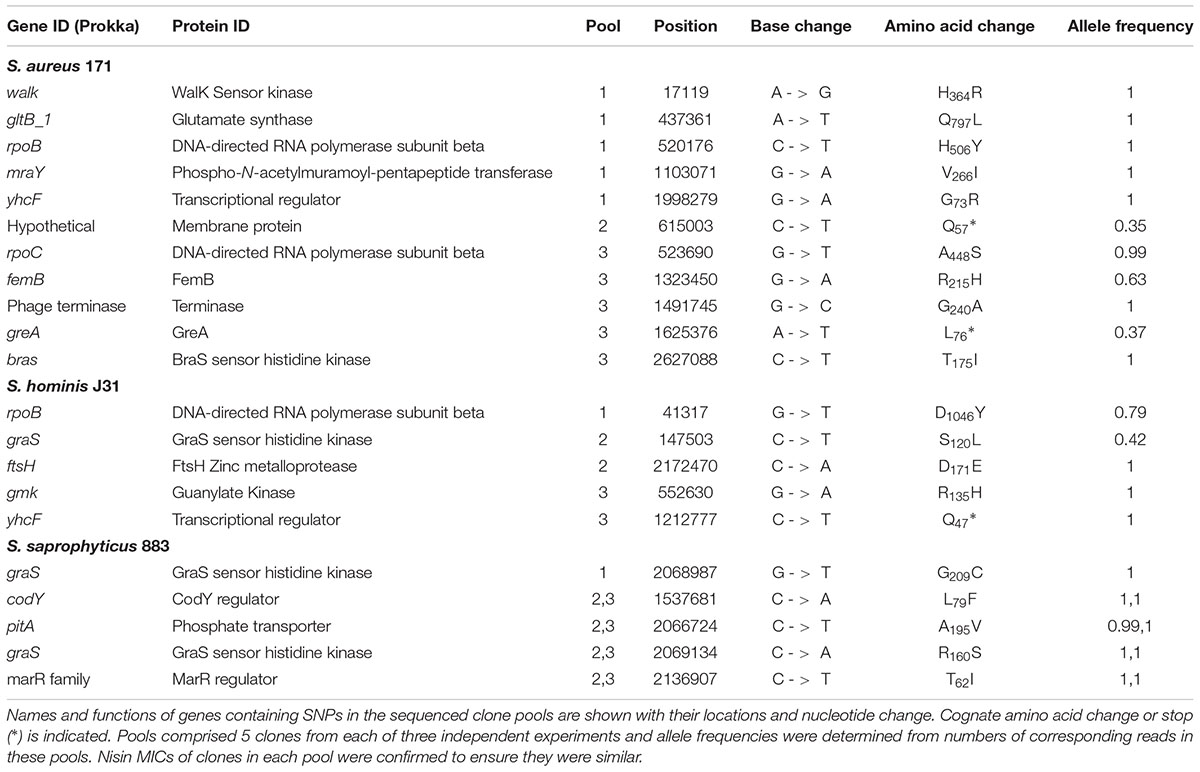
TABLE 5. Non-synonymous, homozygous SNPs from independent clone pools of staphylococci after nisin selection.
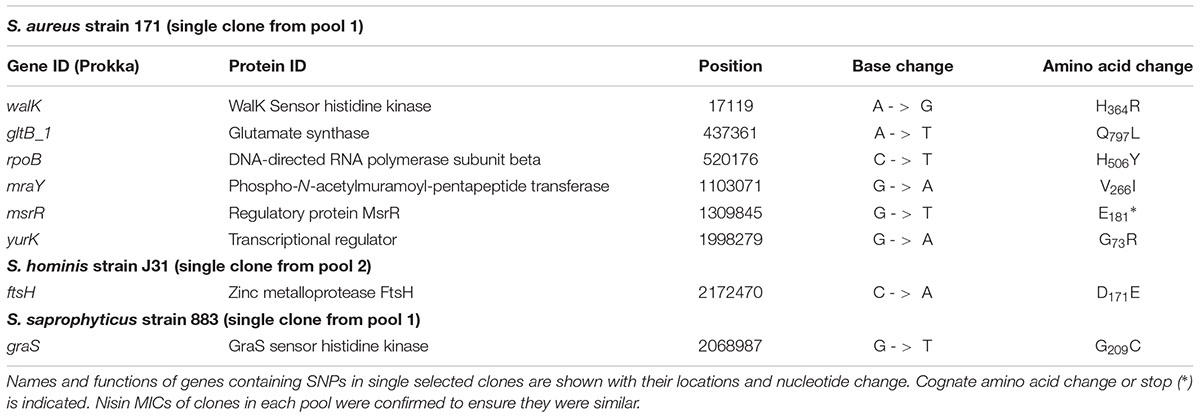
TABLE 6. Non-synonymous, homozygous SNPs from single clones of S. aureus, S. hominis, and S. saprophyticus after nisin selection.
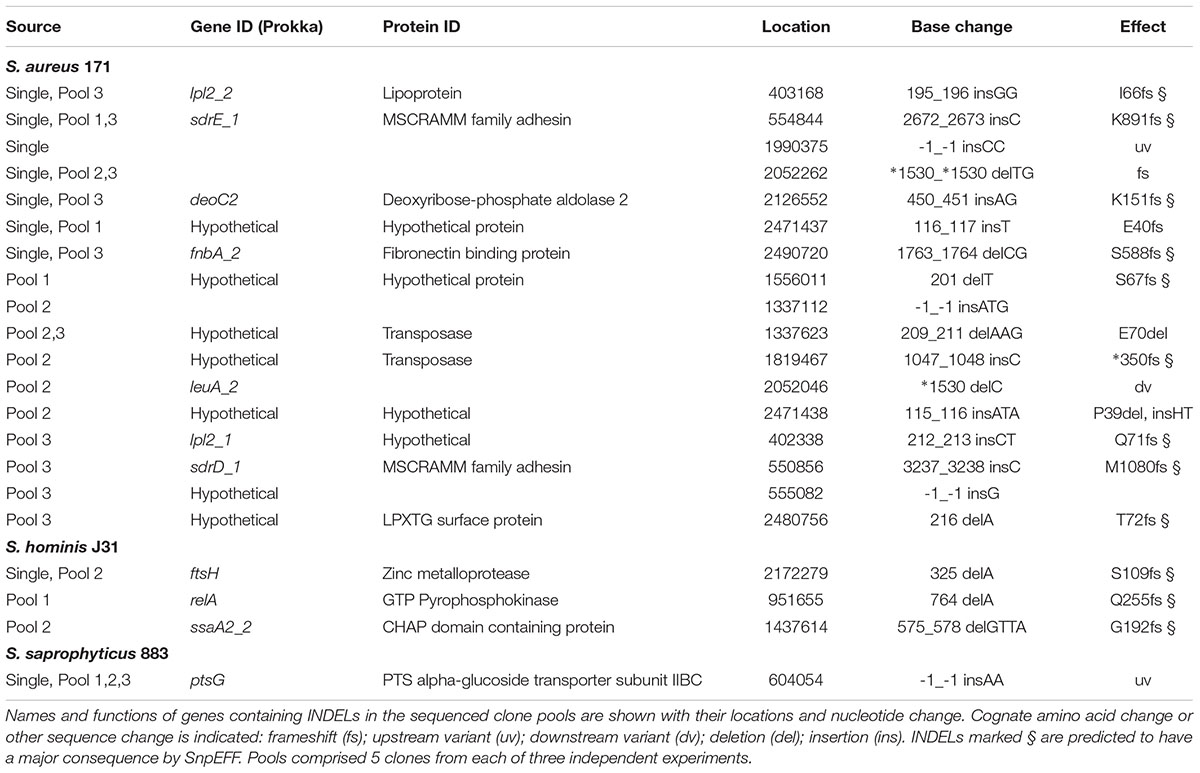
TABLE 7. INDELs from nisin selection pools and single clones of S. aureus, S. hominis, and S. saprophyticus.
Nisin-Selected SNPs in Staphylococci
Experimental evolution of S. saprophyticus identified a SNP in graS (GraS: A160S; Table 5) that was present in two clone pools, and SNP graS G209C in a third pool. A single clone sequenced from the latter pool identified only one SNP in graS (GraS: G209C) and an upstream variant associated with ptsG (Table 5). These data provide support for GraSR contributing to nisin resistance in S. saprophyticus given the absence of the BraSR TCS in this group B Staphylococcus species. Aside from TCS, other regulators may contribute to the nisin response in S. saprophyticus as evidenced by an identical SNP identified in two separate nisin resistance selections (pools 2 and 3) corresponding to a T62I change in an uncharacterized MarR transcriptional repressor.
In both S. aureus and S. hominis there are multiple pathways to high-level nisin resistance. Each species revealed SNPs in TCS systems, but these differed across the parallel selection experiments (Tables 5–7). In S. aureus, a non-synonymous SNP in braS (BraS: T175I) was present in 100% of reads from one sequenced pool, differing from previous work that identified a discrete braS SNP (BraS: A208E) (Hiron et al., 2011). Evidence for a second TCS contributing to nisin resistance arose from a walK non-synonymous SNP (WalK: H364R) within the diverse and flexible signal sensing PAS domain of WalK in S. aureus (Hefti et al., 2004). WalKR is essential and functions to maintain cell wall metabolism (Delaune et al., 2012) and SNPs in this TCS contribute to vancomycin and daptomycin resistance due to cell wall-thickening (Howden et al., 2011). Should this cell wall phenotype be associated with the H364R WalK variant it could similarly limit nisin interaction with its lipid II target to abrogate pore formation. A large overlap was reported between the WalKR and GraSR regulatory networks in S. aureus (Falord et al., 2011).
In S. hominis, a graS SNP (GraS: S120L) was present in 2 clones of sequence pool 2 and no SNPs or other sequence variants were identified in braSR (Tables 5–7). S. hominis has both braSR and graSR loci and therefore it is intriguing nisin resistance selection resulted in SNPs in a different TCS to S. aureus despite encoding both, potentially reflecting differences in their contribution across group A staphylococci. A further transcriptional regulator might contribute to nisin resistance in both S. aureus and S. hominis, where the uncharacterized yhcF revealed SNPs producing G73R and N47∗, respectively; the presence of SNPs in yhcF of both species supports a role for this regulator. The YhcF transcriptional regulator proteins of S. aureus and S. hominis have 75% similarity and their cognate genes are adjacent to an ABC transporter locus with potential specificity for GlcNAc, which might catalyze recycling of cell wall substrates from nisin damage. The role of this operon is currently being investigated.
In summary, we have identified differential encoding and diversity of antimicrobial resistance regulators and their associated transporters across the staphylococci. Our previous studies of the nasal microbiome correlated cumulative antimicrobial production with community structure, limitation of invasion and S. aureus exclusion (Coates et al., 2014; Libberton et al., 2014, 2015). Further dissection of antimicrobial sensing and discrimination via the TCS systems BraSR and GraSR combined with analysis of their associated transport specificities will provide information that can be layered with niche-relevant antimicrobial activities from competing species. Such analyses are now emerging and will provide a more holistic determination of Staphylococcus ecology.
Materials and Methods
Staphylococcus Orthologous Gene Content
Representative genomes of 21 different Staphylococcus species available at the time of analysis (Table 1) were either sequenced (see later section) or retrieved from the NCBI FTP repository1. Complete genomes were used where possible. Draft genomes available as NCBI scaffolds were reordered against an appropriate reference using a bespoke perl script. Genomes were annotated using PROKKA (version 1.5.2) (Seemann, 2014) to ensure consistent gene calling and annotation. OrthoMCL (version 1.4) was used to cluster orthologous proteins (Li et al., 2003), with input parameters, e-value cut-off: 1e-5, percentage identity cut-off: 30, percentage match cut off: 20. Briefly, initial BLAST steps of orthoMCL used the latter two low stringency cut-off values; these values were used to retain more proteins for clustering from these BLAST stages. Inparalog, ortholog and co-ortholog pairwise relationships were generated through reciprocal best and better hits in subsequent stages that used the p-value cut-off of 1e-5. Finally, the MCL (Markov clustering) aspect of the tool was applied to these pairwise relationships to allow clustering into orthologous groups (Li et al., 2003; Fischer et al., 2011). A bespoke python script was used to create a table describing the presence or absence of each OrthoMCL cluster within every genome. These data were converted to a matrix for analysis in the statistical package R and a heatmap was generated from the matrix. To control for gross strain-specific effects on the heat map (and thus OrthoMCL clusters), this step was repeated by substituting with alternative strains (Supplementary Table S1) and all permutations were analyzed in subsequent steps of the analysis.
Drivers of OrthoMCL Group Formation
The R library, Random Forest (version 4.6-7) (Liaw and Wiener, 2003) was used to investigate the genetic inputs directing classification of the species into their OrthoMCL groups. A presence/absence table of each of the orthologous groups obtained from the United States300 permutation of the OrthoMCL analysis was generated using a bespoke python script and used as the input data for the Random Forest algorithm.
The data was split into a test and training data set with both sets including equal proportions of group A species. The optimum value for mtry was found to be 66 using the tuneRF function (ntree = 1001, stepFactor = 1.5, improve = 0.001). These mtry and ntree parameters resulted in a model with an out of bag (OOB) error rate of 9.09% and area under ROC curve (AUC) of 0.96.
Data output was summarized using the variable importance plot function and the numeric mean decrease in accuracy (MDA) resulting from the permutation of each variable was obtained through the importance function; these data were used as the measure of the importance of each variable. The maximum MDA in this analysis was 3.3. Clusters were mapped back to the genome and the annotation of protein sequence for a species representative of each cluster was retrieved. Protein sequences of clusters identified as important were retrieved and their annotations curated and verified against published annotations. In addition, outputs were generated by substituting strains of species in the analysis to compare conservation of identified clusters between the variable importance plots. Sequences of protein clusters from the single species representative in Table 2 and identified by Random Forest output are listed in Supplementary Files S2, S3. Protein sequences were retrieved from their respective genomes and alignments were performed using ClustalW2 (version 2.1).
Minimum Inhibitory Concentration Assay
Nisin (Sigma-Aldrich Company Ltd, United Kingdom) was prepared as a 20 mg mL-1 solution in 10 mM sodium citrate (Sigma–Aldrich Company Ltd, United Kingdom) at pH 3 and stored at 4°C. MIC assay used microtiter plates with doubling dilutions of nisin in BHI (Thermo Scientific) inoculated 1 in 2 with 100 μL bacterial suspension adjusted to OD600 0.2 ± 0.005. The lowest concentration with an optical density ≤ to that of the initial optical density was taken as the minimum inhibitory concentration (MIC).
Selection for Nisin Resistance
Experimental evolution was performed by serial passage in broth containing doubling dilutions of nisin in triplicate wells of a microtiter plate. For selection of S. aureus and S. saprophyticus, the maximal assay concentration of nisin was 5 mg mL-1 and for S. hominis 50 μg mL-1. Control selection experiments with equivalent sodium citrate concentrations were performed in parallel. Experiments were initiated with inoculation of bacteria to OD600 = 0.2 for the first passage and plates were incubated static at 37°C. Bacteria growing at the highest concentration of nisin after 24–48 h were passaged forward to the next plate; subsequent passages were inoculated with a 1:1000 dilution of culture. Serial passage was continued until growth occurred at the maximal nisin concentration (for strains S. saprophyticus = 10 mg ml-1, S. aureus = 10 mg ml-1, and S. hominis = 250 μg ml-1) or for a period of 12 days. All passaged cultures were collected and stored at -80°C in 20% (v/v) glycerol (Fisher Scientific) after each passage and the T0 time point served as comparator strain.
Colonies were randomly selected for sequencing after plating from independent biological replicate cultures that had reached an equivalent maximum level of nisin resistance. Clones from each repeat were selected and cultured in 10 mL of BHI at 37°C with shaking at 200 rpm overnight. Increased MICs were confirmed by using the MIC assay described above at the highest nisin concentrations. Selection was performed for a corresponding citrate control time point for each of the three species.
DNA Extraction, Library Preparation and Sequencing
Cells were harvested from overnight culture and lysed in buffer containing 12.5 μg ml-1 lysostaphin (Sigma–Aldrich) and 10 U mutanolysin (Sigma–Aldrich). DNA was purified using a DNeasy Blood and Tissue Kit (Qiagen). DNA (30 ng) from each of five selected clones was pooled to make Illumina Truseq DNA libraries with an insert size of 350 bp. In addition to three separate clone pools, a single clone was selected for sequencing from the clones used to constitute the pools. Single clones were selected on the basis of the highest DNA quality. The single clones and the T0 isolates were also sequenced using Illumina Truseq nano DNA libraries with 350 bp inserts.
Identification of SNPs and INDELS
T0 comparator strains were assembled using VelvetOptimiser (version 2.2.5; Victoria Bioinformatics Consortium) with Kmer sizes from 19 to 99 and Velvet version 1.2.06 (Zerbino and Birney, 2008). Annotation was carried out using PROKKA version 1.5.2 (Seemann, 2014). The PacBio assembly of S. hominis strain J31 (Accession FBVO01000000) (Coates-Brown and Horsburgh, 2017) was used as the comparator assembly for this strain. Good quality filtered reads from experimentally evolved pools and single clones were aligned to respective comparator strains using the BWA (version 0.5.9-r16) (Li and Durbin, 2009) packages aln and sampe, and also using BWA (version 0.7.5a-r405) mem package. SAM files were converted to bcf (binary variant call) files with samtools for SNP calling using the mpileup package. The bcf output file from mpileup was then converted to vcf (variant call format) files and quality filtered. For SNPs, only this quality filtered vcf file from the pooled clones, along with mpileup output without base data, were used to further filter the SNPs to include only those present in 33.33% of reads, which equates to the SNP being present in more than one clone. To reduce falsely called SNPs, SNPs not called from both alignments (from either BWA aln and sampe or BWA mem) were removed from the data set, as recommended by Li (Li, 2014). SNPs called in the control data and evolved isolates were filtered from the data.
Availability of Data and Materials
Genomes resulting from this work can be retrieved from the ENA database at EMBL-EBI (https://www.ebi.ac.uk/ena/data/view) under the bioproject accession PRJEB22856, including data from experimental evolution of S. aureus 171; Parental S. aureus 171 data accession: LT963437. Individual genome assembly accessions used in Figure 1 are listed in Table 1 and Supplementary File S1. Strains not already publicly archived are available on request. This manuscript was submitted to bioRxiv ahead of review (Coates-Brown et al., 2018).
Author Contributions
All authors listed have made a substantial, direct and intellectual contribution to the work, and approved it for publication.
Funding
RC-B was funded by BBSRC training grant BB/J500768/1 awarded to MH with support from Unilever PLC. JM was funded by BBSRC research grant BB/L023040/1 awarded to MH with support from Unilever PLC. The funders were not involved in the study design, collection of samples, analysis of data, interpretation of data, the writing of this report or the decision to submit this report for publication.
Conflict of Interest Statement
The authors declare that the research was conducted in the absence of any commercial or financial relationships that could be construed as a potential conflict of interest.
Acknowledgments
We are grateful to Dr. Miriam Korte-Berwanger, University of Bochum and Prof. Ross Fitzgerald, University of Edinburgh for kindly providing Staphylococcus strains used in this study.
Supplementary Material
The Supplementary Material for this article can be found online at: https://www.frontiersin.org/articles/10.3389/fmicb.2018.02753/full#supplementary-material
FILE S1 | Staphylococcus species and strains used as substitutes in OrthoMCL analyses.
FILE S2 | Species group A, present and absent cluster protein sequences. Sequences represent clusters listed in Table 2.
FILE S3 | Data from BLASTp search analysis for GraS and BraS homologues in 49 Staphylococcus species genomes. BLASTp was performed using default settings and either S. aureus N315 SA0615 (GraS) or SA2417 (BraS) protein sequences.
Footnote
References
Baba, T., Bae, T., Schneewind, O., Takeuchi, F., and Hiramatsu, K. (2008). Genome sequence of Staphylococcus aureus strain newman and comparative analysis of staphylococcal genomes: polymorphism and evolution of two major pathogenicity islands. J. Bacteriol. 190, 300–310. doi: 10.1128/JB.01000-07
Bannerman, T. L., Wadiak, D. L., and Kloos, W. E. (1991). Susceptibility of Staphylococcus species and subspecies to teicoplanin. Antimicrob. Agents Chemother. 35, 1919–1922. doi: 10.1128/AAC.35.9.1919
Blake, K. L., Randall, C. P., and O’Neill, A. J. (2011). In vitro studies indicate a high resistance potential for the lantibiotic nisin in Staphylococcus aureus and define a genetic basis for nisin resistance. Antimicrob. Agents Chemother. 55, 2362–2368. doi: 10.1128/AAC.01077-10
Cheng, V. W. T., Zhang, G., Oyedotun, K. S., Ridgway, D., Ellison, M. J., and Weiner, J. H. (2013). Complete genome of the solvent-tolerant Staphylococcus warneri strain SG1. Genome Announce. 1:e0003813. doi: 10.1128/genomeA.00038-13
Coates, R., Moran, J., and Horsburgh, M. J. (2014). Staphylococci: colonizers and pathogens of human skin. Future Microbiol. 9, 75–91. doi: 10.2217/fmb.13.145
Coates-Brown, R., and Horsburgh, M. J. (2017). Whole-genome sequence of Staphylococcus hominis strain J31 isolated from healthy human skin. Genome Announc. 5:e01548-16. doi: 10.1128/genomeA.01548-16
Coates-Brown, R., Moran, J., Pongchaikul, P., Darby, A., and Horsburgh, M. J. (2018). Comparative genomics of staphylococcus reveals determinants of speciation and diversification of antimicrobial defense. bioRxiv[Preprint]. doi: 10.1101/277400
Delaune, A., Dubrac, S., Blanchet, C., Poupel, O., Mäder, U., Hiron, A., et al. (2012). The WalKR system controls major staphylococcal virulence genes and is involved in triggering the host inflammatory response. Infect. Immun. 80, 3438–3453. doi: 10.1128/IAI.00195-12
Devriese, L. A., Schleifer, K. H., and Adegoke, G. O. (1985). Identification of coagulase-negative staphylococci from farm animals. J. Appl. Bacteriol. 58, 45–55. doi: 10.1111/j.1365-2672.1985.tb01428.x
Dinakaran, V., Shankar, M., Jayashree, S., Rathinavel, A., Gunasekaran, P., and Rajendhran, J. (2012). Genome sequence of Staphylococcus arlettae strain CVD059, isolated from the blood of a cardiovascular disease patient. J. Bacteriol. 194, 6615–6616. doi: 10.1128/JB.01732-12
Falord, M., Mäder, U., Hiron, A., Débarbouillé, M., and Msadek, T. (2011). Investigation of the Staphylococcus aureus GraSR regulon reveals novel links to virulence, stress response and cell wall signal transduction pathways. PLoS One 6:e21323. doi: 10.1371/journal.pone.0021323
Feehily, C., and Karatzas, K. A. G. (2013). Role of glutamate metabolism in bacterial responses towards acid and other stresses. J. Appl. Bacteriol. 114, 11–24. doi: 10.1111/j.1365-2672.2012.05434.x
Fischer, S., Brunk, B. P., Chen, F., Gao, X., Harb, O. S., Iodice, J. B., et al. (2011). Using OrthoMCL to assign proteins to OrthoMCL-DB groups or to cluster proteomes into new ortholog groups. Curr. Protoc. Bioinformatics 35, 6.12.1–6.12.19. doi: 10.1002/0471250953.bi0612s35
Hefti, M. H., Françoijs, K. J., de Vries, S. C., Dixon, R., and Vervoort, J. (2004). The PAS fold. A redefinition of the PAS domain based upon structural prediction. Eur. J. Biochem. 271, 1198–1208. doi: 10.1111/j.1432-1033.2004.04023.x
Herbert, S., Bera, A., Nerz, C., Kraus, D., Peschel, A., Goerke, C., et al. (2007). Molecular basis of resistance to muramidase and cationic antimicrobial peptide activity of lysozyme in staphylococci. PLoS Pathog. 3:e102. doi: 10.1371/journal.ppat.0030102
Hiron, A., Falord, M., Valle, J., Débarbouillé, M., and Msadek, T. (2011). Bacitracin and nisin resistance in Staphylococcus aureus: a novel pathway involving the BraS/BraR two-component system (SA2417/SA2418) and both the BraD/BraE and VraD/VraE ABC transporters. Mol. Microbiol. 81, 602–622. doi: 10.1111/j.1365-2958.2011.07735.x
Howden, B. P., McEvoy, C. R., Allen, D. L., Chua, K., Gao, W., Harrison, P. F., et al. (2011). Evolution of multidrug resistance during Staphylococcus aureus infection involves mutation of the essential two component regulator WalKR. PLoS Pathog. 7:e1002359. doi: 10.1371/journal.ppat.1002359
Kloos, W. E. (1980). Natural populations of the genus Staphylococcus. Ann. Rev. Microbiol. 34, 559–592. doi: 10.1146/annurev.mi.34.100180.003015
Kloos, W. E., Schleifer, K.-H., and Götz, R. (1991). “The genus Staphylococcus,” in The Prokaryotes: A Handbook on the Biology of Bacteria: Ecophysiology, Isolation, Identification, Applications, 2nd Edn, Vol. 2, eds A. Balows, H. G. Trooper, M. Dworkin, W. Harder, and K.-H. Schleifer (New York: Springer), 1369–1420.
Kolar, S. L., Nagarajan, V., Oszmiana, A., Rivera, F. E., Miller, H. K., Davenport, J. E., et al. (2011). NsaRS is a cell-envelope-stress-sensing two-component system of Staphylococcus aureus. Microbiology 157, 2206–2219. doi: 10.1099/mic.0.049692-0
Kuroda, M., Yamashita, A., Hirakawa, H., Kumano, M., Morikawa, K., Higashide, M., et al. (2005). Whole genome sequence of Staphylococcus saprophyticus reveals the pathogenesis of uncomplicated urinary tract infection. PNAS 102, 13272–13277. doi: 10.1073/pnas.0502950102
Lamers, R. P., Muthukrishnan, G., Castoe, T. A., Tafur, S., Cole, A. M., and Parkinson, C. L. (2012). Phylogenetic relationships among Staphylococcus species and refinement of cluster groups based on multilocus data. BMC Evol. Biol. 12:171. doi: 10.1186/1471-2148-12-171
Li, H. (2014). Towards better understanding of artifacts in variant calling from high-coverage samples. Bioinformatics 30, 2843–2851. doi: 10.1093/bioinformatics/btu356
Li, H., and Durbin, R. (2009). Fast and accurate short read alignment with Burrows-wheeler transform. Bioinformatics 25, 1754–1760. doi: 10.1093/bioinformatics/btp324
Li, L., Stoeckert, C. J. Jr., and Roos, D. S. (2003). OrthoMCL: identification of ortholog groups for eukaryotic genomes. Genome Res. 13, 2178–2189. doi: 10.1101/gr.1224503
Libberton, B., Coates, R. E., Brockhurst, M. A., and Horsburgh, M. J. (2014). Evidence that intraspecific trait variation among nasal bacteria shapes the distribution of Staphylococcus aureus. Infect. Immun. 82, 3811–3815. doi: 10.1128/IAI.02025-14
Libberton, B., Horsburgh, M. J., and Brockhurst, M. A. (2015). The effects of spatial structure, frequency dependence and resistance evolution on the dynamics of toxin-mediated microbial invasions. Evol. Appl. 8, 738–750. doi: 10.1111/eva.12284
Mascher, T. (2014). Bacterial (intramembrane-sensing) histidine kinases: signal transfer rather than stimulus perception. Trends Microbiol. 22, 559–565. doi: 10.1016/j.tim.2014.05.006
Meehl, M., Herbert, S., Götz, F., and Cheung, A. (2007). Interaction of the GraRS two-component system with the VraFG ABC transporter to support vancomycin-intermediate resistance in Staphylococcus aureus. Antimicrob. Agent Chemother. 51, 2679–2689. doi: 10.1128/AAC.00209-07
Nam, Y.-D., Chung, W.-H., Seo, M.-J., and Lim, S.-I. (2012a). Draft genome sequence of Staphylococcus vitulinus F1028, a strain isolated from a block of fermented soybean. J. Bacteriol. 194, 5961–5962. doi: 10.1128/JB.01332-12
Nam, Y.-D., Chung, W.-H., Seo, M.-J., Lim, S.-I., and Yi, S.-H. (2012b). Genome sequence of Staphylococcus lentus F1142, a strain isolated from Korean soybean paste. J. Bacteriol. 194, 5987. doi: 10.1128/JB.01484-12
Peschel, A., and Collins, L. V. (2001). Staphylococcal resistance to antimicrobial peptides of mammalian and bacterial origin. Peptides 22, 1651–1659. doi: 10.1016/S0196-9781(01)00500-9
Popella, P., Krauss, S., Ebner, P., Nega, M., Deibert, J., and Götz, F. (2016). VraH Is the third component of the Staphylococcus aureus VraDEH system involved in gallidermin and daptomycin resistance and pathogenicity. Antimicrob. Agents Chemother. 60, 2391–2401. doi: 10.1128/AAC.02865-15
Rietkötter, E., Hoyer, D., and Mascher, T. (2008). Bacitracin sensing in Bacillus subtilis. Mol. Microbiol. 68, 768–785. doi: 10.1111/j.1365-2958.2008.06194.x
Rosenstein, R., Nerz, C., Biswas, L., Resch, A., Raddatz, G., Schuster, S. C., et al. (2009). Genome analysis of the meat starter culture bacterium Staphylococcus carnosus TM300. Appl. Environ. Microbiol. 75, 811–822. doi: 10.1128/AEM.01982-08
Schleifer, K.-H., and Bell, J. A. (2015). “Staphylococcus,” in Bergey’s Manual of Systematics of Archaea and Bacteria, eds P. DeVos, J. Chun, S. Dedysh, B. Hedlund, P. Kämpfer, F. Rainey, et al. (Hoboken, NJ: John Wiley & Sons), 1–43.
Schleifer, K. H., Kilpper-Bälz, R., and Devriese, L. A. (1984). Staphylococcus arlettae sp. nov., S. equorum sp. nov. and S. kloosii sp. nov.: three new coagulase-negative, novobiocin-resistant species from animals. Syst. Appl. Microbiol. 5, 501–509. doi: 10.1016/S0723-2020(84)80007-7
Seemann, T. (2014). Prokka: rapid prokaryotic genome annotation. Bioinformatics 30, 2068–2069. doi: 10.1093/bioinformatics/btu153
Slettemeås, J. S., Mikalsen, J., and Sunde, M. (2010). Further diversity of the Staphylococcus intermedius group and heterogeneity in the MboI restriction site used for Staphylococcus pseudintermedius species identification. J. Vet. Diagn. 22, 756–759. doi: 10.1177/104063871002200517
Stock, A. M., Robinson, V. L., and Goudreau, P. N. (2000). Two-component signal transduction. Ann. Rev. Biochem. 69, 183–215. doi: 10.1146/annurev.biochem.69.1.183
Stull, J. W., Slaviæ, D., Rousseau, J., and Weese, J. S. (2014). Staphylococcus delphini and methicillin-resistant S. pseudintermedius in horses. Canada. Emerg. Infect. Dis. 20, 485–487. doi: 10.3201/eid2003.130139
Suzuki, H., Lefébure, T., Bitar, P. P., and Stanhope, M. J. (2012). Comparative genomic analysis of the genus Staphylococcus including Staphylococcus aureus and its newly described sister species Staphylococcus simiae. BMC Genomics 13:38. doi: 10.1186/1471-2164-13-38
Takahashi, T., Satoh, I., and Kikuchi, N. (1999). Phylogenetic relationships of 38 taxa of the genus Staphylococcus based on 16S rRNA gene sequence analysis. Int. J. Syst. Bacteriol. 49, 725–728. doi: 10.1099/00207713-49-2-725
Tse, H., Tsoi, H. W., Leung, S. P., Lau, S. K. P., Woo, P. C. Y., and Yuen, K. Y. (2010). Complete genome sequence of Staphylococcus lugdunensis Strain HKU09-01. J. Bacteriol. 192, 1471–1472. doi: 10.1128/JB.01627-09
Tse, H., Tsoi, H. W., Leung, S. P., Urquhart, I. J., Lau, S. K. P., Woo, P. C. Y., et al. (2011). Complete genome sequence of the veterinary pathogen Staphylococcus pseudintermedius strain HKU10-03, isolated in a case of canine pyoderma. J. Bacteriol. 193, 1783–1784. doi: 10.1128/JB.00023-11
Zerbino, D. R., and Birney, E. (2008). Velvet: algorithms for de novo short read assembly using de Bruijn graphs. Genome Res. 18, 821–829. doi: 10.1101/gr.074492.107
Keywords: Staphylococcus, antibiotic resistance, competition, machine learning, antimicrobial, defense, genome, resistance
Citation: Coates-Brown R, Moran JC, Pongchaikul P, Darby AC and Horsburgh MJ (2018) Comparative Genomics of Staphylococcus Reveals Determinants of Speciation and Diversification of Antimicrobial Defense. Front. Microbiol. 9:2753. doi: 10.3389/fmicb.2018.02753
Received: 16 July 2018; Accepted: 29 October 2018;
Published: 19 November 2018.
Edited by:
Rakesh Sharma, Institute of Genomics and Integrative Biology (CSIR), IndiaReviewed by:
Bernhard O. Palsson, University of California, San Diego, United StatesFriedrich Götz, Universität Tübingen, Germany
Copyright © 2018 Coates-Brown, Moran, Pongchaikul, Darby and Horsburgh. This is an open-access article distributed under the terms of the Creative Commons Attribution License (CC BY). The use, distribution or reproduction in other forums is permitted, provided the original author(s) and the copyright owner(s) are credited and that the original publication in this journal is cited, in accordance with accepted academic practice. No use, distribution or reproduction is permitted which does not comply with these terms.
*Correspondence: Malcolm J. Horsburgh, M.J.Horsburgh@liverpool.ac.uk
†Present address: Rosanna Coates-Brown, Manchester Centre for Genomic Medicine, Saint Mary’s Hospital, Manchester University Hospitals NHS Foundation Trust, Manchester Academic Health Science Centre, Manchester, United Kingdom Josephine C. Moran Division of Infection, Immunity and Respiratory Medicine, Faculty of Biology, Medicine and Health, University of Manchester, Manchester, United Kingdom