Retrieving Linear and Nonlinear Optical Dispersions of Matter: Combined Experiment-Numerical Ellipsometry in Silicon, Gold and Indium Tin Oxide
 L. Rodríguez-Suné
 J. Trull
 N. Akozbek2
  D. de Ceglia
 M. A. Vincenti
 M. Scalora
 C. Cojocaru
- 1Department of Physics, Universitat Politècnica de Catalunya, Terrassa, Spain
- 2Bluehalo Inc., Huntsville, AL, United States
- 3Department of Information Engeering, University of Padova, Padova, Italy
- 4Deparment of Information Engineering, University of Brescia, Brescia, Italy
- 5Aviation and Missile Center, US Army CCDC, Redstone Arsenal, Huntsville, AL, United States
The predominant methods currently used to determine nonlinear optical constants like the nonlinear refractive index n2 or the third order susceptibility χ(3) rely mostly on experimental, open and closed z-scan techniques and beam deflection methods. While these methods work well when the linear absorption is relatively small or negligible, the retrieval process is more complicated for a strongly scattering, dispersive or absorbing medium. The study of optics at the nanoscale in the picosecond or femtosecond laser pulsed regimes demands the development of new theoretical tools, and diverse experimental approaches, to extract and verify both linear and nonlinear optical dispersions exhibited by matter, especially when material constituents are fashioned into nanostructures of arbitrary shape. We present a practical, combined experimental and theoretical approach based on the hydrodynamic model that uses experimental results of harmonic generation conversion efficiencies to retrieve complex, nonlinear dispersion curves, not necessarily only for third order processes. We provide examples for materials that are of special interest to nanophotonics, for example, silicon, gold, and indium tin oxide (ITO), which displays nonlocal effects and a zero-crossing of the real part of the dielectric constant. The results for silicon and gold compare well with analytical predictions of nonlinear dispersion based on the nonlinear oscillator model. Based on our assessment of third harmonic generation conversion efficiencies in silicon, we predict
Introduction
The study of nonlinear optical effects is crucial in many applications in photonics covering many different research fields, including quantum electronics, quantum optics, telecommunications, surface science, metrology, microscopy and many others. In order to properly account for nonlinear dispersion and its effects, including for example, self-phase modulation, nonlinear pump absorption, and harmonic conversion efficiencies, one must determine as accurately as possible the values of the different susceptibilities of the medium, which are ultimately related to material parameters like electron density and effective mass, lattice constant, and damping rates. The inclusion of nonlinear terms in the equations of motion thus leads to a total polarization density that accounts for linear and nonlinear responses. The nonlinear contributions of the total polarization at the frequency corresponding to the incident fundamental field give rise to a modified index of refraction, or dielectric constant of the medium, which for third order processes, under certain conditions may be written in terms of the intensity simply as:
The issue of accurately determining the values of the nonlinear coefficients has been considered for many years. The different techniques involve the use of nonlinear interferometry, degenerate four-wave mixing, ellipse rotation, beam distortion and deflection measurements. The classical method to determine the value (magnitude and sign) of
Different z-scan theories have been proposed in the literature. The first theories considered thin samples and a Kerr nonlinearity to derive an analytical formula for weak nonlinearities (
Extensions of the z-scan technique have also been implemented in order to unravel the different contributions to the nonlinear response of the material. For instance, in time-resolved z-scan methods, the introduction of a temporal delay into the two-color z-scan device allows one to separate nonlinear contributions having different temporal responses (Wang et al., 1994). More recently, methods based on beam deflection have been implemented using pump-probe configurations, whereby the pump generates an index gradient experienced by the probe, which in turn is deflected (Ferdinandus et al., 2013; Ferdinandus et al., 2017). However, a detailed theory for either z-scan or beam deflection technique should take into account the origin and nature of all relevant nonlinearities present in the problem, in order to extract accurate information from experimental measurements, and thus obtain the desired, accurate values of the nonlinear coefficients not only for the pump beam, which either z-scan or beam deflection are mostly concerned with, but also for the simultaneous determination of nonlinear dispersion of the generated harmonic fields.
In more complex situations, where the material consists of metal layers, or perhaps semiconductor or conductive oxide layers, new linear and nonlinear sources become relevant, including nonlocal effects, magnetic dipole and electric quadrupole (surface) nonlinearities, convection, hot electrons, pump depletion, and phase-locking. As a result, the behavior of a harmonic component cannot be extrapolated based on the behavior of a pump or probe field grounded on mere transmission or deflection assessments. At the same time, one should be able to identify and distinguish between competing second and/or third order nonlinearities separately triggered by free and bound electrons. Therefore, different terms introduced in the equations of motion contribute to the nonlinear susceptibility and add to beam dynamics, terms that typically are either not distinguished or accounted for in the theories behind either z-scan or beam deflection methods. Consequently, the results may be either inaccurate or misleading in situations where these contributions may be significant. In what follows we describe a numerical technique that utilizes the constitutive relations to extract complex nonlinear dispersions and related coefficients of various orders. The approach is based on a microscopic, hydrodynamic representation of the material equations of motion coupled to the macroscopic Maxwell’s equations, to perform what amounts to numerical ellipsometry.
In the classical realm, electrons move according to Newtonian principles. Free electrons are described by a modified Drude equation of motion, one that contains linear and nonlinear, nonlocal, magnetic, convective, and quadrupole-like surface contributions (Scalora et al., 2010). In addition to similar external electric and magnetic forces, multiple bound electron species may also contribute to the macroscopic dielectric constant, and are subject to linear and nonlinear restoring forces (Scalora et al., 2012; Vincenti et al., 2011). For example, at near-IR, visible and UV wavelengths, in metals d-shell (bound) electrons may dominate the dielectric response, and their influence should be introduced in the dynamics, also because they contribute to the total balance of momentum and energy transfer. Each electron species may experience its own linear and nonlinear response, have different resonant frequencies, effective electron masses, and damping constants. The resulting nonlinear polarizations are then added together to form the total polarization, which in turn is inserted into Maxwell’s equations.
The depiction of nonlinear phenomena of metals, for example, is usually limited and focused only on the second order response of free electrons, with effective surface and bulk second order nonlinear coefficients (Xiang Wang et al., 2009; Krause et al., 2004) that are chosen and typically adjusted to fit experimental results (Coutaz et al., 1987) without distinguishing between surface (Coulomb and convection) and magnetic (Lorentz) contributions. When third order effects are introduced, the
Material characterization usually begins with the deposition of relatively thin layers of a given material in order to ascertain its linear, frequency-dependent complex dielectric response (Palik, 1985). The dielectric function so obtained amounts to a value averaged over the thickness of that layer, and cannot account for spatial inhomogeneities due to density fluctuations or surface roughness that may occur during the fabrication process, whose effects are already folded into the measurement and for practical purposes assumed to be negligible. Once the average value of the dielectric constant is obtained, it is used to extract effective particle density, electron mass, plasma frequency, and damping coefficients. The material’s temporal response to external excitation may then be recast in the context of the hydrodynamic model to simulate arbitrary shapes of that material. Thin layers of ITO or Cadmium Oxide (CdO) may display a robust nonlocal response (De Ceglia et al., 2018), so that the measured dielectric function may depend on both frequency and wave-vector, which translates into dependence on spatial derivatives of the fields and boundary conditions. In essence, under the action of radiation pressure, the free electron gas undergoes longitudinal oscillations that trigger standing waves and a resonant spectral response that depends on material thickness in one dimension (De Ceglia et al., 2018), and more complex geometrical and topological considerations in higher dimensions. As another example, the method may be used to predict that in a flat ITO layer, at oblique incidence, nonlocal effects trigger an anisotropic, linear dielectric response in the spectral region where the magnitude of the real part of the dielectric “constant” approaches zero (Scalora et al., 2020). This near-singular behavior is mitigated by a necessary degree of absorption dictated by causality, but that can nevertheless induce a seemingly large nonlinear response, whose quantitative and qualitative aspects (i.e., dispersion) have not yet been clearly understood or quantified (Alam et al., 2016), or appropriately compared to other materials. The same may be said of the optical response of most semiconductors in their respective opacity ranges (Burns and Bloembergen, 1971). Therefore, it is natural to regress and pose questions about the nature and magnitude of nonlinear dispersion in any material, and to identify the intrinsic properties before any hypothetical, metasurface-induced enhancement may be quantified. The method allows us to easily extract bulk nonlinear dispersions from the equations of motion, like the third-order nonlinear susceptibilities, based solely on a comparison with experimental THG conversion efficiencies. Extraction of the bulk, second order response is straightforward and is done in similar fashion. However, for the moment we will refrain from extracting effective second order surface and volume nonlinearities that are triggered by quadrupole-like sources and the magnetic Lorentz contributions, since they cannot be mapped easily to analytical solutions of the nonlinear oscillator model.
Model: Retrieval of Complex Linear and Nonlinear Dispersions From the Equations of Motion
Our first example consists of an investigation of the dielectric constant of undoped crystalline silicon (Palik, 1985) grown in the <100> direction. It is plotted in Figure 1A (markers) and displays two resonances in the UV range. Also in Figure 1A, the two resonances are fitted using two separate Lorentzian functions (solid curves), appropriately detuned and with different plasma frequencies, densities, effective masses and damping coefficients. Therefore, in this case the dynamical model includes two separate bound electron species having different effective parameters. For further details, we refer the reader to reference Rodríguez-Suné et al. (2019), where SHG and THG are discussed for a gallium arsenide wafer, and reference (Scalora et al., 2019), where SHG and THG are studied theoretically for the specific case of a silicon-based, nanowire grating. For completeness, here we limit ourselves to reproducing the basic equations of motion in Gaussian units, and to briefly discuss their content:
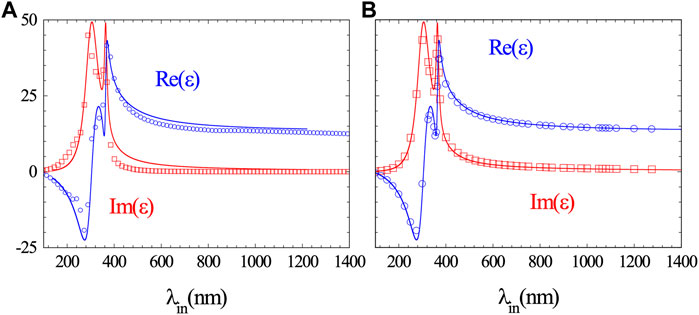
FIGURE 1. (A) Real (circle markers) and imaginary (square markers) parts of the complex dielectric constant of silicon as reported in reference Palik (1985). The solid curves are Lorentzian fits to the data as follows:
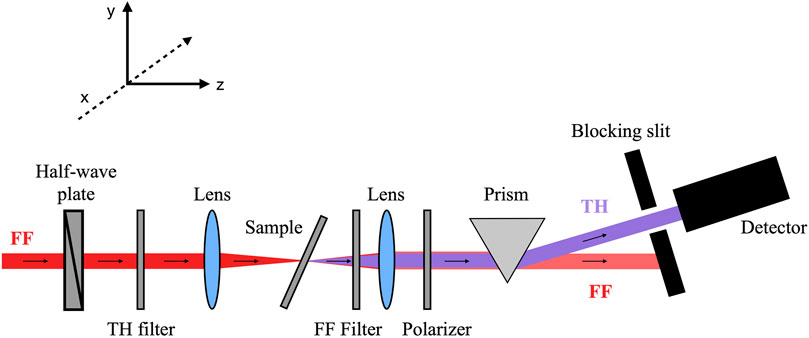
FIGURE 2. Set-up developed to measure SH and TH signals.
Since the model is described in considerable details elsewhere, here we outline a new technique that we refer to as numerical ellipsometry, that allows us to first verify the measured linear material dispersion, and then predict complex nonlinear dispersion functions (i.e.,
The second important step consists of performing the same calculations in the nonlinear regime, to once again estimate spatially-averaged polarization and field inside the same layer of material, such that
For simplicity, spatial averages are now implied and bracket symbols dropped. Additional considerations and terms are needed on the right side of Eq. 2 if either the pump is allowed to deplete, or if surface, magnetic, and/or higher order nonlinearities come into play. In Eq. 2, a linear calculation is required to obtain
Once again, we emphasize that all fields and polarizations are evaluated and spatially-averaged inside the layer. As such, the numerical procedure that we employ is identical to the ellipsometric extraction of the linear dielectric constant, since it too produces average values of the dielectric constant.
In order to retrieve
As was the case for Eq. 2, here too modifications are required if additional nonlinearities become relevant. As in Eq. 3, a linear calculation is required to obtain
As we will see below for ITO, at oblique incidence steps must be taken in order to account for the vector nature of the fields. Similarly, if the system displays dielectric anisotropies due to varying effective masses, densities or spring constants in different spatial directions, then Eqs 1–5 should be modified accordingly.
In the case of silicon and other similarly undoped semiconductors that display multiple absorption resonances (for example, GaAs, GaP, Ge, etc…) it is possible to derive analytical expressions for
where
Experimental Set-up
Our experimental set-up is shown schematically in Figure 2. It measures second and third harmonic generated signals as a function of the pump’s angle of incidence and polarization, in both transmission and reflection configurations. For the silicon sample that we investigated, the source is a pulsed fiber laser (FYLA PS50) that emits a train of 13 ps pulses at 1064 nm, with a CW average output power of 2 W and 1 MHz repetition rate, delivering 2 μJ/pulse. This source can be modulated to deliver a train of N pulses at a frequency repetition rate of 1 kHz, thus enabling the detection of weaker SH or TH signals by integrating the response of N pulses on the photomultiplier. A half-wave plate controls the polarization of the fundamental field (FF), enabling illumination of the sample with either TM- or TE-polarized light. Spectral filters are used to remove SH and/or TH signals arising from different optical components placed before the sample. The beam is focused on the sample plane to obtain fundamental beam peak power densities on the order of a few GW/cm2. After the FF traverses the crystalline silicon sample, generating SH and TH fields, it is attenuated using a filter to avoid any potentially significant SH and/or TH generation from the surfaces of the optical elements placed after the sample’s position. Another lens collimates the beam and a polarizer analyzes the polarization (TM or TE) of the generated SH and TH fields. A dispersive prism is used in combination with a blocking edge to separate and obscure the remaining FF radiation from the SH and TH paths, so that the only radiation arriving at the detector is either the SH or TH signal arising from the silicon wafer. The detector consists of a photomultiplier tube (Hamamatsu H10722 PMT series) with a mounted narrow-band spectral filter having a 20 nm band pass transmission around either the SH or the TH wavelength. The entire detection system is mounted on a rotary platform that allows measurements in transmission and in reflection. The sample is positioned on a motorized rotation stage so that the SH or TH signals can be measured as a function of the angle of incidence. We placed a BBO crystal at the sample position generating a SH signal that could be measured with a calibrated photodiode in order to estimate conversion efficiencies, as the ratio between the generated SH or TH energy (transmitted or reflected), and the total initial fundamental pulse energy. By measuring the generated NL signal at the sample plane and at the PM position (after traversing the total path across the detection system) we can estimate the losses in the experimental system for each polarization state. By replacing the photodiode with the photomultiplier, after attenuating the signal using neutral density filters, we obtain the relation between the measured signal at the PM and the energy of the generated NL signal at the sample plane. This experimental setup allows the recording of harmonic conversion efficiencies as low as 10−10.
Results
Silicon
Using our set-up we record transmitted and reflected THG conversion efficiencies as functions of the angle of incidence, as the fundamental pump pulse tuned to 1064 nm traverses a silicon wafer 500 microns thick. A focusing lens having focal length f = 100 mm was used to obtain fundamental beam intensities of approximately 6 GW/cm2 on the silicon wafer. A TM-polarized TH signal was detected for TM-polarized incident light, shown in Figure 3 plotted in blue, while the TE-TE case is depicted in red. We compared the experimental results (empty circles and squares) with numerical simulations (dashed curves) carried out via integration of Eq. 1 together with Maxwell’s equations. The dashed curves are the corresponding predicted signals. In the absence of slower nonlinearities or other spurious nonlinear effects, the results of the simulations depicted in Figure 3 emerge for pulses only a few tens of femtoseconds in duration, and remain insensitive to pulse duration. Estimates of measured conversion efficiencies for surface and magnetically induced SHG are of order 10−12, and thus inconsequential to the retrieval of third order nonlinear dispersion curves. If the sample is thicker than a few tens of microns, reflected harmonic generation becomes independent of sample thickness, because the pump is absorbed faster than the round trip time necessary to trigger meaningful cavity effects. Figure 3 suggests reasonably good agreement between predictions and measured efficiencies, which are of order 10−7, obtained by inserting
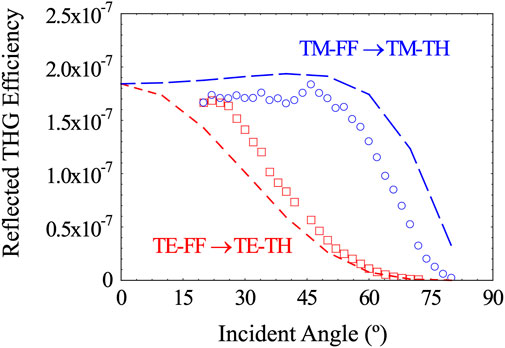
FIGURE 3. Reflected TM-polarized TH for a TM-polarized FF (blue), TE-polarized TH for a TE-polarized FF (red). Experimental results are plotted with empty circles and squares; numerical simulations are depicted with dashed lines.
In Figure 4 we compare
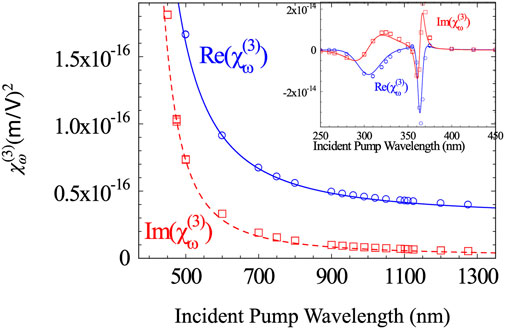
FIGURE 4. Real and imaginary parts of the complex
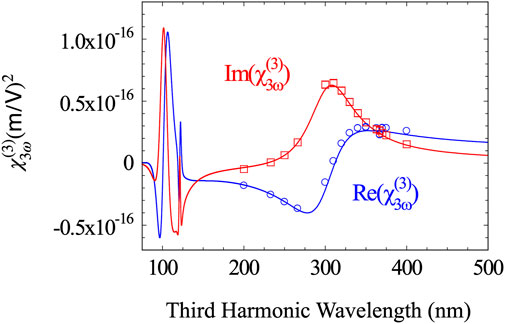
FIGURE 5. Real and imaginary parts of the complex
Gold
Using the same approach outlined above, we are now able to compare analytical results for gold with our simulations, which in turn are based on previously reported experimental results of THG in nanometer-thick gold layers, probed with both picosecond and femtosecond pulses (Rodríguez-Suné et al., 2021). The situation is different for gold compared to undoped silicon, because now a free electron gas and nonlocal effects may contribute to the dielectric constant. This difference is fully delineated in reference Rodríguez-Suné et al. (2021), where the model is extended to include one free and two bound electron species to the dielectric constant. Accordingly, Eq. 6 is modified as follows:
with a similar alteration to Eq. 7. The coefficient
In Figure 6A we show the linear gold dielectric constant data found in reference Palik (1985), fitted using one Drude and two Lorentzian functions, along with the data retrieved using our model. The calculations are carried out at normal incidence on a 20 nm-thick gold layer, which was investigated in reference Rodríguez-Suné et al. (2021) in the picosecond and femtosecond regimes. Once again, the agreement between the simulations and the observed data is notable. We remark that for wavelengths longer than 1 μm some disagreements begin to emerge in the Im(ε), that are likely due to slower computational convergence as a result of the large values of the dielectric constant. The imaginary parts of the nonlinear dispersions depicted in Figures 6B,C also display a similar slight divergence from the analytical results. However, the overall agreement between analytical and numerical results is once again quite remarkable. Nonlocal effects play a minor role for these gold layer thicknesses. Once again, we note that the retrieved nonlinear dispersion of gold in Figure 6 is consistent with THG efficiencies reported in reference Rodríguez-Suné et al. (2021).
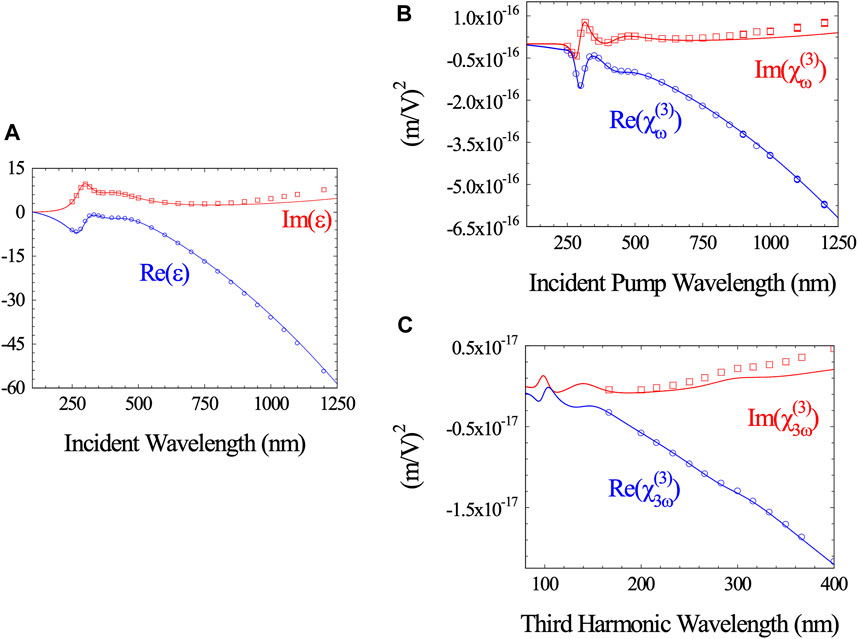
FIGURE 6. (A) Real and imaginary parts of the complex dielectric constant of gold found in reference Palik (1985) (Solid curves), and as retrieved using our model (markers). (B) Analytical (solid curves) and retrieved (markers)
Indium Tin Oxide
The measured local dielectric constant of ITO is displayed in Figure 7A for a 20 nm-thick layer, along with a fit that includes one Drude (free electrons) and one Lorentz oscillator (bound electrons). The absorption resonance becomes discernible in the data near 300 nm. The presence of the Lorentz resonance ascribes an intrinsic, nonlinear third order response described by Eqs 6, 7, usually neglected in typical theoretical treatments, but that supplements and competes with the hot electron nonlinearity (Scalora et al., 2020; Rodríguez-Suné et al., 2020), which in turn accounts for a dynamic (time dependent) redshift of the free electron plasma frequency. The relevance of nonlocal effects in the electrodynamics of conducting oxides becomes conspicuous in Figures 7B,C, where we plot the retrieved transverse and longitudinal dielectric constants using our approach, for an incident angle of 65° (Scalora et al., 2020; Rodríguez-Suné et al., 2020). Additional absorption resonances can be seen to form at wavelengths that correspond to the standing wave conditions of the free electron gas component oscillating in the longitudinal direction, which in turn affect nonlinear dispersion. No analytical solutions equivalent to Eq. 8 are known in the presence of nonlocal effects. At oblique incidence, an expansion of the term
FIGURE 7. (A) Real and imaginary parts of the complex, local dielectric constant of a 100 nm-thick layer of ITO (markers). The solid curves are a Drude-Lorentz fit of the data, which suggest the presence of an absorption resonance in the 200–300 nm range. Retrieved transverse (B) and longitudinal (C) dielectric constants obtained at 65° angle of incidence. Nonlocal effects trigger anisotropic behavior, as outlined in Palik (1985). Nonlocal resonances are visible in both (B) and (C), and are more pronounced in the longitudinal directions. For ITO,
We have assumed that fields and polarizations do not vary along the transverse x coordinate. Then, following straightforward manipulation of the vector product, development of a cubic equation, and use of the constitutive relation
and
At normal incidence Eqs 10, 11 yield Eqs 3, 5. The curves that correspond to Eq. 10 are plotted in Figure 8, while Eq. 11 are displayed in Figure 9. The strong oscillatory behavior that characterizes especially the longitudinal nonlinear response in Figure 8A is triggered by the nonlocal resonances seen in the linear response of Figure 7. The THG data used to retrieve the nonlinear dispersion depicted in Figures 8, 9 was obtained using femtosecond pulses, and may be found in reference Rodríguez-Suné et al. (2020). As we tune the pump away from the ENZ condition, nonlocal effects are attenuated, and the nonlinear response becomes more Lorentz-like. Our previous report on harmonic generation from an ITO nanolayer using femtosecond pulses suggests that at the ENZ condition THG conversion efficiencies are of similar order of magnitude compared to THG efficiencies presently recorded for the silicon wafer. A comparison between the nonlinear dispersions that we have derived for the various materials suggests that silicon may have the largest intrinsic nonlinear third order response in the visible and UV ranges.
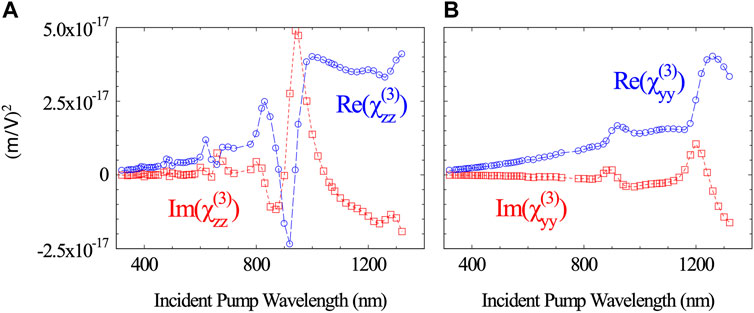
FIGURE 8. Real and imaginary parts of the (A) longitudinal and (B) transverse third order susceptibility experienced by the pump as a function of incident wavelength. The oscillatory behavior reflects the oscillations that characterize the linear dielectric response shown in Figure 7. Just as in Figure 7, the oscillations occur around the local nonlinear response obtained viaEq. 8 (not shown for clarity).
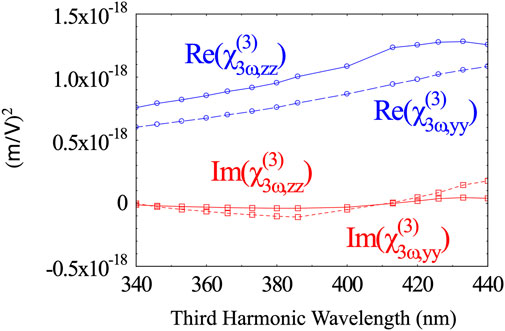
FIGURE 9. Real and imaginary parts of the longitudinal (solid) and transverse (dashed) third order susceptibility experienced by the TH signal, as a function of incident wavelength. The wavelength range is question is far from the ENZ condition, and thus insusceptible to nonlocal effects.
Summary
We have presented a combined experimental and numerical method that can be used to predict complex nonlinear dispersion curves in almost any material, based exclusively on the experimental determination of harmonic generation conversion efficiencies. We used a hydrodynamic approach that faithfully duplicates linear dispersion, and predicted the wavelength dependent nonlinear response. The method is particularly useful when analytical solutions are not available, as is the case for conductive oxides like ITO, which displays nonlocal effects that trigger an effective anisotropy, and extendable to second order bulk nonlinearities. Our experimental results for THG in silicon suggest that it is possible to exploit its large nonlinear response in the visible and UV ranges, thus opening up new prospects for silicon photonics (Scalora et al., 2019).
Data Availability Statement
The raw data supporting the conclusions of this article will be made available by the authors, without undue reservation.
Author Contributions
All authors contributed to the conception and design of this study. MS, DC, and MV performed the numerical simulations. LR-S, JT, NA, and CC carried out the experiments. All authors contributed equally to this work.
Funding
RDECOM Grant W911NF-18-1-0126 from the International Technology Center-Atlantic, and from the Spanish Agencia Estatal de Investigación (project no. PID2019-105089GB-I00/AEI/10.13039/501100011033). Army Research Laboratory Cooperative Agreement Numbers W911NF1920279 and W911NF2020078 issued by US ARMY ACC-APG-RTP.
Conflict of Interest
Author NA was employed by the company Bluehalo Inc.
The remaining authors declare that the research was conducted in the absence of any commercial or financial relationships that could be construed as a potential conflict of interest.
Publisher’s Note
All claims expressed in this article are solely those of the authors and do not necessarily represent those of their affiliated organizations, or those of the publisher, the editors and the reviewers. Any product that may be evaluated in this article, or claim that may be made by its manufacturer, is not guaranteed or endorsed by the publisher.
Acknowledgments
We thank Z. Coppens, K. Hallman, and D. Dement for help assessing and measuring the optical properties of the various samples, and for helpful discussions. We thank M. Centini, M. Sanghadasa, and N. Litchinitser for critical reading of the manuscript.
References
Alam, M. Z., De Leon, I., and Boyd, R. W. (2016). Large Optical Nonlinearity of Indium Tin Oxide in its Epsilon-Near-Zero Region. Science 352, 795–797. doi:10.1126/science.aae0330
Burns, W. K., and Bloembergen, N. (1971). Third-Harmonic Generation in Absorbing Media of Cubic or Isotropic Symmetry. Phys. Rev. B 4, 3437–3450. doi:10.1103/physrevb.4.3437
Centini, M., Roppo, V., Fazio, E., Pettazzi, F., Sibilia, C., Haus, J. W., et al. (2008). Inhibition of Linear Absorption in Opaque Materials Using Phase-Locked Harmonic Generation. Phys. Rev. Lett. 101, 113905. doi:10.1103/physrevlett.101.113905
COMSOL Multiphysics.® v. 5.6. Stockholm, Sweden: COMSOL AB. www.comsol.com.
Coutaz, J. L., Maystre, D., Nevière, M., and Reinisch, R. (1987). Optical Second‐harmonic Generation from Silver at 1.064‐μm Pump Wavelength. J. Appl. Phys. 62, 1529–1531. doi:10.1063/1.339620
De Ceglia, D., Scalora, M., Vincenti, M. A., Campione, S., Kelley, K., Runnerstrom, E. L., et al. (2018). Viscoelastic Optical Nonlocality of Low-Loss Epsilon-Near-Zero Nanofilms. Sci. Rep. 8, 9335–9411. doi:10.1038/s41598-018-27655-z
Fazio, E., Pettazzi, F., Centini, M., Chauvet, M., Belardini, A., Alonzo, M., et al. (2009). Complete Spatial and Temporal Locking in Phase-Mismatched Second-Harmonic Generation. Opt. Express 17, 3141. doi:10.1364/oe.17.003141
Ferdinandus, M. R., Hu, H., Reichert, M., Hagan, D. J., and Van Stryland, E. W. (2013). Beam Deflection Measurement of Time and Polarization Resolved Ultrafast Nonlinear Refraction. Opt. Lett. 38, 3518–3521. doi:10.1364/ol.38.003518
Ferdinandus, M. R., Reed, J. M., Averett, K. L., Hopkins, F. K., and Urbas, A. (2017). Analysis of Beam Deflection Measurements in the Presence of Linear Absorption. Opt. Mater. Express 7, 1598–1605. doi:10.1364/ome.7.001598
Kaupp, M. (2007). The Role of Radial Nodes of Atomic Orbitals for Chemical Bonding and the Periodic Table. J. Comput. Chem. 28, 320. doi:10.1002/jcc.20522
Krause, D., Teplin, C. W., and Rogers, C. T. (2004). Optical Surface Second Harmonic Measurements of Isotropic Thin-Film Metals: Gold, Silver, Copper, Aluminum, and Tantalum. J. Appl. Phys. 96, 3626–3634. doi:10.1063/1.1786341
Mann, J. B., Atomic Structure Calculations II. Hartree-Fock Wave Functions and Radial Expectation Values: Hydrogen to Lawrencium, Los Alamos Scientific Laboratory Report No. LA-3691, 1968. (Available at: https://www.osti.gov/biblio/4553157-atomic-structure-calculations-ii-hartree-fock-wavefunctions-radial-expectation-values-hydrogen-lawrencium)
Miller, R. C. (1964). Optical Second Harmonic Generation in Piezoelectric Crystals. Appl. Phys. Lett. 5, 17–19. doi:10.1063/1.1754022
Pálfalvi, L., Tóth, B. C., Almási, G., Fülöp, J. A., and Hebling, J. (2009). A General Z-Scan Theory. Appl. Phys.B. 97, 679. doi:10.1109/cleoe-eqec.2009.5196447
Rodríguez-Suné, L., Scalora, M., Johnson, A. S., Cojocaru, C., Akozbek, N., Coppens, Z. J., et al. (2020). Study of Second and Third Harmonic Generation from an Indium Tin Oxide Nanolayer: Influence of Nonlocal Effects and Hot Electrons. APL Photon. 5, 010801. doi:10.1063/1.5129627
Rodríguez-Suné, L., Trull, J., Cojocaru, C., Akozbek, N., De Ceglia, D., Vincenti, M. A., et al. (2021). Harmonic Generation from Gold Nanolayers: Bound and Hot Electron Contributions to Nonlinear Dispersion. Opt. Express 29, 8581–8591. doi:10.1364/oe.415459
Rodríguez-Suné, L., Trull, J., Scalora, M., Vilaseca, R., and Cojocaru, C. (2019). Harmonic Generation in the Opaque Region of GaAs: the Role of the Surface and Magnetic Nonlinearities. Opt. Express 27, 26120–26130. doi:10.1364/oe.27.026120
Roppo, V., Akozbek, N., de Ceglia, D., Vincenti, M. A., and Scalora, M. (2011b). Harmonic Generation and Energy Transport in Dielectric and Semiconductors at Visible and UV Wavelengths: the Case of GaP. J. Opt. Soc. Am. B 28, 2888. doi:10.1364/josab.28.002888
Roppo, V., Centini, M., Sibilia, C., Bertolotti, M., de Ceglia, D., Scalora, M., et al. (2007). Role of Phase Matching in Pulsed Second-Harmonic Generation: Walk-Off and Phase-Locked Twin Pulses in Negative-index media. Phys. Rev. A. 76, 033829. doi:10.1103/physreva.76.033829
Roppo, V., Cojocaru, C., Raineri, F., D’Aguanno, G., Trull, J., Halioua, Y., et al. (2009). Field Localization and Enhancement of Phase-Locked Second- and Third-Order Harmonic Generation in Absorbing Semiconductor Cavities. Phys. Rev. A. 80, 043834. doi:10.1103/physreva.80.043834
Roppo, V., Foreman, J. V., Akozbek, N., Vincenti, M. A., and Scalora, M. (2011a). Third Harmonic Generation at 223 Nm in the Metallic Regime of GaP. Appl. Phys. Lett. 98, 111105. doi:10.1063/1.3565240
Scalora, M., Trull, J., Cojocaru, C., Vincenti, M. A., Carletti, L., de Ceglia, D., et al. (2019). Resonant, Broadband, and Highly Efficient Optical Frequency Conversion in Semiconductor Nanowire Gratings at Visible and UV Wavelengths. J. Opt. Soc. Am. B 36, 2346–2351. Available at: https://www.infoplease.com/semimetallics/silicon.doi:10.1364/josab.36.002346
Scalora, M., Trull, J., de Ceglia, D., Vincenti, M. A., Akozbek, N., Coppens, Z., et al. (2020). Electrodynamics of Conductive Oxides: Intensity-dependent Anisotropy, Reconstruction of the Effective Dielectric Constant, and Harmonic Generation. Phys. Rev. A. 101, 053828. doi:10.1103/physreva.101.053828
Scalora, M., Vincenti, M. A., de Ceglia, D., Akozbek, N., Roppo, V., Bloemer, M. J., et al. (2012). Dynamical Model of Harmonic Generation in Centrosymmetric Semiconductors at Visible and UV Wavelengths. Phys. Rev. A. 85, 053809. doi:10.1103/physreva.85.053809
Scalora, M., Vincenti, M. A., De Ceglia, D., Cojocaru, C. M., Grande, M., and Haus, J. W. (2015). Nonlinear Duffing Oscillator Model for Third Harmonic Generation. J. Opt. Soc. Am. B 32, 2129–2138. doi:10.1364/josab.32.002129
Scalora, M., Vincenti, M. A., de Ceglia, D., Roppo, V., Centini, M., Akozbek, N., et al. (2010). Second- and Third-Harmonic Generation in Metal-Based Structures. Phys. Rev. A. 82, 043828. doi:10.1103/physreva.82.043828
Sheik-Bahae, M., Said, A. A., and Van Stryland, E. W. (1989). High-sensitivity, Single-Beam N_2 Measurements. Opt. Lett. 14, 955. doi:10.1364/ol.14.000955
Sheik-Bahae, M., Said, A. A., Wei, Tai-Huei., Hagan, D. J., and Van Stryland, E. W. (1990). Sensitive Measurement of Optical Nonlinearities Using a Single Beam. IEEE J. Quan. Electron 26, 1760. doi:10.1109/3.53394
Suresh, S., Reshef, O., Alam, M., Upham, J., Karimi, M., and Boyd, R. W. (2021). Enhanced Nonlinear Optical Responses of Layered Epsilon-Near-Zero Metamaterials at Visible Frequencies. ACS Photon. 8 (1), 125–129. doi:10.1021/acsphotonics.0c01178
Vincenti, M. A., De Ceglia, D., Roppo, V., and Scalora, M. (2011). Harmonic Generation in Metallic, GaAs-Filled Nanocavities in the Enhanced Transmission Regime at Visible and UV Wavelengths. Opt. Express 19, 2064–2078. doi:10.1364/oe.19.002064
Wang, F. X., Rodríguez, F. J., Albers, W. M., Ahorinta, R., Sipe, J. E., and Kauranen, M. (2009). Surface and Bulk Contributions to the Second-Order Nonlinear Optical Response of a Gold Film. Phys. Rev. B 80, 233402. doi:10.1103/physrevb.80.233402
Wang, J., Sheik-Bahae, M., Said, A. A., Hagan, D. J., and Van Stryland, E. W. (1994). Time-resolved Z-Scan Measurements of Optical Nonlinearities. J. Opt. Soc. Am. B 11, 1009. doi:10.1364/josab.11.001009
Keywords: nanoscale, nonlinear optics, harmonic generation, z-scan, nonlinear susceptibility
Citation: Rodríguez-Suné L, Trull J, Akozbek N, de Ceglia D, Vincenti MA, Scalora M and Cojocaru C (2021) Retrieving Linear and Nonlinear Optical Dispersions of Matter: Combined Experiment-Numerical Ellipsometry in Silicon, Gold and Indium Tin Oxide. Front. Photonics 2:746341. doi: 10.3389/fphot.2021.746341
Received: 23 July 2021; Accepted: 02 September 2021;
Published: 17 September 2021.
Edited by:
Lei Xu, Nottingham Trent University, United KingdomReviewed by:
Peilong Hong, University of Electronic Science and Technology of China, ChinaAristeidis Lamprianidis, Karlsruhe Institute of Technology (KIT), Germany
Copyright © 2021 Rodríguez-Suné, Trull, Akozbek, de Ceglia, Vincenti, Scalora and Cojocaru. This is an open-access article distributed under the terms of the Creative Commons Attribution License (CC BY). The use, distribution or reproduction in other forums is permitted, provided the original author(s) and the copyright owner(s) are credited and that the original publication in this journal is cited, in accordance with accepted academic practice. No use, distribution or reproduction is permitted which does not comply with these terms.
*Correspondence: L. Rodríguez-Suné, laura.rodriguez.sune@upc.edu