 Alexandra Mikó1†
 Éva Vigh2,3†Péter Mátrai1,4,5Alexandra Soós1,4
 András Garami1Márta Balaskó1László Czakó6Bernadett Mosdósi7Patrícia Sarlós8
 Bálint Erőss1Judit Tenk1Ildikó Rostás1
 Péter Hegyi1,9,10*
- 1Institute for Translational Medicine, Medical School, University of Pécs, Pécs, Hungary
- 2Department of Radiology, Medical School, University of Pécs, Pécs, Hungary
- 3Department of Central Radiology, Markusovszky University Teaching Hospital, Szombathely, Hungary
- 4Clinical Medicine Doctoral School, University of Szeged, Szeged, Hungary
- 5Institute of Bioanalysis, Medical School, University of Pécs, Pécs, Hungary
- 6Department of Pathophysiology, University of Szeged, Szeged, Hungary
- 7Department of Paediatrics, Medical School, University of Pécs, Pécs, Hungary
- 8Division of Gastroenterology, First Department of Medicine, Medical School, University of Pécs, Pécs, Hungary
- 9Division of Translational Medicine, First Department of Medicine, University of Pécs, Pécs, Hungary
- 10Hungarian Academy of Sciences, University of Szeged Momentum Gastroenterology Multidisciplinary Research Group, Szeged, Hungary
Background: The management of the moderate and severe forms of acute pancreatitis (AP) with necrosis and multiorgan failure remains a challenge. To predict the severity and mortality of AP multiple clinical, laboratory-, and imaging-based scoring systems are available.
Aim: To investigate, if the computed tomography severity index (CTSI) can predict the outcomes of AP better than other scoring systems.
Methods: A systematic search was performed in three databases: Pubmed, Embase, and the Cochrane Library. Eligible records provided data from consecutive AP cases and used CTSI or modified CTSI (mCTSI) alone or in combination with other prognostic scores [Ranson, bedside index of severity in acute pancreatitis (BISAP), Acute Physiology, and Chronic Health Examination II (APACHE II), C-reactive protein (CRP)] for the evaluation of severity or mortality of AP. Area under the curves (AUCs) with 95% confidence intervals (CIs) were calculated and aggregated with STATA 14 software using the metandi module.
Results: Altogether, 30 studies were included in our meta-analysis, which contained the data of 5,988 AP cases. The pooled AUC for the prediction of mortality was 0.79 (CI 0.73–0.86) for CTSI; 0.87 (CI 0.83–0.90) for BISAP; 0.80 (CI 0.72–0.89) for mCTSI; 0.73 (CI 0.66–0.81) for CRP level; 0.87 (CI 0.81–0.92) for the Ranson score; and 0.91 (CI 0.88–0.93) for the APACHE II score. The APACHE II scoring system had significantly higher predictive value for mortality than CTSI and CRP (p = 0.001 and p < 0.001, respectively), while the predictive value of CTSI was not statistically different from that of BISAP, mCTSI, CRP, or Ranson criteria. The AUC for the prediction of severity of AP were 0.80 (CI 0.76–0.85) for CTSI; 0.79, (CI 0.72–0.86) for BISAP; 0.83 (CI 0.75–0.91) for mCTSI; 0.73 (CI 0.64–0.83) for CRP level; 0.81 (CI 0.75–0.87) for Ranson score and 0.80 (CI 0.77–0.83) for APACHE II score. Regarding severity, all tools performed equally.
Conclusion: Though APACHE II is the most accurate predictor of mortality, CTSI is a good predictor of both mortality and AP severity. When the CT scan has been performed, CTSI is an easily calculable and informative tool, which should be used more often in routine clinical practice.
Introduction
Rationale
Acute pancreatitis (AP) is an inflammatory disease of the pancreas, one of the most common causes of hospitalization among gastrointestinal diseases (Lankisch et al., 2015). Based on the revised Atlanta classification, the severity of AP may be mild, moderate, or severe (Banks et al., 2013). Most cases of AP are mild, but the management of the moderate and severe forms of the disease with necrosis and multiorgan failure remains a challenge. The prognosis of the severe form is poor, it occurs in 8.8% of AP (Parniczky et al., 2016) and the mortality of severe AP (SAP) may reach 28% (Parniczky et al., 2016). Therefore, it is necessary to predict the severity of the disease because the early escalation of care and aggressive therapy may prevent complications and adverse outcomes of AP in high-risk patients. Unfortunately, research on pancreatitis is in danger, therefore, attempts to obtain clinically relevant data has very high importance (Szentesi et al., 2016).
Objectives
Currently, there are various scoring systems used for the early prediction of SAP. First, the Ranson score was used (Ranson and Pasternack, 1977), but later the acute physiology and chronic health examination II (APACHE II) scoring system seemed to be more accurate (Yeung et al., 2006). Moreover, several inflammatory parameters such as C-reactive protein (CRP) and interleukin-6 were documented to be clinically relevant in the differentiation of mild and non-mild AP (Sternby et al., 2017). In 2008, a new, easy-to-implement bedside index of severity in acute pancreatitis (BISAP) was proposed for use within 24 h of hospitalization to predict in-hospital mortality (Wu et al., 2008). However, with the improvements of the imaging techniques, contrast-enhanced computed tomography (CT) gets an important place in the diagnosis of AP and its complications. In the early ‘90s, Balthazar and his coworkers developed a numerical scoring system, the CT severity index (CTSI), for the estimation of the severity of AP (Balthazar et al., 1990). It combines the quantification of pancreatic and peripancreatic inflammation with the extent of pancreatic parenchymal necrosis. In 2004, Mortele et al., formulated the modified CTSI (mCTSI) including a simplified evaluation of peripancreatic inflammation and extent of pancreatic parenchymal necrosis and incorporated the extrapancreatic complications (vascular, gastrointestinal, and extrapancreatic parenchymal complications as well as the presence of pleural effusion and/or ascites) in the assessment. This modified index correlated more with the outcome of AP (Mortele et al., 2004). Tables 1A,B show the components of CTSI and mCTSI.
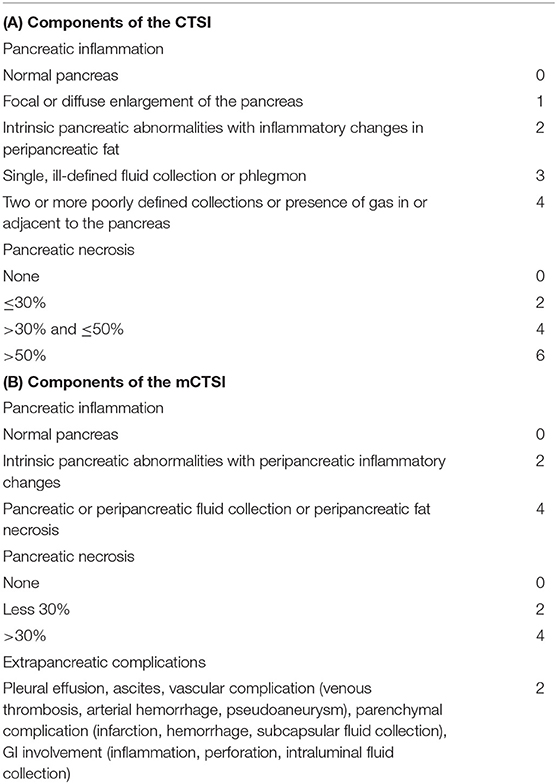
Table 1. Components of the CTSI and mCTSI.
Research Question
It is still not clear, which scoring system has the highest predictive accuracy for severity and mortality of AP. The aim of this meta-analysis was to investigate, how accurate CT-based severity indices are in the prediction of the severity and mortality of AP in comparison with other widely accepted and used scoring systems.
Methods
Study Design, Participants, Interventions, Comparators
The systematic search was conducted according to the Preferred Reporting Items for Systematic Reviews and Meta-Analyses (PRISMA) Statement (Moher et al., 2009) (Supplementary Document 1). We included studies on AP that used CTSI or mCTSI (index test) and compared them to any of the other scoring systems (Ranson, BISAP, APACHE II) or CRP (reference standards) in terms of their predictive value.
Search Strategy
A systematic search was performed in Pubmed, Embase, and the Cochrane Library (CENTRAL), using the following search query: “acute pancreatitis” AND (“computed tomography severity index” OR CTSI OR “modified computed tomography severity index” OR MCTSI). English language filter was used. Search key in Embase were: (‘acute pancreatitis’/exp OR ‘acute pancreatitis’) AND (ctsi OR mctsi OR ‘computed tomography severity index’/exp OR ‘computed tomography severity index’ OR ‘modified computed tomography severity index’) AND [english]/lim. The search was conducted on 11th March 2018. Duplicates were removed using the (EndNote X7.4, Clarivate Analytics, Philadelphia, PA, US) reference manager software.
Study Selection and Data Extraction
Two independent investigators (EV, AM) selected the studies, and disagreements were resolved by a third reviewer (PH). The records were selected for meta-analysis if (1) AP patients of any severity were enrolled consecutively; (2) if CTSI or mCTSI were used for the prediction of the severity or mortality of AP; and (3) if sensitivity and specificity values, the absolute numbers of true positive (TP), false negative (FN), false positive (FP) and true negative (TN), and/or area under the curve (AUC) were reported (for CTSI/mCTSI regarding AP severity and/or mortality). If other prognostic scores (Ranson, BISAP, APACHE II) or CRP values were also assessed in the selected articles, those results were extracted as well. Only full-text articles were included.
Studies, which met the inclusion criteria were assessed for full-text evaluation. The following data were extracted from the articles: first author; year of the publication; study period; study design; the AP scoring systems used; evaluation time of the scores; the used definition for SAP; sample size based on severity; mean age; male/female ratio; cut-off value, clinical end-points, and several data about the statistical analysis were reviewed for the risk of bias assessment.
Data Analysis
To construct 2 × 2 contingency tables, true positive, false positive, false negative, and true negative values were abstracted. These served as input to fit Hierarchial Summary Receiver Operating Characteristics (HSROC) curves and estimate summary sensitivity, specificity, and diagnostic odds ratio (DOR) with 95% confidence intervals (CI). For each method and outcome, we collected the AUC values and their CIs as well and performed a meta-analysis using the random effect model to gain pooled AUC estimates with 95% CI.
The statistical analysis was performed with Stata 14 software using the metandi module1. Heterogeneity was assessed using the I2 measure and the corresponding chi2 test, p < 0.1 indicates significant heterogeneity. Based on the Cochrane Handbook, I2 = 100% × (Q–df)/Q represents the magnitude of the heterogeneity (moderate: 30–60%, substantial: 50–90%, considerable: 75–100%) (Higgins and Green, 2011).
Risk of Bias and Applicability Assessment
The Prediction model Risk Of Bias ASsessment Tool (PROBAST) (Wolff et al., 2019) was used to assess the risk of bias and applicability of primary studies in accordance with the recommendation of the Cochrane Collaboration. This tool is able to assess the risk of bias based on the following four domains: participants, predictors, outcome, and analysis. It includes also concerns regarding applicability in three domains: participants, predictors and outcome.
Results
Study Selection and Characteristics
The systematic search strategy identified 319 articles after removal of duplicates. The search provided 123 articles in Pubmed, 279 studies in Embase and 25 articles in Cochrane library databases. The flow chart (Figure 1) shows the study selection process: 148 articles were screened by abstract and after excluding 86 studies, 62 full-text articles were assessed for eligibility. A further 32 articles were excluded, because of the lack of reporting of the outcome of interest or inappropriate patient population. In our meta-analysis 30 articles were included (Simchuk et al., 2000; Chatzicostas et al., 2003; Gurleyik et al., 2005; Vriens et al., 2005; Huang et al., 2010; Papachristou et al., 2010; Bollen et al., 2011, 2012; Fabre et al., 2012; Lautz et al., 2012; Jakchairoongruang and Arjhansiri, 2013; Khanna et al., 2013; Park et al., 2013; Xu et al., 2014; Banday et al., 2015; Cho et al., 2015; Qiu et al., 2015; Sharma et al., 2015; Yue et al., 2015; Alper et al., 2016; Hashimoto et al., 2016; Lee et al., 2016; Raghuwanshi et al., 2016; Yadav et al., 2016; Yang et al., 2016; Zhao et al., 2016; Biberoglu et al., 2017; Kumar et al., 2017; Sahu et al., 2017; Fei et al., 2018), which contained the data of 5,988 patients. The main characteristics of the included studies are shown in Table 2.
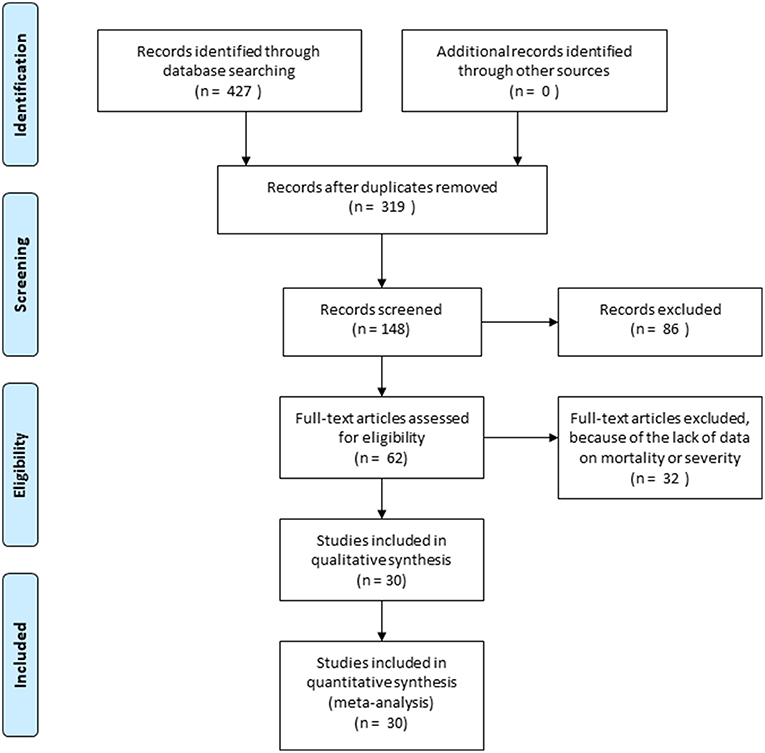
Figure 1. Flowchart of study selection.
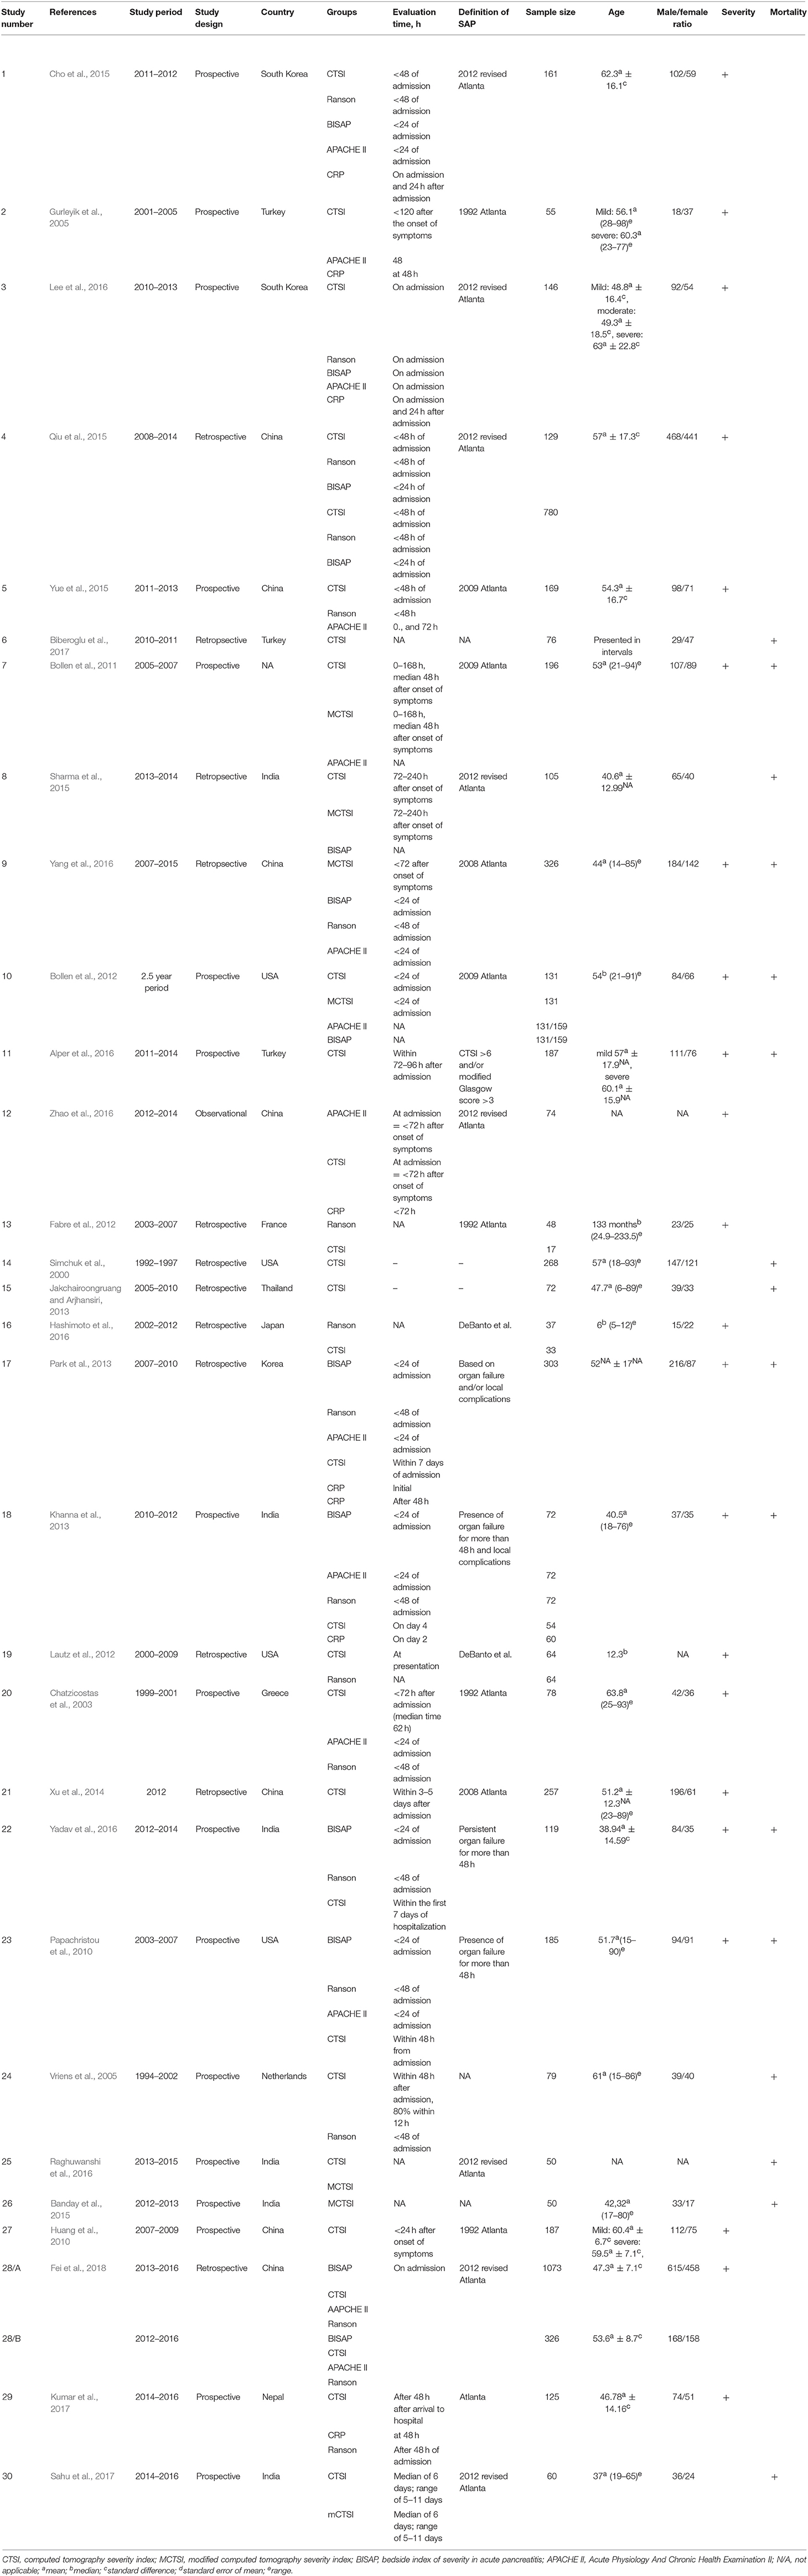
Table 2. Basic characteristics of the included studies.
Prediction of Mortality
From the 30 articles, 11 contained data on AUC for the prediction of mortality (Figure 2). Table 3 summarizes the study numbers, sample sizes, AUC, and heterogeneity data of the different severity scores based on the outcome of AP. For CTSI based on data from 10 articles, the pooled AUC for mortality was 0.79 (CI 0.73–0.86; heterogeneity I2 = 83%, p < 0.001). Eight articles included AUC data for mortality for BISAP, the pooled AUC was 0.87 (CI 0.83–0.90; heterogeneity I2 = 0%, p = 0.578). The pooled AUC for mCTSI was 0.80 (CI 0.72–0.89; heterogeneity I2 = 79.4%, p = 0.001) according to five studies. Only two studies reported AUC data predicting mortality for CRP level, and the pooled AUC was 0.73 (CI 0.66–0.81; heterogeneity I2 = 0%, p = 0.708) Six articles included AUC data for mortality for Ranson score with a pooled AUC of 0.87 (CI 0.81–0.92; heterogeneity I2 = 65.6%, p = 0.013) and also for APACHE II score with a pooled AUC of 0.91 (CI 0.88–0.93; heterogeneity I2 = 4.8%, p = 0.386).
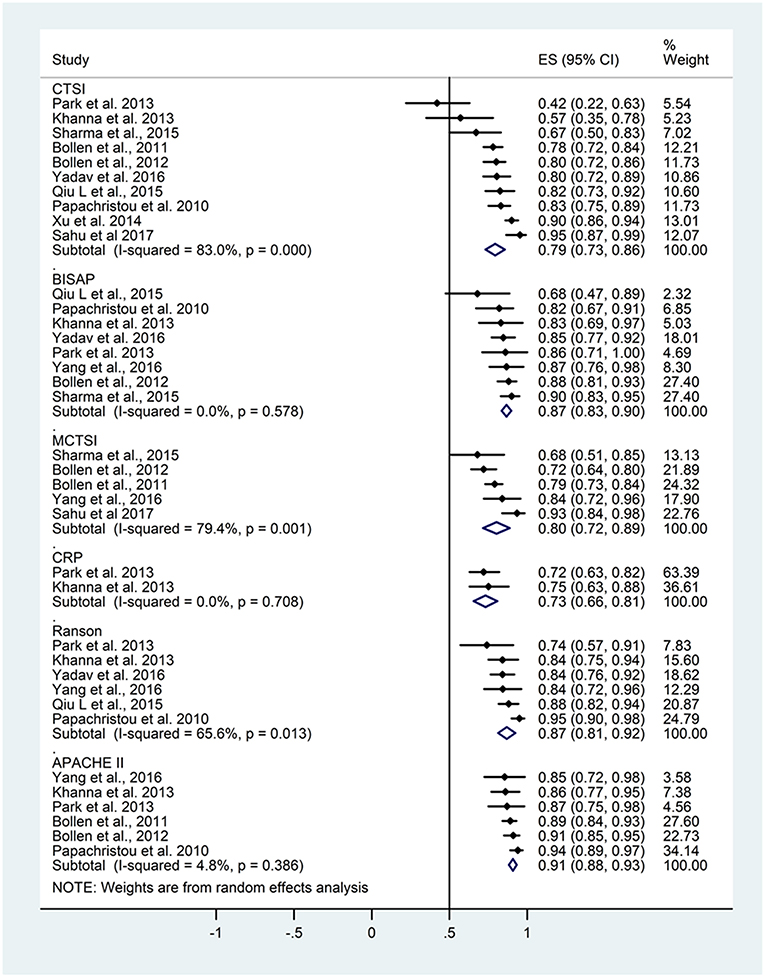
Figure 2. Area under the curve (AUC) summarizing the predictive performance of scoring systems regarding mortality in acute pancreatitis. Size of squares for effect size reflects weight of studies in pooled analysis. Horizontal bars represent 95% confidence intervals (CI). CTSI, computed tomography severity index; BISAP, bedside index of severity in acute pancreatitis; mCTSI, modified computed tomography severity index; CRP, C-reactive protein; APACHE II, Acute Physiology And Chronic Health Examination II. The vertical line represents the line of no effect.
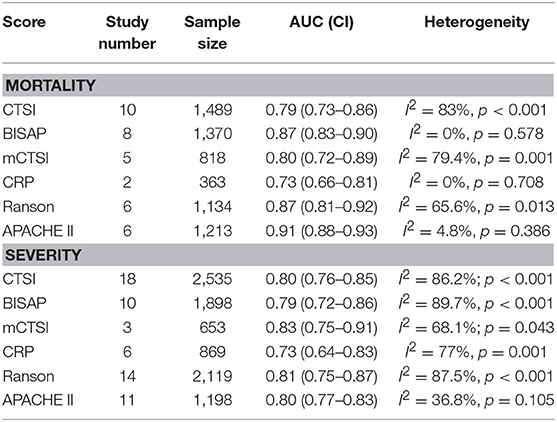
Table 3. Summary table of mortality and severity data based on the forest plots.
Based on the above results of the meta-analytical calculations the APACHE II scoring system had significantly higher predictive accuracy for mortality than CTSI or CRP level (p = 0.001; p < 0.001, respectively). However, CTSI was not different from the BISAP, mCTSI, CRP or Ranson criteria in the prediction of mortality of AP, and these scores can be classified as good and fair.
Prediction of Severity
AUC data for severity were included in 19 studies (Figure 3).
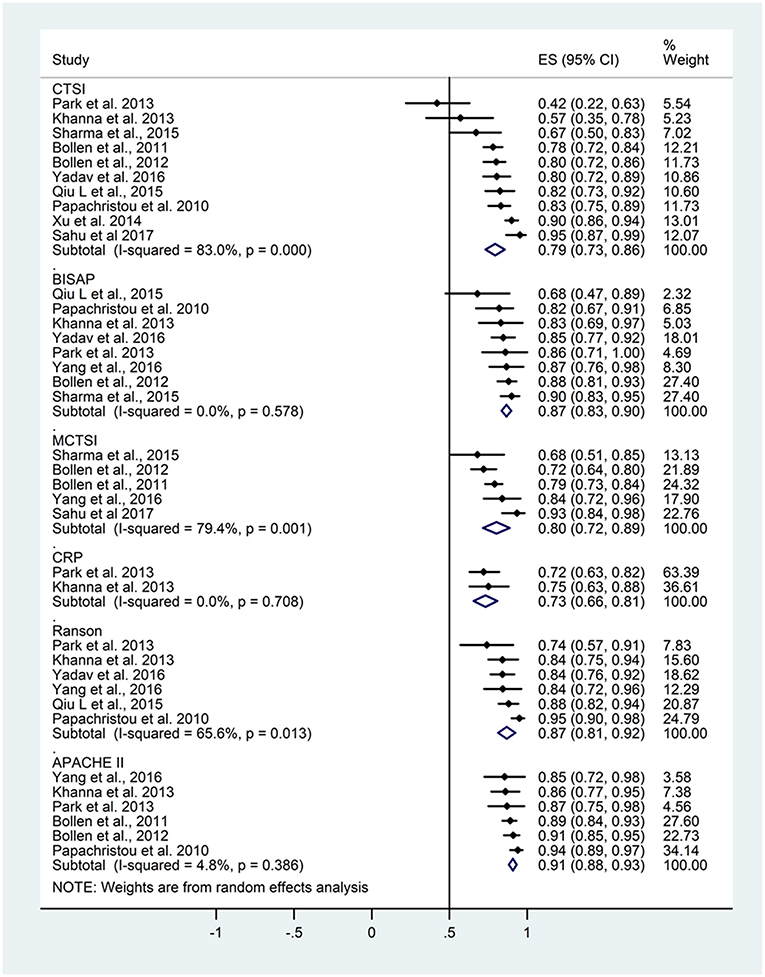
Figure 3. Area under the curve (AUC) summarizing the predictive performance of scoring systems regarding severity in acute pancreatitis. Size of squares for effect size reflects weight of trial in pooled analysis. Horizontal bars represent 95% confidence intervals (CI). CTSI, computed tomography severity index; BISAP, bedside index of severity in acute pancreatitis; mCTSI, modified computed tomography severity index; CRP, C-reactive protein; APACHE II, Acute Physiology And Chronic Health Examination II. The vertical line represents the line of no effect.
The pooled AUC for severity based on data from 18 articles was 0.80 (CI 0.76–0.85) for CTSI with high heterogeneity (I2 = 86.2%; p < 0.001). The pooled AUC for BISAP was 0.79 (CI 0.72–0.86, heterogeneity I2 = 89.7%, p < 0.001). The pooled AUC for mCTSI from three studies was 0.83 (CI 0.75–0.91) with substantial heterogeneity (I2 = 68.1%; p = 0.043). The pooled AUC was 0.73 (CI 0.64–0.83) for CRP level (heterogeneity: I2 = 77%, p = 0.001), 0.81 (CI 0.75–0.87) for Ranson score (heterogeneity I2 = 87.5%, p < 0.001), and 0.80 (CI 0.77–0.83) for APACHE II score (heterogeneity I2 = 36.8%, p = 0.105).
There was no statistical difference between the severity predicting values of the different scoring systems. The heterogeneity values were I2 = 86.2%, p < 0.001; I2 = 89.7%, p < 0.001; I2 = 68.1%, p = 0.043; I2 = 77%, p = 0.001; I2 = 87.5%, p < 0.001; I2 = 36.8%, p = 0.105 for CTSI, BISAP, mCTSI, CRP, Ranson, and APACHE II scores, respectively. The heterogeneity across the studies was significant in all scoring systems or predicting values, except for the APACHE II score. Based on the results of the meta-analytical calculations, the severity prediction values of the included scoring systems are not different.
HSROC Analysis of Different Scoring Systems for Predicting Mortality and Severity of AP
Figure 4A shows the application of CTSI in the form of HSROC curves for mortality [sensitivity: 0.88 (CI 0.69–0.97); specificity: 0.61 (CI 0.52–0.70); DOR: 12.84 (CI 4.19–39.41)] and Figure 4B for severity, respectively [sensitivity: 0.81 (CI 0.73–0.87); specificity: 0.82 (CI 0.73–0.88); DOR: 19.1 (CI 10.29–35.45)]. Figure 5A illustrates the bivariate HSROC curve of BISAP score for mortality [sensitivity: 0.88 (CI 0.71–0.96); specificity: 0.77 (CI 0.70–0.83); DOR: 24.74 (CI 9.44–64.81)] and Figure 5B for severity, respectively [sensitivity: 0.73 (CI 0.53–0.87); specificity: 0.80 (CI 0.72–0.88); DOR: 11.71 (CI 4.49–30.61)]. Figure 6A shows the application of mCTSI in the form of HSROC curves for mortality [sensitivity: 0.95 (CI 0.76–0.99); specificity: 0.36 (CI 0.16–0.63); DOR: 10.32 (CI 2.11–50.53)] and Figure 6B for severity, respectively [sensitivity: 0.88 (CI 0.47–0.98); specificity: 0.80 (CI 0.56–0.92); DOR: 29.07 (CI 3.36–251.91)]. Figure 7 illustrates the bivariate HSROC curve of CRP score for severity [sensitivity: 0.71 (CI 0.59–0.81); specificity: 0.87 (CI 0.66–0.96); DOR: 16.75 (CI 3.49–80.48)]. Figure 8A illustrates the bivariate HSROC curve of Ranson score for mortality [sensitivity: 0.91 (CI 0.70–0.98); specificity: 0.72 (CI 0.66–0.79); DOR: 28.72 (CI 7.57–109.05)] and Figure 8B for severity, respectively [sensitivity: 0.79 (CI 0.69–0.86); specificity: 0.78 (CI 0.71–0.84); DOR: 13.32 (CI 7.33–24.24)]. Figure 9A illustrates the bivariate HSROC curve of APACHE II score for mortality [sensitivity: 0.92 (CI 0.70–0.98); specificity: 0.79 (CI 0.66–0.88); DOR: 45.08 (CI 11.4–178.2)] and Figure 9B for severity, respectively [sensitivity: 0.71 (CI 0.60–0.79); specificity: 0.80 (CI 0.71–0.88); DOR: 9.94 (CI 6.45–15.30)].
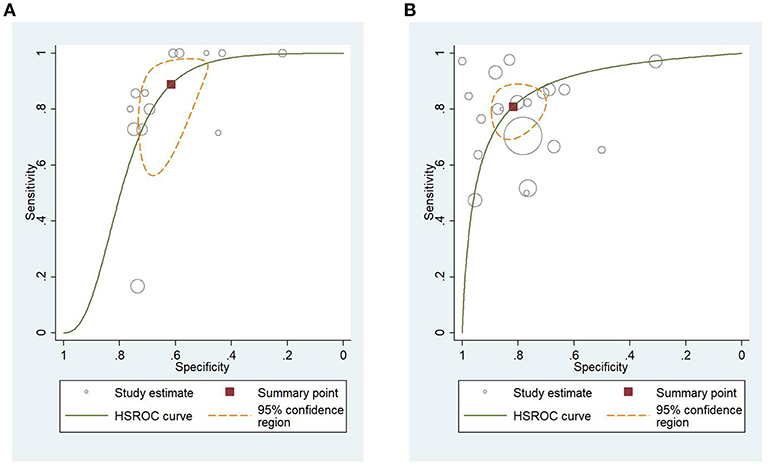
Figure 4. (A) Hierarchial summary receiver operating characteristic curves (HSROC) for computed tomography severity index (CTSI) for predicting mortality of acute pancreatitis. (B) HSROC for CTSI for predicting severity of acute pancreatitis.
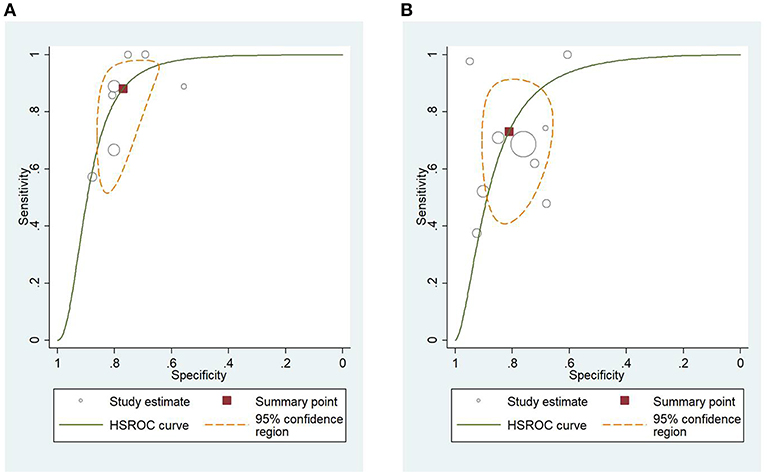
Figure 5. (A) Hierarchial summary receiver operating characteristic curves (HSROC) for bedside index of severity in acute pancreatitis (BISAP) for predicting mortality. (B) HSROC for BISAP for predicting severity of acute pancreatitis.
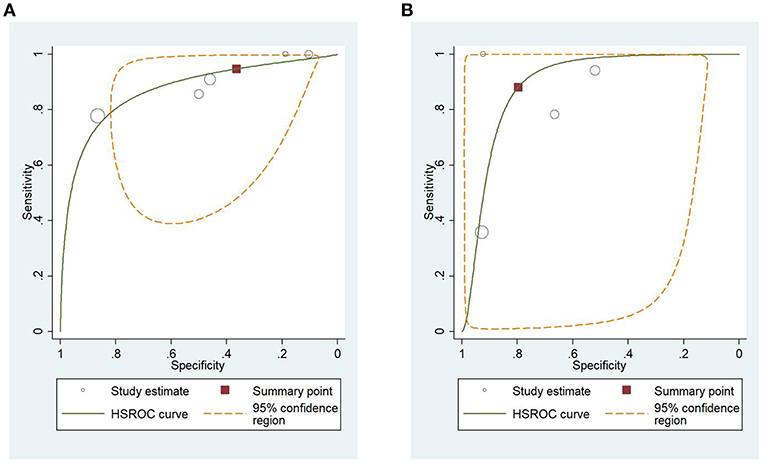
Figure 6. (A) Hierarchial summary receiver operating characteristic curves (HSROC) for modified computed tomography severity index (mCTSI) for predicting mortality of acute pancreatitis. (B) HSROC for mCTSI for predicting severity of acute pancreatitis.
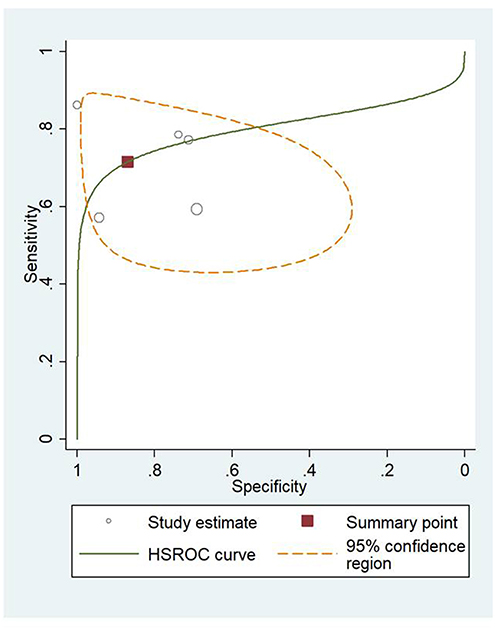
Figure 7. Hierarchial summary receiver operating characteristic curves (HSROC) for C-reactive protein (CRP) for predicting severity of acute pancreatitis.
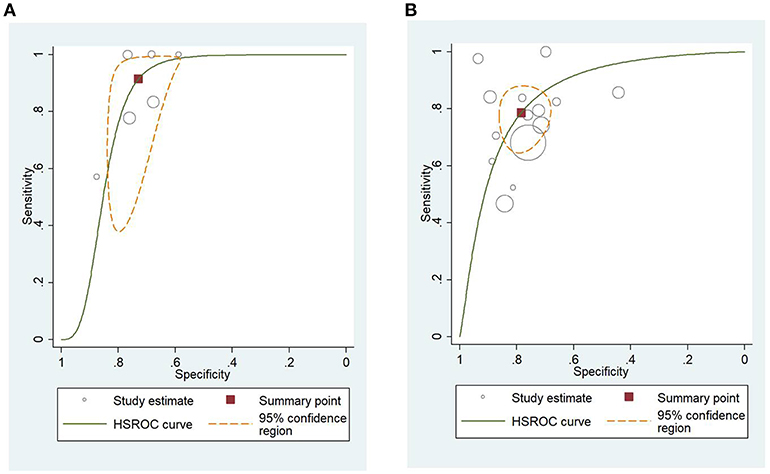
Figure 8. (A) Hierarchial summary receiver operating characteristic curves (HSROC) for Ranson score for predicting mortality of acute pancreatitis. (B) HSROC for Ranson score for predicting severity of acute pancreatitis.
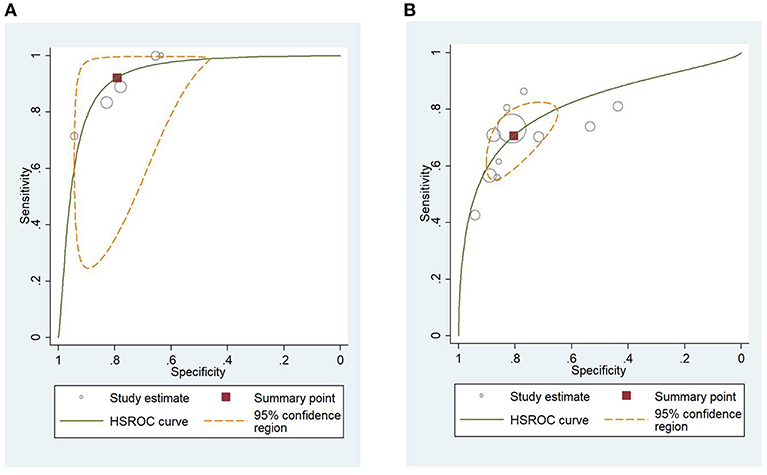
Figure 9. (A) Hierarchial summary receiver operating characteristic curves (HSROC) for Acute Physiology And Chronic Health Examination II (APACHE II) score for predicting mortality of acute pancreatitis. (B) HSROC for APACHE II score for predicting severity of acute pancreatitis.
Sensitivity, specificity, and DOR data of all scores predicting mortality and severity are summarized in Table 4. In summary, the sensitivity for the prediction of mortality of AP was the highest for mCTSI, Ranson, and APACHE II scores. While the specificity for prediction of mortality was the best for APACHE II, BISAP, and Ranson scores. The sensitivity for the prediction of severity of CTSI, mCTSI, and Ranson scores were the highest, while the specificity for prediction of severity were the highest for CRP and CTSI.
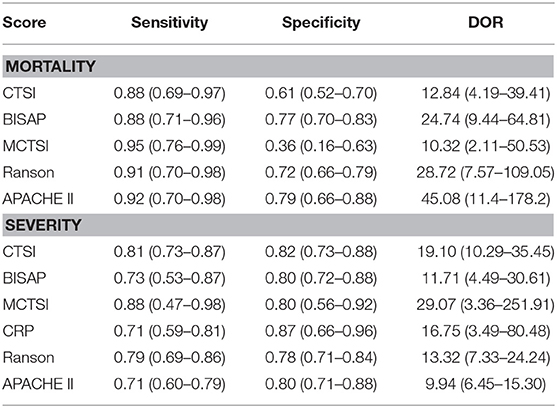
Table 4. Summary table of mortality and severity data based on the HSROC curves.
Quality Assessment and Risk of Bias
In this study, the two main outcomes were mortality and severity of the disease, therefore, we included the data in two different tables. The majority of the studies included in our analysis met the predefined criteria of the definition of AP and contained all grades of severities, therefore the risk of bias regarding the included populations was deemed as low. The data on CTSI from all studies were significantly limited by the timeframe the CT was done from either the admission or the onset of the symptoms and the diagnosis of AP. Therefore, this is the main limitation of the applicability of our results on CTSI. The result of the risk of bias and applicability assessment is showed in Tables 5A,B.
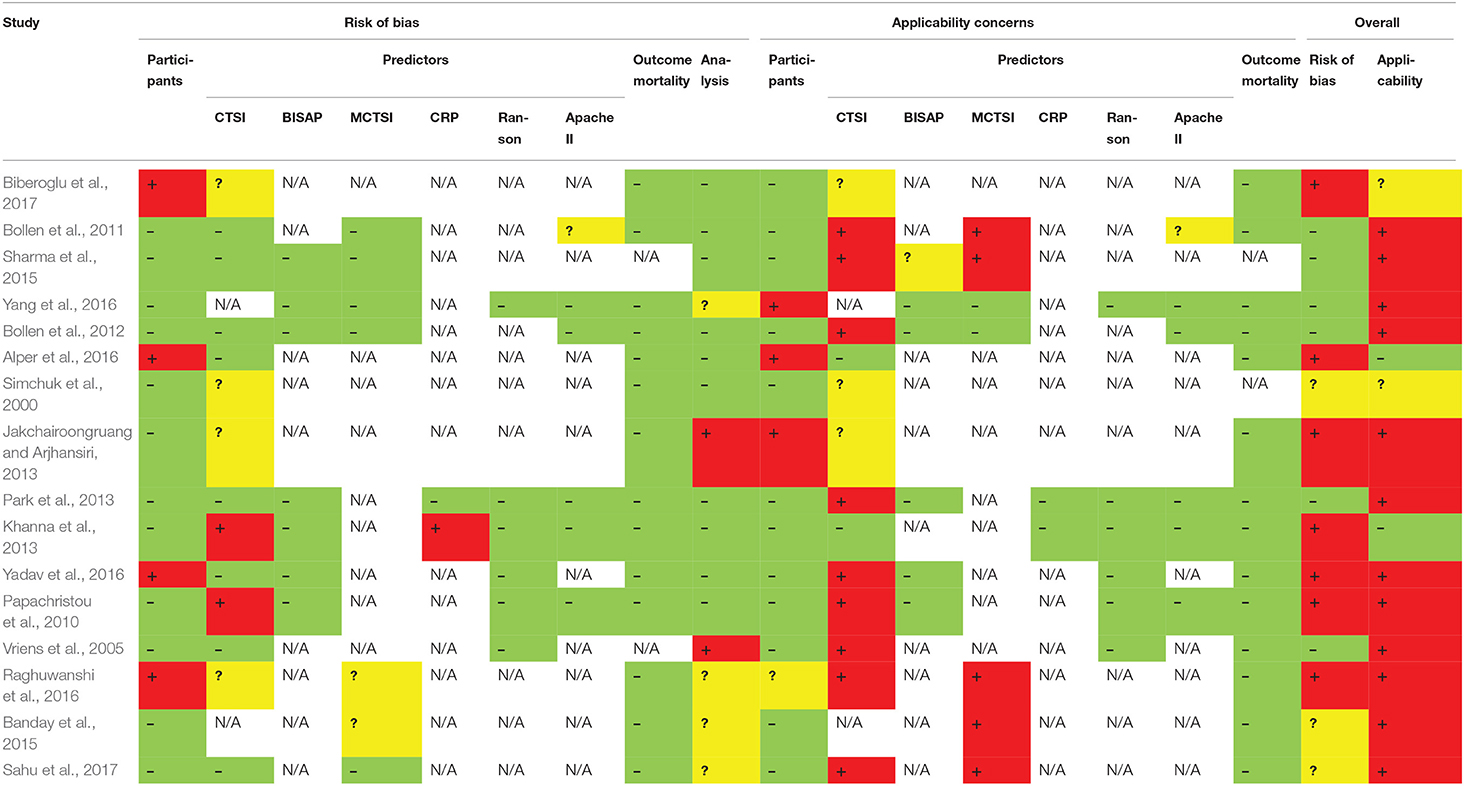
TABLE 5A. The PROBAST Tool for mortality.
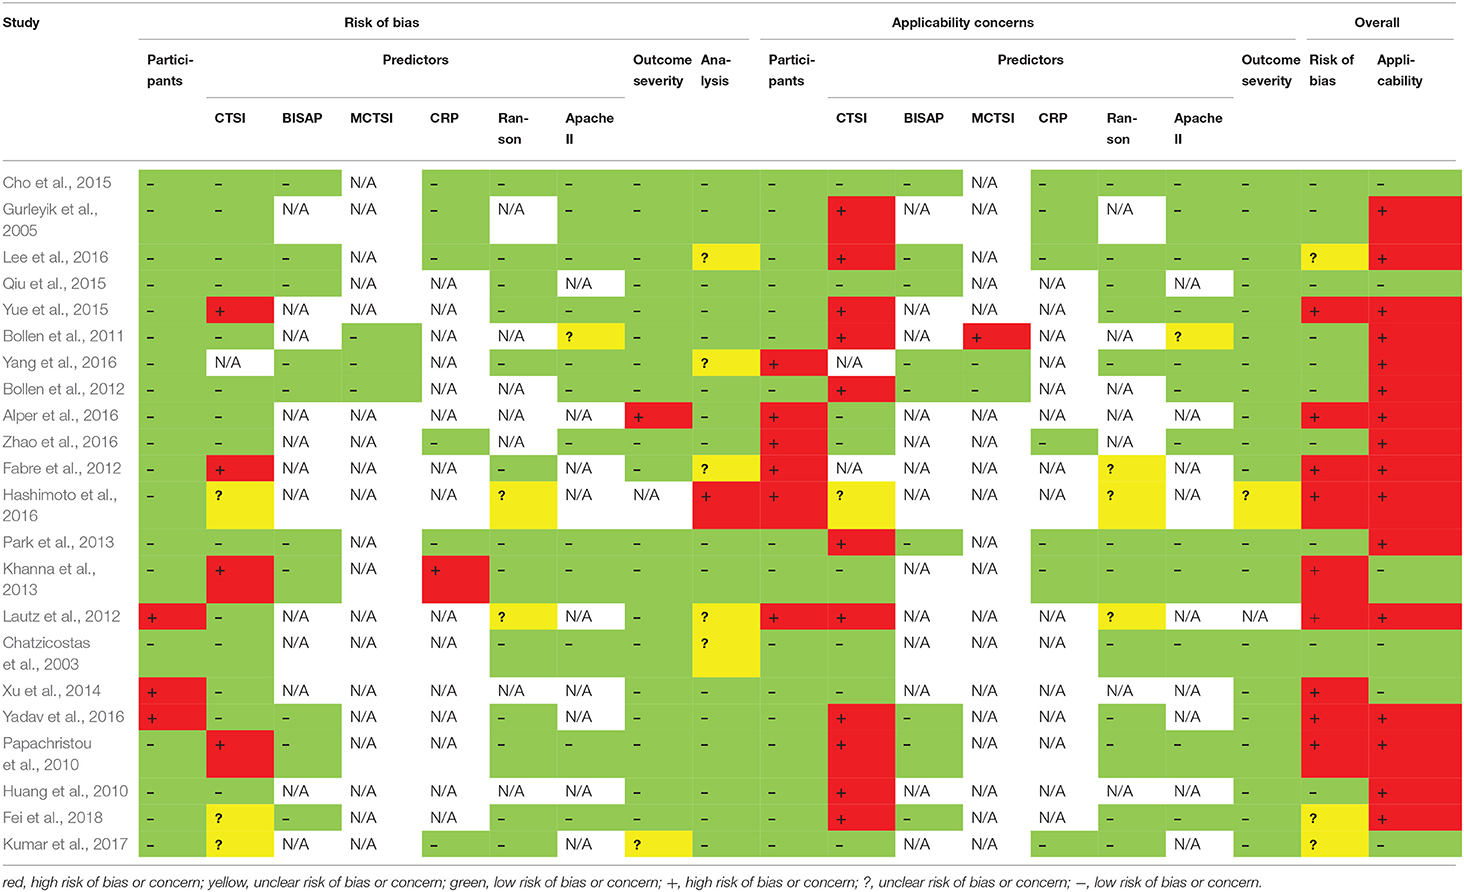
TABLE 5B. The PROBAST Tool for severity.
Discussion
Summary of Main Findings
Severe acute pancreatitis is a serious state with high mortality and it requires high costs of the health care system. By more accurate prediction of the severity on admission, the risk of mortality can be reduced with the immediate optimal therapy.
Acute pancreatitis is diagnosed on the basis of the presence of two or more of the following three criteria: abdominal pain consistent with the diagnosis elevated pancreatic enzymes to a level of more than three times the upper normal value, and characteristic findings on abdominal imaging. Different radiological modalities (ultrasound, CT) are not only necessary to make the diagnosis of AP, but by the visualization of the gallbladder and biliary tract, they can reveal its etiology as biliary or non-biliary. Furthermore, by using morphological scoring systems e.g., CTSI or mCTSI, obtaining a CT scan can be useful for assessing the severity of AP.
This is the first meta-analysis, which quantifies the accuracy of CTSI and mCTSI scores for the prediction of the severity and mortality of AP, and compares them with other commonly used scoring systems. Two previous meta-analyses (Gao et al., 2015; Yang and Li, 2016) assessed the predictive accuracy of the BISAP score, but these articles did not contain CTSI nor mCTSI. Yang and Li (2016) found that the pooled sensitivity and specificity of the BISAP for the prediction of SAP were 0.65 (CI: 0.54–0.74) and 0.84 (CI: 0.70–0.92), respectively, the pooled AUC was 0.77 (CI: 0.73–0.80). Gao et al. (2015) calculated the pooled sensitivity as 0.51 (CI: 0.43–0.60), the specificity as 0.91 (CI: 0.89–0.92), the AUC was 0.87. Based on our results, we calculated 0.73 (CI: 0.53–0.87) for sensitivity, 0.80 (CI: 0.72–0.88) for specificity, and our pooled AUC was 0.79. The results are similar, the difference in specificity between our results and those of Gao et al. (2015) may be explained by the higher numbers of articles included in our analysis.
In our meta-analysis, APACHE II proved to be the most accurate scoring system for the prediction of mortality. It is the most widely used mortality prediction score in critically ill patients, however, it contains 12 points, including numerous clinical parameters, hence its application can be cumbersome and it limits its widespread use. In addition, APACHE II is designed for patients admitted to the intensive care unit, therefore it is not suitable for the early prediction of severity of AP. The AUC's of BISAP, mCTSI, and Ranson scores overlapped with APACHE II, while those of CTSI and CRP were mildly weaker.
Computed tomography severity index is accurate to predict severity, and its accuracy did not differ from the other scoring systems. However, the Ranson, APACHE II, and BISAP scores include several clinical parameters. There is a good correlation between morphological severity according to CT scoring systems and clinical scoring systems using clinical data and laboratory parameters.
The most recent guidelines of AP recommend a CT scan 72–96 h after the onset of the symptoms (Working Group IAP/APA Acute Pancreatitis Guidelines., 2013; Hritz et al., 2015), because pancreatic parenchymal necrosis in contrast-enhanced CT rarely appears within 48 h (Ryu, 2009). The guidelines allow an earlier CT scan in case of diagnostic uncertainty.
However, the contrast-enhanced CT examination cannot always be performed in every patient. In extreme obese patients, body weight, and size preclude the CT investigation. The contrast-enhanced CT assessment requires an intravenous injection of iodinated contrast medium for the detection of hypoperfused areas in pancreas parenchyma, therefore intravenous contrast media allergy, impaired renal function, and hyperthyroidism are contraindications.
Because of the risk of radiation exposure, repeated CT scans should be avoided, and should be reserved for patients who fail to improve clinically. CT examination had shown an advantage in evaluation of local complications (Ju et al., 2006), which can modify therapeutical strategy.
Contrary to the evaluation of Ranson, BISAP, and APACHE II scores, contrast-enhanced CT assessment, and CTSI calculation require radiological expertise.
Limitations
Three of the articles contained data of children (Fabre et al., 2012; Lautz et al., 2012; Hashimoto et al., 2016), in 2 from these articles the DeBanto score was used for evaluating the severity of AP, which is a specific score for pediatric pancreatitis. The AP population of the studies is not necessarily representative for the whole AP population, because the CT scan is mostly performed in the more severe cases. In several studies not all etiologies of AP were included, Yang et al. included only patients with hyperlipidemic etiology while Alper et his coworkers included only biliary AP cases. Fifteen of the included studies were retrospectively designed, and these might have caused selection bias. The time of CTSI and mCTSI was not the same in the studies, in several studies it included a longer delay, while in others it was carried out on admission, leading to higher heterogeneity. While APACHE II, Ranson, BISAP and CRP values were established mostly on admission or within the first 48 h, the optimal timing of the CT examination 72–96 h after the onset of the symptoms and in several studies it was performed later than the other prognostic scores. This can limitate the prognostic score of the CTSI because the other scores can predict earlier severity or mortality with similar accuracy. It is also a good question if the radiologist can judge the time point of necrosis development. In populations with previous necrotizing pancreatitis, the severity cannot be accurately assessed.
For the value of predicting mortality, a considerable heterogeneity for CTSI and a substantial heterogeneity for Ranson score can be observed, while for the severity predicting value of AP a considerable heterogeneity for CTSI, BISAP, CRP, and Ranson scores and substantial heterogeneity for mCTSI can be noticed. We suspect that the confounder factors, that cause high heterogeneity among the studies are because of different population in terms of ethnicity, BMI, age (etc.), and etiology, the different timing and interpretation of imaging modalities, and potential inter observer variability between the radiologists interpreting the CT images. Because of the long delay characterizing the studies, the severity was assessed according to several Atlanta classifications and definitions.
Conclusions
Implications for Practice
In the prediction of mortality in AP, CTSI was revealed as equally valuable as BISAP, mCTSI, CRP, or Ranson score, only APACHE II score overcame its predicting ability. Considering severity, there was no difference in the prediction value of the scores. If CT scans are performed, CTSI and mCTSI can be easily calculated and should be used in addition to the other scoring systems.
Implications for Research
Further research is warranted for the assessment of the effect of early CT and its predictive value in AP.
Data Availability
The datasets generated for this study are available on request to the corresponding author.
Author Contributions
ÉV and PH designed the research and the study concept. ÉV and AM performed the acquisition of data. PM and AS analyzed and interpreted the data. ÉV, AM, PM, AS, and PH wrote the article. AG, MB, BE, and LC supervised the study. BM, BE, JT, PS, and IR made a critical revision of the manuscript for important intellectual content. All of the authors gave their final approval of the version of the article to be published.
Funding
This study was supported by Project Grants (K116634 and KH125678 to PH) and Economic Development and Innovation Operative Programme Grant (GINOP 2.3.2-15-2016-00048 to PH) and Human Resources Development Operational Programme Grant (EFOP-3.6.2-16-2017-00006 to PH) of the National Research, Development and Innovation Office and by a Momentum Grant of the Hungarian Academy of Sciences (LP2014-10/2014 to PH), and Grant of the University of Pécs (KA-2019-14 to AM).
Conflict of Interest Statement
The authors declare that the research was conducted in the absence of any commercial or financial relationships that could be construed as a potential conflict of interest.
Supplementary Material
The Supplementary Material for this article can be found online at: https://www.frontiersin.org/articles/10.3389/fphys.2019.01002/full#supplementary-material
Footnotes
References
Alper, E., Arabul, M., Aslan, F., Cekic, C., Celik, M., Ipek, S., et al. (2016). Radial EUS examination can be helpful in predicting the severity of acute biliary pancreatitis. Medicine (Baltimore) 95:e2321. doi: 10.1097/MD.0000000000002321
Balthazar, E. J., Robinson, D. L., Megibow, A. J., and Ranson, J. H. (1990). Acute pancreatitis: value of CT in establishing prognosis. Radiology 174, 331–336. doi: 10.1148/radiology.174.2.2296641
Banday, I. A., Gattoo, I., Khan, A. M., Javeed, J., Gupta, G., and Latief, M. (2015). Modified computed tomography severity index for evaluation of acute pancreatitis and its correlation with clinical outcome: a tertiary care hospital based observational study. J. Clin. Diagn. Res. 9, TC01–TC05. doi: 10.7860/JCDR/2015/14824.6368
Banks, P. A., Bollen, T. L., Dervenis, C., Gooszen, H. G., Johnson, C. D., Sarr, M. G., et al. (2013). Classification of acute pancreatitis−2012: revision of the Atlanta classification and definitions by international consensus. Gut 62, 102–111. doi: 10.1136/gutjnl-2012-302779
Biberoglu, S., Koyuncu, M., Ozturk, D., Toksoz, A. C., Cakmakci, E., Cakmak, F., et al. (2017). Role of computed tomography severity index in acute diagnosis and follow-up of acute pancreatitis. J. Clin. Anal. Med. 8, 106–110. doi: 10.4328/JCAM.4627
Bollen, T. L., Singh, V. K., Maurer, R., Repas, K., Van Es, H. W., Banks, P. A., et al. (2011). Comparative evaluation of the modified CT severity index and CT severity index in assessing severity of acute pancreatitis. AJR Am. J. Roentgenol. 197, 386–392. doi: 10.2214/AJR.09.4025
Bollen, T. L., Singh, V. K., Maurer, R., Repas, K., Van Es, H. W., Banks, P. A., et al. (2012). A comparative evaluation of radiologic and clinical scoring systems in the early prediction of severity in acute pancreatitis. Am. J. Gastroenterol. 107, 612–619. doi: 10.1038/ajg.2011.438
Chatzicostas, C., Roussomoustakaki, M., Vardas, E., Romanos, J., and Kouroumalis, E. A. (2003). Balthazar computed tomography severity index is superior to Ranson criteria and APACHE II and III scoring systems in predicting acute pancreatitis outcome. J. Clin. Gastroenterol. 36, 253–260. doi: 10.1097/00004836-200303000-00013
Cho, J. H., Kim, T. N., Chung, H. H., and Kim, K. H. (2015). Comparison of scoring systems in predicting the severity of acute pancreatitis. World J. Gastroenterol. 21, 2387–2394. doi: 10.3748/wjg.v21.i8.2387
Fabre, A., Petit, P., Gaudart, J., Mas, E., Vial, J., Olives, J. P., et al. (2012). Severity scores in children with acute pancreatitis. J. Pediatr. Gastroenterol. Nutr. 55, 266–267. doi: 10.1097/MPG.0b013e318254c1c7
Fei, Y., Gao, K., Tu, J., Wang, W., Zong, G.-Q., and Li, W.-Q. (2018). Predicting and evaluation the severity in acute pancreatitis using a new modeling built on body mass index and intra-abdominal pressure. Am. J. Surg. 216, 304–309. doi: 10.1016/j.amjsurg.2017.04.017
Gao, W., Yang, H.-X., and Ma, C.-E. (2015). The value of BISAP score for predicting mortality and severity in acute pancreatitis: a systematic review and meta-analysis. PLoS ONE 10:e0130412. doi: 10.1371/journal.pone.0142025
Gurleyik, G., Emir, S., Kilicoglu, G., Arman, A., and Saglam, A. (2005). Computed tomography severity index, APACHE II score, and serum CRP concentration for predicting the severity of acute pancreatitis. JOP 6, 562–567.
Hashimoto, N., Yotani, N., Michihata, N., Tang, J., Sakai, H., and Ishiguro, A. (2016). Efficacy of pediatric acute pancreatitis scores at a Japanese tertiary center. Pediatr. Int. 58, 224–228. doi: 10.1111/ped.12774
Higgins, J. P. T., and Green, S. (eds),. (2011). Cochrane Handbook for Systematic Reviews of Interventions Version 5.1.0 [updated March 2011]. The Cochrane Collaboration. Available online at: www.handbook.cochrane.org
Hritz, I., Czako, L., Dubravcsik, Z., Farkas, G., Kelemen, D., Lasztity, N., et al. (2015). [Acute pancreatitis. Evidence-based practice guidelines, prepared by the Hungarian Pancreatic Study Group]. Orv. Hetil. 156, 244–261. doi: 10.1556/OH.2015.30059
Huang, Q. L., Qian, Z. X., and Li, H. (2010). A comparative study of the urinary trypsinogen-2, trypsinogen activation peptide, and the computed tomography severity index as early predictors of the severity of acute pancreatitis. Hepatogastroenterology 57, 1295–1299.
Jakchairoongruang, K., and Arjhansiri, K. (2013). Prognostic value of contrast-enhanced computed tomography in acute pancreatitis. Asian Biomed. 7, 357–364. doi: 10.5372/1905-7415.0703.187
Ju, S., Chen, F., Liu, S., Zheng, K., and Teng, G. (2006). Value of CT and clinical criteria in assessment of patients with acute pancreatitis. Eur. J. Radiol. 57, 102–107. doi: 10.1016/j.ejrad.2005.07.010
Khanna, A. K., Meher, S., Prakash, S., Tiwary, S. K., Singh, U., Srivastava, A., et al. (2013). Comparison of Ranson, Glasgow, MOSS, SIRS, BISAP, APACHE-II, CTSI scores, IL-6, CRP, and procalcitonin in predicting severity, organ failure, pancreatic necrosis, and mortality in acute pancreatitis. HPB Surg. 2013:367581. doi: 10.1155/2013/367581
Kumar, S., Jalan, A., Patowary, B. N., and Bhandari, U. (2017). To access the role of serum procalcitonin in predicting the severity of acute pancreatitis. Kathmandu Univ. Med. J. (KUMJ). 15, 19–24.
Lankisch, P. G., Apte, M., and Banks, P. A. (2015). Acute pancreatitis. Lancet 386, 85–96. doi: 10.1016/S0140-6736(14)60649-8
Lautz, T. B., Turkel, G., Radhakrishnan, J., Wyers, M., and Chin, A. C. (2012). Utility of the computed tomography severity index (Balthazar score) in children with acute pancreatitis. J. Pediatr. Surg. 47, 1185–1191. doi: 10.1016/j.jpedsurg.2012.03.023
Lee, K. J., Kim, H. M., Choi, J. S., Kim, Y. J., Kim, Y. S., and Cho, J. H. (2016). Comparison of predictive systems in severe acute pancreatitis according to the revised atlanta classification. Pancreas 45, 46–50. doi: 10.1097/MPA.0000000000000433
Moher, D., Liberati, A., Tetzlaff, J., Altman, D. G., and Group, P. (2009). Preferred reporting items for systematic reviews and meta-analyses: the PRISMA statement. PLoS Med. 6:e1000097. doi: 10.1371/journal.pmed.1000097
Mortele, K. J., Wiesner, W., Intriere, L., Shankar, S., Zou, K. H., Kalantari, B. N., et al. (2004). A modified CT severity index for evaluating acute pancreatitis: improved correlation with patient outcome. Am. J. Roentgenol. 183, 1261–1265. doi: 10.2214/ajr.183.5.1831261
Papachristou, G. I., Muddana, V., Yadav, D., O'connell, M., Sanders, M. K., Slivka, A., et al. (2010). Comparison of BISAP, Ranson's, APACHE-II, and CTSI scores in predicting organ failure, complications, and mortality in acute pancreatitis. Am. J. Gastroenterol. 105, 435–441; quiz 442. doi: 10.1038/ajg.2009.622
Park, J. Y., Jeon, T. J., Ha, T. H., Hwang, J. T., Sinn, D. H., Oh, T. H., et al. (2013). Bedside index for severity in acute pancreatitis: comparison with other scoring systems in predicting severity and organ failure. Hepatobiliary Pancreat. Dis. Int. 12, 645–650. doi: 10.1016/S1499-3872(13)60101-0
Parniczky, A., Kui, B., Szentesi, A., Balazs, A., Szucs, A., Mosztbacher, D., et al. (2016). Prospective, multicentre, nationwide clinical data from 600 cases of acute pancreatitis. PLoS ONE 11:e0165309. doi: 10.1371/journal.pone.0165309
Qiu, L., Sun, R. Q., Jia, R. R., Ma, X. Y., Cheng, L., Tang, M. C., et al. (2015). Comparison of existing clinical scoring systems in predicting severity and prognoses of hyperlipidemic acute pancreatitis in Chinese patients: a retrospective study. Medicine (Baltimore). 94:e957. doi: 10.1097/MD.0000000000000957
Raghuwanshi, S., Gupta, R., Vyas, M. M., and Sharma, R. (2016). CT evaluation of acute pancreatitis and its prognostic correlation with CT severity index. J. Clin. Diagn. Res. 10, TC06–TC11. doi: 10.7860/JCDR/2016/19849.7934
Ranson, J. H., and Pasternack, B. S. (1977). Statistical methods for quantifying the severity of clinical acute pancreatitis. J. Surg. Res. 22, 79–91. doi: 10.1016/0022-4804(77)90045-2
Ryu, J. K. (2009). [Evaluation of severity in acute pancreatitis]. Korean J. Gastroenterol. 54, 205–211. doi: 10.4166/kjg.2009.54.4.205
Sahu, B., Abbey, P., Anand, R., Kumar, A., Tomer, S., and Malik, E. (2017). Severity assessment of acute pancreatitis using CT severity index and modified CT severity index: correlation with clinical outcomes and severity grading as per the Revised Atlanta Classification. Indian J. Radiol. Imaging 27:152. doi: 10.4103/ijri.IJRI_300_16
Sharma, V., Rana, S. S., Sharma, R. K., Kang, M., Gupta, R., and Bhasin, D. K. (2015). A study of radiological scoring system evaluating extrapancreatic inflammation with conventional radiological and clinical scores in predicting outcomes in acute pancreatitis. Ann. Gastroenterol. 28, 399–404.
Simchuk, E. J., Traverso, L. W., Nukui, Y., and Kozarek, R. A. (2000). Computed tomography severity index is a predictor of outcomes for severe pancreatitis. Am. J. Surg. 179, 352–355. doi: 10.1016/S0002-9610(00)00375-5
Sternby, H., Hartman, H., Johansen, D., Thorlacius, H., and Regner, S. (2017). IL-6 and CRP are superior in early differentiation between mild and non-mild acute pancreatitis. Pancreatology 17, 550–554. doi: 10.1016/j.pan.2017.05.392
Szentesi, A., Toth, E., Balint, E., Fanczal, J., Madacsy, T., Laczko, D., et al. (2016). Analysis of research activity in gastroenterology: pancreatitis is in real danger. PLoS ONE 11:e0165244. doi: 10.1371/journal.pone.0165244
Vriens, P. W., Van De Linde, P., Slotema, E. T., Warmerdam, P. E., and Breslau, P. J. (2005). Computed tomography severity index is an early prognostic tool for acute pancreatitis. J. Am. Coll. Surg. 201, 497–502. doi: 10.1016/j.jamcollsurg.2005.06.269
Wolff, R. F., Moons, K. G. M., Riley, R. D., Whiting, P. F., Westwood, M., Collins, G. S., et al. (2019). PROBAST: a tool to assess the risk of bias and applicability of prediction model studies. Ann. Intern. Med. 170, 51–58. doi: 10.7326/M18-1376
Working Group IAP/APA Acute Pancreatitis Guidelines. (2013). IAP/APA evidence-based guidelines for the management of acute pancreatitis. Pancreatology 13, e1–15. doi: 10.1016/j.pan.2013.07.063
Wu, B. U., Johannes, R. S., Sun, X., Tabak, Y., Conwell, D. L., and Banks, P. A. (2008). The early prediction of mortality in acute pancreatitis: a large population-based study. Gut 57, 1698–1703. doi: 10.1136/gut.2008.152702
Xu, H., Ebner, L., Jiang, S., Wu, Y., Christe, A., Zhang, S., et al. (2014). Retrocrural space involvement on computed tomography as a predictor of mortality and disease severity in acute pancreatitis. PLoS ONE 9:e107378. doi: 10.1371/journal.pone.0107378
Yadav, J., Yadav, S. K., Kumar, S., Baxla, R. G., Sinha, D. K., Bodra, P., et al. (2016). Predicting morbidity and mortality in acute pancreatitis in an Indian population: a comparative study of the BISAP score, Ranson's score and CT severity index. Gastroenterol. Rep. (Oxf) 4, 216–220. doi: 10.1093/gastro/gov009
Yang, L., Liu, J., Xing, Y., Du, L., Chen, J., Liu, X., et al. (2016). Comparison of BISAP, Ranson, MCTSI, and APACHE II in predicting severity and prognoses of hyperlipidemic acute pancreatitis in Chinese patients. Gastroenterol. Res. Pract. 2016:1834256. doi: 10.1155/2016/1834256
Yang, Y.-X., and Li, L. (2016). Evaluating the ability of the bedside index for severity of acute pancreatitis score to predict severe acute pancreatitis: a meta-analysis. Med. Princ. Pract. 25, 137–142. doi: 10.1159/000441003
Yeung, Y. P., Lam, B. Y., and Yip, A. W. (2006). APACHE system is better than Ranson system in the prediction of severity of acute pancreatitis. Hepatobiliary Pancreat. Dis. Int. 5, 294–299.
Yue, W., Liu, Y., Ding, W., Jiang, W., Huang, J., Zhang, J., et al. (2015). The predictive value of the prealbumin-to-fibrinogen ratio in patients with acute pancreatitis. Int. J. Clin. Pract. 69, 1121–1128. doi: 10.1111/ijcp.12682
Keywords: acute pancreatitis, CT-severity index, accuracy, severity, mortality
Citation: Mikó A, Vigh É, Mátrai P, Soós A, Garami A, Balaskó M, Czakó L, Mosdósi B, Sarlós P, Erőss B, Tenk J, Rostás I and Hegyi P (2019) Computed Tomography Severity Index vs. Other Indices in the Prediction of Severity and Mortality in Acute Pancreatitis: A Predictive Accuracy Meta-analysis. Front. Physiol. 10:1002. doi: 10.3389/fphys.2019.01002
Received: 04 June 2019; Accepted: 19 July 2019;
Published: 27 August 2019.
Edited by:
Richard T. Waldron, Cedars-Sinai Medical Center, United StatesReviewed by:
Zilvinas Dambrauskas, Lithuanian University of Health Sciences, LithuaniaChristopher Halloran, University of Liverpool, United Kingdom
Copyright © 2019 Mikó, Vigh, Mátrai, Soós, Garami, Balaskó, Czakó, Mosdósi, Sarlós, Erőss, Tenk, Rostás and Hegyi. This is an open-access article distributed under the terms of the Creative Commons Attribution License (CC BY). The use, distribution or reproduction in other forums is permitted, provided the original author(s) and the copyright owner(s) are credited and that the original publication in this journal is cited, in accordance with accepted academic practice. No use, distribution or reproduction is permitted which does not comply with these terms.
*Correspondence: Péter Hegyi, hegyi2009@gmail.com
†These authors have contributed equally to this work