 Nathaniel T. Berry1*
 Emily Bechke1
 Lenka H. Shriver2Susan D. Calkins3
 Susan P. Keane4
 Lilly Shanahan5
 Laurie Wideman1*
- 1Department of Kinesiology, The University of North Carolina at Greensboro, Greensboro, NC, United States
- 2Department of Nutrition, The University of North Carolina at Greensboro, Greensboro, NC, United States
- 3Department of Human Development and Family Studies, The University of North Carolina at Greensboro, Greensboro, NC, United States
- 4Department of Psychology, The University of North Carolina at Greensboro, Greensboro, NC, United States
- 5Department of Psychology, University of Zurich, Zurich, Switzerland
Introduction: Resting heart rate (HRrest), heart rate variability (HRV), and HR recovery (HRR) from exercise provide valuable information about cardiac autonomic control. RR-intervals during acute recovery from exercise (RRrec) are commonly excluded from HRV analyses due to issues of non-stationarity. However, the variability and complexity within these trends may provide valuable information about changes in HR dynamics.
Purpose: Assess the complexity of RRrec and determine what physiologic and demographic information are associated with differences in these indices in young adults.
Methods: RR-intervals were collected throughout maximal treadmill exercise and recovery in young adults (n = 92). The first 5 min of RRrec were (1) analyzed with previously reported methods that use 3-interval lengths for comparison and (2) detrended using both differencing(diff) and polynomial regression(res). The standard deviation of the normal interval (SDNN), root mean square of successive differences (rMSSD), root mean square (RMS) of the residual of regression, and sample entropy (SampEn) were calculated. Repeated measures analysis of covariance (ANCOVA) tested for differences in these indices for each of the methodological approaches, controlling for race, body fat, peak oxygen uptake (VO2peak), and resting HR (HRrest). Statistical significance was set at p < 0.05.
Results: VO2peak and HRrest were significantly correlated with traditional measures of HRR and the variability surrounding RRrec. SampEndiff and SampEnres were correlated with VO2peak but not HRrest or HRR. The residual-method provided a significantly (p = 0.04) lower mean standard error (MSE) (0.064 ± 0.042) compared to the differencing-method (0.100 ± 0.033).
Conclusions: Complexity analysis of RRrec provides unique information about cardiac autonomic regulation immediately following the cessation of exercise when compared to traditional measures of HRR and both HRrest and VO2peak influence these results.
Introduction
Historically, the response of heart rate (HR) and heart rate recovery (HRR) to- or following- a perturbation, has been commonly utilized within research and clinical settings as a non-invasive physiological measure of cardiovascular regulation. Several studies have shown that impairment in autonomic function—represented by delayed HRR—indicates adverse cardiovascular outcomes in otherwise healthy individuals (Qiu et al., 2017; Lachman et al., 2018). While changes in HR and traditional indices of HRR can provide important information about differences in cardiac autonomic control, heart rate variability (HRV) has been shown to offer a more sensitive measure of cardiac autonomic regulation at rest (Task-Force, 1996) and during exercise (Karapetian et al., 2008) compared to a mean HR value. As measures of HR, HRR, and HRV have clear associations with cardiovascular health, a better understanding of RR intervals following various exercises and exercise intensities during the acute recovery phase (RRrec) is needed within the literature. Doing so, provides implications for clinical, research, and performance-related exercise testing and monitoring.
Michael et al. (2017) highlight and discuss the usefulness of assessing HRV at the onset, during, and immediately following the cessation of exercise to provide insight into autonomic stress reactivity. They, Michael et al. (2017), suggest that upon the onset of exercise, inputs from higher-order brain centers feed into the medullary control of cardiovascular function to reset the arterial baroreflex. This shift in the operating point for the arterial baroreflex requires a physiological shift in cardiac output that is met primarily by a withdrawal in parasympathetic input to increase HR. HRV provides context to changes in cardiac regulation beyond the assessment of mean HR values but these methods are limited to stationary time-series. The statistical estimation of a time-series (whether that statistic is assessing the variability or the complexity of the time-series) is dependent upon the underlying process producing the time-series and because each element of a non-stationary time-series can have a different entropy, these statistical calculations become consistently biased (Berry et al., 2020). Prior research has examined the relations between changes in HRV and the non-stationary (data with significant slopes in the HR response) trends in exercise recovery with conflicting HRV results (Arai et al., 1989; Bernardi et al., 1990; Perini et al., 1990; Breuer et al., 1993; Nakamura et al., 1993; Oida et al., 1997; Perini and Veicsteinas, 2003).
While a few studies have investigated methodological approaches for HRV indices during and/or after exercise, these studies have produced conflicting results (Arai et al., 1989; Bernardi et al., 1990; Perini et al., 1990; Breuer et al., 1993; Nakamura et al., 1993; Oida et al., 1997; Perini and Veicsteinas, 2003). As it pertains to exercise recovery, these methods are less commonly reported in the literature than traditional measures of HR and HRR. A recent review by Peçanha et al. (2017) examined the strengths and weaknesses of a variety of methods that have previously been utilized to assess post-exercise autonomic recovery via HRR and HRV indices. As discussed in this review (Peçanha et al., 2017), Goldberger et al. (2006) first introduced the idea of separating-out the 5 min period following the cessation of exercise into twenty 15s, ten 30s, and five 60s segments, which could be assessed by different variability indices to evaluate changes in cardiac autonomic reactivation. The piecewise analysis of these first 5 min following the cessation of exercise utilized HRV indices such as the standard deviation of normal RR-intervals (SDNN), the root mean square of successive RR differences (rMSSD), and the root mean square (RMS) (Ganio et al., 2009) index to assess cardiac autonomic reactivation. The authors concluded that both rMSSD and RMS of 30 s segments adequately reflected the autonomic changes occurring during the 5 min period of recovery (compared to 15 and 60 s segment lengths) and eventually expanded on these findings by evaluating these methods following a submaximal exercise bout (Ng et al., 2009). These studies show that indices of HRR and HRV immediately following the cessation of exercise reflect changes in cardiac autonomic modulation—as was also discussed in Michael et al. (2017).
However, measures of complexity—approximate entropy (ApEn) and sample entropy (SampEn), were not assessed in previous studies, but reflect important changes in heart rate dynamics that are not detected by traditional linear or frequency based measures of HRV (Goldberger Ary et al., 2000). Briefly, complexity measures stem from evaluation of non-linear dynamics, which assess the structure of a time series and reflects the system’s ability to adapt to internal or external perturbations. For instance, entropy indices quantify the degree of regularity or the appearance of repetitive patters within a time segment vs. traditional linear measures that examine the magnitude of variability. Thus, a low amount of entropy corresponds to a high amount of regularity within a signal (i.e., low adaptability of the system) vs. a higher degree of complexity that reflects a less-ordered signal (i.e., increased adaptability of the system)(West and Goldberger, 1987; Manor et al., 2010). A recent study by Berry et al. (2020), expanded on previous research by examining the influence of non-stationarity on indices of variability and complexity as well as various methods of detrending these data. These findings clearly show the biasing effects of non-stationarity on measures of variability and complexity as well as the effects of various methods of detrending on these indices.
To further elucidate the changes in heart rate dynamics immediately post-exercise, this study assesses the complexity during the entire 5 min recovery period immediately post-exercise using both a previously reported method of assessing HRV during the recovery from exercise (Goldberger et al., 2006) and the methods outlined in Berry et al. (2020). In addition, we examine the relations between various physiological measures with indices of HRV from each of the respective methods.
Materials and Methods
This analysis was performed on data that had been collected as part of the larger longitudinal RIGHT Track (RT) Health study. The overarching aim of RT Health is to examine the influence of early childhood self-regulation on the development of cardiovascular risk in adolescence and young adults. This study was approved by the Institutional Review Board at the University of North Carolina at Greensboro (IRB #11-0360). Prior to participating, all subjects provided written and informed consent.
The methods outlined below are specific to the HRV assessments and analyses; methods on the entire study have been published elsewhere (Wideman et al., 2016). Participants arrived at the laboratory between the hours of 0900 and 1400 at least 2 h post-prandial and having abstained from moderate to vigorous physical activity for 24 h, caffeine for 12 h, alcohol for 48 h. Body composition was assessed via air displacement plethysmography using COSMED’s BODPOD® system. An incremental test to exhaustion was performed on a GE 2100 treadmill to assess peak oxygen uptake (VO2peak) (Parvo Medics TrueOne 2400). Pre-exercise, during exercise, and post-exercise RR intervals were recorded using a Polar V800 watch and downloaded following the completion of the visit. During the exercise test, participants self-selected their running speed while grade was increased by 3% every 2 min. Participants were asked to choose a speed that they felt comfortable maintaining for approximately 15 min so that the incremental increases in grade would result in maximal volitional fatigue within 8–12 min.
All mathematical and statistical procedures were performed using R 3.5.0. Artifact correction using linear interpolation of preceding- and proceeding- heart periods was completed prior to any additional analyses being performed using the open source “RHRV” package (Rodríguez-Liñares et al., 2008). Analysis of variance was performed using the “car” package (Fox and Weisberg, 2019) while multivariate adaptive regression splines were performed using the “earth” package (Milborrow, 2017). A example of an entire HR (bpm) and RR-interval (msec) profile is provided in Figures 1A,B, respectfully.
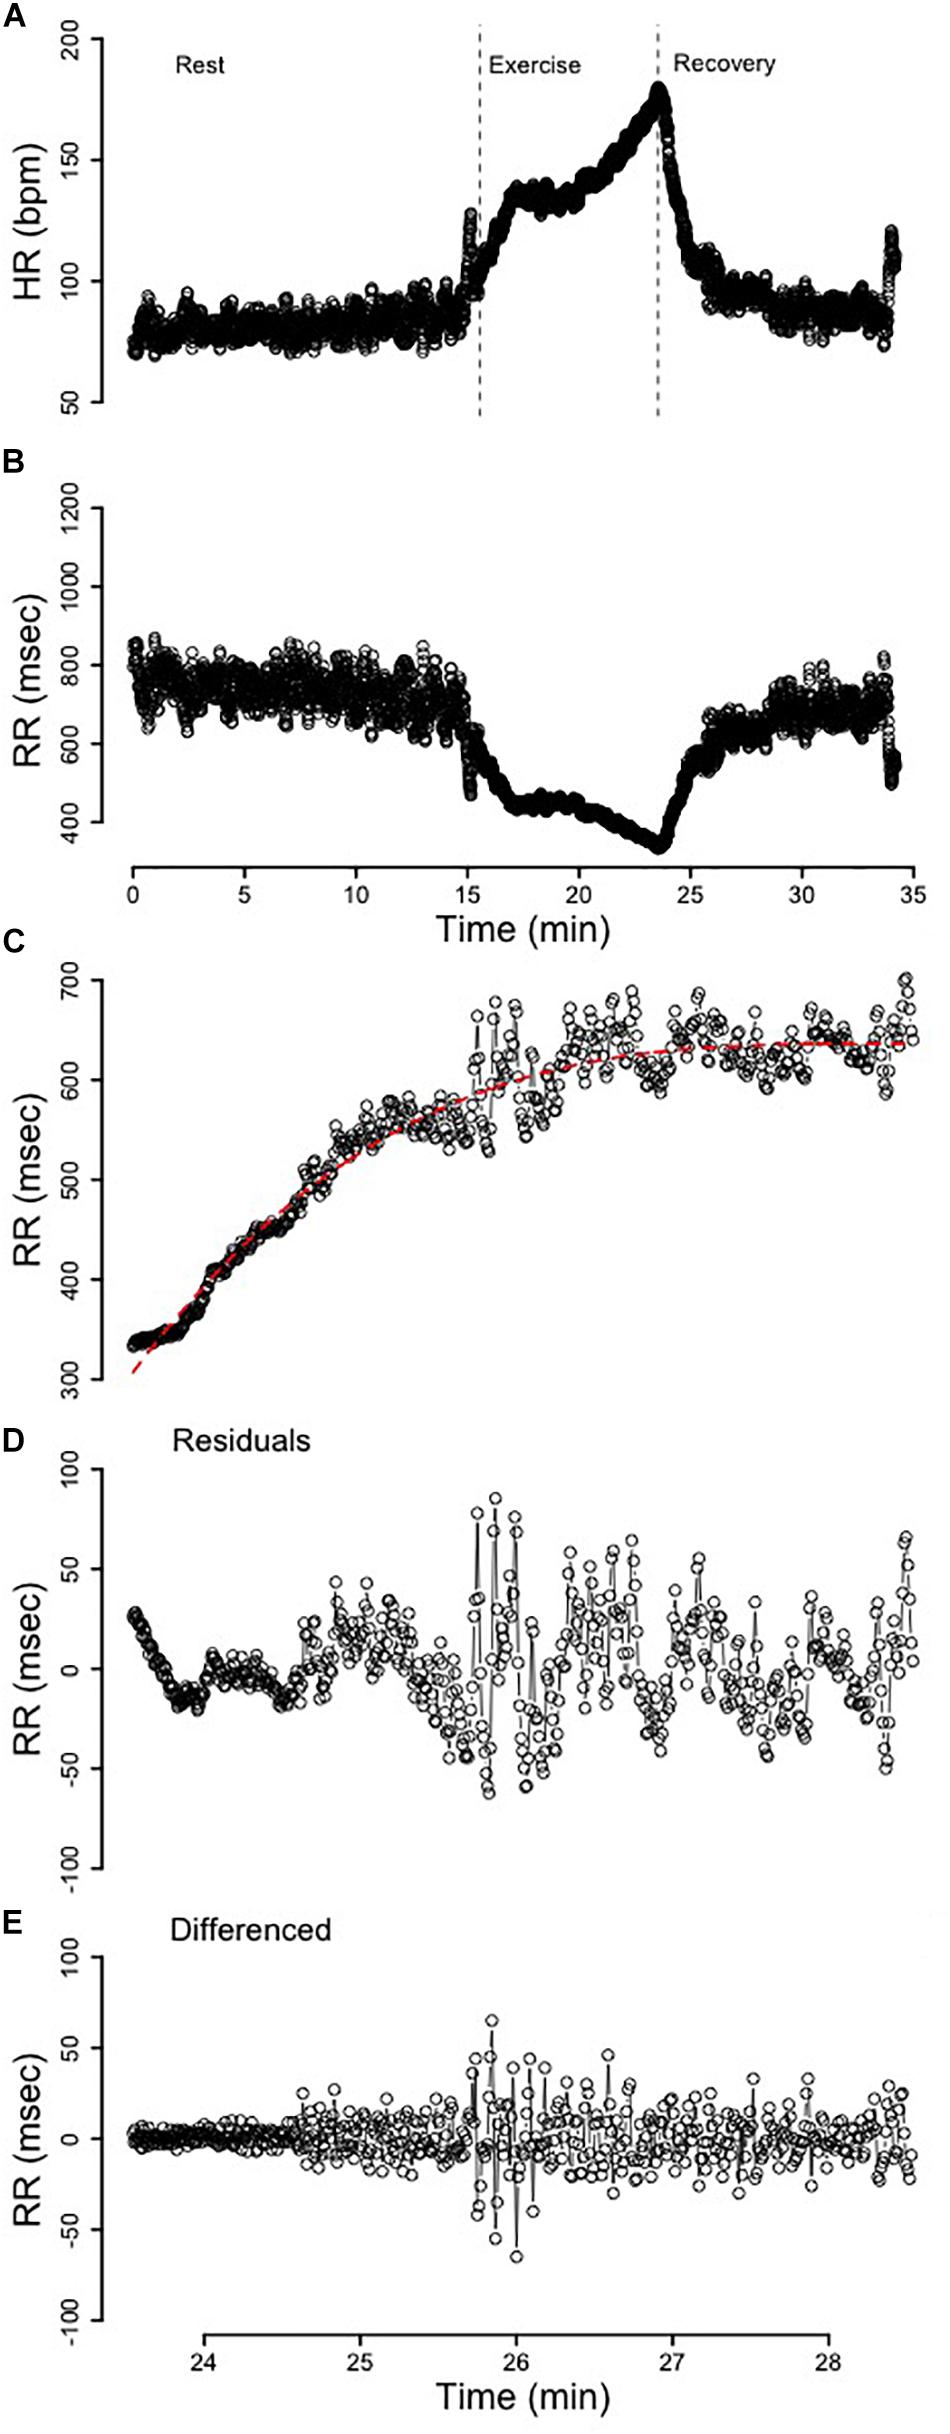
Figure 1. (A) The heart rate (HR) profile from rest, exercise, and recovery. The dotted vertical lines segment the immediate 5 min of recovery. (B) The RR-interval profile from rest, exercise, and recovery. (C) The 5 min of recovery RR-interval data fit with a third-order polynomial. (D) The residuals from the third-order polynomial in C that were used for analysis. (E) The 5 min of recovery RR-interval data detrended via differencing.
Replication of Methods Outlined by Goldberger et al. (2006)
The first 5 min of RR-interval data following the cessation of exercise were identified (Figures 1B,C). These segments were broken apart into twenty 15s, ten 30s, and five 60s segments that spanned the entire 5-min of recovery (Figure 2). Following linear regression analysis on the RR-intervals for each of the three different segment lengths, the residuals were computed and corresponding SDNN, rMSSD, and RMS indices were calculated.
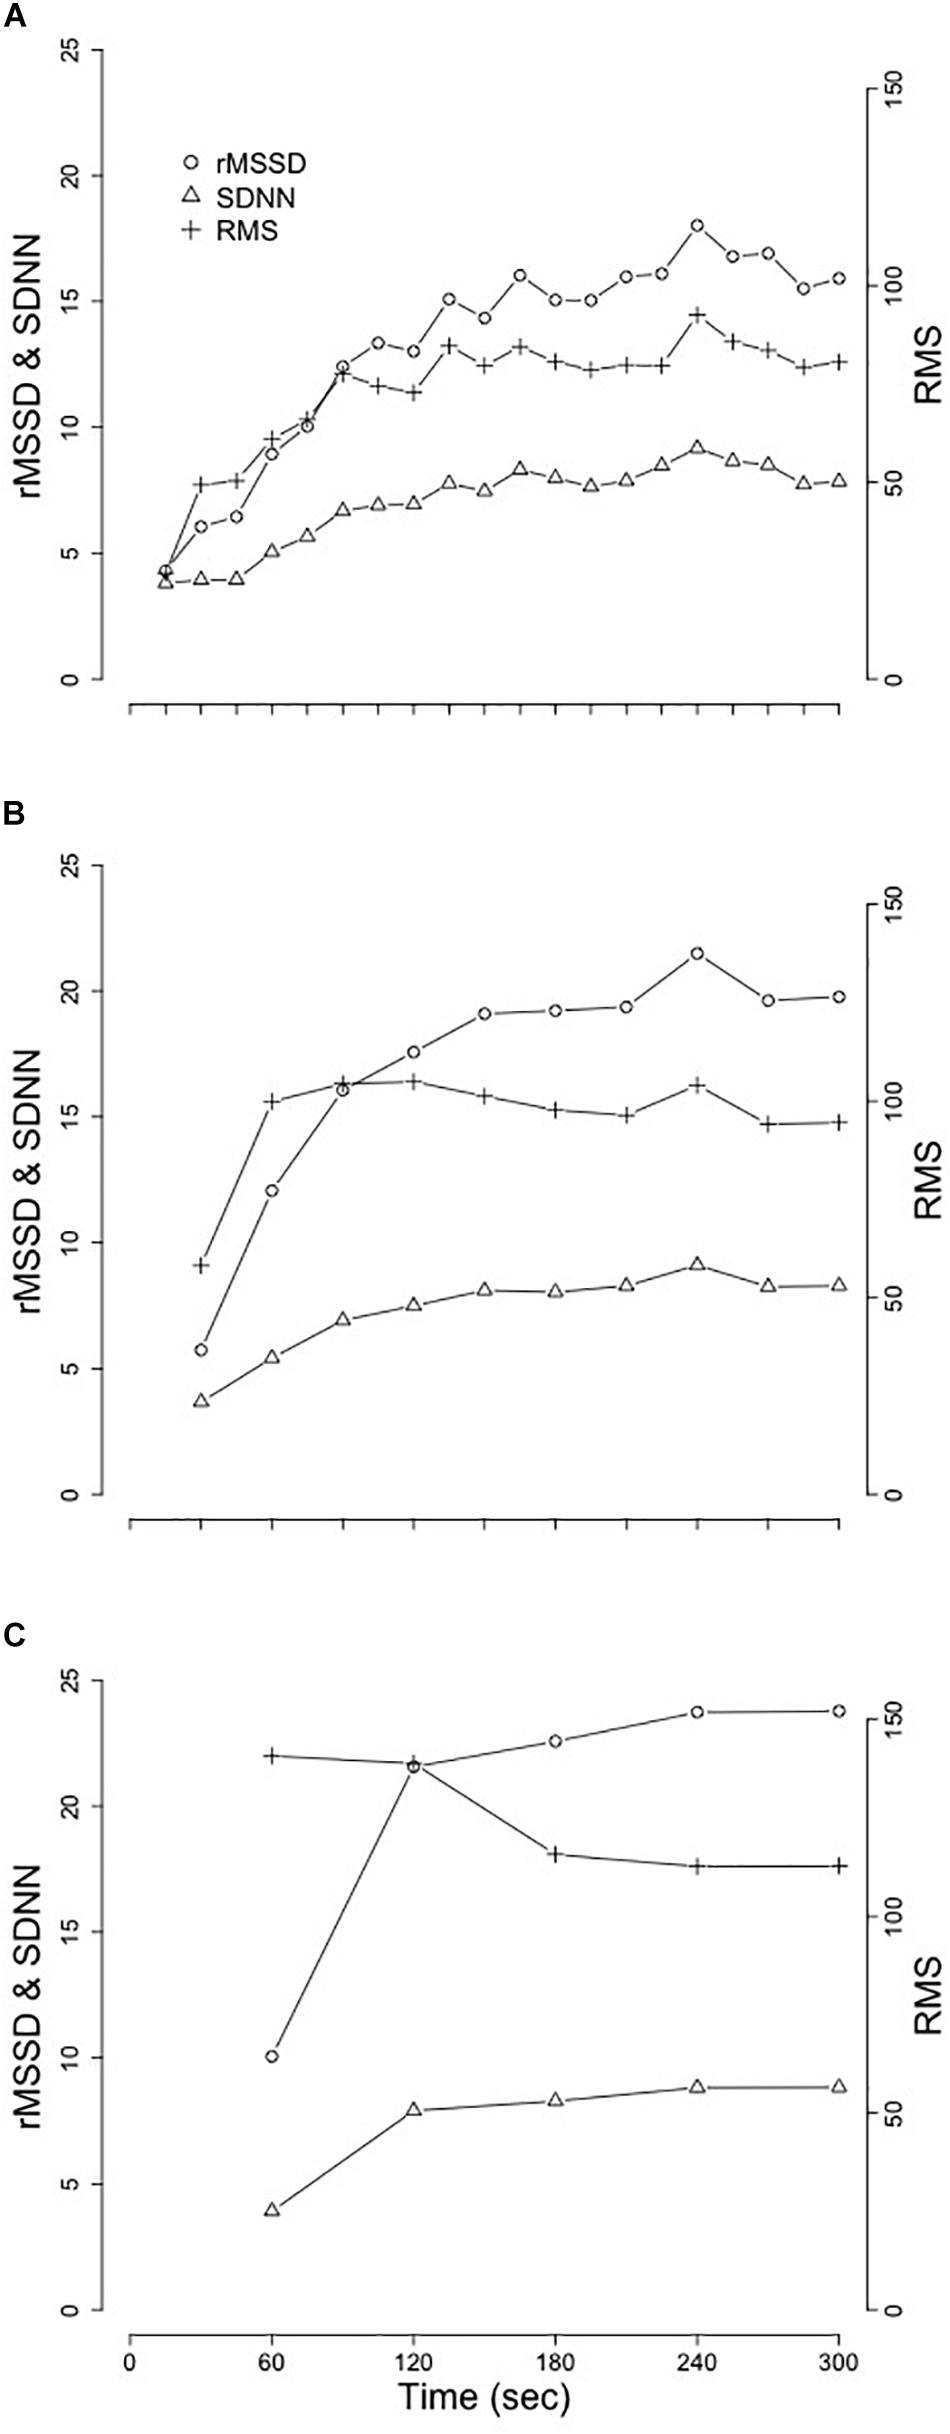
Figure 2. Mean changes of SDNN, rMSSD, and RMS from the replication of Goldberger et al. (2006). (A) 15 s segment. (B) 30 s segments. (C) 60 s segments. Standard deviation of the normal RR-interval (SDNN); root mean square of successive differences (rMSSD); root mean square (RMS).
Differencing and Polynomial Detrending of RRrec
Two separate detrending approaches were performed and comparisons between these two methods were evaluated. These methods of detrending non-stationary time-series are provided in Berry et al. (2020). Difference(diff) Calculations. Differencing (Figure 1E) was used to detrend the time-series and the resultant stationary time-series was subsequently analyzed to compare differences in variability and complexity. Residual(res) Calculations. The optimal model was determined by purposefully overfitting the initial 5 min of RRrec data for all subjects. After modeling the initial 5 min of RRrec from 1 to 10 orders for each individual, a third-order polynomial was determined to be the optimal regression line (Figure 1C), since it was flexible enough to account for individualities in this response and reduced the autocorrelation among the residuals without significantly overfitting the data. The residuals from these (individualized) lines were plotted as a secondary time-series (Figure 1D) for analysis.
Variability and Complexity of the Detrended RRrec Data
The aforementioned transformations of the data were completed with the purpose of creating a time-series with a stationary mean to analyze the variability and complexity surrounding RRrec; allowing us the ability to characterize the patterns of variability around the non-stationary decline in HR (rise in RR-intervals). Variability Measures. The equivalent of common time-domain measures of HRV, including SDNN of normal RR intervals and rMSSD, were used to assess the variability of the detrended-RRrec. Complexity Measures. ApEn and SampEn were used to assess the complexity of the residuals surrounding the non-linear trend in RRrec; a higher number indicates a greater degree of complexity, whereas smaller values characterize more regular signals. While SampEn is more robust against changes in data-length compared to ApEn (Yentes et al., 2013), both indices were included in this analysis for continuity with previously published data.
Statistical Methods
With respect to our replication of Goldberger et al. (2006), repeated measures analysis of variance (ANCOVA) were used to assess changes in SDNN, rMSSD, and RMS across time between sex after controlling for race, body fat (BF), VO2peak, and HRrest. Separate univariate ANCOVAs were used to compare differences in SDNNdiff, rMSSDdiff, SampEndiff, SDNNres, rMSSDres, and SampEnres between sex and race after controlling for changes in BF, VO2peak, and HRrest. After these statistical comparisons were performed, exploratory statistical learning-methods were used to better understand some of the relations among these indices with various physiologic/demographic data.
Multivariate adaptive regression splines (ARS) produce continuous derivatives and are not only more powerful but also more flexible in determining the interaction among variables (Friedman, 1991). The original dataset was split, via random sampling, into a training-dataset (n = 46) and a testing-dataset (n = 46). Subsequently, the selected model was tested on the remaining data (the testing-dataset) to determine the validity of the models produced with the training-dataset. Physiological measures considered for each model included: height (Ht), weight (Wt), body fat (BF), body mass index (BMI), maximal oxygen uptake (VO2peak), resting HR (HRrest), maximal HR (HRmax), HR at 1 min (HRone), and 5 min (HRfive) following the cessation of exercise, recovery (Δ bpm) at 1 min (HRRone) and at 5 min (HRRfive). These measures were scaled and centered prior to being used within the ARS analysis.
Results
Data from N = 92 young adults (male = 46, female = 46) were included in this study. Subject demographics, separated by sex, are provided in Table 1.
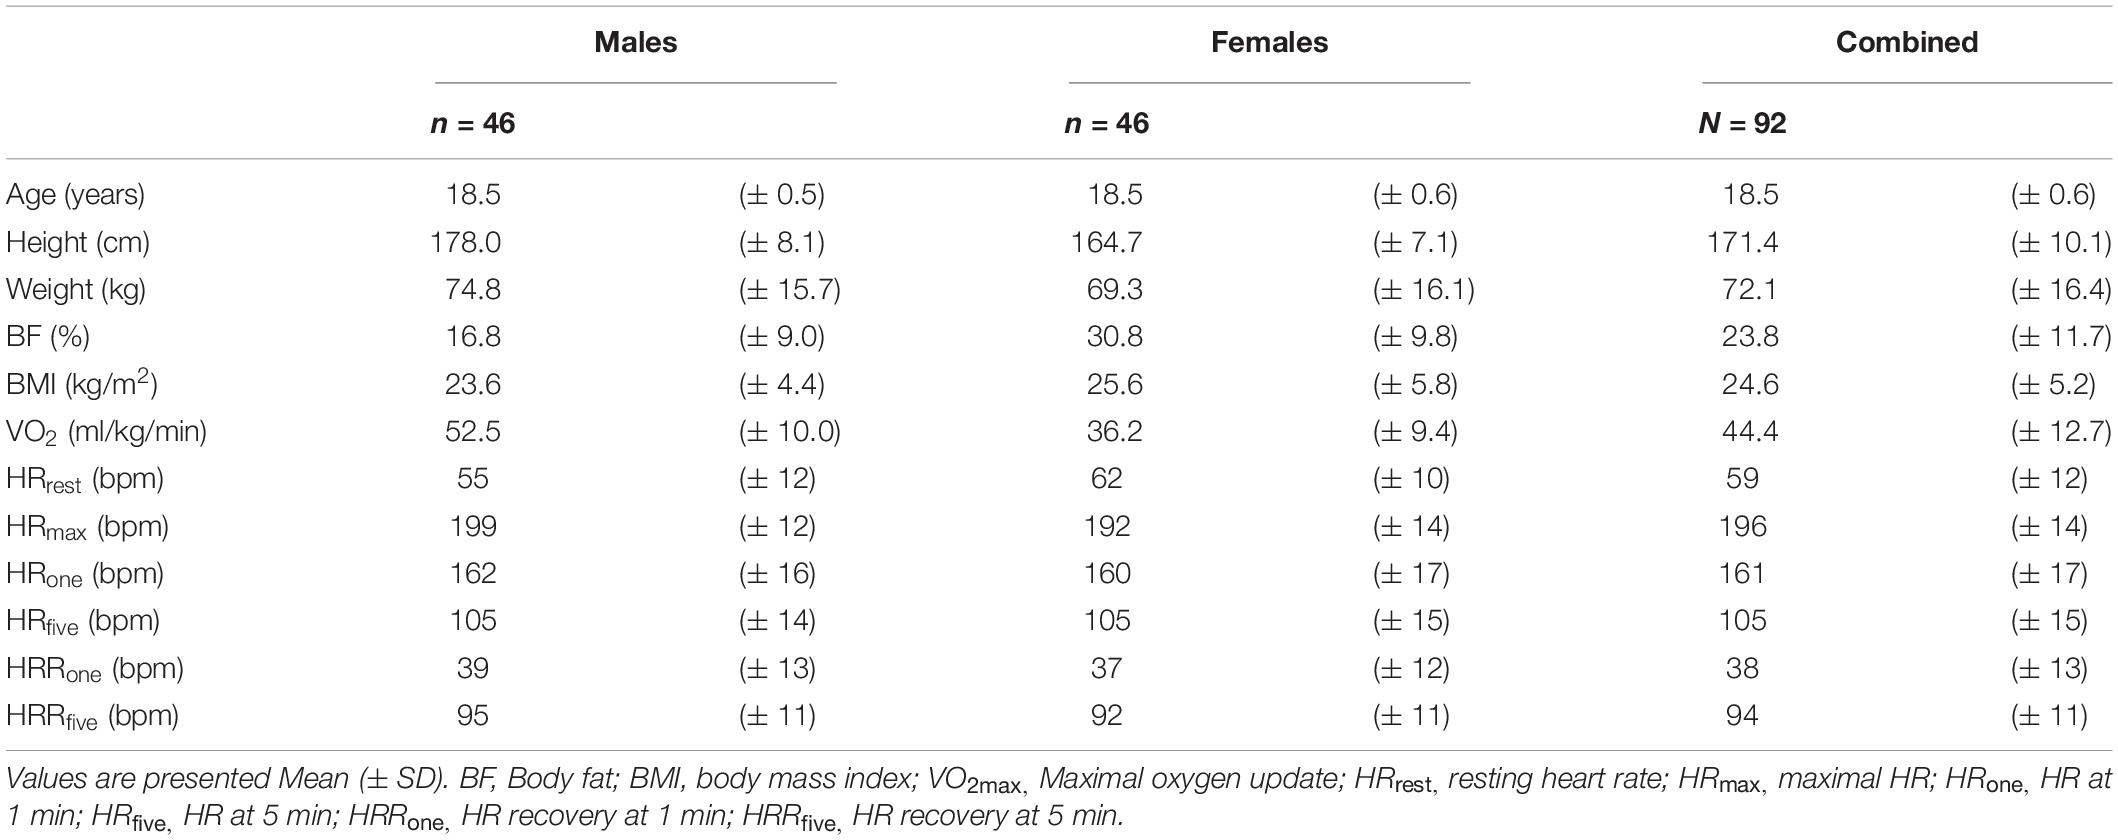
Table 1. Subject demographics.
Replication of Previously Established Methods of Assessment of RRrec
Results from replication of the methods established in Goldberger et al. (2006) are provided in Table 2 and visual representation of means from the segmented-analysis throughout the first 5 min of recovery are provided in Figure 2.
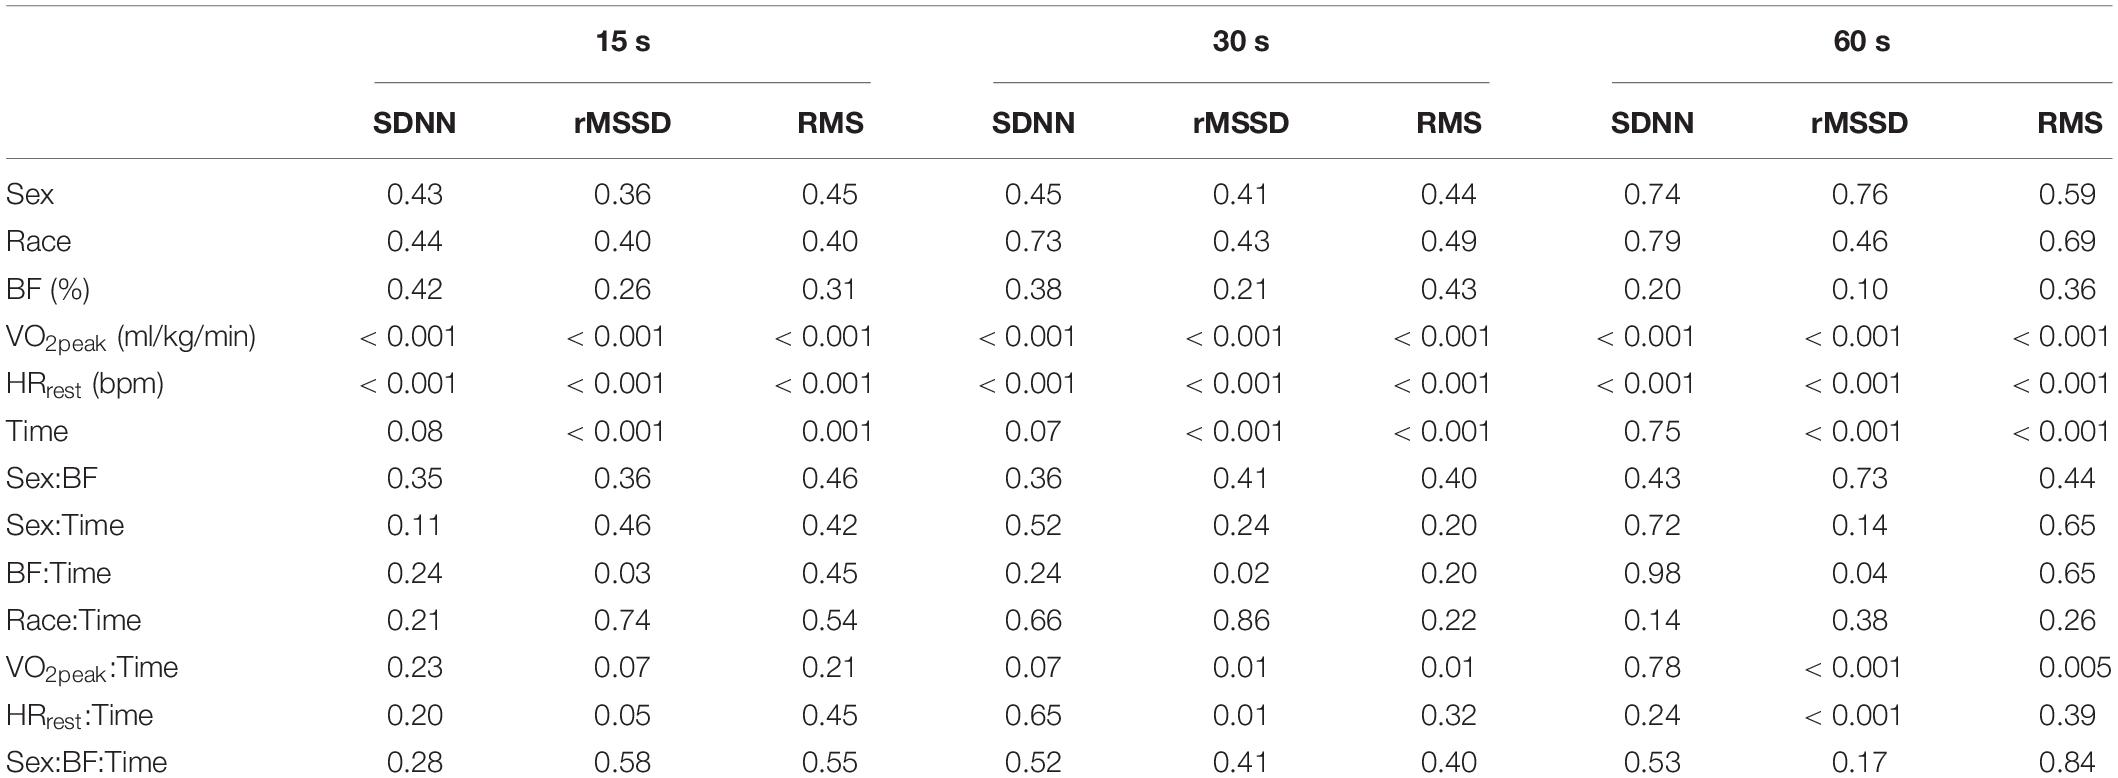
Table 2. P-values from ANCOVAs assessing differences for sex and race after controlling for body fat (BF), maximal oxygen uptake (VO2peak), and resting heart rate (HRrest) for each of the segmenting-analyses of post-exercise HRV.
Replication of these previously established methods in our young adults provided similar results to those of the healthy middle-aged adults reported in Goldberger et al. (2006). Extending on the comparisons previously made between healthy individuals and those with coronary artery disease (Goldberger et al., 2006), we examined the relationships between sex and race after controlling for BF, VO2peak, and HRrest. While neither SDNN, rMSSD, or RMS were different between sex or race with any of the three segment-lengths, we did observe significant relationships between VO2peak and HRrest with each of these analyses. More interestingly were the significant interactions between VO2peak and HRrest with the changes in SDNN, rMSSD, and RMS across time and the lack of consistency in these findings across different segment-lengths (Table 2).
Differencing and Polynomial Detrending of RRrec
Pearson correlations among demographic and the detrending (differencing- and residual-approaches) measures for the entire 5 min time series immediately post-exercise are presented in Table 3. The correlations between demographic characteristics and SDNN, rMSSD, and RMS of differenced and residual methods produced correlations ranging from −0.67 to 0.65. Similarly, the correlations between traditional indices of HRR with SDNN, rMSSD, and RMS ranged from −0.83 to 0.75.
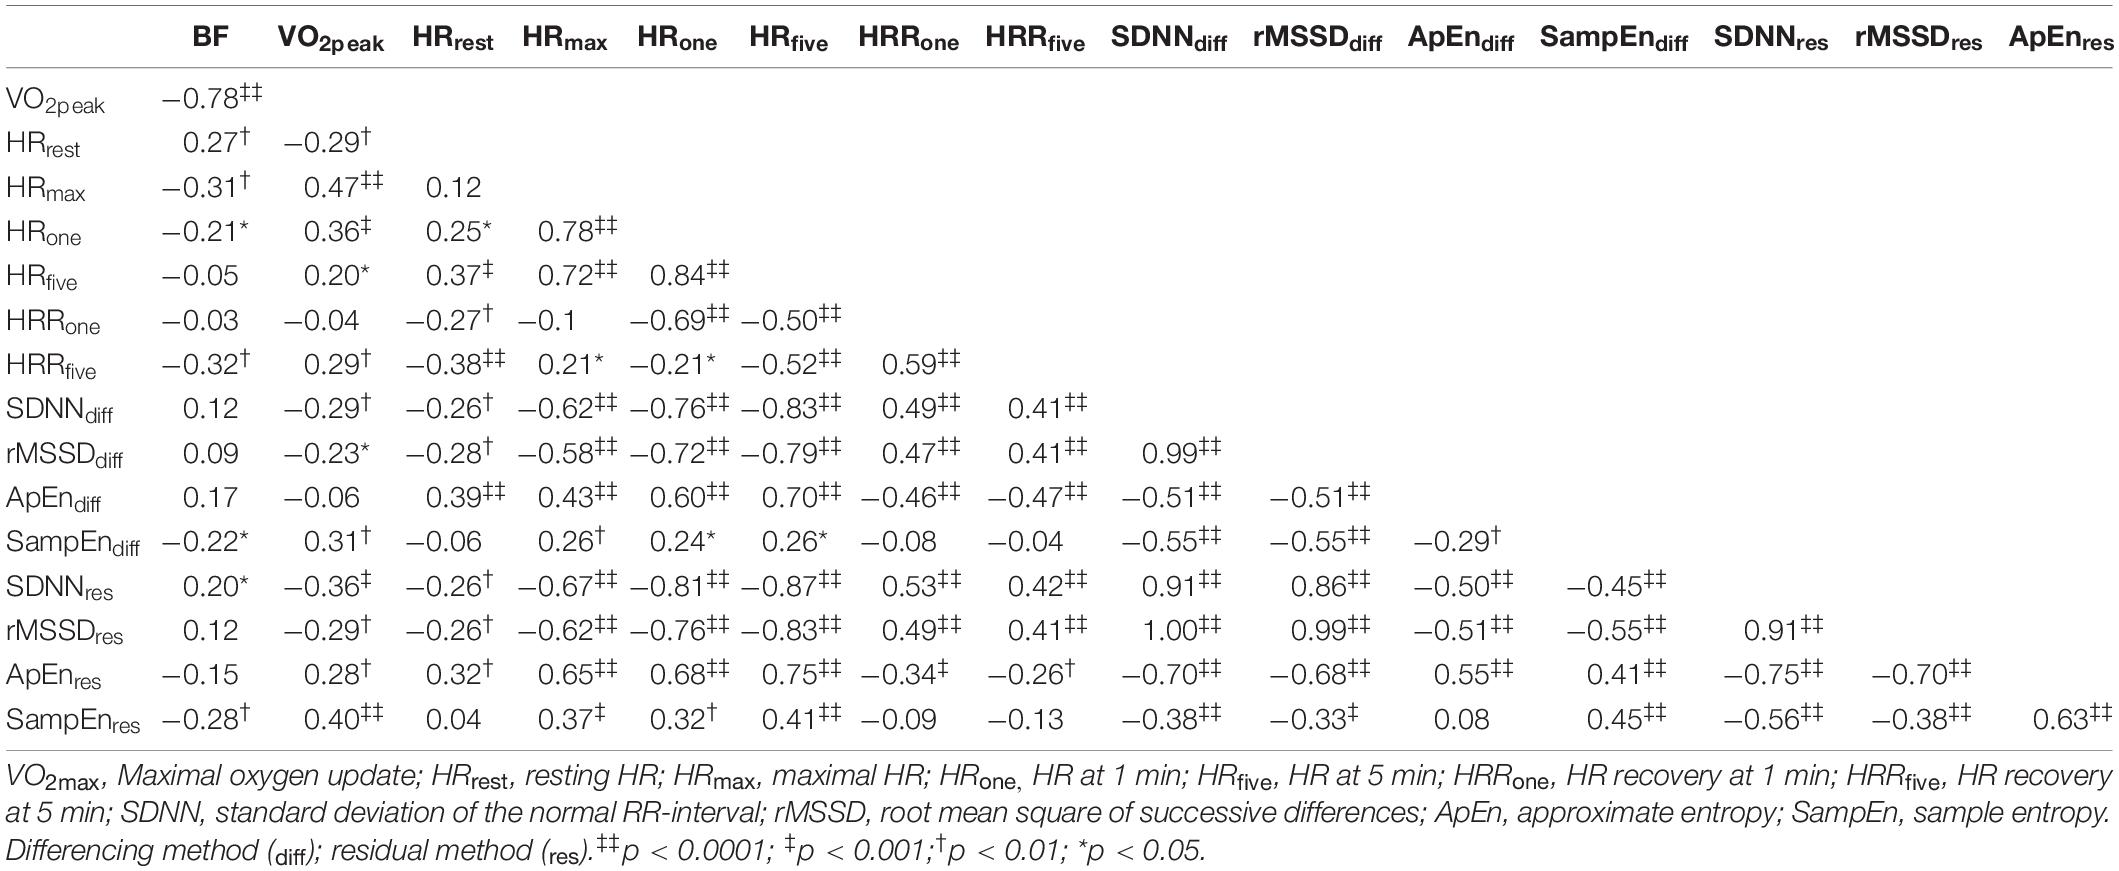
Table 3. Correlations among demographic and the differencing- and residual- detrending measures.
Means from the newly proposed detrending methods are provided in Table 4 and results from the ANCOVAs are provided in Table 5. Similar to our findings with the segmenting-method, we did not observe significant group differences based on sex or race but we did observe significant associations between VO2peak and HRrest with SDNN, rMSSD, ApEn, and SampEn for all but SampEndiff.
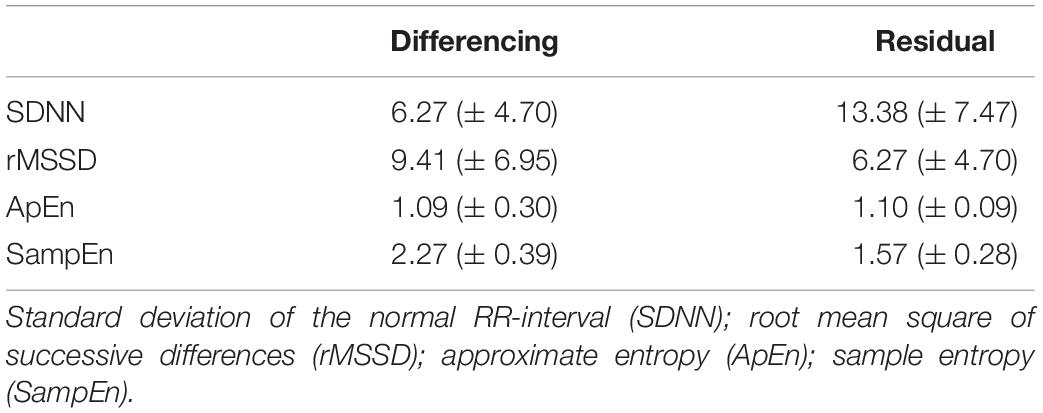
Table 4. Means (± SD) of the differencing- and residual- methods.
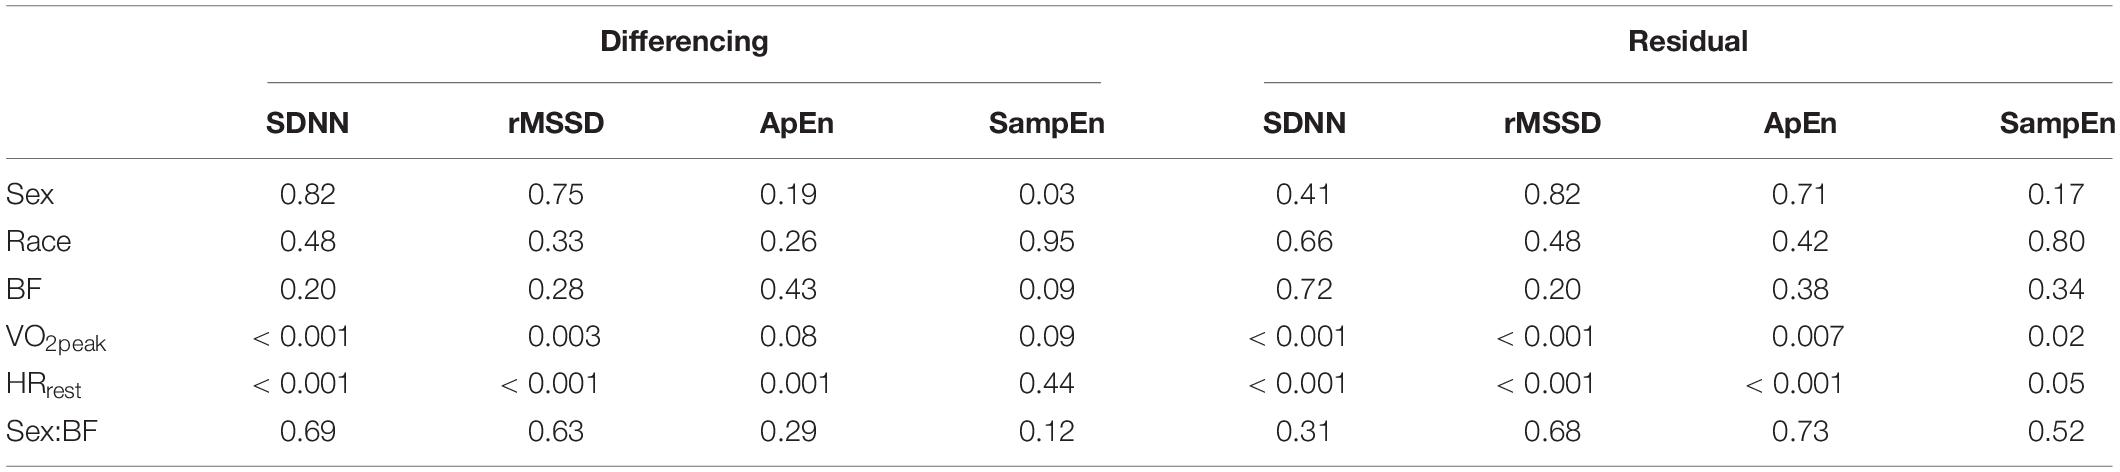
Table 5. P-values from ANCOVAs assessing differences for sex and race after controlling for body fat (BF), maximal oxygen uptake (VO2peak), and resting heart rate (HRrest) for each of the differencing- and residual- methods.
Results from ARS models are provided in Table 6. The residual-method provided a significantly (p = 0.04) lower mean standard error (MSE) (0.064 ± 0.042) compared to the differencing-method (0.100 ± 0.033).
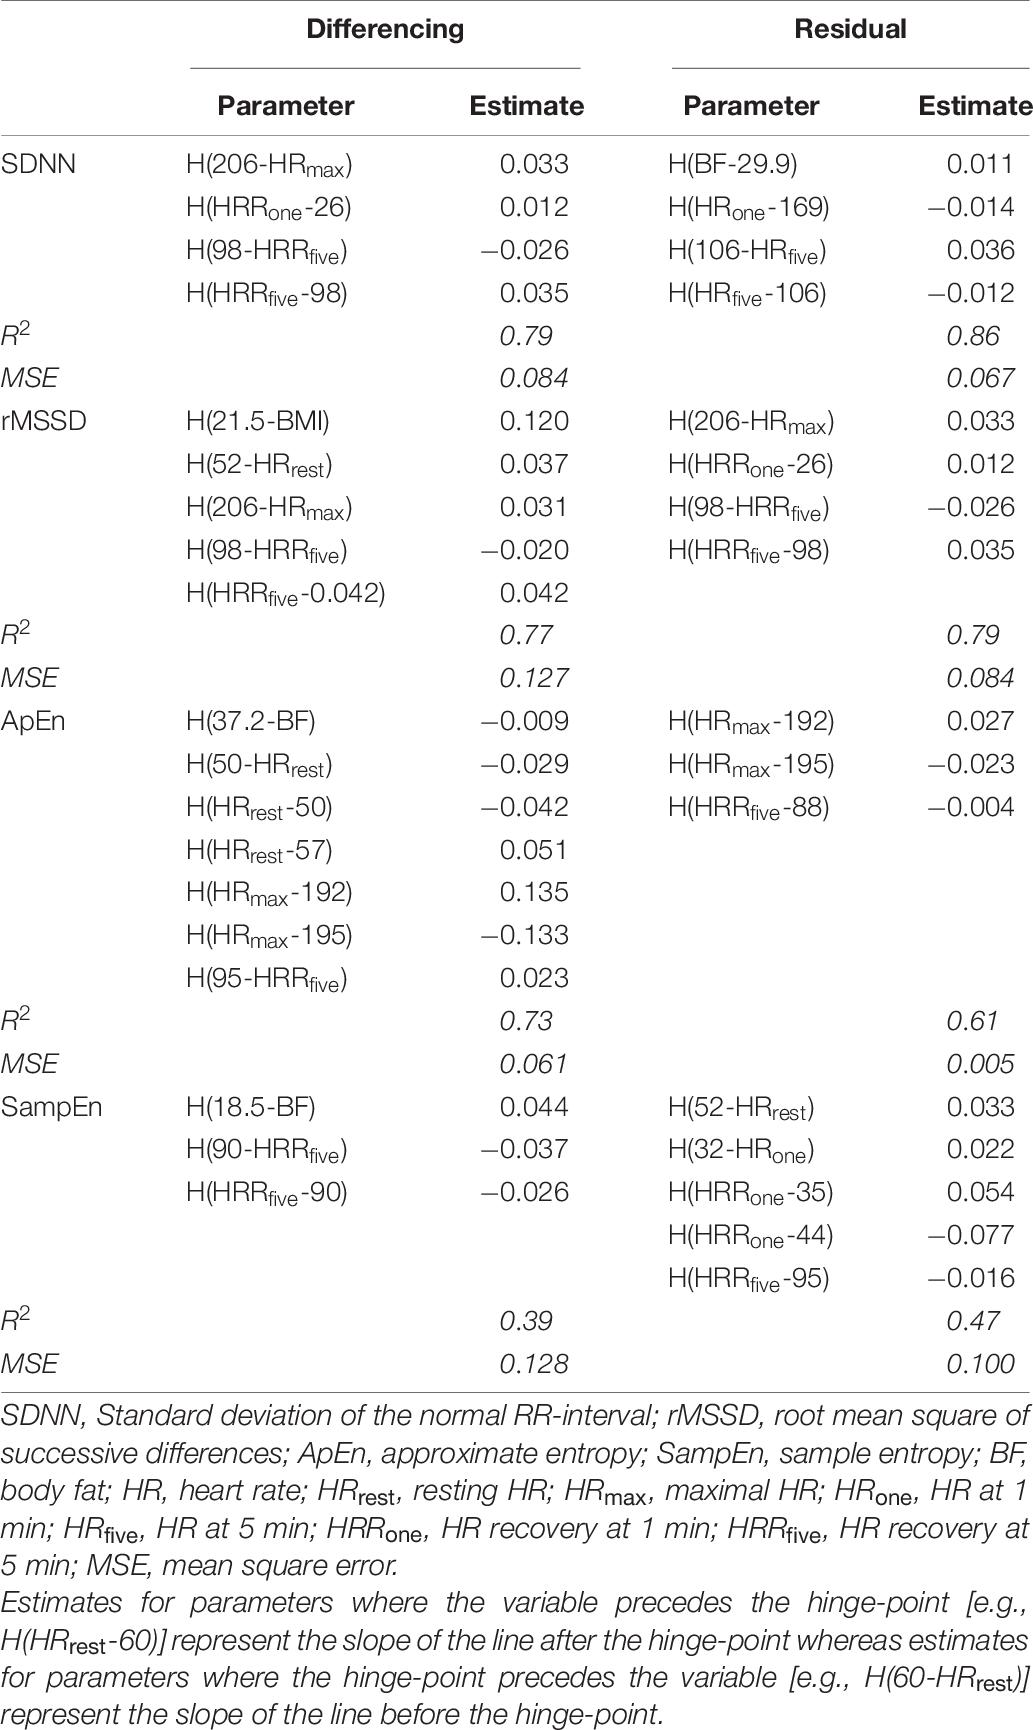
Table 6. Parameters from the multivariate adaptive regression spline (ARS) models for each of the differencing- and residual-methods.
Discussion
The major findings from these analyses were (1) reproducibility of previously established methods (Goldberger et al., 2006) for immediate post-exercise HRV in a young-adult population, (2) a unique dichotomy in the simple correlations between traditional measures of HRR and the complexity measures from the differencing- and residual-methods of RRrec, and (3) reliable models that demonstrate the complex nature of these indices. Additionally, these results provide preliminary insight into what physiologic variables may contribute to differences in these complexity indices when calculated on the detrended time series from the 5 min immediately post-exercise compared to traditional indices of HRR.
The replication of the segmenting-method, as described in Goldberger et al. (2006), (used to assess acute changes in RRrec) in our young adult population mirrored the patterns of change in SDNN, rMSSD, and RMS previously reported by Goldberger et al. (2006), however, the true raw values assessed for SDNN, rMSSD and RMS across the 5 min segment appeared to be different. This discrepancy may be associated with the difference in age between the two samples as our sample included adolescents and young-adults compared to Goldberger et al. (2006) which included adults and older-adults. The individuals included in our sample have completed puberty and linear growth by this age, and these data fall within the normal range of values for young healthy adults. However, these individuals are still developing psychologically and physiologically, which may contribute to these differences.
The ANCOVAs testing for effects with the segmenting-method, as well as the new residual-method (from the entire 5 min period immediately following the cessation of exercise) proposed in this paper, produced similar results: no effects for sex or race were observed for any of the tests, while both VO2peak and HRrest were significantly associated with SDNN, rMSSD, and RMS from both methods.
The correlations among various demographic variables and the variability and complexity indices from the differencing- and residual-methods in Table 3 show a unique relation between VO2peak and HRrest with HRRone, SampEndiff, and SampEnres. While the variability measures (SDNNdiff, SDNNres, rMSSDdiff, and rMSSDres) were each significantly correlated with traditional metrics of HRR (VO2peak, HRrest, HRmax, HRone, HRfive, HRRone, and HRRfive), SampEndiff and SampEnres had either no correlation with, or much-lower correlations with these indices. These findings suggest that indices of variability calculated on the entire 5 min segment using either differencing or residual methods, share large amounts of variance with traditional indices of HRR—in other words, the information provided by assessing either SDNNdiff/res or rMSSDdiff/res does not provide innovative or novel information beyond the traditional indices of HRR investigated in this, and many other, studies. Considering the physiological mechanisms associated with sympathetic withdrawal and the role of vagal input following the cessation of exercise to reduce HR, these observations are in-line with what is expected.
However, the complexity metrics obtained surrounding the increase in RRrec (i.e., SampEndiff, and SampEnres) immediately following the cessation of exercise are differentially correlated with demographic measures and various traditional indices of HRR. This suggests that the complexity indices may provide distinct and unique information about the changes in HR immediately following exercise. While the ANCOVAs further supported these observations, the best support for this idea came from the ARS models (Table 6). Contrary to the ANCOVA analyses, the ARS models are exploratory and do not test specific hypotheses. These models progressively add predictors (and any combination of predictors), to the model and test for various non-linearities among them. The optimal model is determined by comparing changes in model fit. The optimal model was calculated on a training-dataset (a randomly selected 50% of the entire dataset) and then tested on the test-dataset.
Both SampEndiff and SampEnres were significantly associated with VO2peak and neither was significantly correlated with HRrest, HRRone, or HRRfive, but these variables (or some combination of these variables) were repeatedly selected in the ARS models as significant predictors of the complexity metrics (ApEndiff, ApEnres, SampEndiff, and SampEnres). Similarly, HRrest, HRRone, and HRRfive were commonly identified by ARS as significant terms in other models, suggesting that the variability surrounding the trend in RRrec immediately following the cessation of exercise does not provide information about changes in cardiac autonomic regulation that is not already observed in traditional indices of HRR. However, the repeated selection of HRrest, HRRone, and HRRfive by ARS models to predict SampEndiff, or SampEnres despite the lack of significant correlations between any of these variables is an interesting finding that highlights the novelty of these detrending methods. These findings suggest that the complexity surrounding the trend in RRrec provides information about cardiac autonomic regulation not detected through traditional HRR indices or the variability surrounding the trend in RRrec.
Although the segmenting-method can be used to separate out the fast-phase and the slow-phase of the cardiac autonomic response to the cessation of exercise, we suggest that assessing the entire 5 min together may provide a more holistic and comprehensive assessment of the cardiac dynamics associated with RRrec. Furthermore, calculating the residuals from a third-order polynomial fit to the first 5 min of RRrec is less computationally intense and likely to be more robust against acute changes in RRrec compared to the segment approach previously described (Goldberger et al., 2006). When considering data length, it’s important to remember that although time is a constant, there could potentially be drastic differences in the number of RR-intervals that occur within each segment being analyzed. Furthermore, the influence of irregular and/or erroneous beats would have a larger impact on the variability (McNames et al., 2003; McNames and Aboy, 2006; Thuraisingham, 2006) and complexity (Rhea et al., 2011) score calculated across a shorter segment when compared to a longer, 5 min, sampling period. Thus, we recommend the residual-method (as outlined in our methods) as a method of assessing the cardiac dynamics associated with recovery from exercise. In line with the findings of Berry et al. (2020) this method also produced more accurate and reliable models compared to the differencing-method—observed through a significantly higher MSE in the ARS models calculated on the differenced data compared to the residual data.
Although the time course for parasympathetic reactivation post-exercise has been investigated previously, the exact timing of these changes is likely to be highly impacted by an individual’s health and training status and thus, to vary from person to person. As such, the interindividual variability in post-exercise parasympathetic reactivation may provide a nuanced assessment of cardiac autonomic regulation and subtle changes in this exercise-induced responsiveness may reflect the early stages of disease—an important target for future studies. While the development of an algorithm capable of reliably parsing-out these points in the recovery phase is feasible, automating this analysis would be computationally intensive—more-so than the method (SampEnres) outlined here, which we have shown can be predicted by non-linear relations among demographic information and traditional measures of HRR.
Several other methodological approaches have been suggested in the scientific literature to address HRV assessment immediately post-exercise, but a variety of concerns and confounds (Task-Force, 1996; Rhea et al., 2011; Peçanha et al., 2017), such as segment length, significantly limit the utility of these metrics in the exercise literature. Importantly, while many of these metrics are mathematically rigorous and computationally more feasible than ever before, the crux of their utility in exercise physiology hinges on their ability to translate into meaningful physiologic contexts. Herein lies one of the major advantages to complexity assessments surrounding the RRrec, since it translates easily into a meaningful physiological construct. Highly adaptive systems show increasing entropy (greater complexity) and are known to be associated with healthy responses (Shaffer and Ginsberg, 2017) and increased adaptability of the system (West and Goldberger, 1987; Manor et al., 2010).
In summary, we assessed the variability and complexity surrounding the non-stationary trend in RRrec through two methods including differencing and residual approaches. Results of SDNN, rMSSD, and SampEn calculations from the two detrending methods were similar, however, the multivariate ARS models produced from the residual approach had a lower MSE when compared to the differencing approach. This suggests that information about the individual recovery response immediately following the cessation of maximal exercise may be better represented through (third-order) polynomial regression detrending methods compared to differencing approaches. The complexity surrounding the trends in RRrec immediately following the cessation of exercise provides unique information and novel context related to cardiac autonomic regulation and the dynamics of RRrec not observed through traditional measures of HRR. Whereas the variability surrounding RRrec does not provide additional information beyond traditional HRR metrics already utilized in the literature. Further research is needed to establish the utility of this approach in other settings (i.e., field) and in other populations (i.e., older adults, clinical populations and athletes) as well as investigating other psychophysiological factors that may contribute to the dynamic regulation of cardiac control following the cessation of exercise. In addition, the relations of other commonly utilized metrics (e.g., spectral analyses) within the HRV literature should be applied to these methods.
Data Availability Statement
The raw data supporting the conclusions of this article will be made available by the authors, without undue reservation.
Ethics Statement
The studies involving human participants were reviewed and approved by the Institutional Review Board at University of North Carolina at Greensboro. The patients/participants provided their written informed consent to participate in this study.
Author Contributions
NB: data collection, data analysis, statistical analysis, and writing. EB: writing and editing. LS, SK, and SC: project design and editing. LW: project design, data collection, and editing. All authors contributed to the article and approved the submitted version.
Funding
This project was funded by the NICHD R01HD078346.
Conflict of Interest
The authors declare that the research was conducted in the absence of any commercial or financial relationships that could be construed as a potential conflict of interest.
Acknowledgments
We would like to acknowledge and thank the adolescents and families who have been involved with this study since it began and the various graduate students who have helped collect this data over the last several years.
Abbreviations
HR, Heart Rate; HRR, Heart Rate Recovery; HRV, Heart Rate Variability; RRrec, RR Intervals During Recovery; SDNN, Standard Deviation of RR-intervals; rMSSD, Root Mean Square of Successive RR Differences; ApEn, Approximate Entropy; SampEn, Sample Entropy; RMS, Root Mean Square Index; VO2peak, Peak Oxygen Uptake; diff, Difference Calculation; res, Residual Calculation; MSE, Mean Square Error; ARS, Adaptive Regression Splines.
References
Arai, Y., Saul, J. P., Albrecht, P., Hartley, L. H., Lilly, L. S., Cohen, R. J., et al. (1989). Modulation of cardiac autonomic activity during and immediately after exercise. Am. J. Physiol. Heart Circ. Physiol. 256, H132–H141.
Bernardi, L., Salvucci, F., Suardi, R., Soldá, P. L., Calciati, A., Perlini, S., et al. (1990). Evidence for an intrinsic mechanism regulating heart rate variability in the transplanted and the intact heart during submaximal dynamic exercise? Cardiovasc. Res. 24, 969–981. doi: 10.1093/cvr/24.12.969
Berry, N. T., Wideman, L., and Rhea, C. K. (2020). Variability and complexity of non-stationary functions: methods for post-exercise HRV. Nonlinear Dyn. Psychol. Life Sci. 24, 367–387.
Breuer, H. W., Skyschally, A., Schulz, R., Martin, C., Wehr, M., and Heusch, G. (1993). Heart rate variability and circulating catecholamine concentrations during steady state exercise in healthy volunteers. Heart 70, 144–149. doi: 10.1136/hrt.70.2.144
Fox, J., and Weisberg, S. (2019). An R Companion to Applied Regression, 3rd Edn. Thousand Oaks, CA: SAGE Publications. Available online at: http://socserv.socsci.mcmaster.ca/jfox/Books/Companion
Ganio, M. S., Klau, J. F., Casa, D. J., Armstrong, L. E., and Maresh, C. M. (2009). Effect of caffeine on sport-specific endurance performance: a systematic review. J. Strength Cond. Res. 23, 315–324. doi: 10.1519/jsc.0b013e31818b979a
Goldberger, J. J., Le, F. K., Lahiri, M., Kannankeril, P. J., Ng, J., and Kadish, A. H. (2006). Assessment of parasympathetic reactivation after exercise. Am. J. Physiol. Heart Circ. Physiol. 290, H2446–H2452.
Goldberger Ary, L., Amaral Luis, A. N., Glass, L., Hausdorff, J. M., Ivanov, P. C.h., Mark, R. G., et al. (2000). PhysioBank, PhysioToolkit, and PhysioNet. Circulation 101, e215–e220.
Karapetian, G. K., Engels, H. J., and Gretebeck, R. J. (2008). Use of heart rate variability to estimate LT and VT. Int. J. Sports Med. 29, 652–657. doi: 10.1055/s-2007-989423
Lachman, S., Terbraak, M. S., Limpens, J., Jorstad, H., Lucas, C., and Scholte, op, et al. (2018). The prognostic value of heart rate recovery in patients with coronary artery disease: a systematic review and meta-analysis. Am. Heart J. 199, 163–169. doi: 10.1016/j.ahj.2018.02.008
Manor, B., Costa, M. D., Hu, K., Newton, E., Starobinets, O., Kang, H. G., et al. (2010). Physiological complexity and system adaptability: evidence from postural control dynamics of older adults. J. Appl. Physiol. 109, 1786–1791. doi: 10.1152/japplphysiol.00390.2010
McNames, J., and Aboy, M. (2006). Reliability and accuracy of heart rate variability metrics versus ECG segment duration. Med. Biol. Eng. Comput. 44, 747–756. doi: 10.1007/s11517-006-0097-2
McNames, J., Thong, T., and Goldstein, B. (2003). “Reliability and accuracy of heart rate variability metrics versus ECG segment duration,” in Proceedings of the 25th Annual International Conference of the IEEE Engineering in Medicine and Biology Society (IEEE Cat No03CH37439), Vol. 1, (Cancun), 212–215.
Michael, S., Graham, K. S., and Davis, G. M. O. (2017). Cardiac autonomic responses during exercise and post-exercise recovery using heart rate variability and systolic time intervals—a review. Front. Physiol. 8:301. doi: 10.3389/fphys.2017.00301/full
Nakamura, Y., Yamamoto, Y., and Muraoka, I. (1993). Autonomic control of heart rate during physical exercise and fractal dimension of heart rate variability. J. Appl. Physiol. 74, 875–881. doi: 10.1152/jappl.1993.74.2.875
Ng, J., Sundaram, S., Kadish, A. H., and Goldberger, J. J. (2009). Autonomic effects on the spectral analysis of heart rate variability after exercise. Am. J. Physiol. Heart Circ. Physiol. 297, H1421–H1428.
Oida, E., Moritani, T., and Yamori, Y. (1997). Tone-entropy analysis on cardiac recovery after dynamic exercise. J. Appl. Physiol. 82, 1794–1801. doi: 10.1152/jappl.1997.82.6.1794
Peçanha, T., Bartels, R., Brito, L. C., Paula-Ribeiro, M., Oliveira, R. S., and Goldberger, J. J. (2017). Methods of assessment of the post-exercise cardiac autonomic recovery: a methodological review. Int. J. Cardiol. 227, 795–802. doi: 10.1016/j.ijcard.2016.10.057
Perini, R., Orizio, C., Baselli, G., Cerutti, S., and Veicsteinas, A. (1990). The influence of exercise intensity on the power spectrum of heart rate variability. Eur. J. Appl. Physiol. 61, 143–148. doi: 10.1007/bf00236709
Perini, R., and Veicsteinas, A. (2003). Heart rate variability and autonomic activity at rest and during exercise in various physiological conditions. Eur. J. Appl. Physiol. 90, 317–325. doi: 10.1007/s00421-003-0953-9
Qiu, S., Cai, X., Sun, Z., Li, L., Zuegel, M., Steinacker, J. M., et al. (2017). Heart rate recovery and risk of cardiovascular events and all−cause mortality: a meta−analysis of prospective Cohort studies. J. Am. Heart Assoc. 6:e005505.
Rhea, C. K., Silver, T. A., Hong, S. L., Ryu, J. H., Studenka, B. E., Hughes, C. M. L., et al. (2011). Noise and complexity in human postural control: interpreting the different estimations of entropy. PLoS One. 6:e17696. doi: 10.1371/journal.pone.0017696
Rodríguez-Liñares, L., Vila, X., Méndez, A. J., and Lado, M. J. (2008). “R-HRV: an R-based software package for heart rate variability analysis of ECG recordings,” in Proceedings of the 3rd Iberian Conference in System and Information Technologies, Ourense, 565–574.
Shaffer, F., and Ginsberg, J. P. (2017). An overview of heart rate variability metrics and norms. Front. Public Health 5:258. doi: 10.3389/fpubh.2017.00258/full
Task-Force (1996). Task force of the European society of cardiology and the North American society of pacing and electrophysiology. Circulation 93, 1043–1065.
Thuraisingham, R. A. (2006). Preprocessing RR interval time series for heart rate variability analysis and estimates of standard deviation of RR intervals. Comput. Methods Programs Biomed. 83, 78–82. doi: 10.1016/j.cmpb.2006.05.002
Wideman, L., Calkins, S. D., Janssen, J. A., Lovelady, C. A., Dollar, J. M., Keane, S. P., et al. (2016). Rationale, design and methods for the RIGHT track health study: pathways from childhood self-regulation to cardiovascular risk in adolescence. BMC Public Health 16:459. doi: 10.1186/s12889-016-3133-7
Keywords: heart rate variability, non-linear dynamics, recovery heart rate, recovery heart rate variability, cardiac dynamics, emerging adults
Citation: Berry NT, Bechke E, Shriver LH, Calkins SD, Keane SP, Shanahan L and Wideman L (2021) Heart Rate Dynamics During Acute Recovery From Maximal Aerobic Exercise in Young Adults. Front. Physiol. 12:627320. doi: 10.3389/fphys.2021.627320
Received: 09 November 2020; Accepted: 07 January 2021;
Published: 05 February 2021.
Edited by:
Ahsan H. Khandoker, Khalifa University, United Arab EmiratesReviewed by:
Luiz Carlos Marques Vanderlei, São Paulo State University, BrazilJohn Allen, Coventry University, United Kingdom
Copyright © 2021 Berry, Bechke, Shriver, Calkins, Keane, Shanahan and Wideman. This is an open-access article distributed under the terms of the Creative Commons Attribution License (CC BY). The use, distribution or reproduction in other forums is permitted, provided the original author(s) and the copyright owner(s) are credited and that the original publication in this journal is cited, in accordance with accepted academic practice. No use, distribution or reproduction is permitted which does not comply with these terms.
*Correspondence: Nathaniel T. Berry, nberry11@gmail.com; Laurie Wideman, l_widema@uncg.edu