 Muhammad Umair
 Yanjun Shen
 Yongqing Qi1
 Yucui Zhang
 Ayesha Ahmad
- 1Key Laboratory of Agricultural Water Resources and Hebei Key Laboratory of Water-Saving Agriculture, Center for Agricultural Resources Research, Institute of Genetics and Developmental Biology, Chinese Academy of Sciences, Shijiazhuang, China
- 2International College, University of Chinese Academy of Sciences, Beijing, China
- 3Climate Change Research Center, Institute of Atmospheric Physics, Chinese Academy of Sciences, Beijing, China
- 4College of Energy and Environmental Engineering, Hebei University of Architecture, Zhangjiakou, China
The North China Plain (NCP) is a major grain production zone that plays a critical role in ensuring China's food supply. Irrigation is commonly used during grain production; however, the high annual water deficit [precipitation (P) minus evapotranspiration (ET)] in typical irrigated cropland does not support double cropping systems (such as maize and wheat) and this has resulted in the steep decline in the water table (~0.8 m year−1 at the Luancheng station) that has taken place since the 1970s. The current study aimed to adapt and check the ability of the CropSyst model (Suite-4) to simulate actual evapotranspiration (ETa), biomass, and grain yield, and to identify major evaporation (E) losses from winter wheat (WW) and summer maize (SM) rotations. Field experiments were conducted at the Luancheng Agro-ecosystem station, NCP, in 2010–2011 to 2012–2013. The CropSyst model was calibrated on wheat/maize (from weekly leaf area/biomass data available for 2012–2013) and validated onto measured ETa, biomass, and grain yield at the experimental station from 2010–2011 to 2011–2012, by using model calibration parameters. The revalidation was performed with the ETa, biomass, grain yield, and simulated ETa partition for 2008–2009 WW [ETa partition was measured by the Micro-lysimeter (MLM) and isotopes approach available for this year]. For the WW crop, E was 30% of total ETa; but from 2010–11 to 2013, the annual average E was ~40% of ETa for the WW and SM rotation. Furthermore, the WW and SM rotation from 2010–2011 to 2012–2013 was divided into three growth periods; (i) pre-sowing irrigation (PSI; sowing at field capacity) to emergence period (EP), (ii) EP to canopy cover period (CC) and (iii) CC to harvesting period (HP), and E from each growth period was ~10, 60, and 30%, respectively. In general, error statistics such as RMSE, Willmott's d, and NRMSE in the model evaluation for wheat ETa (maize ETa) were 38.3 mm, 0.81, and 9.24% (31.74 mm, 0.73, and 11.89%); for wheat biomass (maize biomass) they were 1.25 Mg ha−1, 0.83, and 9.64% (0.78 Mg ha−1, 0.96, and 7.96%); and for wheat grain yield (maize grain yield) they were 0.65 Mg ha−1, 0.82, and 9.87% (0.2 Mg ha−1, 0.99, and 3.79%). The results showed that CropSyst is a valid model that can be use with a reliable degree of accuracy for optimizing WW and SM grain yield production and water requirement on the NCP.
Introduction
The North China Plain (NCP) is recognized as the “breadbasket of China.” It accounted for 25% of wheat and 18% of corn production from 2002 to 2011, and continues to play a major role in ensuring national food grain security. The plain occupies 8% of global arable land (2008) (FAO, 2010) and is home to 20% of the world's population (1.4 billion in 2010) (United Nations, 2012).
Irrigation has played an integral role in the almost 8-fold increase in grain yield in the NCP from 0.64 t ha−1 in 1950 to ~5.00 t ha−1 in 2009 (Zhou et al., 2007). Grain yield relies largely on irrigation because rainfall (400–600 mm) and timing (mostly during the summer monsoon) are insufficient to support a double crop rotation such as maize and wheat. Irrigation is the most common water source throughout Hebei province in the Piedmont part of Mountain Taihang (Figure 1), with supplies originating from groundwater (~75% of the total irrigated land) and from surface water reservoirs (~25% of total irrigated land) (Liu et al., 2010; Sun et al., 2010). According to monitoring and model analyses in the Piedmont region, since the 1970s, large water deficits have been offset by high levels of groundwater withdrawal, resulting in a steep decline in water table levels [for example, ~0.8 m year−1 at the Luancheng Agro-Ecosystem Experimental Station (LAEES)]. At LAEES–the most representative farmland on the NCP–there has been a 35 m decrease in groundwater over the past 30 years, while overall in the NCP, there has been a 10 m decrease over the last 10 years. International agencies agree with the assessment of the declining water table in this region (Moench et al., 2003; Varley, 2005; Yuanxi, 2007).
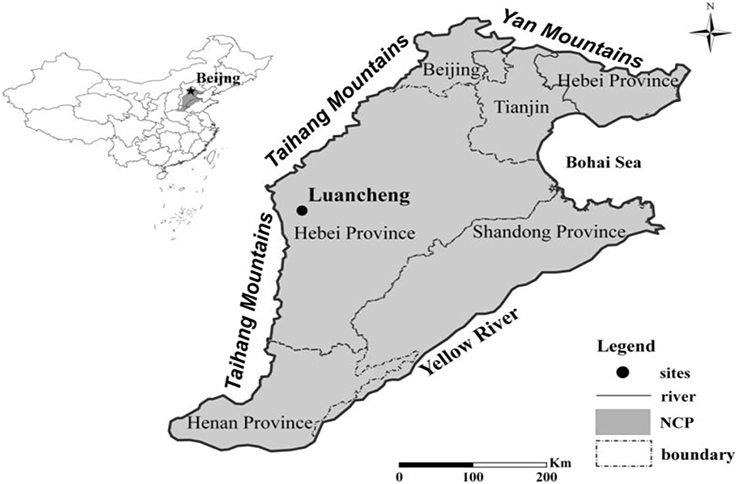
Figure 1. Location of Luancheng Agro-Ecosystem Experimental Station (LAEES) in the North China Plain.
Mean annual water deficit (P-ET) in the typical irrigated cropland in NCP is 230 mm for groundwater irrigated land. The deficit mainly occurs in the winter wheat (WW) season and ranges from 160 to 410 mm at LAEES (Shen et al., 2013). Long-term field experiments from 1987 to 2015, including 28 WW growing seasons in LAEES showed that, during that time, atmospheric evaporation demand (ET0) increased and seasonal rainfall decreased. Although yield continuously increased from 1987 to 2015 under irrigated conditions, the yield of WW under rain-fed conditions has decreased recently as compared with that during the 2000s, due to the higher ET0 and lower levels of seasonal rainfall (Zhang et al., 2017).
Climate change studies on the NCP indicate that this situation will further worsen with the increase in agricultural water demand and the predicted decline in water resources (Tao et al., 2003, 2005; Falloon and Betts, 2010). This position is the outcome of over irrigation by NCP farmers in their attempts to achieve high yields, especially during the wheat-growing season (Yang et al., 2002; Zhang et al., 2002). Water-use efficiency is still low due to poor irrigation management practices such as flood irrigation (Wang et al., 2002; Deng et al., 2006; Shao et al., 2009). In view of the above situation, there is an urgent need for alternative strategies that ensure sustainable application of small amount groundwater at site-specific and regional levels (Qadir et al., 2003).
Water usage is usually described as evapotranspiration (ET) over the entire crop growing period. Accurate monitoring or estimation of ET, as well as the biomass formation from cropland, are essential for estimating water use efficiency (WUE) (Todd et al., 2000; Shen et al., 2004; Shao et al., 2010). A variety of approaches have been used to monitor ET, including a weighing lysimeter (Liu et al., 2002; Castellví and Snyder, 2010), eddy covariance systems (Zhou and Zhou, 2009; Scott, 2010), and water balance modeling (Wilson et al., 2001; Sun et al., 2010). Several studies have been conducted using pots and field experiments to assess soil evaporation losses and to quantify the exact quantity of water applied to WW; the yield results were then compared with dissimilar water treatments on the NCP. For example, Liu et al. (2002) determined soil E, by using a micro-lysimeter and ET by employing a large scale lysimeter, and reported that E on WW and summer maize (SM) achieved levels of 30.3 and 29.7% of the total ET, respectively. Zhang et al. (2011) used a stable isotope mixing model with micro-lysimeter E measurements and eddy covariance (EC) evapotranspiration estimates to evapotranspiration partition and suggested that E from the soil surface during WW seasons took up to 30% of the total water consumption. Thus, on this plain with its severe water deficits, water saving techniques for reducing soil E are important management practices.
The present study was designed to calibrate and extensively validate the CropSyst model for ETa, biomass, and grain yield (2010–2013) under conditions of full irrigation on a WW–SM rotation. The second aim was to revalidate the ETa, biomass, grain yield, and ETa partitioning into evaporation and transpiration on WW (2008–09). The final aim was to partition the ETa from 2010 to 2013 to identify the main soil E losses.
Materials and Methods
Study Site, Field Experiments, and Measurements
The field experiments were conducted on typical WW and SM crop rotations at LAEES Chinese Ecological Research Network, Luancheng County, Shijiazhuang, Hebei Province, China as shown in Figure 1. Shen et al. (2002) note that it is a prominent productive area yielding about 13,500 kg ha−1/y under a WW–SM rotation. The WW crop period from early October to the following mid-June is about 247 days, while the SM crop period from mid-June to late September is about 107 days. The area has a moderate dry monsoon climate, with a mean annual global radiation of 524 kJ/cm2 and a mean annual temperature of 12.2°C. Most (60–80%) of the mean annual rainfall of 481 mm occurs during the SM season (June–September), while relatively little falls during March–May at a time when WW grows rapidly, as shown in Table 1. Rainfall does not fulfill the water requirement for WW growth, particularly throughout the windy, dry spring.
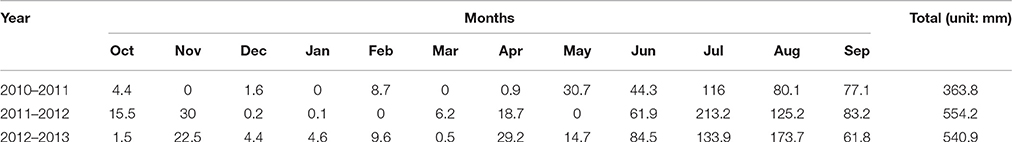
Table 1. Rainfall throughout the wheat and maize cropping periods from 2010–2011 to 2012–2013, at Luancheng Agro-Ecosystem Experimental Station (LAEES).
The experimental plots (5 × 10 m) were created and divided by concrete walls. According to the FAO (Food and Agricultural Organization) the walls extended 1.5 m under the soil surface and 24.5 cm thick. The fields had been mulched with straw from the WW and SM for ~20 years and rotary tillage was practiced (with a tilling depth of about 10 cm) to mix the broken straw with the top soil; it is termed a reduce tillage practice because the tilling depth is shallower than that of normal traditional tillage at around 25–30 cm. The WW variety Kenong No.199 was sown at a rate of 187 kg ha−1 in 25 cm wide rows. The SM variety Zhengdan No.958 was sown by hand at a rate of 53 kg ha−1 into 50 cm wide rows. Fertilization schedules included di-ammonium phosphate, applied before wheat sowing at a rate of ~600 kg/ha; then, supplementary urea was applied twice with irrigation at the beginning of April (August) 300 kg/ha (600 kg/ha) during the jointing stages of WW (SM), respectively. Generally, farmers apply manure every 2–3 years at a rate of around 100 kg N/ha. The soil type is silt loam, with a field capacity of ~35% (Sun et al., 2007; Shen et al., 2011). Soil organic matter content was 1.8% in the top 20 cm layer at the experimental site. Soil parameters and features are shown in Table 2.
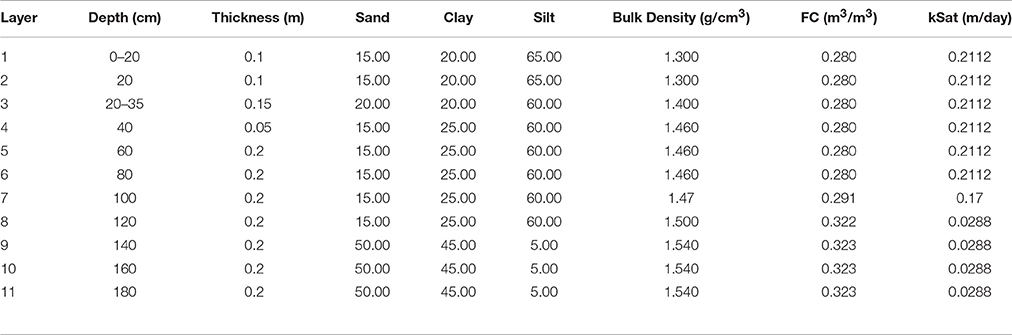
Table 2. Soil attributes at the experimental site at Luancheng Agro-Ecosystem Experimental Station (LAEES).
A low pressure water transportation system outlet connected to a plastic pipe was used to irrigate each plot and water use was recorded by a water meter. Normally, 3–4 irrigation applications of 60–80 mm each were given during the WW growing season and 1–2 irrigations were applied for SM, depending on rainfall. Levels of irrigation and their timings are shown in Table 3. Leaf area index (LAI) was estimated by randomly measuring the leaf area of plant samples. Each sample included 10 wheat plants or 3 maize plants. The sum of the leaf area was scaled to a unit area according to plant density and then used to calculate the leaf area index. Plant density was observed simultaneously. Grain yield measurement was taken in the middle of each plot (area of 3 × 8 m), and a 1,000-kernel weight was determined from the harvested grains. For dry matter, 10 plants were measured after 48 h of oven drying at 65°C.
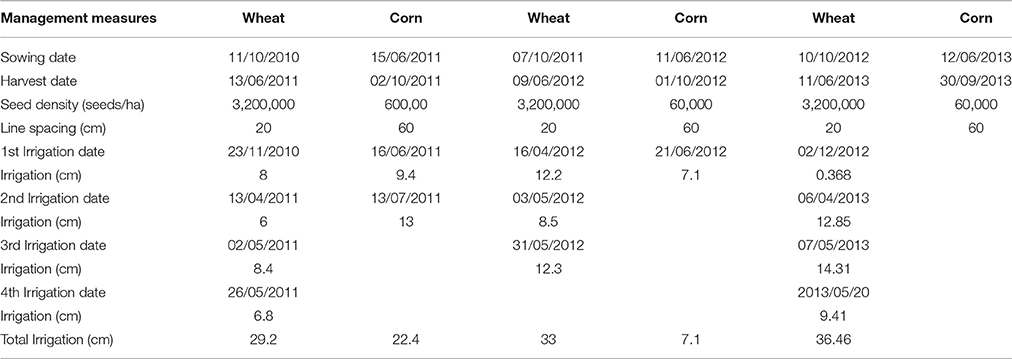
Table 3. Management measures during winter wheat and summer maize seasons from 2010–2011 to 2012–2013, at Luancheng Agro-Ecosystem Experimental Station (LAEES).
ET measured by an eddy covariance (EC) system consisted of a CSAT3 sonic-anemometer and a LI7500 H2O/CO2 gas analyzer (Campbell Scientific, Inc. USA) at 3 m above ground level. Latent heat flux was measured every 30 min. The water table declined rapidly from 1975 to 2016 with a drawdown rate of about 0.8 m per year as shown in Figure 2.
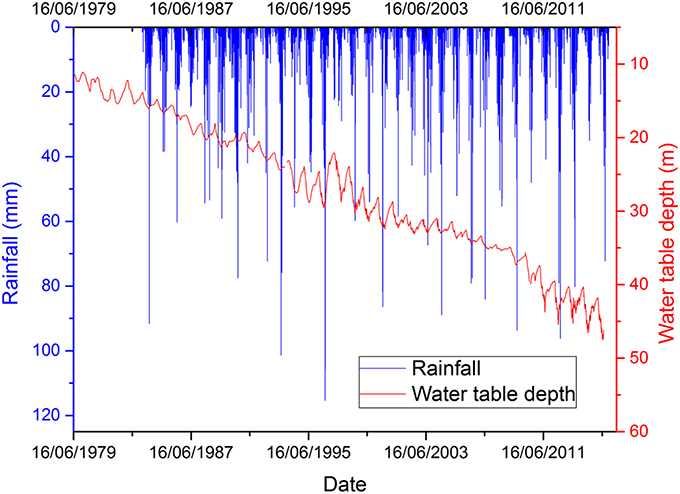
Figure 2. Ground water dynamic changes 1974–2016 at Luancheng Agro-Ecosystem Experimental Station (LAEES).
The water table increased a little after rainfall, but a dramatic decrease was noted at the start of each successive irrigation period. Weather data was recorded on a daily basis, including rainfall, maximum/minimum temperature, relative humidity, dew point, and wind speed throughout the experimental period; this was obtained from the meteorological station at LAEES. The Angstrom equation was used for the calculation of daily solar radiation from the number of sunshine hours (Jones, 1992). Field data was collected from 2010–2011 to 2012–2013 at LAEES and thereafter used to calibrate and validate the CropSyst Model. Management measures during WW and SM growing seasons from 2010–2011 to 2012–2013 are shown in Table 3.
CropSyst Model
The ability to simulate crop rotations is important in the analysis of cropping systems. Models used in rotation configuration belong to the CERES and CROPGRO families; these are all situated under the umbrella of DSSAT (Jones et al., 1998). Jones et al. (2001) report that DSSAT access has been slow to adopt a more generic simulation platform, hence users tend to merge these models to simulate crop rotation. Efficient and simple multi-crop simulation takes place in the EPIC model for the analysis of cropping systems and rotations (Willmott, 1982). CropSyst was designed to depict the EPIC concept for the analysis of crop growth, including a more process-oriented approach to simulate crop rotation and its interaction with the surrounding environment and management (Stockle et al., 1994; Stöckle et al., 2003). CropSyst is a cropping system model that is designed to simulate a range of management and weather scenarios. This model is suitable for use in the study of soil, water budget, nitrogen budget, and weather variables. The predictive capability of a model determines its reliability, application, and performance evaluation for its use as a research tool. Therefore, in this study, we used the CropSyst model to simulate growth yield and water use of a widely grown rotation of SM and WW in NCP. The results of this study should offer valuable information about agricultural water management and help assess approaches that involve reducing water usage while maintaining crop productivity.
Input Data
CropSyst (Suite-4) was used to model crop rotations and crop productivity in reaction to soil, management, and weather. Crop growth stages were simulated based on thermal time demands to different developmental stages. CropSyst used five input files for simulation: (i) simulation control (a combination of different input files such as start and ending days, crop rotation, initialization parameters, simulation of soil salinity, erosion, CO2, and nitrogen effectuates on crop development, and a choice of soil runoff and water distribution models) based on field experiments; (ii) position file [latitude, weather file, rainfall volume parameters, ET model selection Penman-Monteith (PM) or Priestley-Taylor (PT) on automatic mode] obtained from the weather station of the experimental site; (iii) soil file (soil type, pH, wilting point, bulk density, field capacity, cation exchange capacity, and hydraulic conductivity) based on existing field soil properties; (iv) management file (irrigation, fertilization, tillage, residue, conservation, and harvesting) based on field management operation; and (v) crop file (emergence, thermal time accumulation, transpiration, attain growth, canopy growth, phenology, vernalization, photo-period, senescence, dormancy, and harvest). Detailed data of weekly leaf area, biomass, and grain yield were measured, and harvest index was determined during the experiment, that used for crop file preparation. The parameters used for the CropSyst model were measured or estimated using experimental data; some of this information was based on field experience, and other parameters used the default values given in the model, regardless of the year (Table 4).
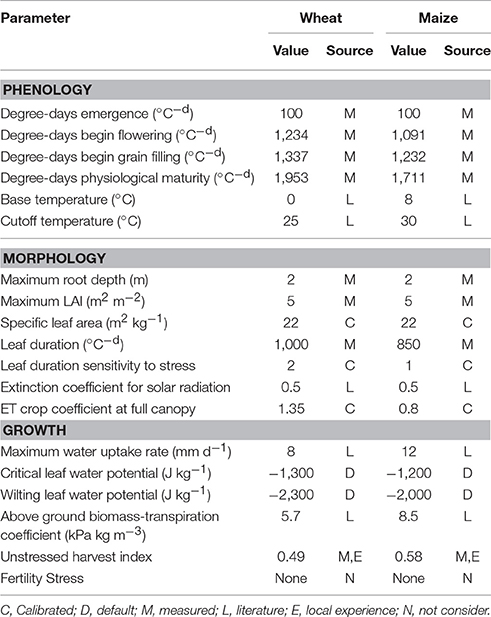
Table 4. Parameters used in the CropSyst model to simulate winter wheat and summer maize cropping.
Model Calibration, Validation, and Evaluation
Parameters
The CropSyst model allows calibration of cultivar sensitive parameters for crops. A daily weather database, experimental phenologic stages, weekly biomass, weekly green leaf area indices, and biomass and grain yield at maturity were input for each growing season to calibrate phenology, morphology, and growth parameters (Table 4) for the study location.
Calibration of the CropSyst Model
Calibration of the CropSyst model was performed using values observed from the experiment during 2012–2013 of WW and SM on full irrigation, for ETa, biomass, and grain yield. Differences between the simulated model and the measured data were minimized by applying a trial and error approach. A detailed data set of weekly leaf area and biomass was available for 2012–2013, so this was selected for calibration.
Validation of the Cropsyst Model
Validation was performed by equating field observed data with simulated results and it is a significant measure in model assessment (Power, 1993; Addiscott et al., 1995). ETa, biomass, and grain yield were considered as the verification parameters for the CropSyst model. Crop parameters obtained from the model calibration were used in the validation. The independent data set was used to test the model's performance from 2010 to 2012.
Revalidation of the CropSyst Model
A revalidation of the model depends upon its successful calibration based on field experimental data, and the accurate estimation of the specific model's coefficients in a given environment. Eitzinger et al. (2003) revalidated the CERES-Wheat model using the grain yield observed over 9 years (1985–1993) at the experimental site, and compared it with model outputs. Iqbal et al. (2014) revalidated the AquaCrop model for wheat on the NCP under deficit irrigation from field experiments to regional yield simulation. In the current study for the CropSyst evaluation, we used ETa, biomass, grain yield, and ETa partition data measured at the Luancheng experimental site for WW (2008–2009) using well-water irrigation. Small experiment plots (5 × 10 m) were constructed with concrete walls to avoid soil water recharge, according to stipulations adjusted by the FAO. Plot experiments have been in operation for approximately 15 years. The well-watered plots were irrigated to maintain ≥85% of field capacity. Three irrigation applications totaling 230 mm were given in April to May 2009. Soil volumetric moisture content was measured using a neutron probe (IH-II, Institute of Hydrology, Wallingford, UK) at 10 cm intervals between a depth of 0 and 180 cm. Depth of the water table was measured with a water level logger (Hobo U20-001-01, Onset Corp., Bourne, MA). Vapor pressure deficit was calculated from temperature and relative humidity data that was measured with a temperature-relative humidity data logger at 0.1, 3, and 10 m. Soil temperatures at 0.05 m were measured with a digital thermometer. ET was measured by an EC system composed of a CSAT3 sonic-anemometer and a LI7500 H2O/CO2 gas analyzer (Campbell Scientific, Inc.) at 3 m above ground level. Latent heat flux was measured every 30 min. Evaporation (E) data was measured using two micro-lysimeter systems (MLS) (Shen et al., 2002; Sun et al., 2006). Stable isotopes are excellent tracers of soil water cycling because of the isotopic fractionation imparted by E. Isotope composition of soil water, groundwater, plant-stem water, rainfall, and atmospheric water vapor were analyzed over one growing season. ETa and its partitioning was performed by combined isotopic and micro-meteorologic approaches in an irrigated WW field; a more detail description of this experiment can be found in a related paper, Zhang et al. (2011). This season was chosen for revalidation because transpiration (T) and E data, collected by a micro-lysimeter and isotopes, was available.
Model Evaluation
Since no individual criterion can accurately gauge the accuracy of a simulation model, combine statistical indexes are broadly applied to judge model performance (Caton et al., 1999; Kobayashi and Salam, 2000; Gauch et al., 2003). Correspondence between the observed and simulated values were measured by adopting six statistics: RMSE (root mean square error), NRMSE (normalized root mean square error), MBE (mean bias error), MAE (mean absolute error), and IoA (index of agreement) (Willmott, 1982). Percentage differences were determined using the following equations, where Si indicates simulated values and Mi indicates measured values of all statistical indices.
The simulation results are viewed as excellent when an NRMSE of <10% is achieved, good if the NRMSE is >10% <20%, fair if the NRMSE is >20% <30%, and poor if the NRMSE is >30% (Jamieson et al., 1991). For IoA, a measure result of 1.0 indicates excellent correspondence between measured and simulated values. For RMSE, a result close to zero indicates better model performance. MBE reveals the duration of execution of the model. A positive MBE result gives the mean sum of overvaluation in the estimated values and vice versa. MAE measures the weighted average magnitude of the absolute errors.
Results
CropSyst Model Calibration
The CropSyst calibrated data set of WW (2012–2013) and SM (2013) is shown in Table 5 for ETa, biomass, and grain yield. In WW, the minimum (maximum) deviation in grain yield (ETa) was 4.76% (9.51%), respectively, while the deviation in biomass was 5.03%. For the SM crop, the minimum (maximum) deviation in ETa (grain yield) was −0.11% (−0.51%), respectively, while biomass deviation was 0.27%. The calibration results show a reasonably close match between the measured values and those simulated by the model (Table 5).
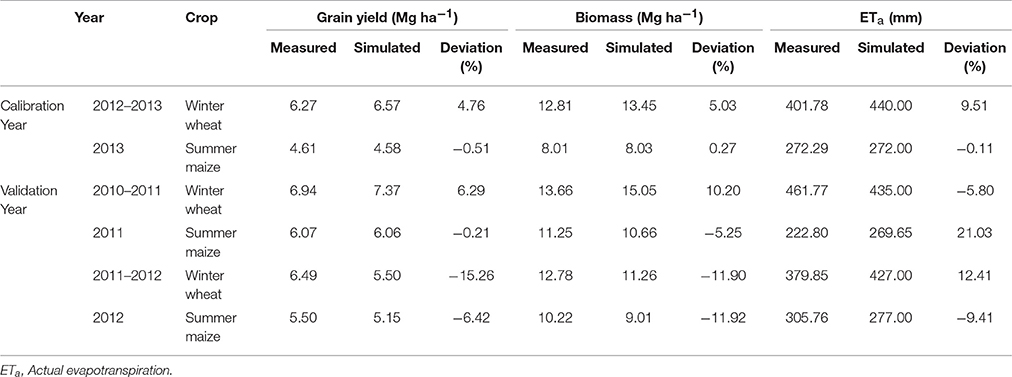
Table 5. Measured vs. simulated results for calibrated and validated data sets of winter wheat and summer maize from 2010 to 2013 at Luancheng Agro-Ecosystem Experimental Station (LAEES).
CropSyst Model Validation
Considering the same parameters used in the calibration procedure, CropSyst was validated for 2010–2011 to 2011–2012, as shown in the second part of Table 5.
Actual Evapotranspiration (ETa)
Table 5 shows validation of the CropSyst model for ETa in the experimental years of 2010–2011 to 2011–2012. In the first year of validation, CropSyst simulated the largest deviation (21.03%) for SM (2011). This suggests the lowest drainage levels plus seasonal rainfall contributed to an overestimation of ETa, but produced a satisfactory grain yield and biomass. Other underestimated deviation of ETa (−5.8%) in the WW (2010–2011) also prostrates to drainage; in contrast, grain yield and biomass were simulated by CropSyst to an acceptable level. For the validation year of 2011–2012, WW showed a positive deviation (12.41%) and SM under-estimated the deviation (−9.41) of ETa with the CropSyst model, but produced a satisfactory grain yield and biomass. Table 6 contains all the model evaluation criteria from 2010–2011 to 2012–2013, with RMSE (38.3 mm), MAE (37.38 mm), MBE (19.35 mm), d (0.81), and NMRSE (9.42%) for WW, while for SM the following were achieved: RMSE (31.74 mm), MAE (25.30 mm), MBE (5.94 mm), d (0.73), and NMRSE (11.42%). The model therefore gave an acceptable simulation of the value of ETa for WW and SM in the arid-semiarid conditions of North China.
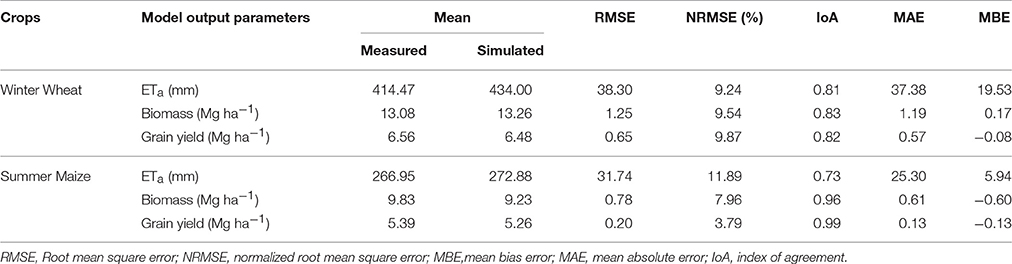
Table 6. Simulation error statistics of winter wheat and summer maize.
Final Aboveground Biomass
Final above ground biomass validation of the CropSyst model is shown in Table 5. The highest negative deviations (−11.90%, −11.92%) were simulated for WW (2011–2012), and for SM (2012), respectively. This was due to severe water stress experienced during the cropping season. Another significant positive deviation (10.2%) was noted for the WW 2010–2011 seasons, where irrigation was omitted during the grain filling period, and this treatment received the lowest amount of irrigation. The additional amount of water obtained from rainfall could lead to an over estimation of the biomass. Overall statistical parameters for model evaluation in Table 6 show: RMSE (0.78 Mg ha−1), MAE (0.61 Mg ha−1), MBE (−0.60 Mg ha−1), d (0.96), and NMRSE (7.96%) of SM biomass and an RMSE (1.25 Mg ha−1), MAE (1.19 Mg ha−1), MBE (−0.17 Mg ha−1), d (0.83), and NMRSE (9.54%) of WW biomass, respectively. The results of the present study revealed that the CropSyst model effectively simulated the above ground biomass of WW and SM.
Grain Yield
The validation year results in Table 5 show no significant deviation in grain yield for WW (6.29%) and SM (−0.21%) between the CropSyst measured and simulated values for the year 2010–2011. In the second year of validation (2011–2012), an underestimated deviation (−15.2%) was simulated for WW grain yield as this year was also relatively dry and the cropping season depended mainly upon irrigation, as already explained for biomass. Meanwhile, a −6.42% deviation was simulated for SM grain yield. Statistical assessment of the 3 years experiment with the CropSyst model showed that the RMSE (0.65 Mg ha−1), MAE (0.57 Mg ha−1), MBE (−0.08 Mg ha−1), d (0.82), and NMRSE (9.87%) of WW grain yield and the RMSE (0.2 Mg ha−1), MAE (0.13 Mg ha−1), MBE (−0.13 Mg ha−1), d (0.99), and NMRSE (3.79%) of SM grain yield, respectively, were within an acceptable range. These results suggest that CropSyst is a valid model for WW and SM grain yield simulation.
Revalidation of the CropSyst Model on Winter Wheat (2008–2009)
The results of revalidation in Table 7 show no significant deviation in grain yield (−2.8%), biomass (−1.81), and ETa (4.12%); the measured and simulated variables are a close match. The results of this study suggested that the CropSyst model can be used with a considerable degree of accuracy to simulate grain yield, biomass, and ETa of WW in the NCP.
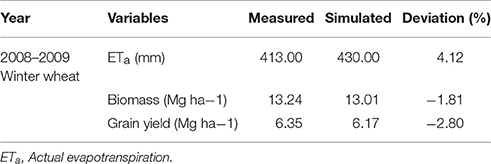
Table 7. Measured vs. simulated results for revalidated data sets of winter wheat of 2008–2009 at Luancheng Agro-Ecosystem Experimental Station (LAEES).
ETa Partitioning into Evaporation and Transpiration for Winter Wheat 2008–2009
After successful revalidation of the CropSyst model for WW, simulated ETa partitions were performed into E and T. The temporal trends in rainfall, irrigation, and simulated ETa illustrate that ETa increased substantially when rainfall or irrigation occurred (Figure 3). During growth periods for WW from planting to harvesting, simulated ETa partitions of WW (2008–2009) into E and T show that the total ETa was 430 mm, and E and T were 129 mm and 301 mm, respectively.
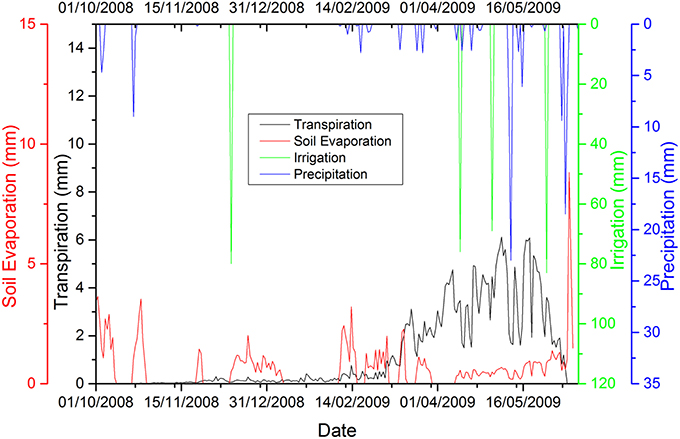
Figure 3. Total daily rainfall (including irrigation) and evapotranspiration partition during the winter wheat growing season of 2008–2009.
Furthermore, during the field experiment, T was measured by two methods, (i) E was measured using a micro-lysimeter (E(T)-MLS) and subtracted from ETa as measured by EC; (ii) T was measured using the stable isotope method (E(T)-ISO). Complete isotopic data was collected on two dates representing the late stage of filling and the stage of wax ripeness [days of year (DOY) 138 and DOY149, respectively] and E data from MLS recordings available on the following days of year, as shown in Table 8. Observed T was 83% of total ETa on DOY138 and 60% of ETa on DOY149. The maximum percentage of T occurred during the filling stage; this was expected because this stage corresponds to a higher LAI and increasing biomass.
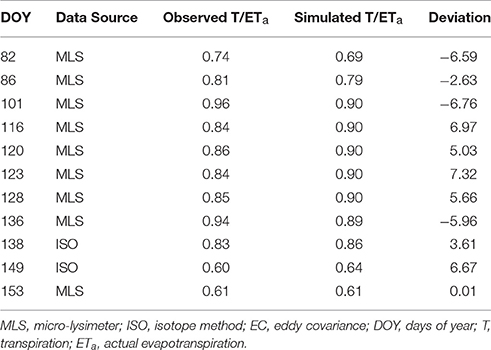
Table 8. Ratio of simulated transpiration.
Figure 4 shows the measured vs. simulated percentage comparison of T/ETa and statistical assessment of the CropSyst model for the WW season of 2008–2009. The results of RMSE, MAE, MBE, d, and NRMSE were 4.68, 15.78, 3.01, 0.99, and 5.8% respectively, for WW grain yield.
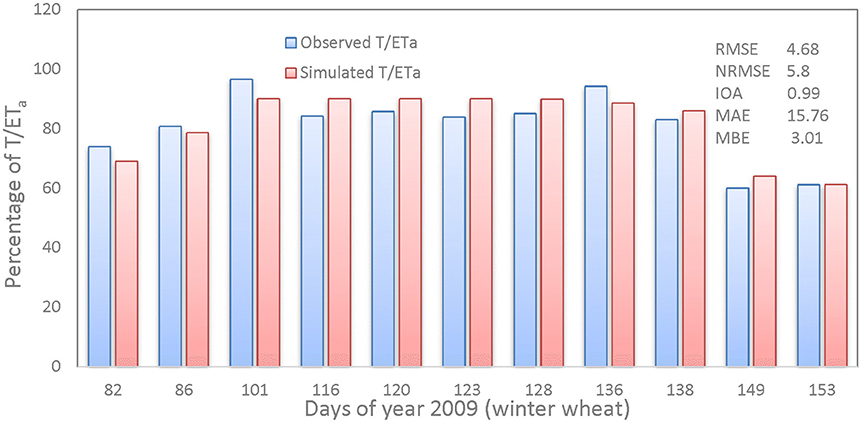
Figure 4. Measured vs. simulated percentage comparison of transpiration (T)/actual evapotranspiration (ETa).
The straight-line equation and coefficient of determination shows that the model simulated T/ETa with a high degree of reliability, having a regression value of 0.83, as shown in Figure 5.
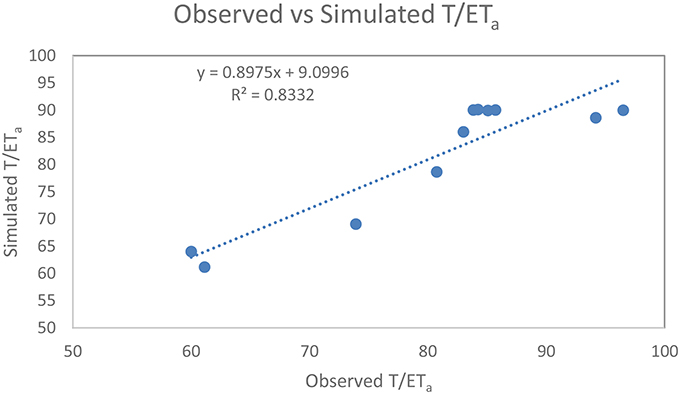
Figure 5. Relationship between the observed and simulated winter wheat transpiration (T)/actual evapotranspiration (ETa).
ETa Partition of Wheat and Maize Crop Rotation to Identify Evaporation Losses
The simulated ETa partitions into E and T of WW and SM from 2010 to 2013 are given in Figure 6 and show that the average value of total ETa, E, and T were 707, 282, and 425 mm, respectively. The temporal trend in rainfall, irrigation, and ET partition illustrates that ETa increased substantially during rainfall or irrigation, (for example see Figure 6).
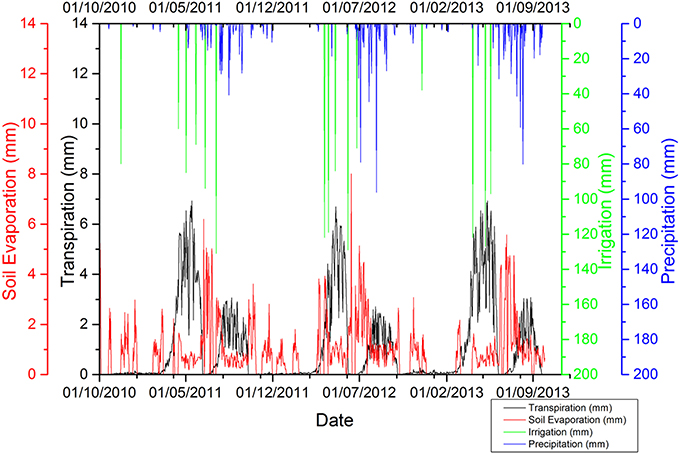
Figure 6. Simulated ETa partition results of winter wheat and summer maize 2010–2011 to 2012–2013.
Discussion
Cropsyst Model Calibration
When compared to past studies, the CropSyst model calibration of WW and SM showed better results, i.e., Singh et al. (2008) simulated the highest deviation for wheat biomass, at −14.5% (underestimate) and Donatelli et al. (1997) simulated the highest deviation (0.96%) in maize grain yield.
Cropsyst Model Validation
Actual Evapotranspiration (ETa)
The large deviation in ETa during the SM season (2011) was due to the high rainfall and low drainage. The negative (underestimated) deviation during the WW season (2010–2011) was also prone to drainage. During the next year of validation (2011–2012), WW (SM) were overestimated (underestimated) by the CropSyst model, meanwhile, both years produced a satisfactory grain yield and biomass. Based on field experiments, Sun et al. (2006) indicated that a full irrigation treatment had the highest amount of drainage, lowest water-use efficiency, and produced a lower yield. This could be the cause of the underestimation of ETa. Model evaluation criteria of ETa for WW and SM from 2010–2011 to 2012–2013 fell within an acceptable range, as shown in Table 6. The RMSE of ETa in WW and SM was within the excellent range and comparable with Fang et al. (2010), who simulated ETa using RZWQM2 with a RMSE of 41.5 mm for a wheat-maize cropping system on the NCP. The CropSyst model calibrated ETa more accurately with minimum deviation when compare to validation results.
Final Aboveground Biomass
The highest negative deviation of above ground biomass in WW (2011–2012) and SM (2012) was similar to grain yield deviation; this was due to water stress. A positive deviation was noted in WW biomass in 2010–2011; this was due to the grain filling stage being excluded from irrigation but being exposed to extra rainfall. A similar trend was observed in the CropSyst model validation for grain yield. Hsiao et al. (2009) presented a deviation between −0.4 and 21.9% for maize biomass simulation in the AquaCrop model. Table 6 shows the overall statistical parameters for model evaluation. Values of RMSE (0.78 Mg ha−1), MAE (0.61 Mg ha−1), MBE (−0.60 Mg ha−1), d (0.96), and NMRSE (7.96%) for SM were comparable with those results obtained by other studies (Stockle et al., 1997). WW results for RMSE (1.25 Mg ha−1), MAE (1.19 Mg ha−1), MBE (−0.17 Mg ha−1), d (0.83), and NMRSE (9.54%) were comparable with Wang et al. (2006) and Singh et al. (2008).
Lu and Fan (2013) used the EPIC model to study yield gap for WW on the NCP, with an RMSE for biomass range between 1.18 and 2.0 Mg ha−1. Yu et al. (2006) calibrated and validated the Root Zone Water Quality Model (RZWQM) with both a generic plant growth module (RZWQM-G) and the CERES plant growth module (RZWQM-C) to simulate wheat-maize double cropping systems on the NCP and reported an RMSE of 2.07 Mg ha−1 with the RZWQM-G, and 2.26 t ha−1 with the RZWQM-C model. For simulated biomass, Heng et al. (2009) reported an RMSE range between 0.46 and 6.51 Mg ha−1 for maize using the AquaCrop model when using data from different locations. These results suggest that the CropSyst model provides a better simulation of above ground biomass than previous studies.
Grain Yield
The deviation range of the current study validation was considerably better for grain yield (6.29 to −15.26%) for WW and SM from 2010–2011 to 2011–2012, than, for example, Araya et al. (2010) who report a deviation range of validation data of −13 to 15.1% for grain yield. Table 6 shows the statistical assessment of the CropSyst model for 3 experimental years. The results for RMSE (0.65 Mg ha−1), MAE (0.57 Mg ha−1), MBE (−0.08 Mg ha−1), d (0.82), and NMRSE (9.87%) of WW grain yield are comparable with those obtained by Singh et al. (2008) for WW grown at the Indian Agricultural Research Institute, New Delhi, using the same CropSyst model and CERES-Wheat for grain yield simulation. Wang et al. (2006) used CropSyst to simulate spring wheat with an RMSE of 13% of the observed means of grain yield in the Black Soil Zone of Northeast China. Rotation maize crop results with RMSE (0.2 Mg ha−1), MAE (0.13 Mg ha−1), MBE (−0.13 Mg ha−1), d (0.99), and NMRSE (3.79%) of grain yield are comparable with Stockle et al. (1997) who used a performance comparison study of sub-models (Penman Monteith-finite difference) of different levels of complexity in CropSyst. The results of the CropSyst model can be compared with other crop models used on the NCP for WW and SM yields. For example, Yu et al. (2006) calibrated and validated the Root Zone Water Quality Model (RZWQM) with both a generic plant growth module (RZWQM-G) and the CERES plant growth module (RZWQM-C) to simulate wheat and maize double cropping systems on the NCP; the overall simulation runs showed that the RZWQM-C model simulated grain yields with an RMSE of 0.94 Mg ha−1, compared to an RMSE of 1.23 Mg ha−1 with RZWQM-G. Fang et al. (2010) calibrated and validated RZWQM2, a hybrid model that combines the Root Zone Water Quality Model (RZWQM) and DSSAT4.0 to simulate wheat and maize grain yield with an RMSE of 0.59 Mg ha−1 and 0.71 Mg ha−1, respectively. Therefore, the results of this study suggest that the CropSyst model can be used with a considerable degree of accuracy to simulate the grain yield of WW and SM rotations in the NCP.
ETa Partitioning into Evaporation and Transpiration for Winter Wheat 2008–2009
Simulated T closely matched observed T according to two different methods (i) micro-lysimeter subtracted from ETa measured by EC (E(T)- MLS); (ii) the stable isotope method (E(T)-ISO). The deviation results of simulated vs. measured ratio T/ETa in Table 8 are similar. The percentage comparison and statistical assessment of measured vs. simulated T/ETa of the CropSyst model for WW 2008–2009, fell within an acceptable range and IoA was in the excellent range. E was 30% of total ETa in the WW growing season of 2008–2009 and is comparable with results obtained by Zhang et al. (2011) for WW grown in LAEES, NCP.
ETa Partition of Wheat and Maize Crop Rotation to Identify Evaporation Losses
E accounts for 40% of total annual ETa for the growing seasons of both WW and SM, as shown in Figure 6. These results are comparable with Liu et al. (2002) for WW and SM grown in LAEES, NCP. The pre-sowing irrigation method for wheat and maize is practiced in the NCP, in which irrigation is performed before harvesting of the previous crop and sowing is performed at soil field capacity. This leads to huge soil E losses after harvesting of the previous crop to emergence of the new crop up to the stage of canopy cover (see for instance, Figure 6).
Averages of the 3 years growth period for WW and SM were divided into 3 developmental periods; (i) PSI to EP, (ii) EP to CC (end of new leaf) period, and (iii) CC to HP, as shown in Table 9. Daily E accounts for ~10% of E in the pre-irrigation sowing to emergence period, ~60% emergence to canopy cover (end of new leaf) period, and ~30% canopy cover to harvesting period for both WW and SM crops. Most E occurs during the pre-sowing irrigation to canopy cover period. Therefore, results suggest that there is a need to reduce E through the use of precise irrigation (i.e., surface and sub-surface drip irrigation or by mulching) to overcome the huge water losses. For example, if we assume a precise irrigation method (such as drip irrigation), this saves 10% soil E losses (Evett et al., 2005; Abdelraouf and ElHabbasha, 2014; Qin et al., 2016). So, an irrigation reduction of 10% (ETa reduction) across 1.7 million hectares of agricultural land in Hebei Province would account for approximately 1,700 million m3 year−1 of water saving.
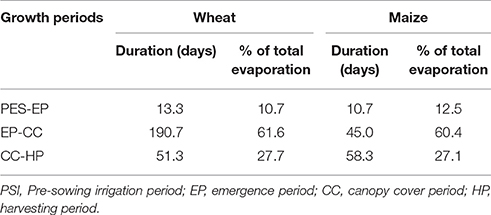
Table 9. Evaporation losses with respect to growth stages.
The results of this study clearly indicate that the CropSyst model can be used with a high degree of accuracy for yield simulation and soil water loss analysis of WW and SM crop rotations on the NCP. It can also serve as a useful tool for assessing national food and water security in the agricultural sector.
Summary and Conclusions
Calibration of the CropSyst model (Suite-4) and its validation was tested in the 2010–2011 to 2012–2013 winter wheat (WW) and summer maize (SM) seasons in the arid and semiarid conditions of the NCP. Satisfactory agreements were obtained for ETa, biomass, and grain yield in the validation process. Major deviations were observed under conditions of severe stress. When the model was revalidated against WW (2008–2009), the results of the modeled ETa, biomass, and grain yield were well matched with a minimum deviation of 4.12%, −1.81, and −2.8%, respectively. In the same year, the simulated ETa was split into evaporation (E) and transpiration (T), where, E was 30% of total ETa and results closely matched the observed data collected during the MLM and isotopes approach. Based on the ETa partition of WW (2008–2009), further ET partition of WW and SM from 2010–2011 to 2012–2013 into E and T showed that average evaporation was 40% of total ETa. E loss was high for two reasons, (i) pre-sowing irrigation practice is normally used in the NCP and sowing is performed at field capacity (ii) it is a result of flood irrigation. So, the gap between pre-sowing irrigation and canopy cover (end of new leaf stage) contribute toward a higher evaporation of ~70%. E losses from WW and SM (2010–2013) during the pre-sowing irrigation to the emergence period, the emergence to canopy cover period, and the canopy cover to harvesting period were ~10, 60, and 30%, respectively. Result reveals, there is high evaporation loss, so to reduce annual water deficit (P-ET) in typical irrigated croplands in NCP, it need to adopt advance methods (i.e., drip irrigation and mulching) to reduce E. We can conclude that the CropSyst model can be used with a reliable degree of accuracy to simulate crop rotations. This makes it a useful tool in the design and evaluation of deficit irrigation strategies that aim to prevent unnecessary loss from runoff, drainage, and soil evaporation, in addition to enhanced water-use efficiency.
Author Contributions
MU design the modeling study, perform the model analysis, synthesized results and constructed tables, figures for the paper and created the first draft. YS design the study and review the results. YQ collected weather and manage the field. YZ and HP collected crop data. AA contributed to review and final version of the manuscript. ML contributed to review the manuscript.
Conflict of Interest Statement
The authors declare that the research was conducted in the absence of any commercial or financial relationships that could be construed as a potential conflict of interest.
Acknowledgments
The authors acknowledge the support of the National Key Project of Research and Development Plan (Grant no. 2016YFC0401403), the National Natural Scientific Foundation of China (NSFC, Grant no. 41471027), CAS-TWAS President's Fellowship Program for international Ph.D. students by Chinese Academy of Science and The World Academy Sciences. We gratefully acknowledge Dr. Armen R. Kemanian for guidelines on the CropSyst Model. We also thank Mr. Roger Nelson for his assistance in preparing input files. The authors sincerely acknowledge Leilei Min, and Wulin and Dengpan Xiao for their helpful advice.
References
Abdelraouf, R. E., and ElHabbasha, S. F. (2014). Wheat production in the arid regions by using drip irrigation system. Int. J. Adv. Res. 2, 84–96. Available online at: https://www.researchgate.net/publication/270050711_WHEAT_PRODUCTION_IN_THE_ARID_REGIONS_BY_USING_DRIP_IRRIGATION_SYSTEM_INTRODUCTION
Addiscott, T., Smith, J., and Bradbury, N. (1995). Critical evaluation of models and their parameters. J. Environ. Qual. 24, 803–807. doi: 10.2134/jeq1995.00472425002400050002x
Araya, A., Habtu, S., Hadgu, K. M., Kebede, A., and Dejene, T. (2010). Test of AquaCrop model in simulating biomass and yield of water deficient and irrigated barley (Hordeum vulgare). Agric. Water Manage. 97, 1838–1846. doi: 10.1016/j.agwat.2010.06.021
Castellví, F., and Snyder, R. L. (2010). A comparison between latent heat fluxes over grass using a weighing lysimeter and surface renewal analysis. J. Hydrol. 381, 213–220. doi: 10.1016/j.jhydrol.2009.11.043
Caton, B. P., Foin, T. C., and Hill, J. E. (1999). A plant growth model for integrated weed management in direct-seeded rice: II. validation testing of water-depth effects and monoculture growth. Field Crops Res. 62, 145–155. doi: 10.1016/S0378-4290(99)00013-1
Deng, X. P., Shan, L., Zhang, H., and Turner, N. C. (2006). Improving agricultural water use efficiency in arid and semiarid areas of China. Agric. Water Manage. 80, 23–40. doi: 10.1016/j.agwat.2005.07.021
Donatelli, M., Stöckle, C., Ceotto, E., and Rinaldi, M. (1997). Evaluation of CropSyst for cropping systems at two locations of northern and southern Italy. Eur. J. Agron. 6, 35–45. doi: 10.1016/S1161-0301(96)02029-1
Eitzinger, J., Štastná, M., Žalud, Z., and Dubrovský, M. (2003). A simulation study of the effect of soil water balance and water stress on winter wheat production under different climate change scenarios. Agric. Water Manage. 61, 195–217. doi: 10.1016/S0378-3774(03)00024-6
Evett, S. R., Colaizzi, P. D., and Howell, T. A. (2005). “Drip and evaporation,” in Proceedings of the Central Plains Irrigation Conference (Sterling, CO).
Falloon, P., and Betts, R. (2010). Climate impacts on European agriculture and water management in the context of adaptation and mitigation—the importance of an integrated approach. Sci. Total Environ. 408, 5667–5687. doi: 10.1016/j.scitotenv.2009.05.002
Fang, Q., Ma, L., Yu, Q., Ahuja, L. R., Malone, R. W., and Hoogenboom, G. (2010). Irrigation strategies to improve the water use efficiency of wheat–maize double cropping systems in North China Plain. Agric. Water Manage. 97, 1165–1174. doi: 10.1016/j.agwat.2009.02.012
FAO (2010). Land use/Resources/FAO Statistical Yearbooks—World food and agriculture. FAO. Available online at: www.fao.org/economic/ess/esspublications/ess-yearbook/ess-yearbook2010/yearbook2010reources/en/
Gauch, H. G., Hwang, J. T. G., and Fick, G. W. (2003). Model evaluation by comparison of model-based predictions and measured values. Agron. J. 95, 1442–1446. doi: 10.2134/agronj2003.1442
Heng, L. K., Hsiao, T., Evett, S., Howell, T., and Steduto, P. (2009). Validating the FAO AquaCrop model for irrigated and water deficient field maize all rights reserved. No part of this periodical may be reproduced or transmitted in any form or by any means, electronic or mechanical, including photocopying, recording, or any information storage and retrieval system, without permission in writing from the publisher. Agron. J. 101, 488–498. doi: 10.2134/agronj2008.0029xs
Hsiao, T. C., Heng, L., Steduto, P., Rojas-Lara, B., Raes, D., and Fereres, E. (2009). AquaCrop—the FAO crop model to simulate yield response to water: III. parameterization and testing for maize all rights reserved. No part of this periodical may be reproduced or transmitted in any form or by any means, electronic or mechanical, including photocopying, recording, or any information storage and retrieval system, without permission in writing from the publisher. Agron. J. 101, 448–459. doi: 10.2134/agronj2008.0218s
Iqbal, M. A., Shen, Y., Stricevic, R., Pei, H., Sun, H., Amiri, E., et al. (2014). Evaluation of the FAO AquaCrop model for winter wheat on the North China Plain under deficit irrigation from field experiment to regional yield simulation. Agric. Water Manage. 135, 61–72. doi: 10.1016/j.agwat.2013.12.012
Jamieson, P. D., Porter, J. R., and Wilson, D. R. (1991). A test of the computer simulation model ARCWHEAT1 on wheat crops grown in New Zealand. Field Crops Res. 27, 337–350. doi: 10.1016/0378-4290(91)90040-3
Jones, H. G. (1992). Plant and Microclimate: a Quantitative Approach to Environmental Plant Physiology, 2nd Edn. Cambridge: Cambridge University Press.
Jones, J. W., Keating, B. A., and Porter, C. H. (2001). Approaches to modular model development. Agric. Syst. 70, 421–443. doi: 10.1016/S0308-521X(01)00054-3
Jones, J. W., Tsuji, G. Y., Hoogenboom, G., Hunt, L. A., Thornton, P. K., Wilkens, P. W., et al. (1998). “Decision support system for agrotechnology transfer: DSSAT v3,” in Understanding Options for Agricultural Production, eds G. Y. Tsuji, G. Hoogenboom, and P. K. Thornton (Dordrecht: Springer Netherlands), 157–177.
Kobayashi, K., and Salam, M. U. (2000). Comparing simulated and measured values using mean squared deviation and its components research partly supported by Core Research For Evolutional Science and Technology (CREST) of Japan Science and Technology corp. (JST). Agron. J. 92, 345–352. doi: 10.2134/agronj2000.922345x
Liu, C., Zhang, X., and Zhang, Y. (2002). Determination of daily evaporation and evapotranspiration of winter wheat and maize by large-scale weighing lysimeter and micro-lysimeter. Agric. Forest Meteorol. 111, 109–120. doi: 10.1016/S0168-1923(02)00015-1
Liu, L., Luo, Y., He, C., Lai, J., and Li, X. (2010). Roles of the combined irrigation, drainage, and storage of the canal network in improving water reuse in the irrigation districts along the lower Yellow River, China. J. Hydrol. 391, 157–174. doi: 10.1016/j.jhydrol.2010.07.015
Lu, C., and Fan, L. (2013). Winter wheat yield potentials and yield gaps in the North China Plain. Field Crops Res. 143, 98–105. doi: 10.1016/j.fcr.2012.09.015
Moench, M., Burke, J., and Moench, Y. (2003). “Rethinking the approach to groundwater and food security,” in Water Report 24 (Rome: Food and Agriculture Organization of the United Nations).
Power, M. (1993). The predictive validation of ecological and environmental models. Ecol. Model. 68, 33–50. doi: 10.1016/0304-3800(93)90106-3
Qadir, M., Boers, T. M., Schubert, S., Ghafoor, A., and Murtaza, G. (2003). Agricultural water management in water-starved countries: challenges and opportunities. Agric. Water Manage. 62, 165–185. doi: 10.1016/S0378-3774(03)00146-X
Qin, S., Li, S., Kang, S., Du, T., Tong, L., and Ding, R. (2016). Can the drip irrigation under film mulch reduce crop evapotranspiration and save water under the sufficient irrigation condition? Agric. Water Manage. 177, 128–137. doi: 10.1016/j.agwat.2016.06.022
Scott, R. L. (2010). Using watershed water balance to evaluate the accuracy of eddy covariance evaporation measurements for three semiarid ecosystems. Agric. Forest Meteorol. 150, 219–225. doi: 10.1016/j.agrformet.2009.11.002
Shao, L., Zhang, X., Chen, S., Sun, H., and Wang, Z. (2009). Effects of irrigation frequency under limited irrigation on root water uptake, yield and water use efficiency of winter wheat. Irrigat. Drainage 58, 393–405. doi: 10.1002/ird.442
Shao, L., Zhang, X., Hideki, A., Tsuji, W., and Chen, S. (2010). Effects of defoliation on grain yield and water use of winter wheat. J. Agric. Sci. 148, 191–204. doi: 10.1017/S0021859609990542
Shen, Y., Kondoh, A., Tang, C., Zhang, Y., Chen, J., Li, W., et al. (2002). Measurement and analysis of evapotranspiration and surface conductance of a wheat canopy. Hydrol. Process. 16, 2173–2187. doi: 10.1002/hyp.1149
Shen, Y., Lei, H., Yang, D., and Kanae, S. (2011). “Effects of agricultural activities on nitrate contamination of groundwater in a Yellow River irrigated region,” in Water Quality: Current Trends and Expected Climate Change Impacts (Melbourne: IAHS Publ.), 73–80.
Shen, Y., Zhang, Y., Kondoh, A., Tang, C., Chen, J., Xiao, J., et al. (2004). Seasonal variation of energy partitioning in irrigated lands. Hydrol. Process. 18, 2223–2234. doi: 10.1002/hyp.5535
Shen, Y., Zhang, Y. R., Scanlon, B., Lei, H., Yang, D., and Yang, F. (2013). Energy/water budgets and productivity of the typical croplands irrigated with groundwater and surface water in the North China Plain. Agric. Forest Meteorol. 181, 133–142. doi: 10.1016/j.agrformet.2013.07.013
Singh, A. K., Tripathy, R., and Chopra, U. K. (2008). Evaluation of CERES-Wheat and CropSyst models for water–nitrogen interactions in wheat crop. Agric. Water Manage. 95, 776–786. doi: 10.1016/j.agwat.2008.02.006
Stockle, C. O., Cabelguenne, M., and Debaeke, P. (1997). Comparison of CropSyst performance for water management in southwestern France using submodels of different levels of complexity. Eur. J. Agron. 7, 89–98. doi: 10.1016/S1161-0301(97)00033-6
Stöckle, C. O., Donatelli, M., and Nelson, R. (2003). CropSyst, a cropping systems simulation model. Eur. J. Agron. 18, 289–307. doi: 10.1016/S1161-0301(02)00109-0
Stockle, C. O., Martin, S. A., and Campbell, G. S. (1994). CropSyst, a cropping systems simulation model: water/nitrogen budgets and crop yield. Agric. Syst. 46, 335–359. doi: 10.1016/0308-521X(94)90006-2
Sun, H., Shen, Y., Yu, Q., Flerchinger, G. N., Zhang, Y., Liu, C., et al. (2010). Effect of precipitation change on water balance and WUE of the winter wheat–summer maize rotation in the North China Plain. Agric. Water Manage. 97, 1139–1145. doi: 10.1016/j.agwat.2009.06.004
Sun, H. Y., Liu, C. M., Zhang, X. Y., Shen, Y. J., and Zhang, Y. Q. (2006). Effects of irrigation on water balance, yield and WUE of winter wheat in the North China Plain. Agric. Water Manage. 85, 211–218. doi: 10.1016/j.agwat.2006.04.008
Sun, H., Zhang, X., Chen, S., Pei, D., and Liu, C. (2007). Effects of harvest and sowing time on the performance of the rotation of winter wheat–summer maize in the North China Plain. Ind. Crops Prod. 25, 239–247. doi: 10.1016/j.indcrop.2006.12.003
Tao, F., Yokozawa, M., Hayashi, Y., and Lin, E. (2003). Future climate change, the agricultural water cycle, and agricultural production in China. Agric. Ecosyst. Environ. 95, 203–215. doi: 10.1016/S0167-8809(02)00093-2
Tao, F., Yokozawa, M., Hayashi, Y., and Lin, E. (2005). A perspective on water resources in china: interactions between climate change and soil degradation. Clim. Change 68, 169–197. doi: 10.1007/s10584-005-6013-1
Varley, R. C. G. (2005). “The world bank's assistance of water resources managementin china,” in World Bank Press (Washington, DC: World Bank). Available online at: https://openknowledge.worldbank.org/handle/10986/20207
Todd, R. W., Evett, S. R., and Howell, T. A. (2000). The Bowen ratio-energy balance method for estimating latent heat flux of irrigated alfalfa evaluated in a semi-arid, advective environment. Agric. Forest Meteorol. 103, 335–348. doi: 10.1016/S0168-1923(00)00139-8
Wang, H., Liu, C., and Zhang, L. (2002). Water-saving agriculture in China: an overview. Adv. Agron. 75, 135–171. doi: 10.1016/S0065-2113(02)75004-9
Wang, Z. M., Zhang, B., Li, X. Y., Song, K. S., Liu, D. W., and Zhang, S. Q. (2006). Using CropSyst to simulate spring wheat growth in black soil zone of Northeast China1 1project supported by the National Natural Science Foundation of China (No. 40401003), the Knowledge Innovation Program of the Chinese Academy of Sciences (No. KZCX3-SW-356), and the Key Laboratory of Ecological Restoration and Ecosystem Management of Jilin Province (No. DS2004–03). Pedosphere 16, 354–361. doi: 10.1016/S1002-0160(06)60063-5
Willmott, C. J. (1982). Some comments on the evaluation of model performance. Bull. Am. Meteorol. Soc. 63, 1309–1313. doi: 10.1175/1520-0477(1982)063<1309:SCOTEO>2.0.CO;2
Wilson, K. B., Hanson, P. J., Mulholland, P. J., Baldocchi, D. D., and Wullschleger, S. D. (2001). A comparison of methods for determining forest evapotranspiration and its components: sap-flow, soil water budget, eddy covariance and catchment water balance. Agric. Forest Meteorol. 106, 153–168. doi: 10.1016/S0168-1923(00)00199-4
Yang, Y. H., Watanabe, M., Sakura, Y., Tang, C. Y., and Hayashi, S. (2002). Groundwater-table and recharge changes in the Piedmont region of Taihang Mountain in Gaocheng City and its relation to agricultural water use. Water SA 28, 171–178. doi: 10.4314/wsa.v28i2.4883
Yuanxi, J. (2007 September 28). Beneath Booming Cities, China's Future is Drying Up. New York Times. Available online at: http://www.nytimes.com/2007/09/28/world/asia/28water.html.
Yu, Q., Saseendran, S. A., Ma, L., Flerchinger, G. N., Green, T. R., and Ahuja, L. R. (2006). Modeling a wheat–maize double cropping system in China using two plant growth modules in RZWQM. Agric. Syst. 89, 457–477. doi: 10.1016/j.agsy.2005.10.009
Zhang, X., Qin, W., Chen, S., Shao, L., and Sun, H. (2017). Responses of yield and WUE of winter wheat to water stress during the past three decades—a case study in the North China Plain. Agric. Water Manage. 179, 47–54. doi: 10.1016/j.agwat.2016.05.004
Zhang, Y., Liu, C., Shen, Y., Kondoh, A., Tang, C., Tanaka, T., et al. (2002). Measurement of evapotranspiration in a winter wheat field. Hydrol. Process. 16, 2805–2817. doi: 10.1002/hyp.1072
Zhang, Y., Shen, Y., Sun, H., and Gates, J. B. (2011). Evapotranspiration and its partitioning in an irrigated winter wheat field: a combined isotopic and micrometeorologic approach. J. Hydrol. 408, 203–211. doi: 10.1016/j.jhydrol.2011.07.036
Zhou, L., and Zhou, G. (2009). Measurement and modelling of evapotranspiration over a reed (Phragmites australis) marsh in Northeast China. J. Hydrol. 372, 41–47. doi: 10.1016/j.jhydrol.2009.03.033
Keywords: North China Plain, CropSyst, evaporation losses, crop rotation, model evaluation
Citation: Umair M, Shen Y, Qi Y, Zhang Y, Ahmad A, Pei H and Liu M (2017) Evaluation of the CropSyst Model during Wheat-Maize Rotations on the North China Plain for Identifying Soil Evaporation Losses. Front. Plant Sci. 8:1667. doi: 10.3389/fpls.2017.01667
Received: 18 April 2017; Accepted: 11 September 2017;
Published: 29 September 2017.
Edited by:
Peter Thorburn, Commonwealth Scientific and Industrial Research Organisation (CSIRO), AustraliaReviewed by:
Mukhtar Ahmed, Pir Mehr Ali Shah Arid Agriculture University, PakistanIlias Travlos, Agricultural University of Athens, Greece
Copyright © 2017 Umair, Shen, Qi, Zhang, Ahmad, Pei and Liu. This is an open-access article distributed under the terms of the Creative Commons Attribution License (CC BY). The use, distribution or reproduction in other forums is permitted, provided the original author(s) or licensor are credited and that the original publication in this journal is cited, in accordance with accepted academic practice. No use, distribution or reproduction is permitted which does not comply with these terms.
*Correspondence: Muhammad Umair, umair@sjziam.ac.cn; umair708@hotmail.com
Yanjun Shen, yjshen@sjziam.ac.cn