 Xiaojiao Yu1,2
 Shengfu Zhong1,2Huai Yang1,2Chen Chen2Wei Chen1,2,3Hao Yang1,2,3Ju Guan1,2Peng Fu1,2Feiquan Tan1
 Tianheng Ren1,2Jinliang Shen4Min Zhang2
 Peigao Luo1,2*
- 1Provincial Key Laboratory for Plant Genetics and Breeding, Chengdu, China
- 2College of Agronomy, Sichuan Agricultural University, Chengdu, China
- 3Sichuan Akebia trifoliata Biotechnology Co., Ltd., Chengdu, China
- 4College of Forestry, Sichuan Agricultural University, Chengdu, China
Akebia trifoliata is an important multiuse perennial plant that often suffers attacks from various pathogens due to its long growth cycle, seriously affecting its commercial value. The absence of research on the resistance (R) genes of A. trifoliata has greatly limited progress in the breeding of resistant varieties. Genes encoding proteins containing nucleotide binding sites (NBSs) and C-terminal leucine-rich repeats (LRRs), the largest family of plant resistance (R) genes, are vital for plant disease resistance. A comprehensive genome-wide analysis showed that there were only 73 NBS genes in the A. trifoliata genome, including three main subfamilies (50 coiled coil (CC)-NBS-LRR (CNL), 19 Toll/interleukin-1 receptor (TIR)-NBS-LRR (TNL) and four resistance to powdery mildew8 (RPW8)-NBS-LRR (RNL) genes). Additionally, 64 mapped NBS candidates were unevenly distributed on 14 chromosomes, most of which were assigned to the chromosome ends; 41 of these genes were located in clusters, and the remaining 23 genes were singletons. Both the CNLs and TNLs were further divided into four subgroups, and the CNLs had fewer exons than the TNLs. Structurally, all eight previously reported conserved motifs were identified in the NBS domains, and both their order and their amino acid sequences exhibited high conservation. Evolutionarily, tandem and dispersed duplications were shown to be the two main forces responsible for NBS expansion, producing 33 and 29 genes, respectively. A transcriptome analysis of three fruit tissues at four developmental stages showed that NBS genes were generally expressed at low levels, while a few of these genes showed relatively high expression during later development in rind tissues. Overall, this research is the first to identify and characterize A. trifoliata NBS genes and is valuable for both the development of new resistant cultivars and the study of molecular mechanisms of resistance.
Introduction
Akebia trifoliata (Thunb.) Koidz, belonging to the family Lardizabalaceae (Liu et al., 2007), presents great potential for use as a fruit and oil crop and a medicinal and ornamental plant (Li L. et al., 2010; Chen et al., 2017). After extensive artificial cultivation, wild plants will inevitably suffer from various diseases, such as kiwifruit bacterial canker (Scortichini et al., 2012), sweet potato root rot disease (Ma et al., 2020) and apple fruit anthracnose (Zhou and Zhou, 2017); this is especially true for perennials, such as black cottonwood, which often suffer attacks from various pathogens or herbivores before reaching the reproductive stage because of their relatively long life cycle (Tuskan et al., 2006). Likewise, A. trifoliata is a typical perennial that is attacked by various pathogens, such as Alternaria tenuissima, causing leaf spot (Ye et al., 2013; Zhang et al., 2015), Colletotrichum gloeosporioides, causing leaf anthracnose (Cheng et al., 2020; Pan et al., 2020), Nigrospora sphaerica, causing fruit shrinkage (Hong et al., 2021), and Oidium subgenus Pseudoidium, causing powdery mildew (Garibaldi et al., 2004), which has resulted in large yield losses and significantly reduced the economic value of the species.
During the arms race between hosts and their pathogens, great numbers of variations arise in pathogens due to their short growth cycle and simple genomic sequences, requiring plants (especially perennials) to evolve a set of sophisticated and effective defense systems to combat them (Tuskan et al., 2006). Beyond the first line of defense against pathogens imposed by the thickened cell wall, plants usually build the second defense system by producing resistance proteins, mainly encoded by NBS genes, to resist invading pathogens after the failure of the cell wall defense system (Andersen et al., 2018). By directly or indirectly recognizing pathogen-secreted effectors, these proteins confer resistance to various pathogens, including fungi, bacteria and viruses, by initiating a series of defense responses, such as hypersensitive responses, activating signaling pathways and consequently inhibiting the plant infection process (Andersen et al., 2018).
The NBS gene family, encoding proteins containing nucleotide binding sites (NBSs) and C-terminal leucine-rich repeats (LRRs), is the largest family of plant resistance (R) genes, accounting for over 60% of detected and cloned R genes in all plant species (Kourelis and van der Hoorn, 2018). The NBS domain can bind ATP/GTP, resulting in phosphorylation to transmit disease resistance signals downstream, which plays a key role in combating almost all pathogens (Bent, 1996). According to the N-terminal structure of NBS genes, scientists have commonly divided these genes into three subfamilies: (TIR)-NBS-LRR (TNL) genes, containing TIR domains with homology to Toll/interleukin-1 receptors, and (CC)-NBS-LRR (CNL) and (RPW8)-NBS-LRR (RNL), characterized by CC and RPW8 domains, respectively (Xiao et al., 2001; Collier and Moffett, 2009; Wang et al., 2013). The RNL clade is composed of two different lineages: the Nicotiana benthamiana N-required gene 1 (NRG1) and Arabidopsis activated disease resistance gene 1 (ADR1) lineages. To clearly indicate the absence of the TIR domain compared with TNLs, we refer to CNLs and RNLs as the non-TNL (nTNL) subclass. Generally, TNL and CNL proteins are mainly responsible for recognizing specific pathogens, while RNL proteins may play an auxiliary role in downstream defense signal transduction.
With the completion of the sequencing of many plant genomes in succession, genome-wide analysis has increasingly become an important tool for studying the genetic diversity and evolution of NBS resistance genes (Meyers et al., 2003; Xue et al., 2019; Zhang et al., 2020). The number of NBS genes in a plant genome ranges from dozens to more than 2,000 (Shao et al., 2019; Andersen et al., 2020), leading to the discussion of whether the NBS gene number is related to genome size and, if so, whether the relationship is positive or not (Liu et al., 2014; Zhang et al., 2016; Goyal et al., 2020). In addition, the composition of the three subclasses is usually not the same or is even highly lopsided. For instance, Dioscorea rotundata possesses 166 CNLs, only one RNL and no TNLs (Zhang et al., 2020), and Brassica napus contains 461 TNLs, 180 CNLs and no RNLs (Alamery et al., 2018), suggesting a major discrepancy between the different subclasses. The differences in the composition of NBS genes are considered to be responsible for the diversity and specificity of resistance to various pathogens (Jupe et al., 2012). NBS genes generally arise via various types of duplications, mainly including tandem and dispersed duplications, which have a critical influence on the different arrangements of NBS genes, such as the occurrence of singletons or clustered loci on chromosomes (Meyers et al., 2003; Leister, 2004).
The exploration of the characteristics of NBS genes usually involves phylogenetic and structural analyses in diverse plant species, which has greatly accelerated the identification and utilization of functional R genes. Although there has been no research progress on A. trifoliata NBS resistance genes to date, the available genome and transcriptome data of A. trifoliata not only enrich the genomic resources available for this species but also create favorable conditions for the systematic study of NBS genes at the genomic level. In this study, we comprehensively illustrated the NBS gene profile of A. trifoliata using multiple analysis tools. A collection of R gene resources valuable in production were screened, providing meaningful data for further identifying functional R genes and accelerating the future breeding of resistant cultivars of A. trifoliata.
Materials and Methods
Data Used in This Study
The A. trifoliata genome sequence, annotation files and RNA-seq data (accession IDs: SAMN16551931--33, young stage of rind, flesh and seed; SAMN16551934--36, enlargement stage; SAMN16551937--39, coloring stage; SAMN16551940--42, mature stage) were downloaded from the National Center for Biotechnology Information (NCBI) database under BioProjectID PRJNA671772,1 which was assembled and uploaded by our group. Reference genes with known resistance functions were also retrieved from NCBI protein database, accessions as listed in Supplementary Table 4.
Identification and Classification of NBS Genes
To identify A. trifoliata homologs of plant NBS genes, we first performed a BLASTP analysis in NCBI2 to search NBS proteins with the NB-ARC domain query (accession: PF00931), and then the protein sequences were input to a hidden Markov model (HMM)3 for scanning using the HMM profile of the NB-ARC domain as a query. Both of the E-values were set as 1.0. We further merged all of the candidate genes obtained from the above two databases and removed the redundant genes. Finally, we analyzed the non-redundant genes against the Pfam database4 to further verify the presence of the NBS domain according to an E-value of 10––4 and to eliminate the genes without a conserved NBS domain. To classify the NBS genes, all of the identified NBS sequences were further analyzed using the NCBI Conserved Domain Database5 to determine the existence of TIR (accession: PF01582), RPW8 (accession: PF05659) and LRR (accession: PF08191) domains, whereas CC domains were identified by using Coiledcoil6 with a threshold value of 0.5 because these domains cannot always be identified by Pfam searches (Lozano et al., 2015).
Gene Structure and Conserved Motif Analysis
The general feature format (GFF3) file of the A. trifoliata genomic annotation file was used to retrieve the NBS gene structure and exon information. For further analysis of the conserved domain composition of the NBS gene family, we predicted the conserved motifs in the NBS domains with the MEME Suite7. The motif count was set to 10 with motif width lengths ranging from 6 to 50 amino acids, and all other parameters were set to the defaults as previously described (Nepal et al., 2017). Then, TBtools8 was used to visualize the positions of motif and exon structures in NBS genes. The bivariate correlations between the characteristics and multiple comparisons thereof in the three subfamilies were performed using SPSS software (Dudley et al., 2004).
Chromosomal Distribution of NBS Genes
The A. trifoliata genome was assembled into 16 chromosomes, and the GFF3 file was used to investigate the chromosome-wide distribution of NBS candidates and to map chromosomal physical positions. To identify the numbers of NBS gene clusters on chromosomes, we utilized sliding window analysis assuming a window size of 250 kb (Ameline-Torregrosa et al., 2008).
Phylogenetic and Ka/Ks Analysis
To explore the underlying evolutionary history among NBS family members, ClustalW was used to perform multiple sequence alignments among all protein sequences with conserved NBS domains. Then, the result was manually corrected by removing gaps and sequences that were too short or less similar in MEGA X (Kumar et al., 2018) to reduce “noisy characters.” We constructed a phylogenetic tree using IQ-TREE with the maximum likelihood method (Nguyen et al., 2015), selected the best-fit model using ModelFinder (Kalyaanamoorthy et al., 2017), and evaluated branch support values via UFBoot2 tests (Hoang et al., 2018). A TNL tree consisting of 19 identified TNLs of A. trifoliata and 19 reference TNLs from other species and a CNL tree including 48 CNLs and four RNLs of A. trifoliata and 38 reference CNLs and two reference RNLs from other species (Supplementary Table 4) were reconstructed. All trees were rerooted using the NBS domain of human apoptotic protease-activating factor-1 (APAF-1), and the results were visualized with Figtree.9 To determine whether the A. trifoliata NBS genes were subject to selection pressure, the nucleotide coding sequences (CDSs) of each subfamily were aligned by using MEGA X. Then, KaKs_Calculator 2.0 was used to calculate the non-synonymous substitution to synonymous substitution (Ka/Ks) ratio for each orthologous NBS gene pair of A. triloliata genome (Wang et al., 2010), and ratios of > 1, = 1 and < 1 indicated positive selection, neutral evolution and purifying selection, respectively (Hurst, 2002).
Duplication Analysis of NBS Genes
For synteny analysis, pairwise all-against-all BLAST searches were applied to the A. trifoliata NBS proteins (Xue et al., 2019). The results and GFF3 files were then submitted to MCScanX for gene duplication type detection (Wang et al., 2012).
Expression Analysis of NBS Genes of A. trifoliata in Various Fruit Tissues
To analyze the expression pattern of A. trifoliata NBS genes in different tissues (flesh, rind and seeds) at different developmental stages (young, enlargement, coloring and maturity), BLAST in HISAT2 software was first used to align the RNA-seq data with the A. trifoliata genome under default settings. Then, we used SAMtools to compress the results into BAM format and extracted the FPKM values representing the expression of each gene in all samples according to previously described methods (Li et al., 2009; Kim et al., 2019). Finally, to display NBS gene expression levels, the transcriptome data were submitted to TBtools to generate a heatmap (Chen et al., 2020).
Results
Identification and Classification of NBS Genes in the A. trifoliata Genome
A total of 73 non-redundant NBS genes, accounting for only 0.30% of the 24,138 annotated genes, were identified in the A. trifoliata genome (see details in “Materials and Methods”). The percentage of NBS genes in A. trifoliata was slightly higher than those reported in Carica papaya and Setaria italica (0.22 and 0.27%, respectively) (Porter et al., 2009; Zhao et al., 2016), while it was obviously lower than those in most other plant species (Table 1). The 73 NBS protein sequences were classified into three groups (50 CNLs, 19 TNLs, and 4 RNLs) and nine subgroups according to the existence of CC, TIR and RPW8 domains, which are summarized in Table 2 and Supplementary Table 1. The CNL group was further divided into four subgroups: 31 CNLs containing a complete set of CC, NBS and LRR domains, 13 CNCCs lacking the LRR domain, four NLCCs lacking the CC domain, and two NCCs lacking both CC and LRR domains. Likewise, the TNL group consisted of five TNLs with the complete set of TIR, NBS, and LRR domains, 10 NLTIRs lacking the TIR domain, one TNTIR lacking the LRR domain and three NTIRs lacking both TIR and LRR domains. In contrast, all four RNLs exhibited the complete set of RPW8, NBS and LRR domains and could not be further subdivided. The results showed that there were abundant variations in the domains of A. trifoliata NBS genes, although the number of NBS genes was lower than in many species, with exceptions including C. papaya and S. italica.
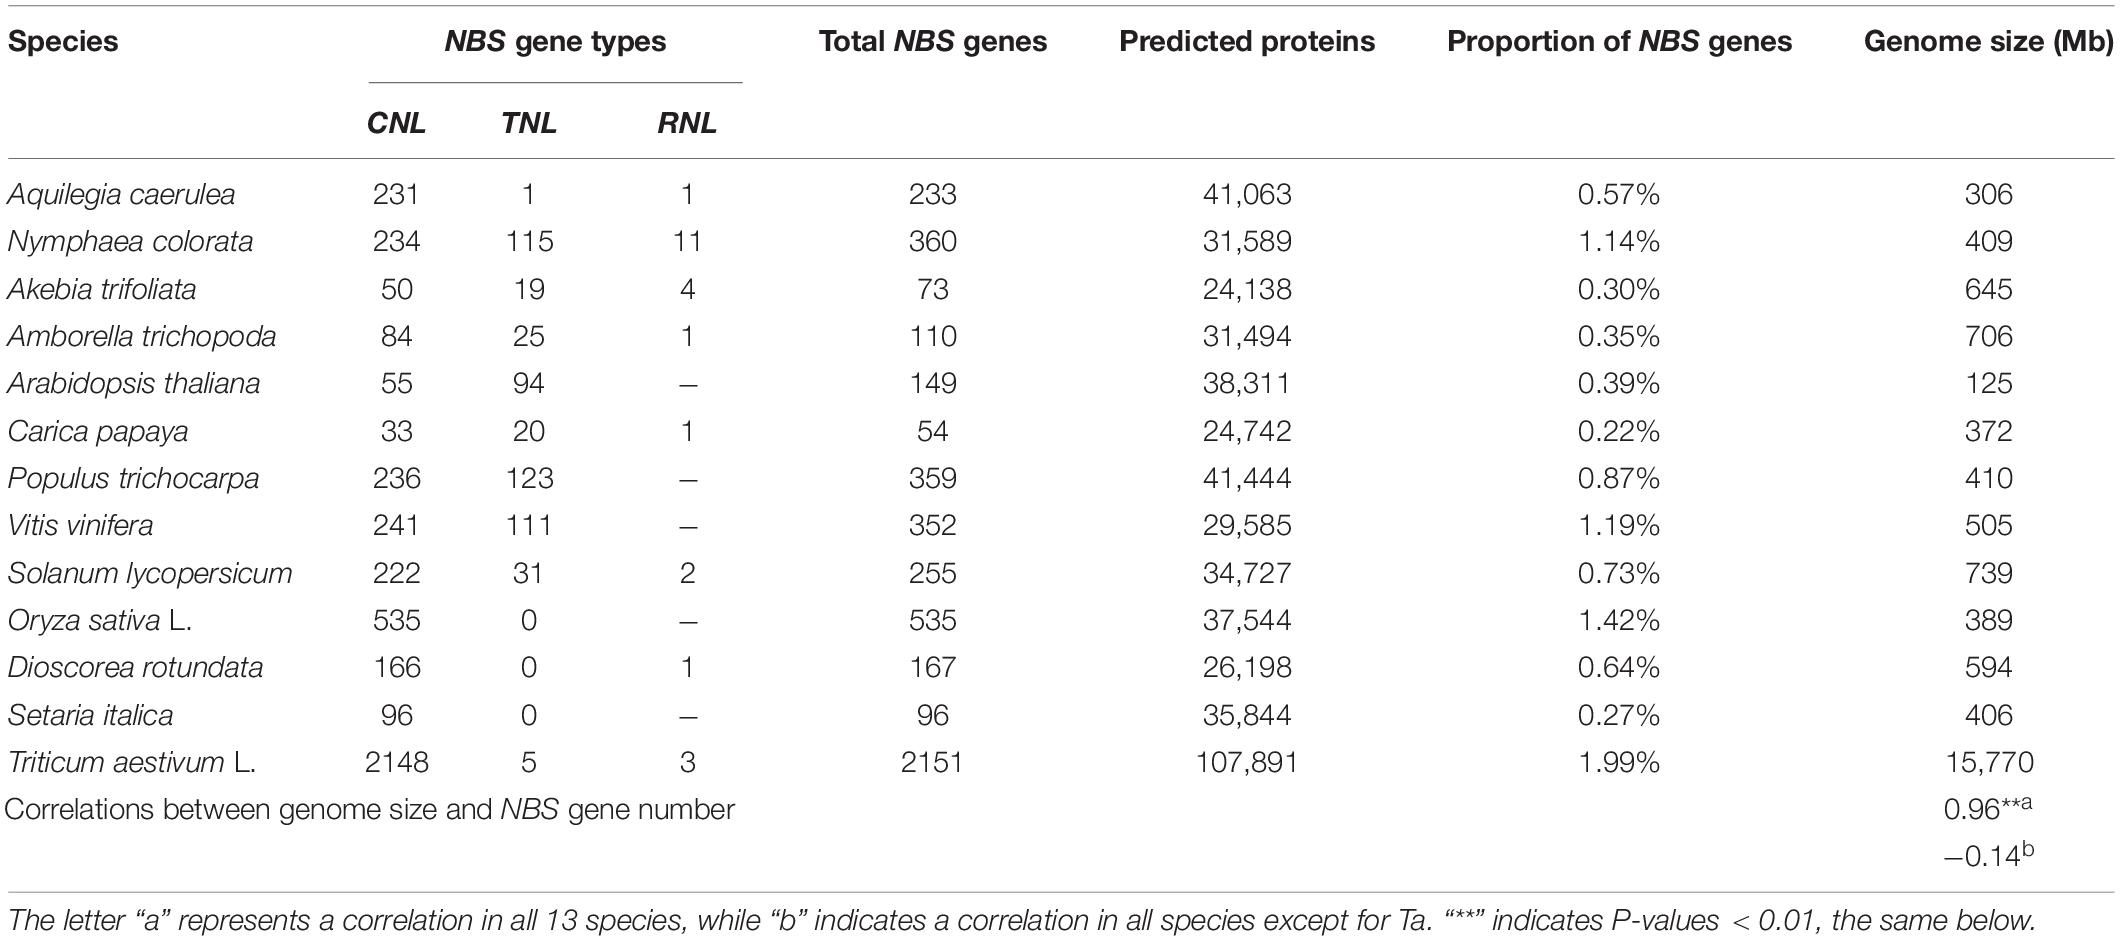
Table 1. The numbers of predicted NBS genes in sequenced plant genomes.
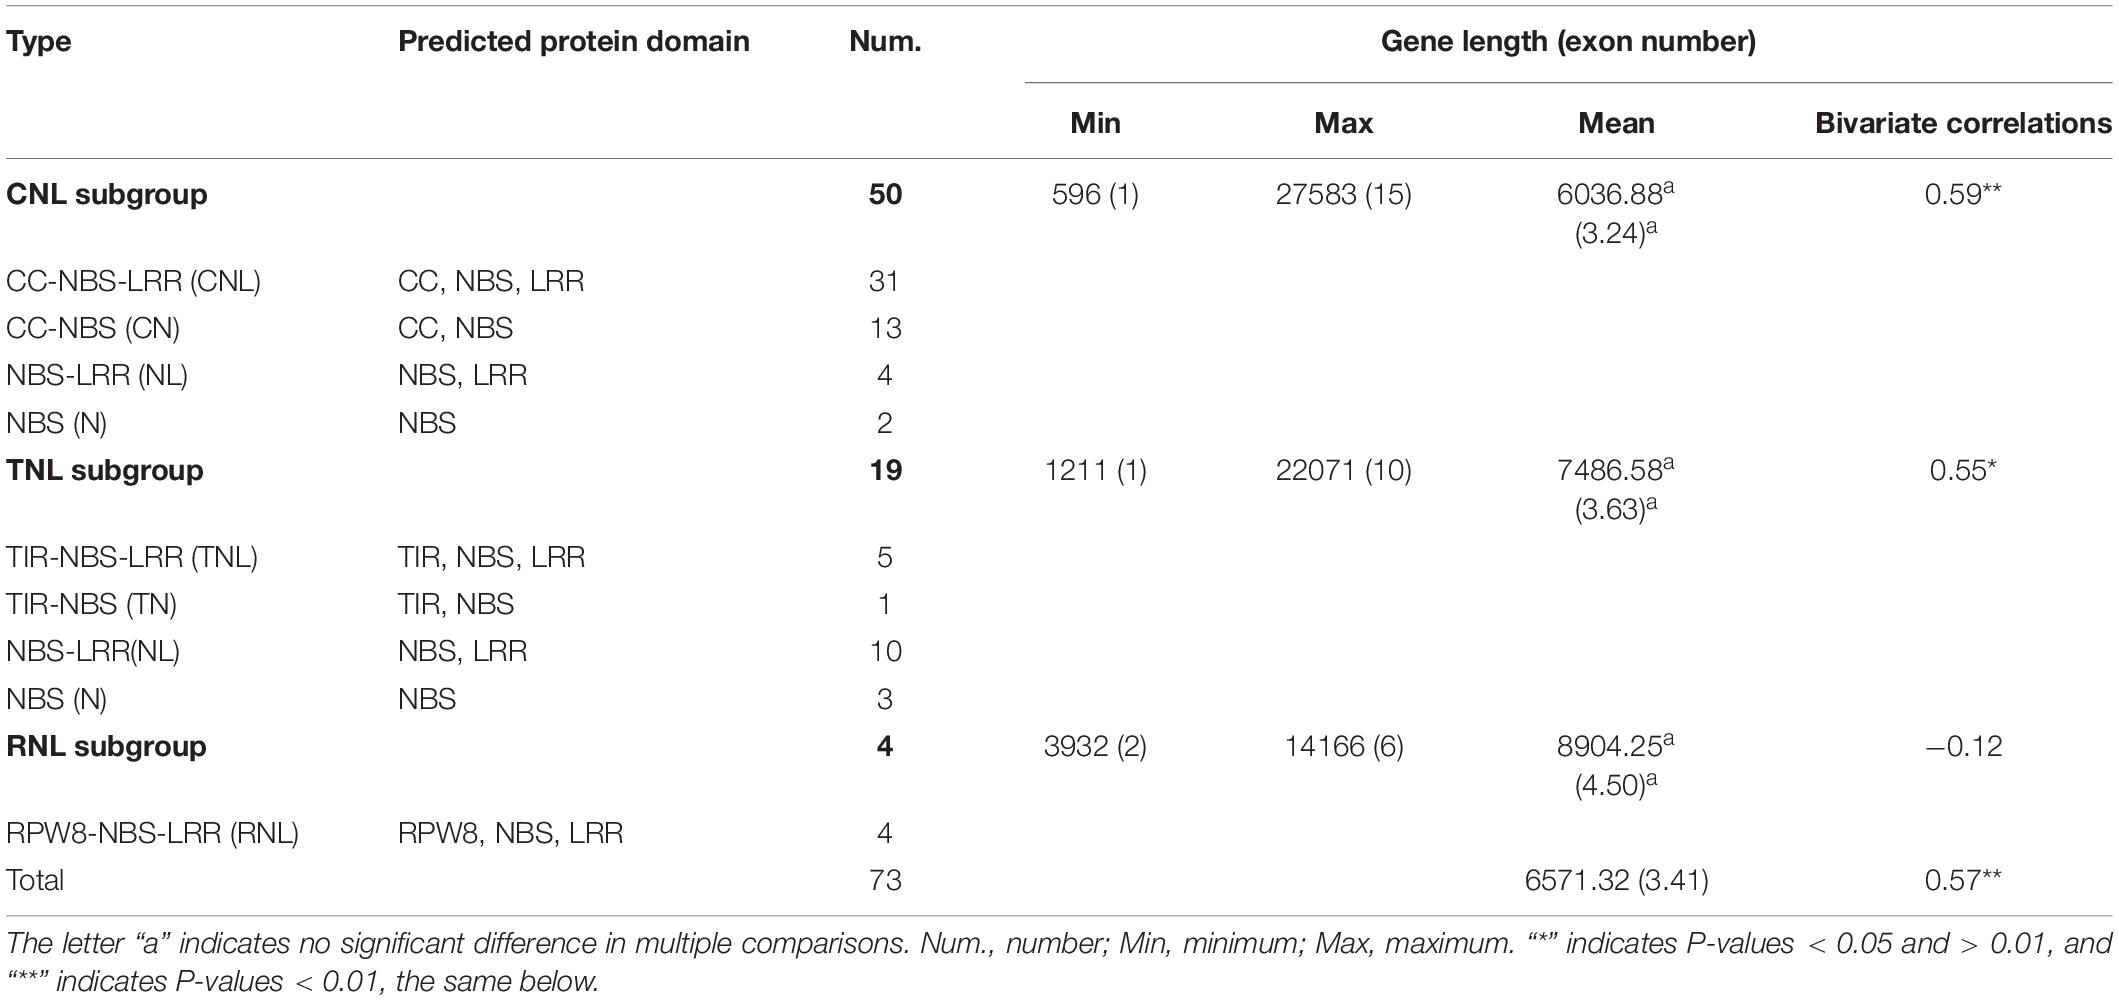
Table 2. Groups of NBS resistance genes in the A. trifoliata genome.
Gene Structure and Conserved Motif Analysis
To outline the difference in gene structure between the different NBS subfamilies within A. trifoliata, the comparison analysis of exon number, gene length and both composition and order of the conserved motif was further executed. The results show that the exon number of the 73 NBS genes ranged from 1 to 15, with a total of 249 exons and a mean of 3.41 exons (Figure 1 and Supplementary Table 1). Among these genes, 14 (9 CNLs and 5 TNLs) had only one exon, and the number of genes with more than eight exons was 5. Although AtNBS25 (coiled coil (CC)-NBS-LRR (CNL)) had the most exons, with 15, 36 (72.0%) of the 50 CNLs had fewer than 3 exons, while 11 (57.9%) of the 19 TNLs had more than 3 exons. We found that both the mean exon numbers and gene length of the RNLs (4.50 and 8904.25 bp) were greater than those of the CNLs (3.24 and 6036.88 bp) and TNLs (3.63 and 7486.58 bp), although there was no significant relationship between exon number and gene length found in multiple comparisons among the three subfamilies at the P = 0.05 level (Table 2). Further analysis showed that the relationship between exon number and gene length was significant at the P = 0.05 level among the 73 NBS genes (r = 0.57), the 50 CNLs (r = 0.59) and the 19 TNLs (r = 0.55), while it was not significant for the 4 RNLs (r = −0.12) (Table 2), which meant that the exon number per gene would be positively related to gene length to some degree.
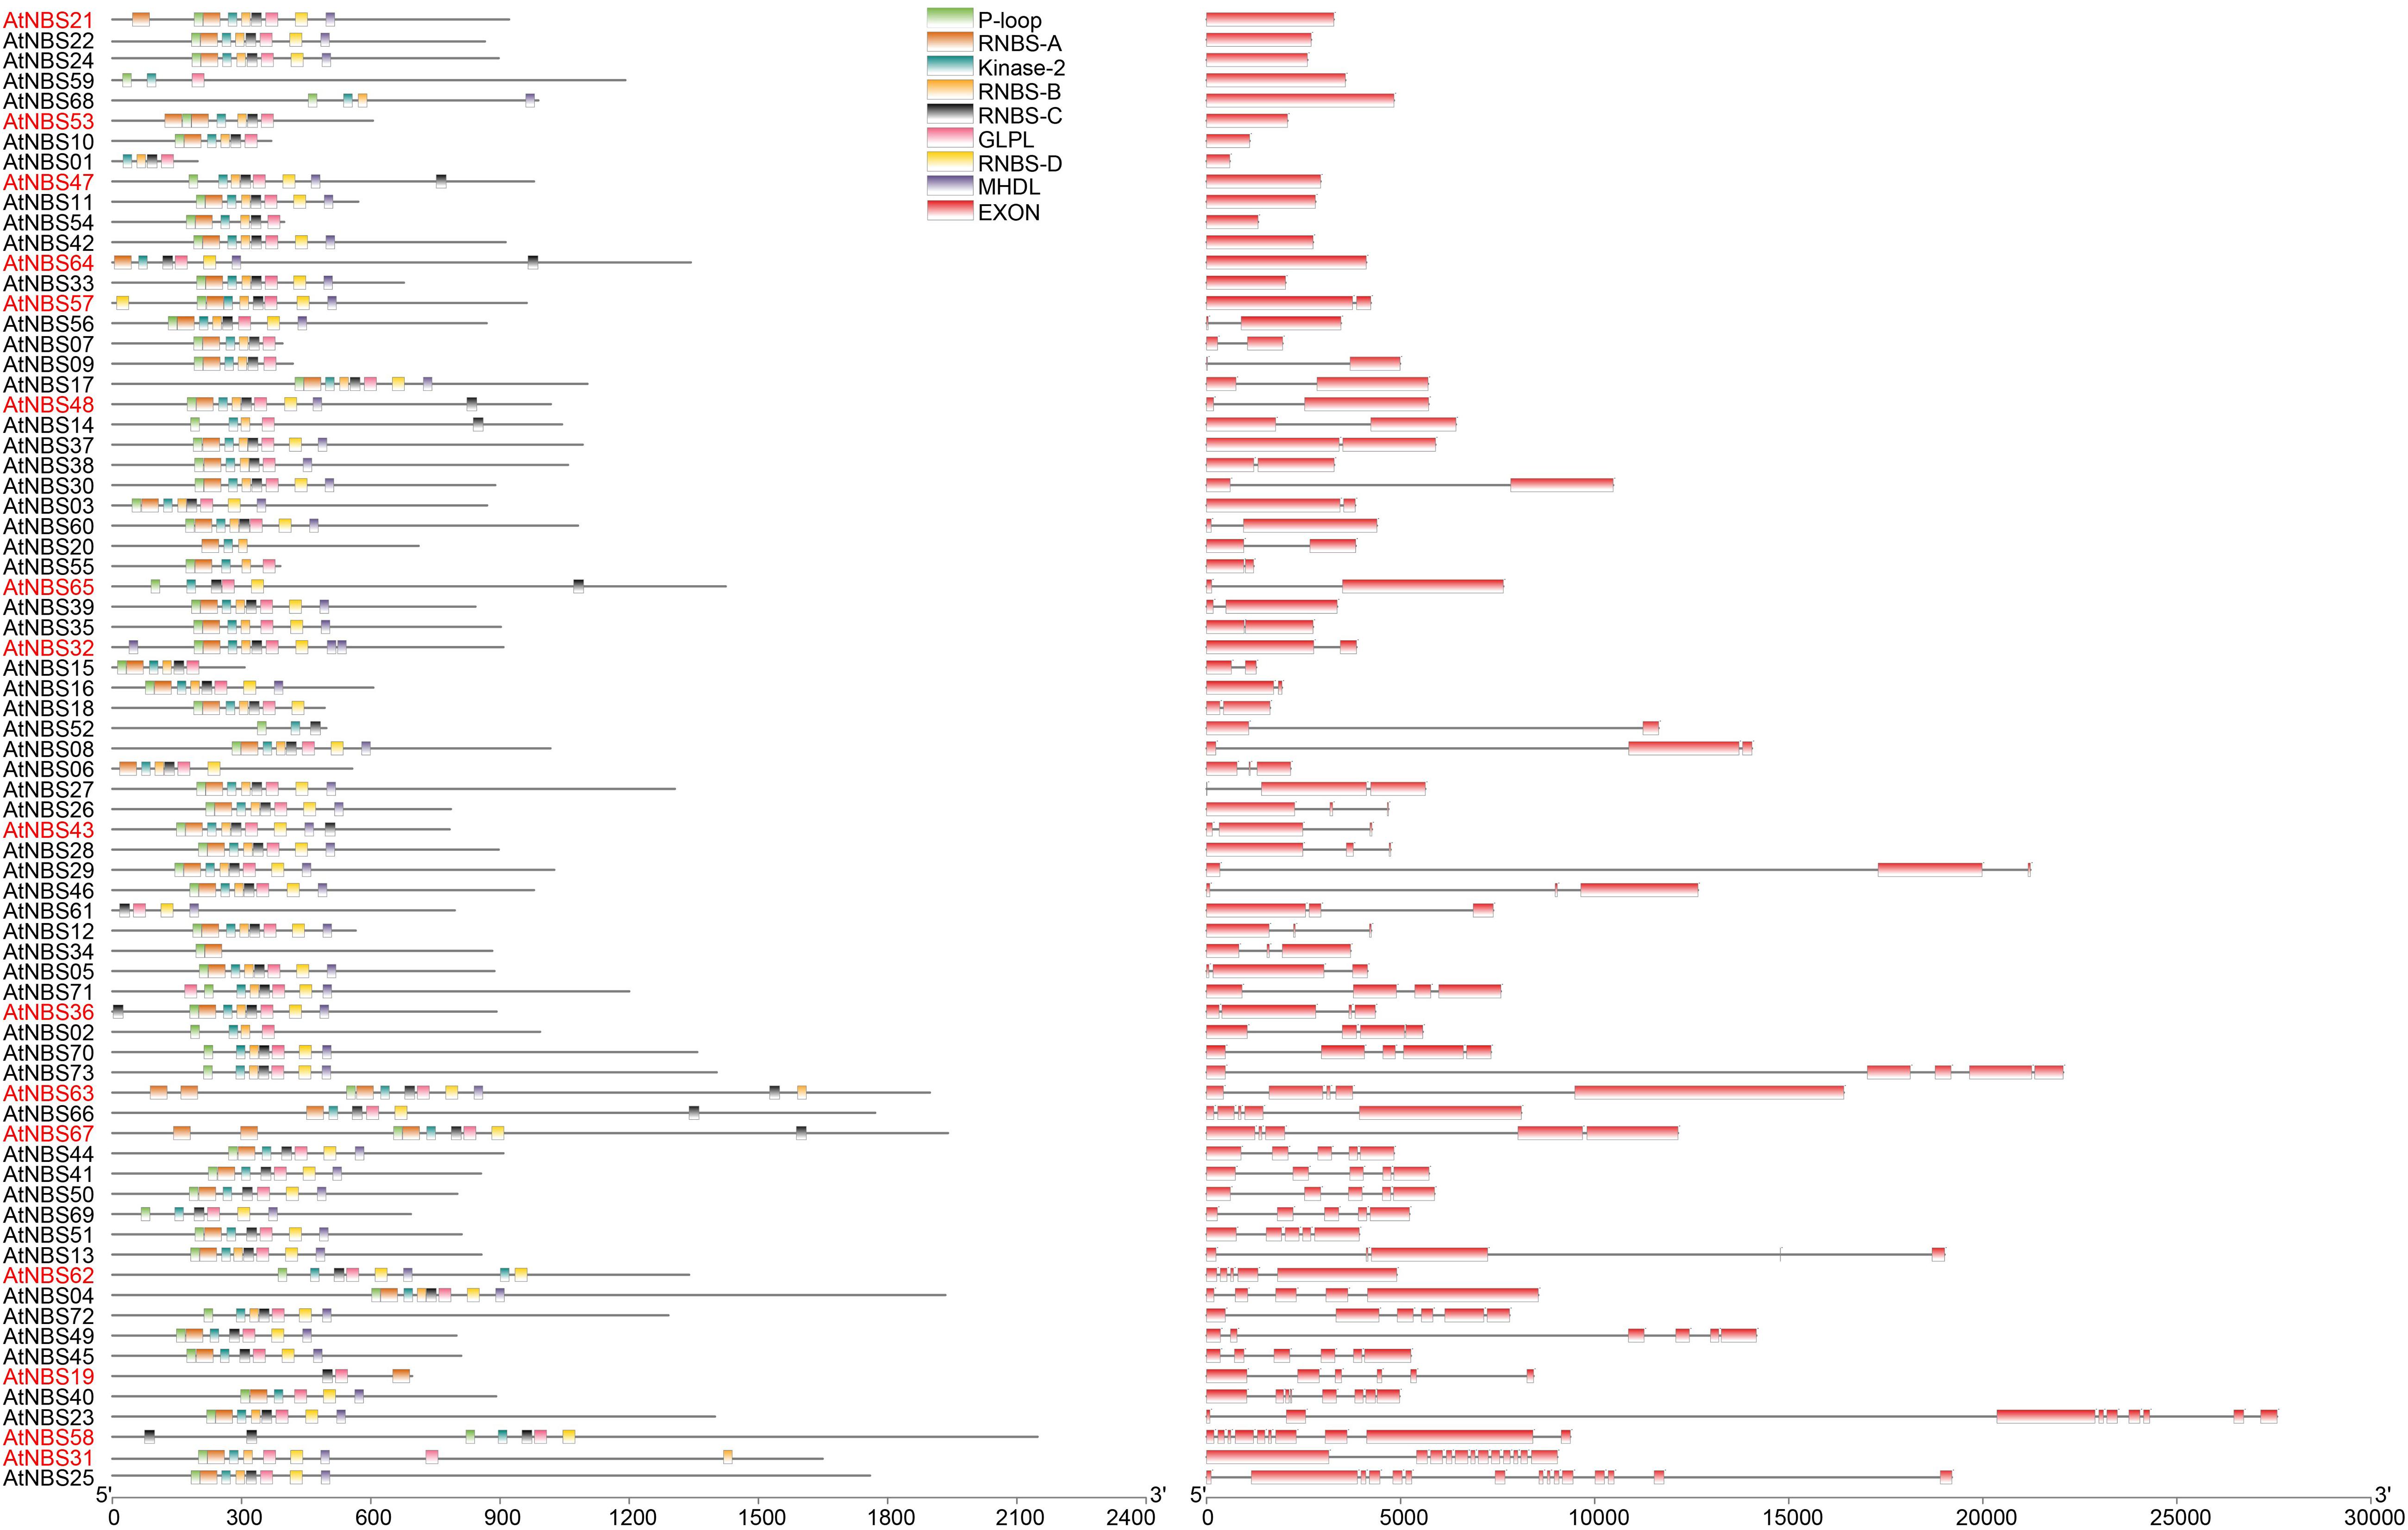
Figure 1. Gene structure and motif analysis of predicted NBS genes. Conserved motif analysis in the NBS domain was performed using the MEME Suite based on protein sequences. In total, eight conserved motifs were identified, and each motif is depicted with boxes of different colors. Their logos are shown in Supplementary Table 2. A gene name in red font indicates that the gene shows differences in motif order in the NBS domain. The intron/exon organization of NBS genes is represented here, and exon numbers increase gradually from the top to bottom; red boxes depicting exons are separated by introns with thin lines.
MEME analysis showed that eight conserved motifs (P-loop, RNBS-A, Kinase-2, RNBS-B, RNBS-C, GLPL, RNBS-D, and MHDL, with the common arrangement order) that have been reported in other species, such as Arabidopsis (Meyers et al., 2003; Zhou et al., 2004), existed in various NBS genes of the A. trifoliata genome (Figure 1 and Supplementary Table 2), among which the P-loop (distributed in 66 genes), GLPL (in 68 genes) and kinase-2 (in 70 genes) were the most common motifs. While 57 of the 73 NBS genes showing the conserved order of the eight motifs, the remaining 16 genes showed a slight change in the motif order, among which 14 genes exhibited the conserved core motif order flanked by single or multiple repeated motifs on one or two sides and only 2 genes (AtNBS19 and AtNBS63) showed a change in the actual core order (Figure 1 and Supplementary Table 2). In addition, we found that the last residue of the kinase-2 motif was W (tryptophan) in 48 (88.9%) of the 54 non-TNL genes, while it was D (aspartate) in 13 (68.4%) of the 19 TNLs (Supplementary Table 3). Thus, it was inferred that the NBS gene type could be distinguished by the last conserved codon of the kinase-2 motif.
Chromosomal Distribution of NBS Genes in A. trifoliata
The physical locations of the 73 identified NBS genes were mapped on the 16 assembled chromosomes of the A. trifoliata genome by using TBtools. A total of 64 mapped genes (44 CNLs, 17 TNLs, and 3 RNLs) were unevenly distributed on 14 of the 16 chromosomes and mostly mapped to the regions near chromosome ends (Figure 2), whereas the remaining nine genes were excluded due to their locations in unassembled contigs. Chromosomes 1, 3, 11, and 13 contained more than seven NBS genes, while chromosomes 5, 14, 15, and 16 contained only one NBS gene (Figure 2). In addition, CNLs were widely distributed on 14 chromosomes, TNLs were distributed on six chromosomes, and all three RNLs were located on chromosome 4. There was obviously no significant correlation between NBS gene number and chromosome length.
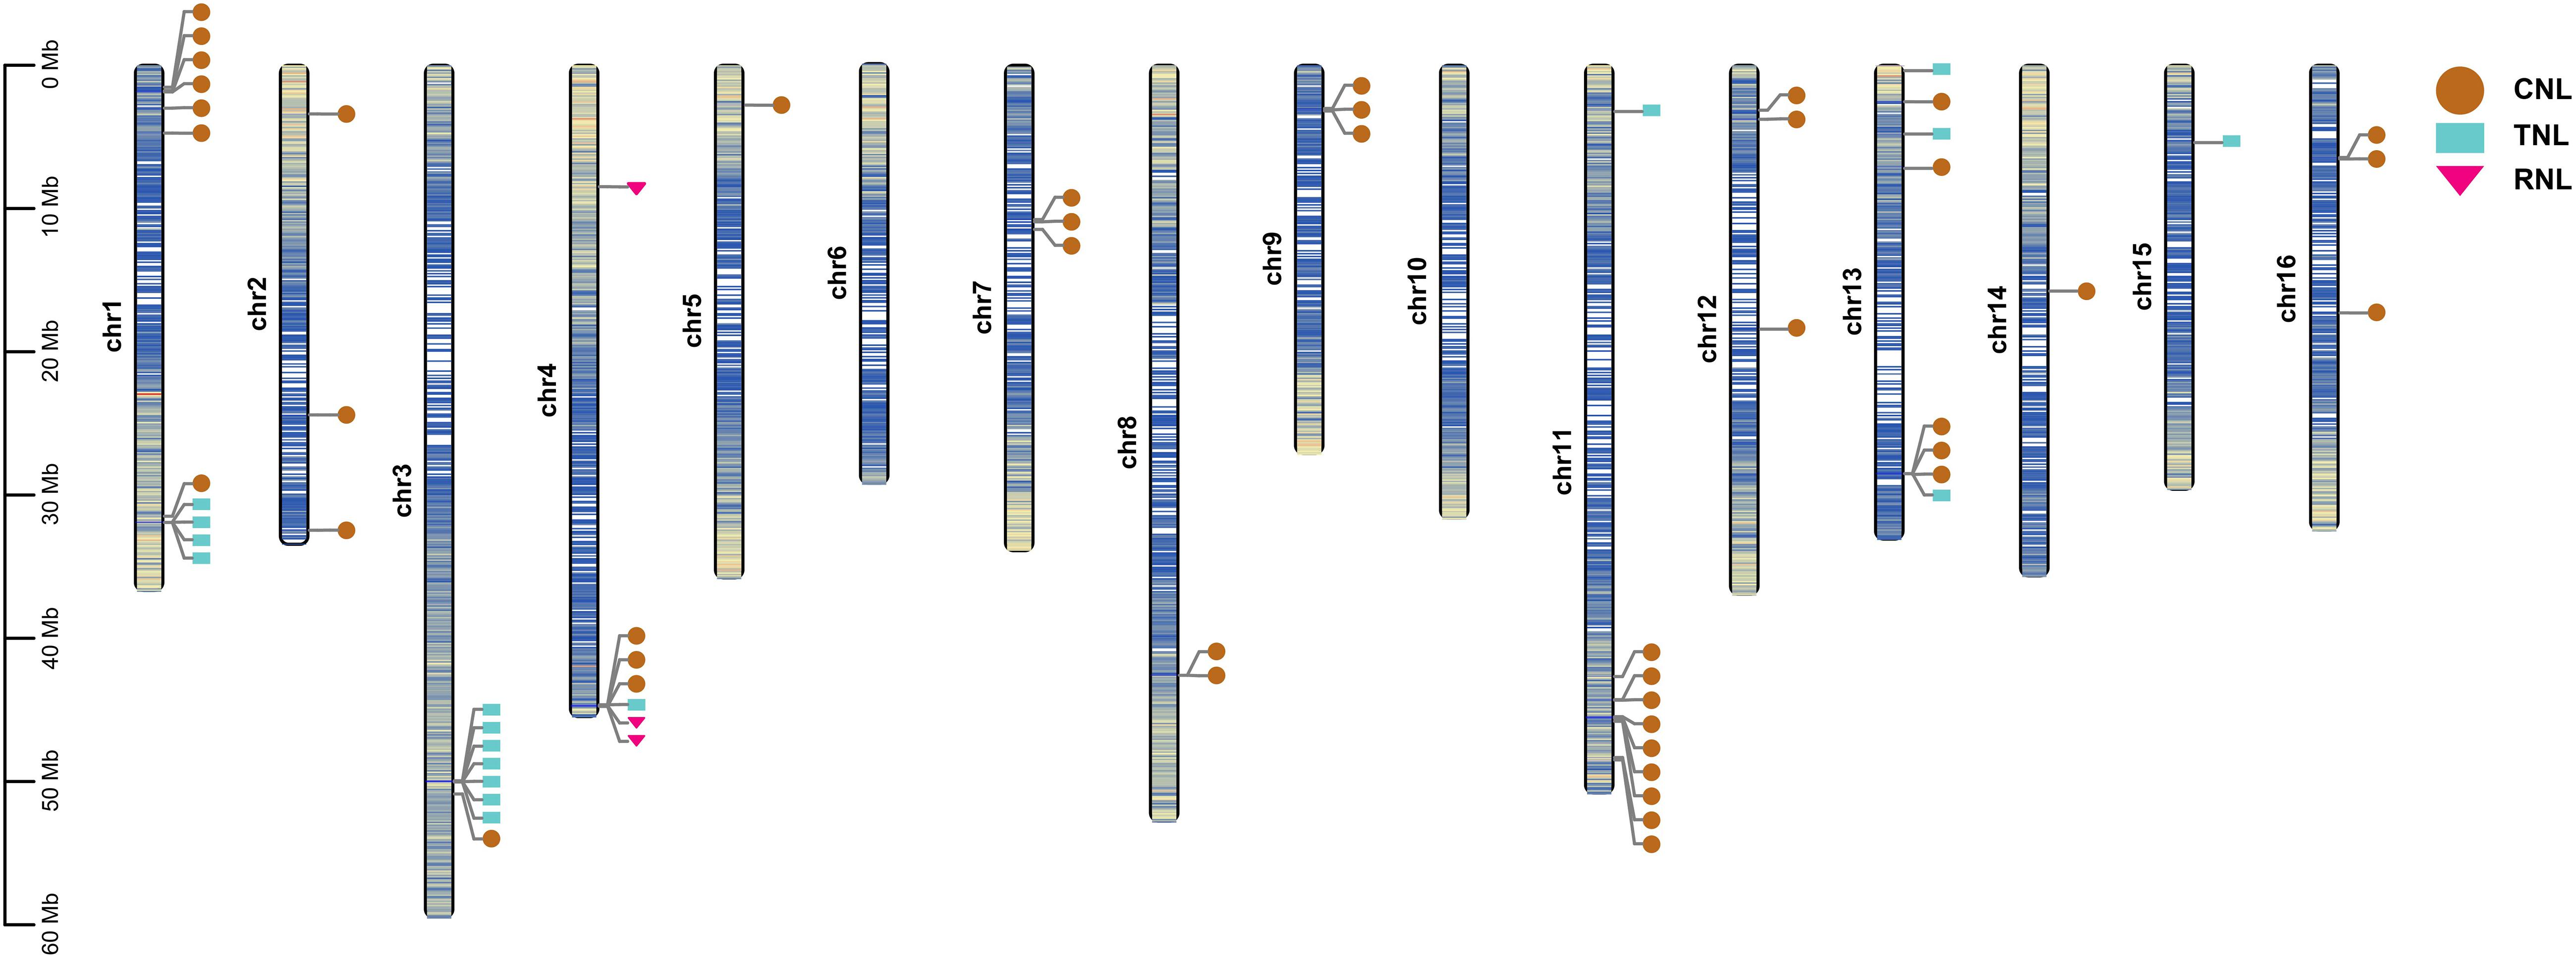
Figure 2. Chromosomal distribution of NBS genes in A. trifoliata. The relative mapping positions of 64 identified NBS genes are shown on the chromosomes. CNL genes are represented by brown circles, while TNL and RNL genes are represented by blue rectangles and pink triangles, respectively. The shade of the chromosome color represents gene density, where the bluer the color, the higher the density, and the yellower the color, the lower the density.
According to the definition of gene clusters, the genes on the chromosomes were divided into 35 loci, including 23 singletons and 12 gene clusters (Supplementary Table 1), and 41 (64.1%) of 64 mapped NBS genes were distributed into 12 clusters, with a mean of 3.42 genes per cluster. The 12 defined gene clusters were assigned to 9 chromosomes: five clusters of loci had only two adjacent genes, 14 (on chromosome 7), 16 (on chromosome 8), 20 and 23 (on chromosome 11), and 34 (on chromosome 16); two clusters of loci included three genes, 17 and 21 (on chromosomes 9 and 11, respectively); three clusters of loci contained four genes, 1 and 5 (on chromosome 1) and 30 (on chromosome 13); one cluster of loci included six genes, 12 (on chromosome 4); and the remaining cluster of loci included seven genes (the greatest number), 9 (on chromosome 3).
Ka/Ks and Phylogenetic Analysis
To differentiate both the type and the strength of natural selection between different NBS types, the Ka/Ks values of all orthologous A. trifoliata NBS genes were also calculated because it is usually as an informative indicator of natural selection during evolution progress. The results showed that all RNLs were excluded according to the lower limit for orthologs, and the ratios of all orthologous NBS genes were far less than 1 (Supplementary Table 5), which indicated that the A. trifoliata NBS genes have mainly experienced purifying selection during evolution (i.e., removing harmful mutations and maintaining protein conservation). The average Ka/Ks ratio of the CNLs was 0.31, which was significantly lower than that (0.42) of the TNLs at the p = 0.01 level.
The evolutionary relationships among all the identified NBS candidates were inferred from the phylogenetic tree by using the NB-ARC domains, except for AtNBS19, AtNBS34 (CNL), and AtNBS61 (TNL) because of their shorter or less similar sequences. They were divided into two broad branches, the TNLs and CNLs (Figure 3). The TNL branch included three subgroups, TNL-1, TNL-2, and TNL-3, with 18 TNL genes, while the CNL branch contained four main subgroups, CNL-1, CNL-2, CNL-3, and CNL-4, with 52 genes, consisting of 48 CNLs and 4 RNLs. In addition, all 4 RNLs were clustered into the CNL-2 subgroup.
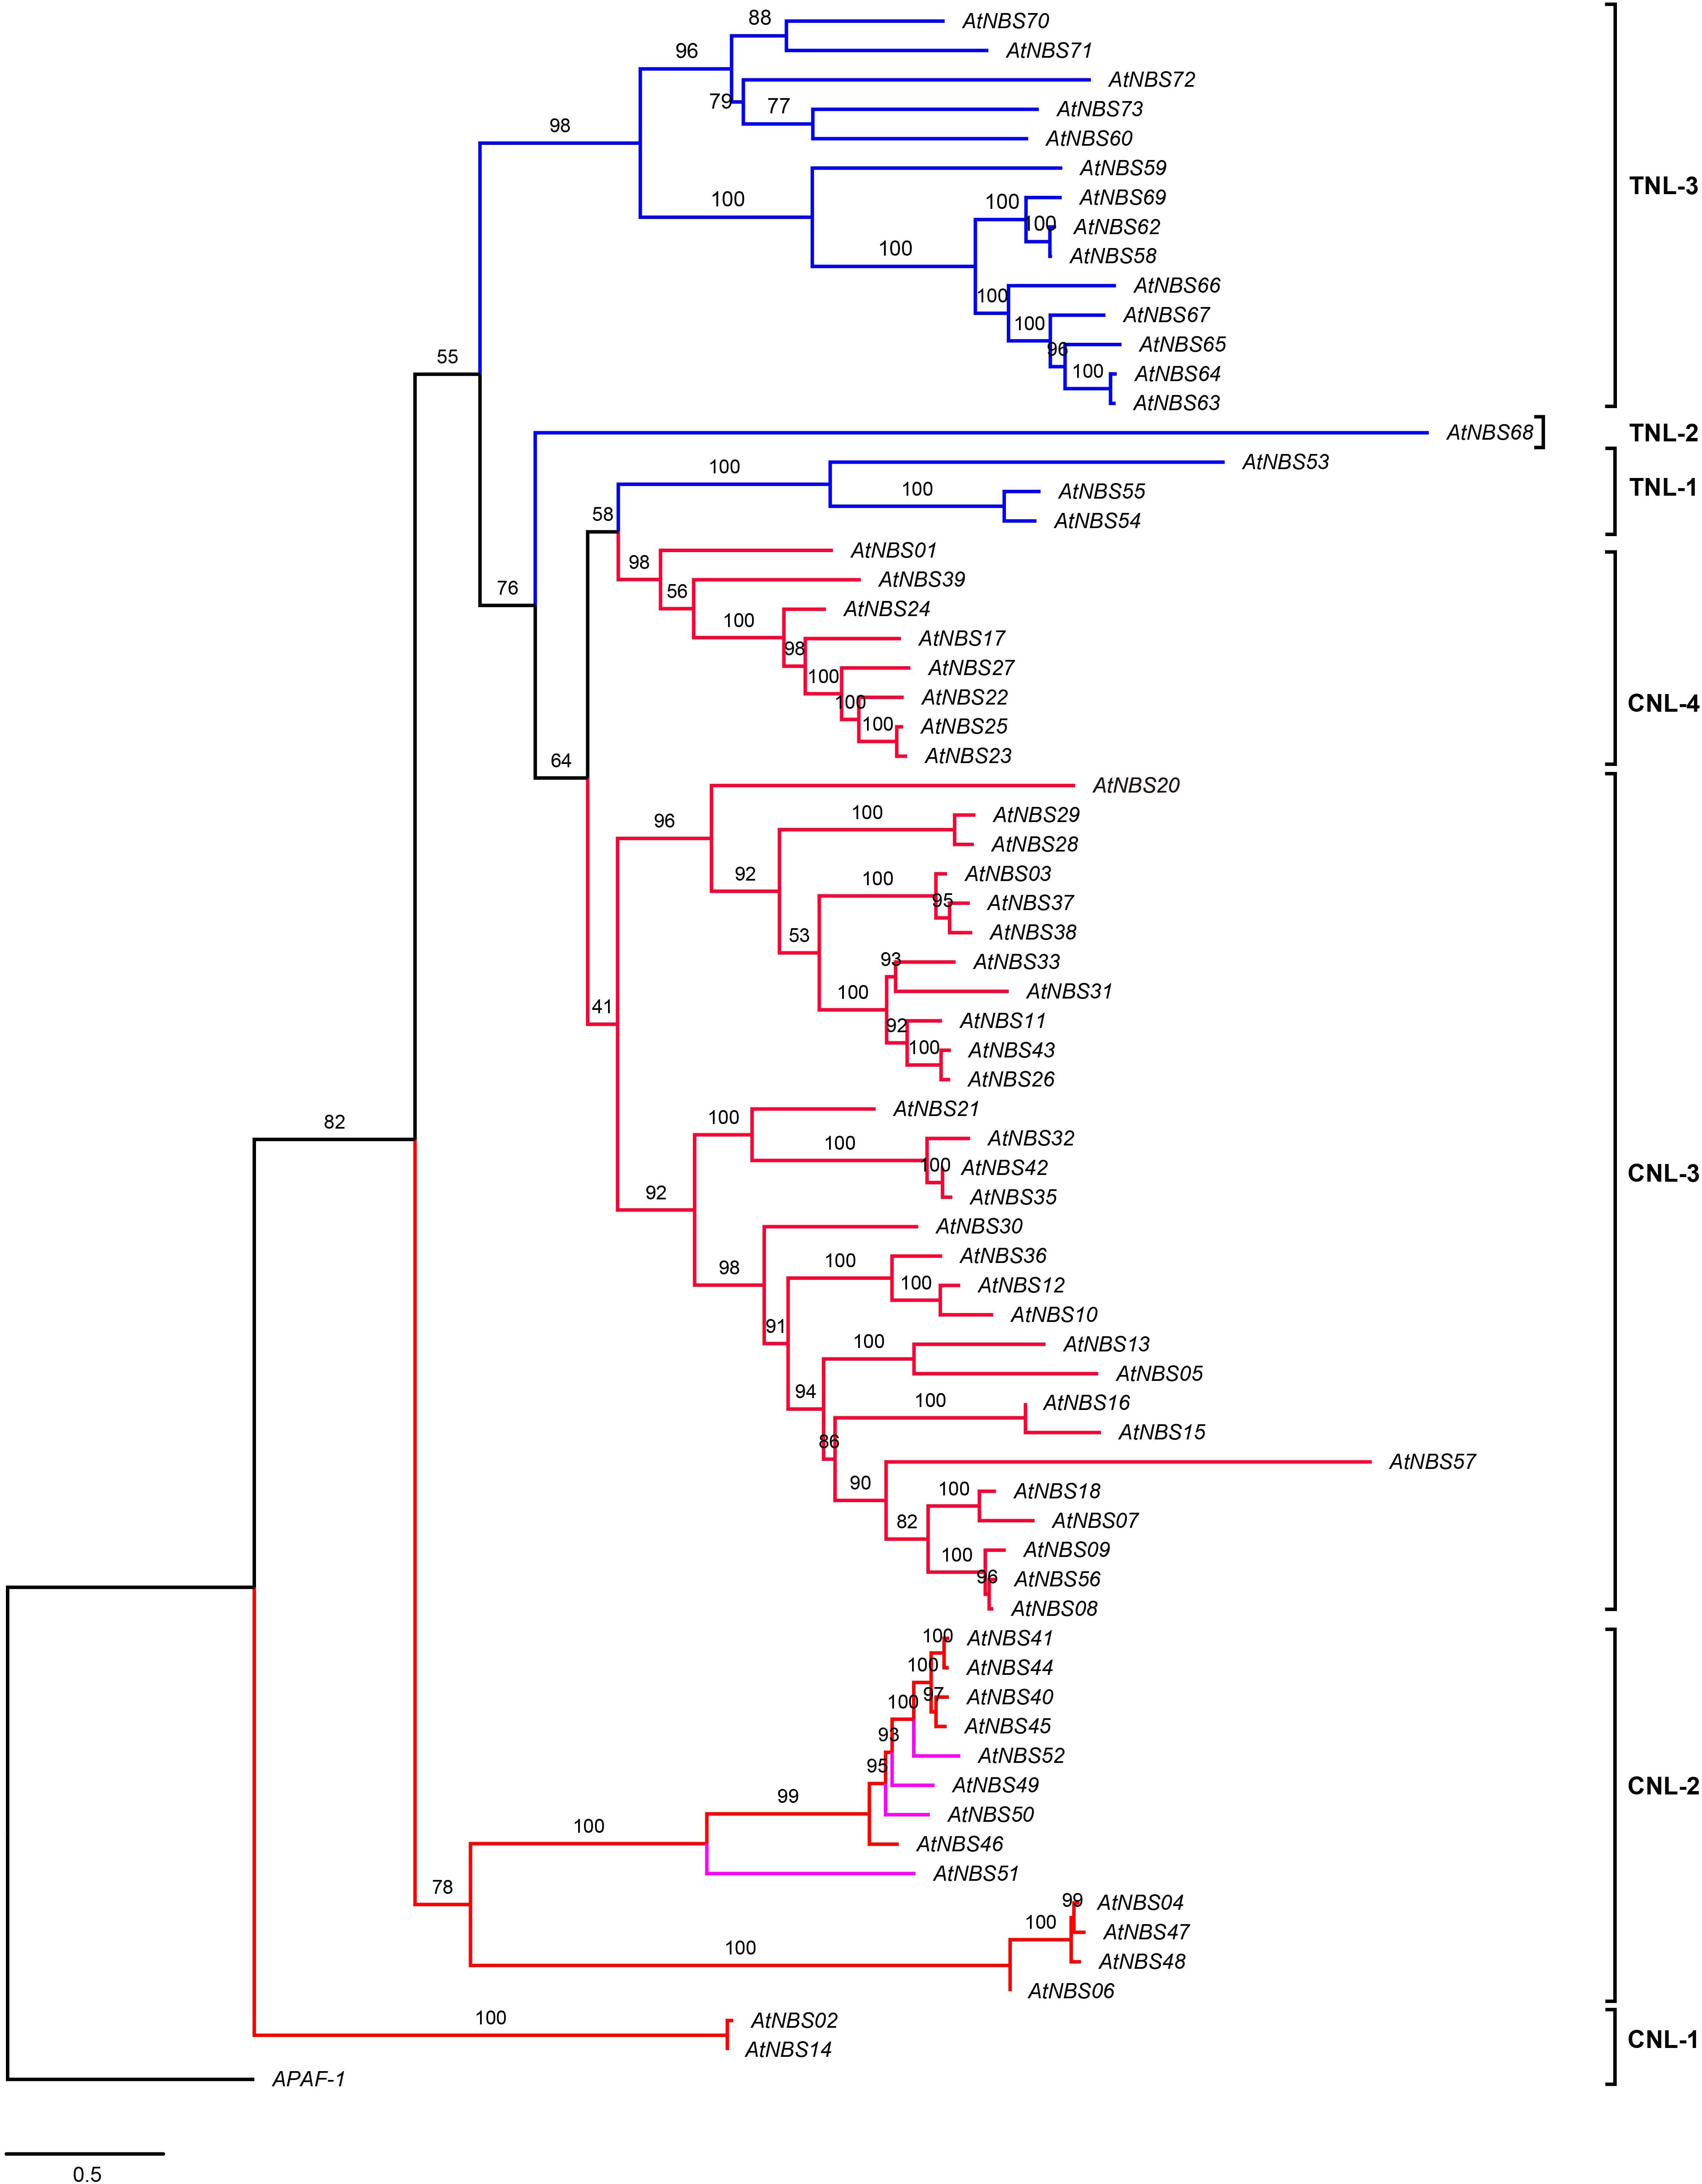
Figure 3. Phylogeny of NBS genes in A. trifoliata. The maximum likelihood tree was constructed using 70 NBS domains, both here and below. Percent bootstrap values (1000 iterations) are indicated in every branch. Blue, red, and pink lines correspond to the TIR, CC, and RPW8 clades, respectively. APAF-1 was used as an outgroup. The scale bar indicates the genetic distance.
To identify close functional homologs for each NBS candidate, TNL and CNL trees were separately reconstructed by adding some clearly functional NBS genes: 19 TNLs, such as RPS2 (Arabidopsis thaliana) (Bent et al., 1994; Figure 4), 38 CNLs, such as Pi-ta (Oryza. sativa) (Huang et al., 2008), and two RNLs, including ADR1 (A. thaliana) (Collier et al., 2011; Figure 5), as references. The TNL tree was redivided into two subgroups: TNL-A and TNL-B (Figure 4). Four TNLs of A. trifoliata and 14 well-known functional TNLs that mainly confer resistance to fungal rust and spot diseases in species such as Nicotiana tabacum (N) and Solanum lycopersicum (E) were clustered into TNL-A, while TNL-B contained 14 TNLs of the A. trifoliata genome and five TNL reference genes that confer resistance to bacterial (RPS5/2, RFL1 and UNI of A. thaliana) or fungal (SUMM2 of Cocos nucifera) root rot diseases.
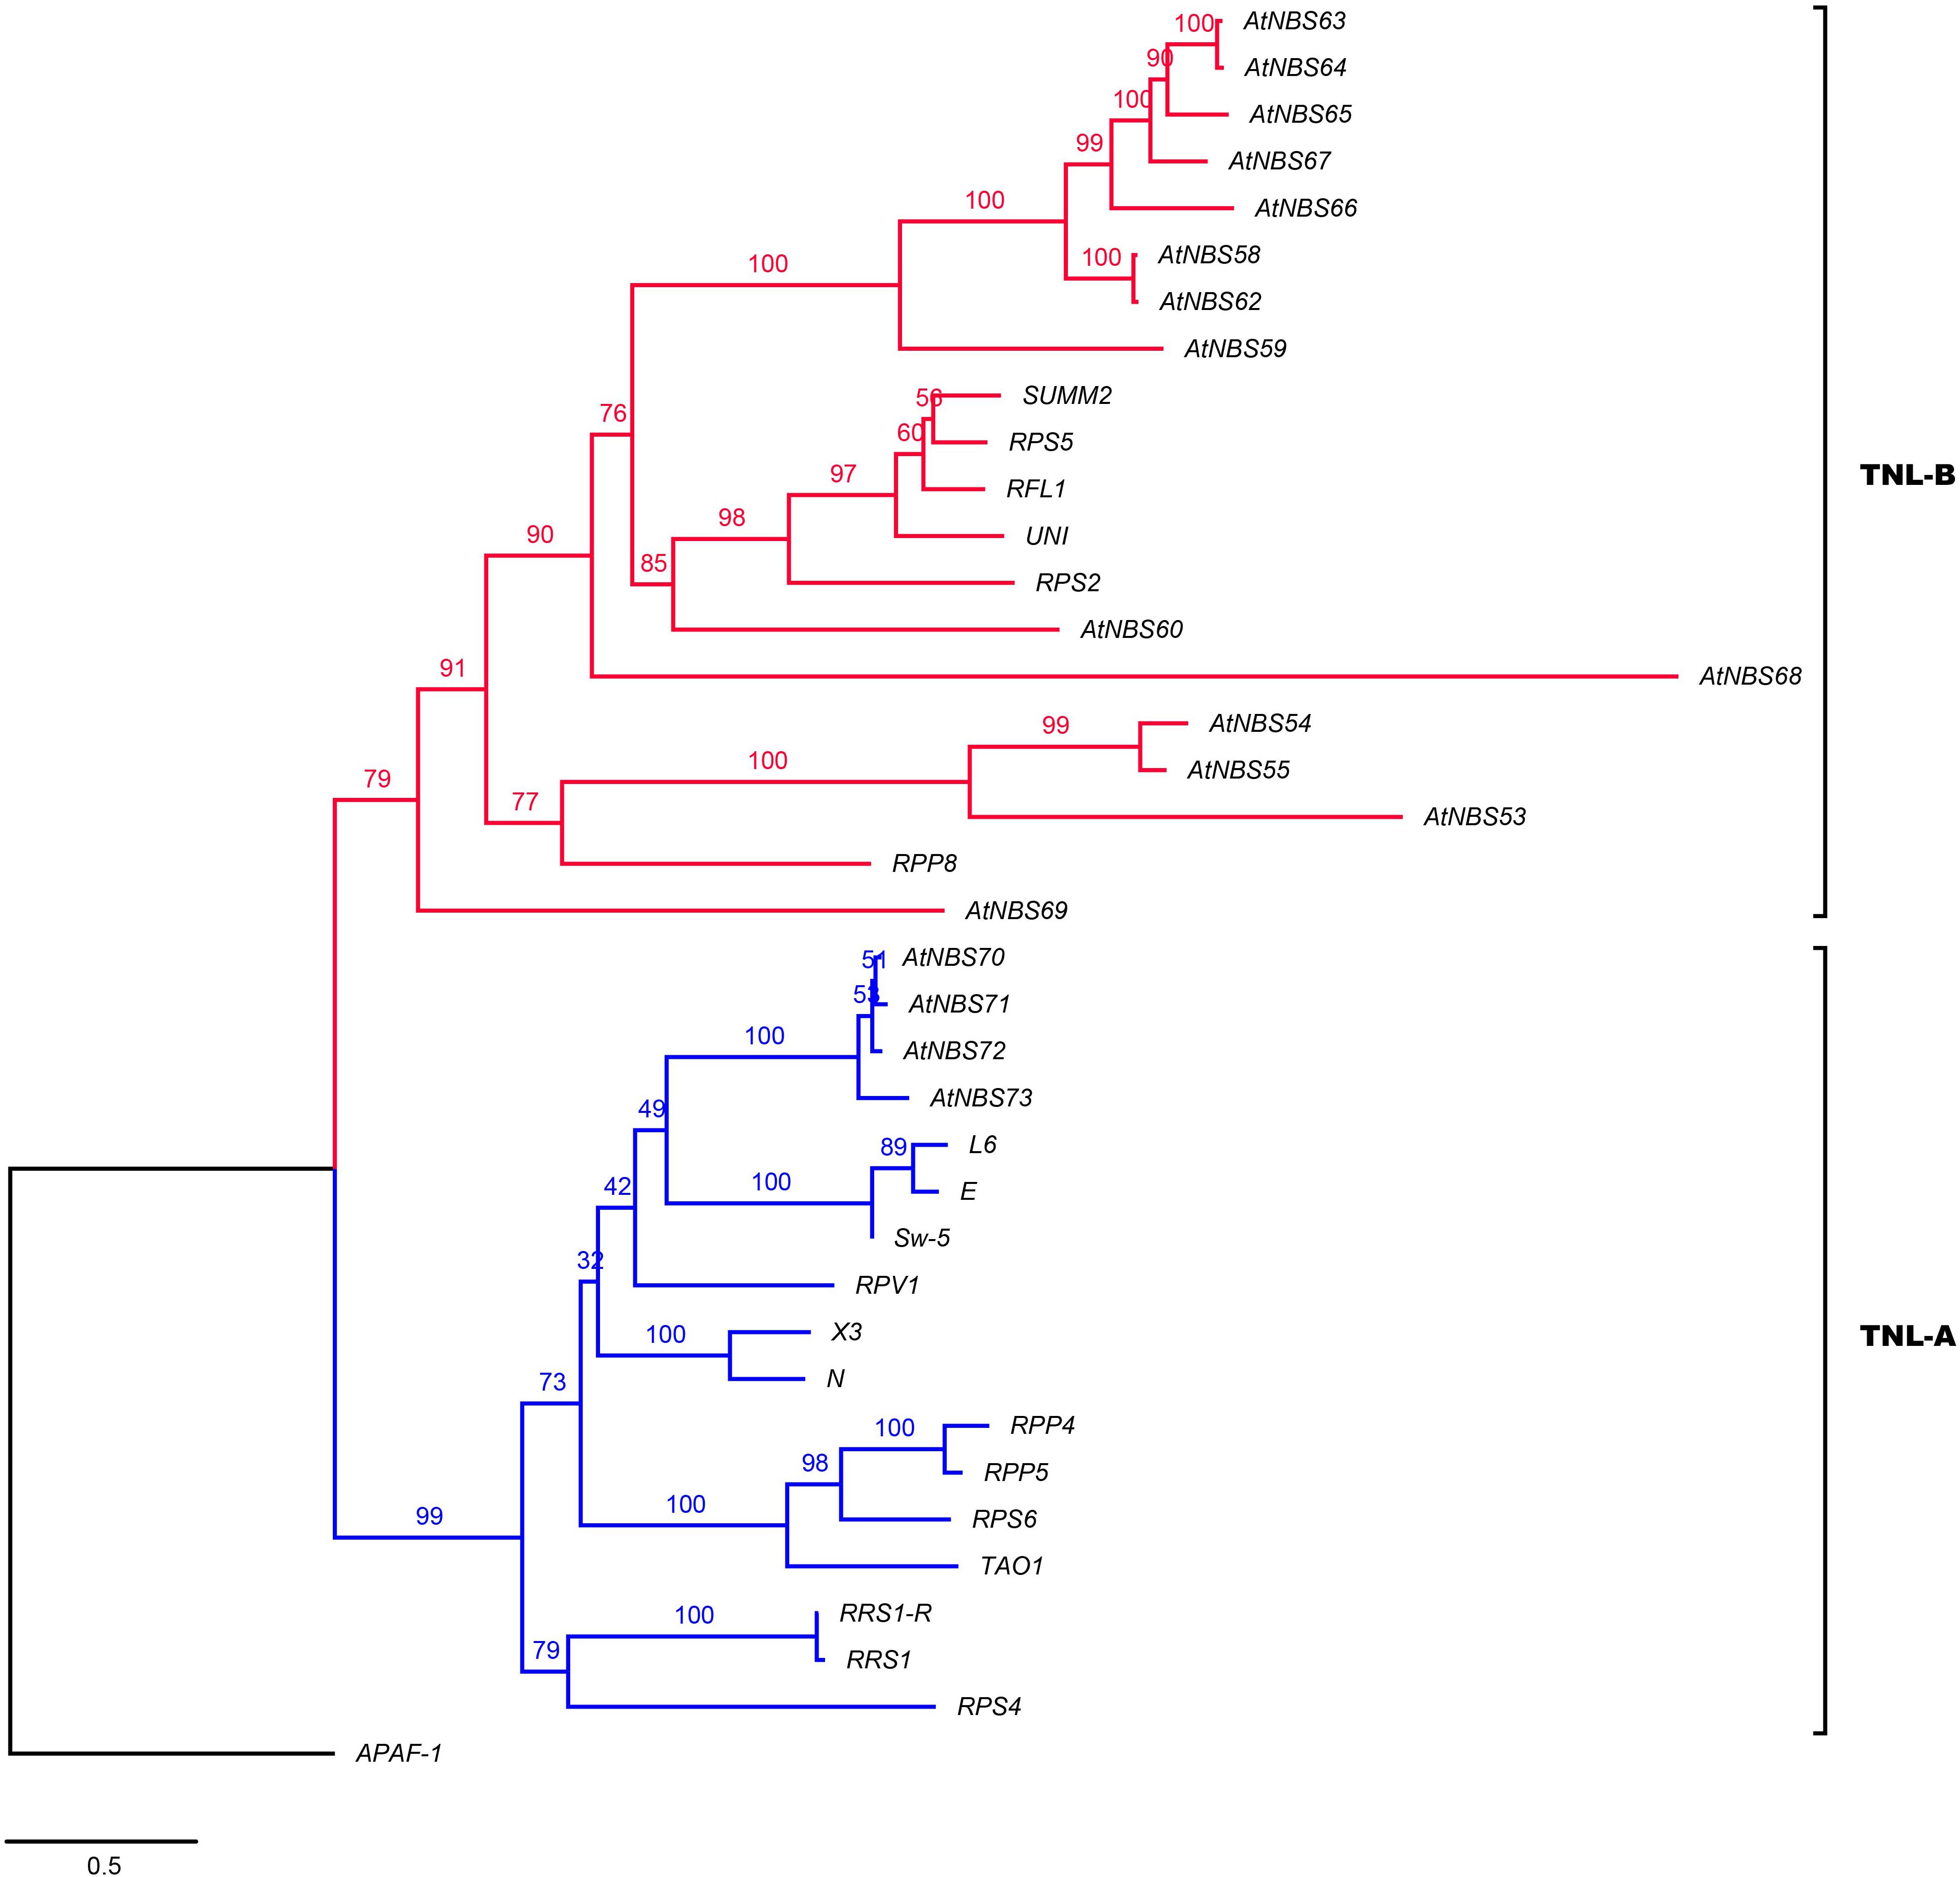
Figure 4. Phylogeny of the TNL subclass of A. trifoliata NBS proteins with functional resistance genes from other species. Blue and red represent the TNL-A and TNL-B clades.
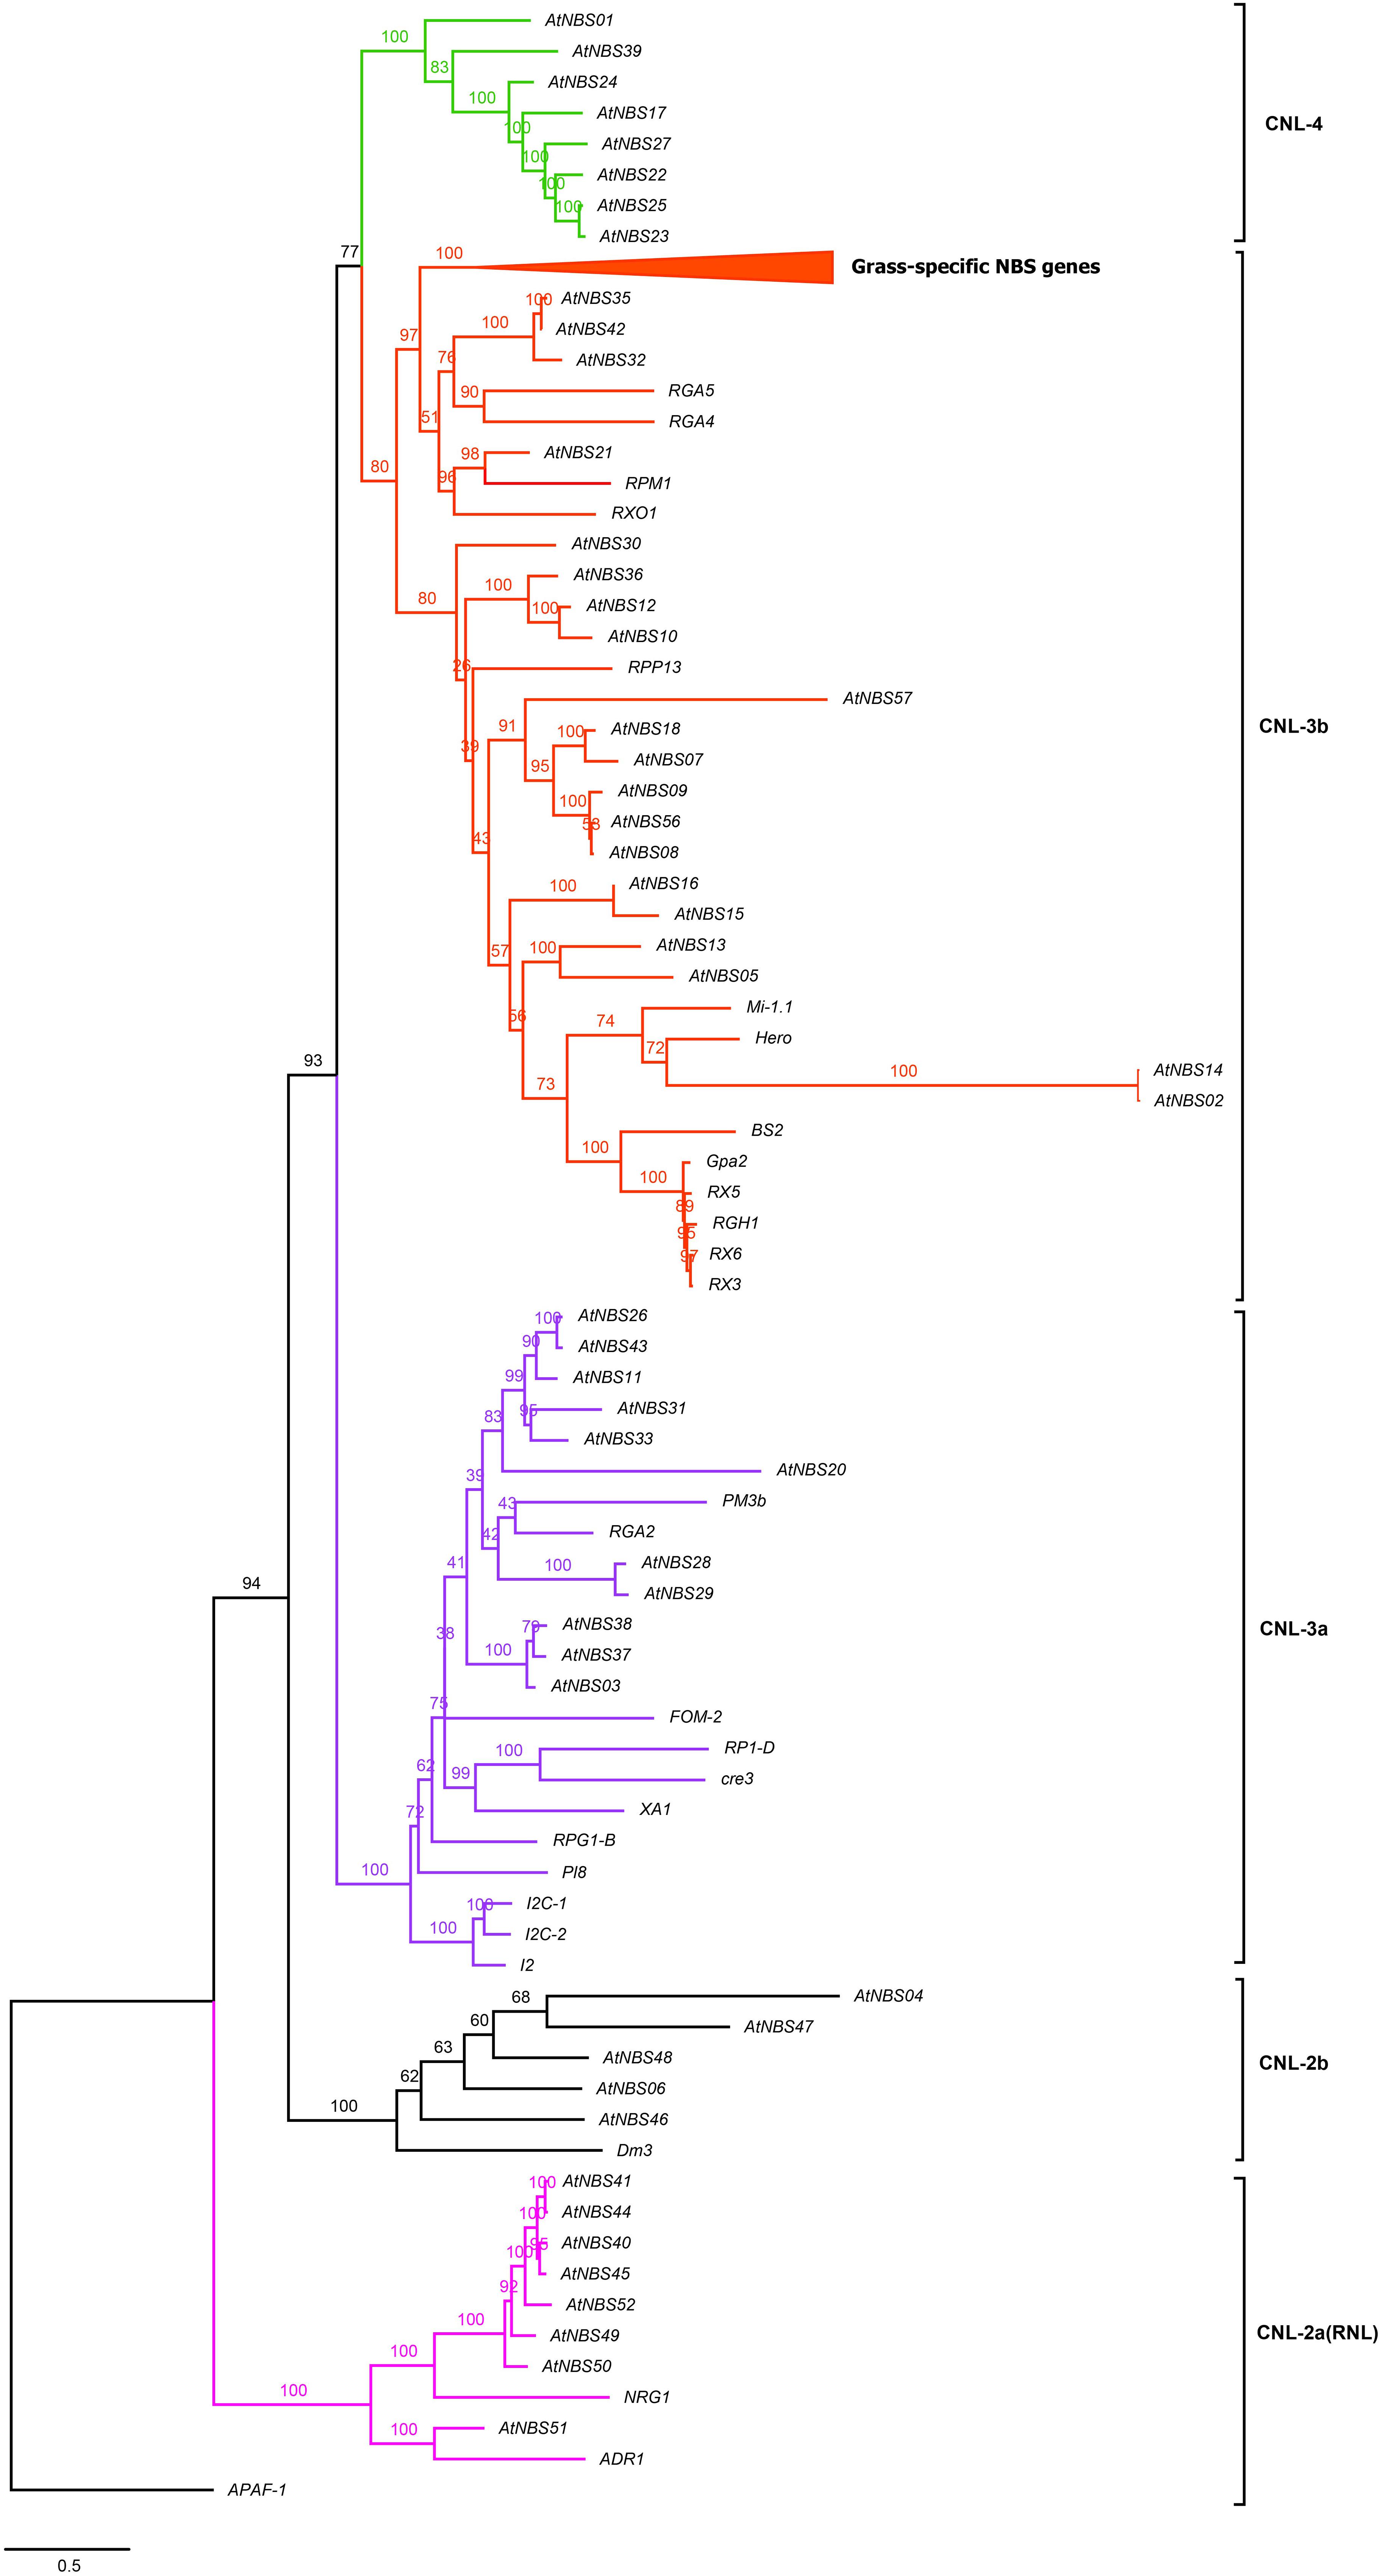
Figure 5. Reconstructed tree of the CNL subclass of A. trifoliata NBS proteins. Pink, black, purple, red and green represent the CNL-2a (RNL), CNL-2b, CNL-3a, CNL-3b, and CNL-4 clades, respectively. The top clade in the CNL-3b clade is compressed, and the complete tree is shown in Supplementary Figure 1 because it clusters R genes that are specific to grasses and do not group together with any A. trifoliata NBS candidates. Members of this clade include Pi-ta and Pik-1/2 from O. sativa L. and Mla1, MLA12 and RPG5 from Hordeum vulgare L.
The branches in the CNL tree were classified into the CNL-2a/b, CNL-3a/b, and CNL-4 clades (Figure 5). Four CNLs and four RNLs from A. trifoliata and two RNL reference genes (ADR1 and NRG1) clustered into clade CNL-2a (RNL). Clade CNL-2b contained five identified CNLs and one reference gene, Dm3, conferring resistance to downy mildew in Lactuca sativa L. In CNL-3a among 11 candidates and 11 reference genes, the reference genes preferentially clustered separately from CNL candidates. Although the powdery mildew resistance gene PM3b and the late blight resistance gene RGA2 clustered with A. trifoliata genes, the bootstrap support was rather low. Although 20 candidates and 24 reference genes were included the same large CNL-3b clade, they still exhibited two relatively distinct branches because of many reference genes from grass families (Figure 5 and Supplementary Figure 1), which could be explained in terms of the more versatile reference CNL genes after the loss of TNLs in monocots (Li J. et al., 2010). Interestingly, only A. trifoliata genes clustered in CNL-4, as shown in Figure 3.
Duplication Analysis of NBS Genes
The different duplication types were detected by MCscanX, and the output results showed that 33 (45.2%) of the 73 NBS genes were duplicated by tandem duplication. These genes were mainly distributed in clusters on chromosomes 1, 3, 4, 11, and 13. A total of 29 genes (39.7%) resulted from the dispersal of duplications of individual or small groups of genes to unlinked loci; 9 (12.3%) were produced by proximal duplication; and only 2 (2.7%) arose through whole-genome duplication (WGD) (Supplementary Table 1). In the CNL subfamily, 74.0% of the genes were derived from tandem and dispersed duplications; similarly, among the TNLs and RNLs, 84.2 and 50.0% of the genes, respectively, arose from the above two types of duplications.
Differential Expression Analysis of NBS Genes of A. trifoliata in Various Fruit Tissues
To test the general function of the 73 NBS genes by expressing analysis, the RNA data of different tissues (flesh, rind and seeds) at four developmental stages (young, enlargement, coloring and maturity) were downloaded from NCBI BioSample10. The results of expression analysis showed that there were 66 genes expressed at detectable levels, most of which showed a very low expression level in all three fruits tissues at all four stages of development (Figure 6A). Only AtNBS51, with an FPKM value of more than 30, was identified as showing intermediate or high expression, while there were 27 genes with expression levels ranging from 3 to 30 FPKM categorized as genes with low expression. Interestingly, 26 of the 28 genes (16 CNL, 9 TNL, 3 RNL) were mainly expressed in rind, and 10 of them were increasingly expressed in the later stages of rind development (enlargement, coloring and maturity). Moreover, among the 28 genes, the percent expression of the most conserved RNL was the highest (75%), while that of the most relaxed CNL was lowest (32%). In addition, we found that the mean expression levels of the identified NBS genes at four different stages were 1.4, 1.5 and 2.2 FPKM in the seeds, flesh and rind, respectively (Figure 6B). Among the 66 expressed NBS genes, four genes were mainly expressed in the flesh, 16 in the seeds, and 46 in the rind (Figure 6C).
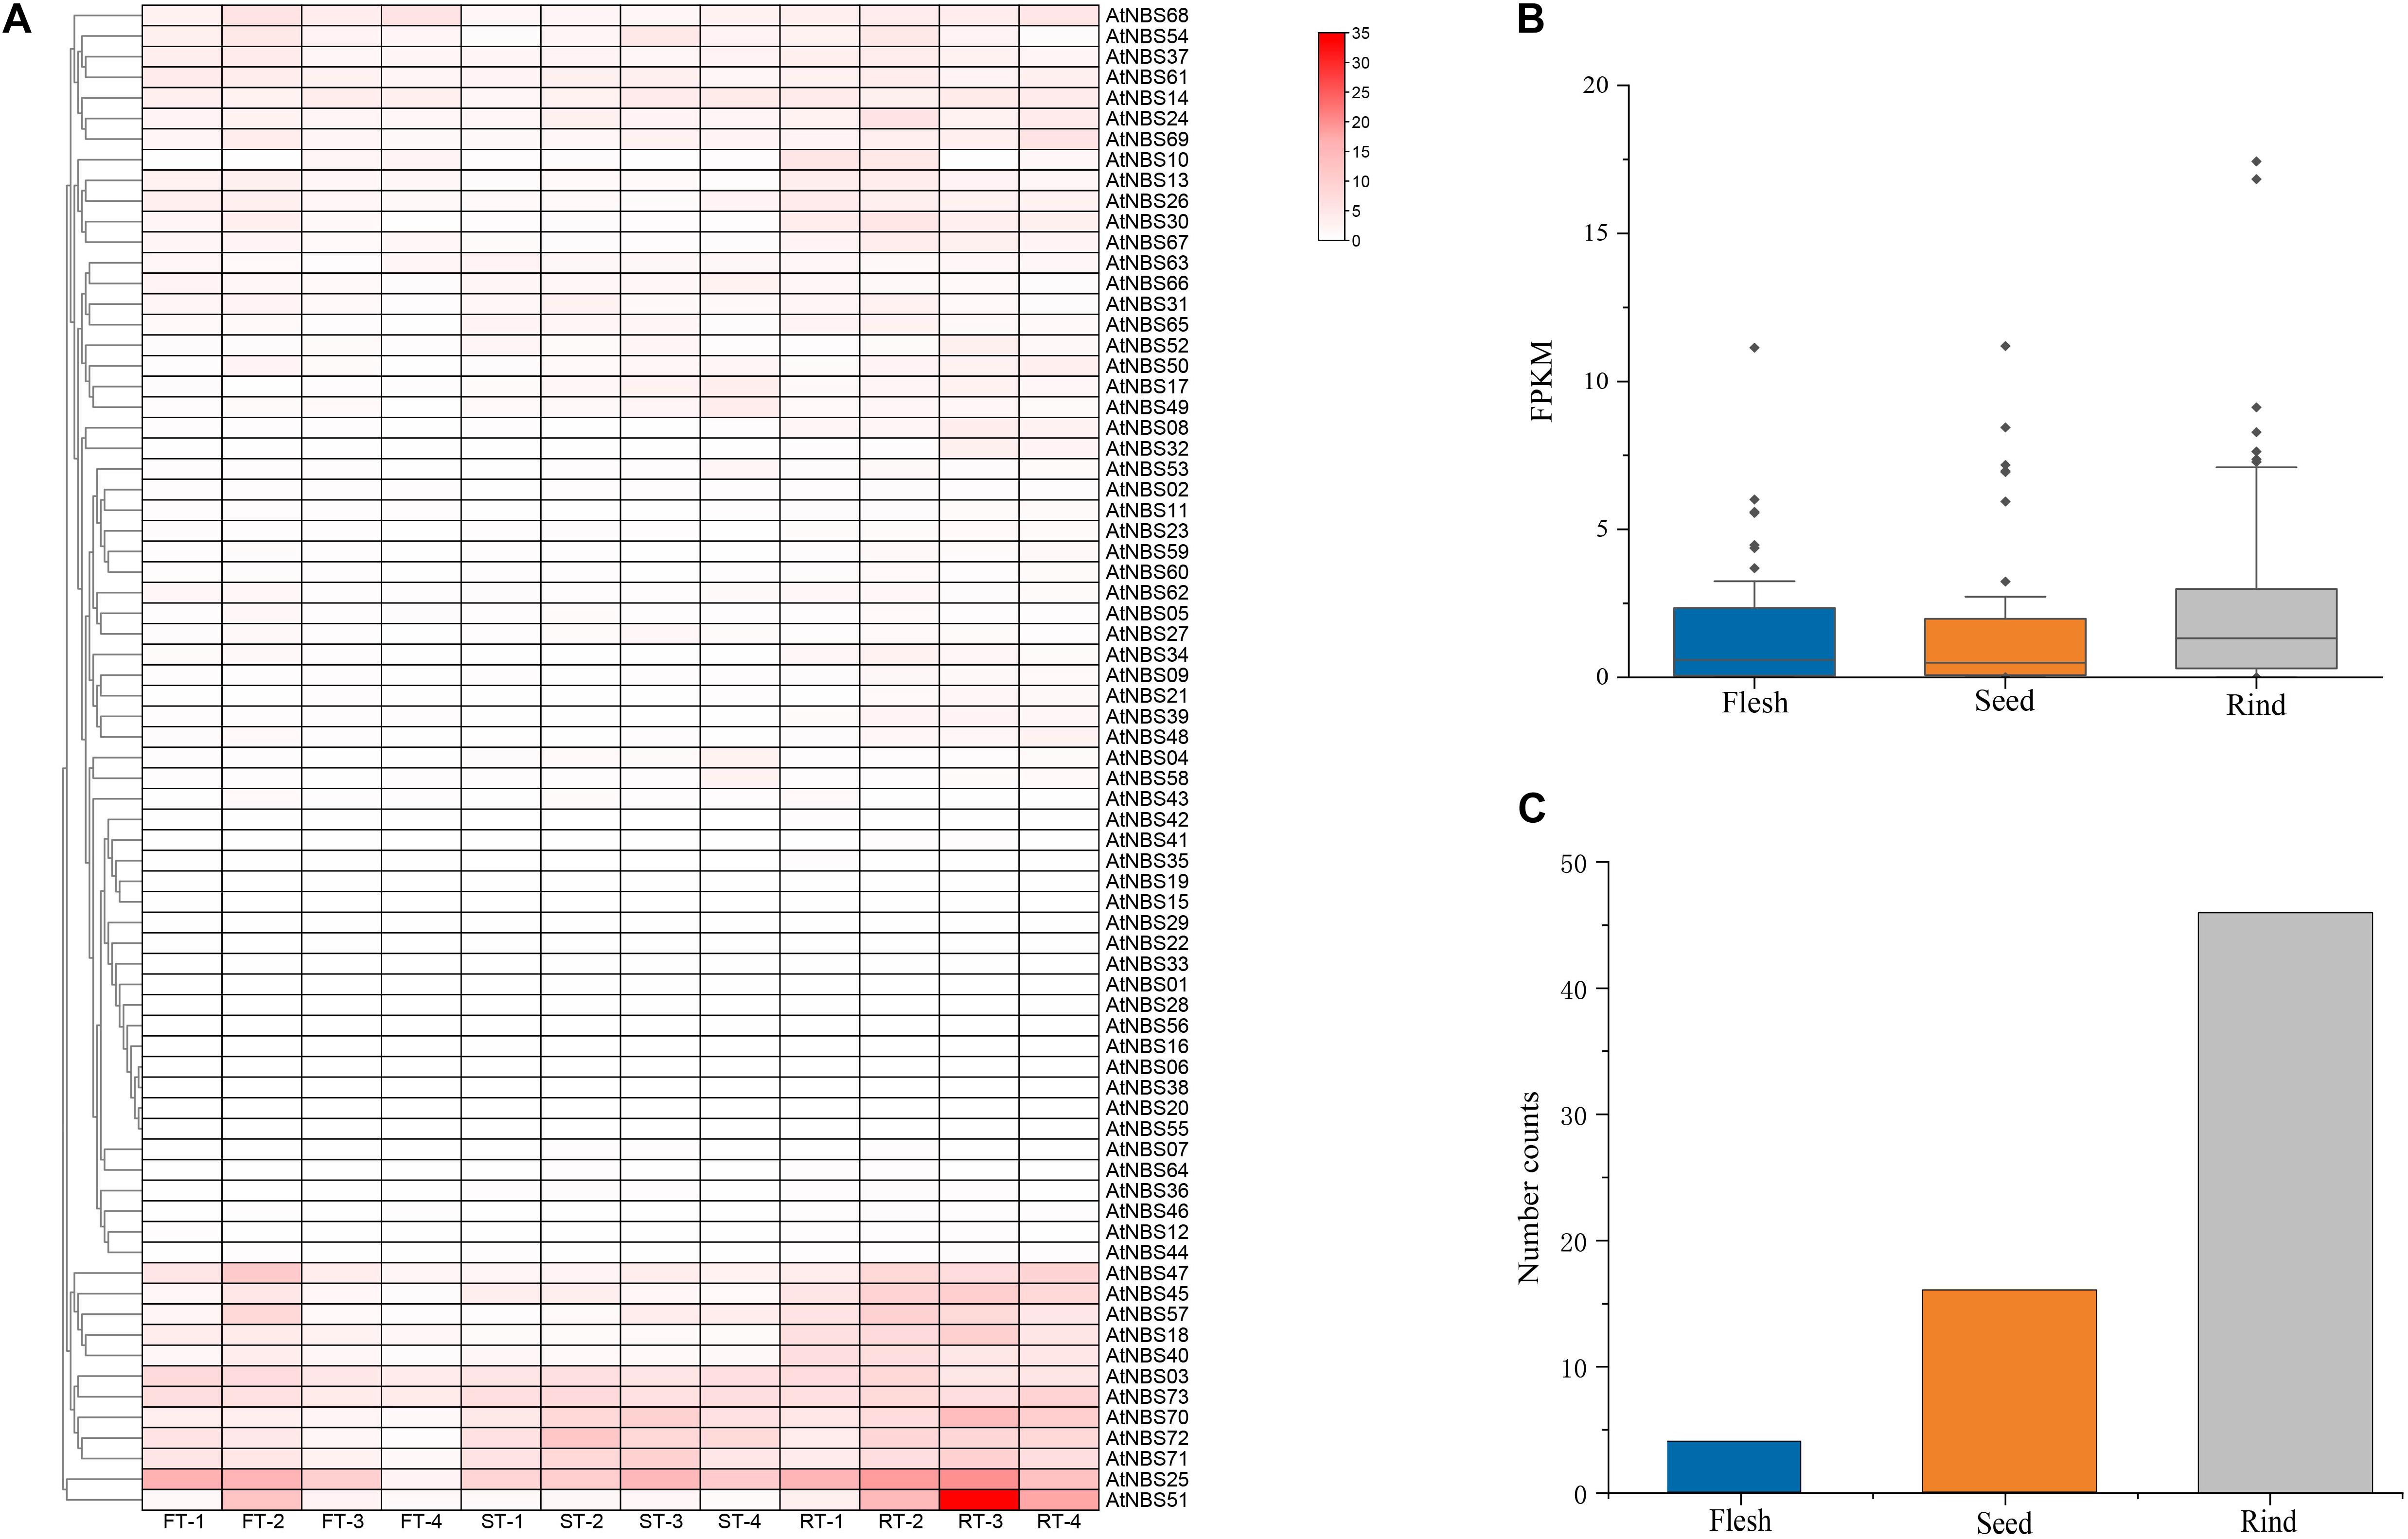
Figure 6. Expression profile of A. trifoliata NBS genes. (A) Expression heat map of 73 NBS genes in three different fruit tissues at four developmental stages. (B) Mean expression of 73 NBS genes in the three tissues. (C) Quantitative distribution of the highest expression levels of NBS genes in tissues.
Discussion
NBS genes are the largest disease R gene family that exists in all plants, and broad genome-wide analyses of this family have been carried out in recent years (Jones et al., 2016). Despite the existence of recent publications on the A. trifoliata genome (Huang et al., 2021), the corresponding genomic data files are still unavailable online. Therefore, a high quality A. trafoliata genome assembled and submitted by our group to NCBI was employed to identify and characterize NBS candidates (see detailed data in section “Materials and Methods”), including analyses of their numbers, structures, distribution, duplications and gene expression profiles.
Previous studies have shown that the number of NBS genes varies greatly among different species and usually reaches hundreds in a single plant species, to confer protection against diverse and rapidly evolving pathogens. There are over 2,000 NBS genes in the extremely large wheat genome, but these genes are extremely scarce in C. papaya, Thellungiella salsuginea and some orchids (Shao et al., 2016; Xue et al., 2019; Andersen et al., 2020). Here, we identified 73 NBS genes, accounting for only 0.3% of the 24,138 annotated genes of A. trifoliata (Table 2), which suggested that the number of NBS genes in its genome was small. In previous studies, some authors have suggested that a positive correlation exists between NBS gene number and genome size within five samples, where the number increases with increasing genome size (Goyal et al., 2020), while the others have inferred that there is no significant correlation between them also in five samples (Zhang et al., 2016). In this study, total 13 representative species including four basal eudicots, four core eudicots and five monocots (listed in Table 1), were employed to address this issue mainly because of the evolutionary relationship with A. trifoliata, available knowledge about NBS genes, and economic importance. The results showed a significant correlation coefficient (0.96) between NBS gene number and genome size among the 13 species; however, the value decreased to −0.14 after we removed wheat as the out-group (Table 1). Therefore, the correlation between NBS gene number and genome size could depend on both the size and components of the genome sample employed.
Despite the small number of NBS genes in A. trifoliata, the types of these genes are diverse, including 9 subclasses within 3 classes (Table 2), and these classes are distinct in composition (a 3:1 ratio of nTNL:TNL). Previous studies have shown that the nTNL:TNL ratio varies widely, ranging from 1:3 in B. oleracea (Liu et al., 2019) to an extremely high ratio of 18:1 in Capsicum annuum (Qian et al., 2017) among dicots, while monocots only contain the nTNL subclass because of the loss of the TNL subclass after the divergence of dicots and monocots (Qian et al., 2017). These large disparities in composition not only indicate that distinct NBS subgroups have experienced different evolutionary events, such as different types of genomic duplication and magnitudes of natural selection, but also provide key clues for establishing the relationships between speciation and the growth environment.
We found that there were markedly more CNL genes (68.5%) in A. trifoliata than TNL (26.0%) and RNL (5.5%) genes, which showed conserved evolution without large-scale expansion (Table 1). Moreover, the four RNLs formed an extremely conserved branch that did not deviate from the CNLs in Figure 5, and similarly low proportions of RNLs have been reported in some orchids (Xue et al., 2019) and D. rotundata (Zhang et al., 2020), in distinct contrast to the large numbers of CNLs and TNLs. A reasonable explanation for this phenomenon is that RNLs only assist other functional NBS genes as downstream genes with conserved functions, as reported for “Helper NBS-LRRs” (Bonardi et al., 2011; Collier et al., 2011). In fact, the number of NBS subfamilies retained in the genome usually depends on the genomic duplication type and the selection pressure exerted during evolutionary history (Mun et al., 2009). The analysis of the Ka/Ks ratio to explore the evolutionary difference between CNL and TNL showed that both CNLs and TNLs have experienced purifying selection, and the significantly lower Ka/Ks value of CNLs than TNLs at the p = 0.01 level (Supplementary Table 5) demonstrated that greater selective constraints and purifying selection in the CNL group and relaxation of purifying selection in the TNL group might have resulted in ancient diversification of NBS genes (Mun et al., 2009).
As the primary source of raw genetic material, WGD is widely involved in plant evolutionary processes and is especially common in angiosperms (Akoz and Nordborg, 2019), but only two NBS genes from the ancestral WGD event survived in A. trifoliata (Supplementary Table 1). This was probably because the synteny of NBS genes resulting from WGD was destroyed in the process of long-term evolution or because the number of NBS genes might have been reduced after WGD via rapid species-specific gene loss (Die et al., 2018a; Song et al., 2019). Recently, some studies have suggested that tandem and dispersed duplication events could be a major driving force of NBS gene expansion (Baumgarten et al., 2003; Qian et al., 2017); however, the main duplications in each subclass of NBS are still unclear. In the present study, we found that in the A. trifoliata genome, CNLs were mainly expanded by the dispersal of individual or small groups of duplicated genes to unlinked loci, while TNLs were mainly expanded by tandem duplication, which produced closely related genes in the same family that clustered together (Supplementary Table 1; Leister, 2004). Additionally, the chromosomal distribution of NBS genes in the A. trifoliata genome (Figure 2) agreed well with the differences in gene expansion, which could also explain the greater number of CNLs relative to TNLs.
The other interesting characteristic involved the relationship between exon number and gene length in the A. trifoliata genome, where a significant positive relationship existed between exon number and gene length among the 73 NBS genes (Table 2). We further found that TNLs showed larger values than CNLs for both exon number and gene length in all other six dicots on our list (Supplementary Table 7), including Raphanus sativus (Ma et al., 2021), A. thaliana, B. oleraces, B. rapa (Mun et al., 2009), B. napus (Alamery et al., 2018), Helianthus annuus (Neupane et al., 2018), and Manihot esculenta (Lozano et al., 2015). All results from the above species indicated that independent gains or losses of exons occurred in distinct NBS subclasses, and the greater exon number and longer gene lengths of TNLs could result from a more ancient evolutionary history than CNLs, which evolved more recently (Meyers et al., 2003).
Structurally, the NBS domains of the characterized R genes shared eight common conserved motifs (Meyers et al., 2003). Through MEME analysis, we found that 45.2% of the identified genes contained all eight motifs, and P-loop (66), GLPL (68) and kinase-2 (70) motifs were the most common ones (Supplementary Table 3). Both the P-loop and kinase-2 motifs function in ATP/GTP binding (Traut, 1994; Meyers et al., 2003), and the existence of these typically conserved NBS motifs in R proteins is essential for protein function. Although the specific function of GLPL is still poorly understood, its importance in disease resistance has been demonstrated by site mutation analysis in the context of flax rust (Dodds et al., 2001). Thus, the higher the frequency distribution of a motif is, the more conserved it is. In addition, the order of these eight motifs was shown to be relatively inflexible, and only two (AtNBS19 and AtNBS63) of the 73 identified NBS genes in A. trifoliata actually showed an order change (Figure 1 and Supplementary Table 2). We inferred that the conserved order of these motifs could be more important than the sequences themselves.
We further observed that the last residue of the kinase-2 motif exhibited the main difference between TNL and nTNL: 88.9% of nTNLs contained W as the last residue of the kinase-2 motif, while it was replaced with D in 68.4% of TNLs (Supplementary Table 3), which was consistent with previous works (Meyers et al., 2003; Die et al., 2018b). Initial reports suggested that the conserved aspartate of kinase-2 is indispensable for the concentration-dependent binging of Mg2+ to ATP, which is essential for its function in plant defense signaling (Tameling et al., 2002). Thus, we inferred that the TNL proteins with more conserved aspartate residues may be more functional ATP-binding proteins with ATPase activity.
Homologous proteins with sequence similarity usually retain similar functions in evolution, and consequently we aimed to select some key and well known NBS resistance genes from other species, which was conducive to the identification of close functional homologs in A. trifoliata (Lozano et al., 2015). Then, the TNL (Figure 4) and CNL (Figure 5) trees were separately reconstructed by adding reference TNLs and CNLs/RNLs. Many TNL candidates clustered with functional genes for resistance to bacterial or fungal root rot diseases in TNL-B, and five CNL candidates clustered with the Dm3 gene for resistance to downy mildew in clade CNL-2b under 100% bootstrap support, while only CNL candidates were included in clade CNL-4, indicating that these genes might provide resistance to unknown A. trifoliata pathogens or play a role in non-host resistance responses. The widespread A. trifoliata NBS genes in the phylogenetic trees suggested that the different NBS subclasses could provide broad resistance to various pathogen species, while a few NBS genes would confer resistance to diverse races of the same pathogen. Furthermore, CNLs showed a higher level of topological complexity than TNLs in Figure 3, which might be helpful for broadening the resistance spectrum to achieve a broadly suitable distribution and could explain the long evolutionary history of this basal eudicot (Sun et al., 2016; Qian et al., 2017).
Comparative transcriptomic analysis can provide important insight into gene structures, functions and application prospects (Lowe et al., 2017). In the present study, we found that 90.4% of NBS genes were expressed in various fruit tissues at different developmental stages, and most of them were expressed at low levels (Figure 6A), which indicated that they have broad functions under field conditions. The relatively large number of NBS genes (46 of 66) that were mainly expressed in the rind at higher expression levels, especially in later stages, also indicated that most of these genes functionally conferred broad horizontal resistance to various pathogens in the field because only the rind tissue of A. trifoliata is exposed to pathogens. In addition, rind is usually considered the first barrier to pathogen infection, and hence the higher NBS gene expression compared with both flesh and seed in the later stages is reasonable. Only AtNBS51 (RNL) was identified as a gene with intermediate or high expression, and 27 NBS genes were identified as genes with low expression (Supplementary Table 6), which indicates that no pathogen can escape the defense exerted by a few NBS genes under a given condition. In addition, the high proportion (75%) of stably expressed RNLs despite the small proportion (5.5%) of RNLs among all 73 genes further demonstrated that with the help of RNLs, many CNLs and TNLs of A. trifoliata can confer broad resistance to various pathogen species and/or different races of the same species. Together, all evidence suggests that the small number of NBSs with structural diversification in A. trifoliata can provide defense against attacks by all types of pathogens that may be encountered. From the perspective of plant pathology, this provides a reasonable explanation for the wide distribution of wild A. trifoliata in various geographical and ecological regions and its continued healthy growth over many years.
In conclusion, only 73 non-redundant NBS genes were identified in the A. trifoliata genome in this work, but they showed high diversity, including three classes (CNL, TNL and RNL) with nine subclasses. Evolutionarily, although almost all NBS genes were retained by purifying selection, the duplication style was different: CNLs were mainly expanded by dispersed duplication, while TNLs were mainly expanded by tandem duplication. Structurally, the order of the eight conserved motifs in the NBS domain was more conserved than their amino acid sequences. Functionally, differential expression analysis showed that many of NBS genes could play an actual role in fighting pathogens by conferring broad-spectrum resistance, which may have contributed to the genetic basis favoring adaptation to various environments during the evolutionary of A. trifoliata. Therefore, this study paves the way for improving disease resistance during the domestication of A. trifoliata and further enriches the available information about NBS genes, especially in basal eudicots.
Data Availability Statement
The datasets presented in this study can be found in online repositories. The names of the repository/repositories and accession number(s) can be found in the article/Supplementary Material.
Author Contributions
XY and PL conceived and designed the project. SZ obtained the data. XY analyzed the data and wrote the manuscript. CC, WC, HuY, HaY, JG, FT, TR, JS, MZ, and PF participated in the data analysis and discussion. PL revised the manuscript. All authors contributed to the discussion of the results, reviewed the manuscript and approved the final article.
Funding
This research was supported by the National Agricultural Park Innovation Project from the Science and Technology Department of Sichuan Province, China (2019YFN0032), Applied Basic Research Project from the Science and Technology Department of Sichuan Province, China (2020YJ0331) and the Foundation of Key Research and Development Projects (2019YFS0020). This work was supported by the Science and Technology Department of Sichuan Province and the Beau of Yaan.
Conflict of Interest
WC and HaY were employed by the company Sichuan Akebiatrifoliata Biotechnology Co., Ltd.
The remaining authors declare that the research was conducted in the absence of any commercial or financial relationships that could be construed as a potential conflict of interest.
Publisher’s Note
All claims expressed in this article are solely those of the authors and do not necessarily represent those of their affiliated organizations, or those of the publisher, the editors and the reviewers. Any product that may be evaluated in this article, or claim that may be made by its manufacturer, is not guaranteed or endorsed by the publisher.
Supplementary Material
The Supplementary Material for this article can be found online at: https://www.frontiersin.org/articles/10.3389/fpls.2021.758559/full#supplementary-material
Supplementary Figure 1 | The complete tree of CNL subclass of A. trifoliata NBS proteins.
Supplementary Table 1 | Detailed features of identified NBS genes in A. trifoliata.
Supplementary Table 2 | Differential arrangement of conserved motifs in NBS domain.
Supplementary Table 3 | Discovered Motifs Statistics of NBS domain in A. trifoliata NBS genes.
Supplementary Table 4 | Reference NBS genes identified from other species for reconstructed phylogenetic trees.
Supplementary Table 5 | Ka Ks and Ka/Ks values of A. trifoliata NBS gene pairs.
Supplementary Table 6 | NBS genes Expression profile of the three A. trifoliata tissues and four development stages.
Supplementary Table 7 | TNLs and CNLs for both exon number and gene length in 7 dicots.
Footnotes
- ^ https://www.ncbi.nlm.nih.gov/bioproject/?term=PRJNA671772
- ^ https://blast.ncbi.nlm.nih.gov/Blast.cgi
- ^ https://www.ebi.ac.uk/Tools/hmmer/
- ^ http://pfam.sanger.ac.uk/
- ^ https://www.ncbi.nlm.nih.gov/Structure/cdd/
- ^ http://coiledcoils.chm.bris.ac.uk/Scorer/
- ^ http://meme-suite.org/tools/meme
- ^ https://github.com/CJ-Chen/TBtools
- ^ https://github.com/rambaut/figtree/releases
- ^ https://www.ncbi.nlm.nih.gov/biosample
References
Akoz, G., and Nordborg, M. (2019). The Aquilegia genome reveals a hybrid origin of core eudicots. Genome Biol. 20:256. doi: 10.1186/s13059-019-1888-8
Alamery, S., Tirnaz, S., Bayer, P., Tollenaere, R., Chaloub, B., Edwards, D., et al. (2018). Genome-wide identification and comparative analysis of NBS-LRR resistance genes in Brassica napus. Crop Pasture Sci. 69, 79–93. doi: 10.1071/cp17214
Ameline-Torregrosa, C., Wang, B. B., O’Bleness, M. S., Deshpande, S., Zhu, H., Roe, B., et al. (2008). Identification and characterization of nucleotide-binding site-leucine-rich repeat genes in the model plant Medicago truncatula. Plant Physiol. 146, 5–21. doi: 10.1104/pp.107.104588
Andersen, E. J., Ali, S., Byamukama, E., Yen, Y., and Nepal, M. P. (2018). Disease Resistance Mechanisms in Plants. Genes 9:339. doi: 10.3390/genes9070339
Andersen, E. J., Nepal, M. P., Purintun, J. M., Nelson, D., Mermigka, G., and Sarris, P. F. (2020). Wheat Disease Resistance Genes and Their Diversification Through Integrated Domain Fusions. Front. Genet. 11:898. doi: 10.3389/fgene.2020.00898
Baumgarten, A., Cannon, S., Spangler, R., and May, G. (2003). Genome-level evolution of resistance genes in Arabidopsis thaliana. Genetics 165, 309–319. doi: 10.1023/A:1024446910161
Bent, A. F. (1996). Plant Disease Resistance Genes: function Meets Structure. Plant Cell 8, 1757–1771. doi: 10.1105/tpc.8.10.1757
Bent, A. F., Kunkel, B. N., Dahlbeck, D., Brown, K. L., Schmidt, R., Giraudat, J., et al. (1994). RPS2 of Arabidopsis thaliana: a leucine-rich repeat class of plant disease resistance genes. Science 265, 1856–1860. doi: 10.1126/science.8091210
Bonardi, V., Tang, S., Stallmann, A., Roberts, M., Cherkis, K., and Dangl, J. L. (2011). Expanded functions for a family of plant intracellular immune receptors beyond specific recognition of pathogen effectors. Proc. Natl. Acad. Sci. U. S. A. 108, 16463–16468. doi: 10.1073/pnas.1113726108
Chen, C., Chen, H., Zhang, Y., Thomas, H. R., Frank, M. H., He, Y., et al. (2020). TBtools: an Integrative Toolkit Developed for Interactive Analyses of Big Biological Data. Mol. Plant 13, 1194–1202. doi: 10.1016/j.molp.2020.06.009
Chen, W., Zhong, S., Chen, H., and Luo, P. (2017). Studies about the Utilization and Development of Akebia trifoliata and Its Targeted Poverty Alleviation Strategies —A Case Study in Shimian County, Sichuan Province. Chin. Wild Plant Resour. 36, 71–74. doi: 10.3969/j.issn.1006-9690.2017.05.016
Cheng, S., Ke, J., Tan, L. T., Medison, R. G., Liang, P., Gong, T., et al. (2020). First Report of Leaf Spot on Akebia trifoliata Caused by Phytophthora nicotianae in China. Plant Dis. doi: 10.1094/PDIS-06-20-1243-PDN [Online ahead of print].
Collier, S. M., Hamel, L. P., and Moffett, P. (2011). Cell death mediated by the N-terminal domains of a unique and highly conserved class of NB-LRR protein. Mol. Plant Microbe Interact. 24, 918–931. doi: 10.1094/MPMI-03-11-0050
Collier, S. M., and Moffett, P. (2009). NB-LRRs work a “bait and switch” on pathogens. Trends Plant Sci. 14, 521–529. doi: 10.1016/j.tplants.2009.08.001
Die, J. V., Castro, P., Millan, T., and Gil, J. (2018a). Segmental and Tandem Duplications Driving the Recent NBS-LRR Gene Expansion in the Asparagus Genome. Genes 9:568. doi: 10.3390/genes9120568
Die, J. V., Roman, B., Qi, X., and Rowland, L. J. (2018b). Genome-scale examination of NBS-encoding genes in blueberry. Sci. Rep. 8:3429. doi: 10.1038/s41598-018-21738-7
Dodds, P. N., Lawrence, G. J., and Ellis, J. G. (2001). Six amino acid changes confined to the leucine-rich repeat beta-strand/beta-turn motif determine the difference between the P and P2 rust resistance specificities in flax. Plant Cell 13, 163–178. doi: 10.1105/tpc.13.1.163
Dudley, W. N., Benuzillo, J. G., and Carrico, M. S. (2004). SPSS and SAS programming for the testing of mediation models. Nurs. Res. 53, 59–62. doi: 10.1097/00006199-200401000-00009
Garibaldi, A., Bertetti, D., and Gullino, M. L. (2004). First Report of Powdery Mildew (Oidium sp.) on Akebia quinata in Italy. Plant Dis. 88:682. doi: 10.1094/pdis.2004.88.6.682d
Goyal, N., Bhatia, G., Sharma, S., Garewal, N., Upadhyay, A., Upadhyay, S. K., et al. (2020). Genome-wide characterization revealed role of NBS-LRR genes during powdery mildew infection in Vitis vinifera. Genomics 112, 312–322. doi: 10.1016/j.ygeno.2019.02.011
Hoang, D. T., Chernomor, O., von Haeseler, A., Minh, B. Q., and Vinh, L. S. (2018). UFBoot2: improving the Ultrafast Bootstrap Approximation. Mol. Biol. Evol. 35, 518–522. doi: 10.1093/molbev/msx281
Hong, X., Chen, S., Wang, L., Liu, B., Yang, Y., Tang, X., et al. (2021). First report of Nigrospora sphaerica causing fruit dried-shrink disease in Akebia trifoliata from China. Plant Dis. doi: 10.1094/PDIS-11-20-2471-PDN [Online ahead of print].
Huang, C. L., Hwang, S. Y., Chiang, Y. C., and Lin, T. P. (2008). Molecular evolution of the Pi-ta gene resistant to rice blast in wild rice (Oryza rufipogon). Genetics 179, 1527–1538. doi: 10.1534/genetics.108.089805
Huang, H., Liang, J., Tan, Q., Ou, L., Li, X., Zhong, C., et al. (2021). Insights into triterpene synthesis and unsaturated fatty-acid accumulation provided by chromosomal-level genome analysis of Akebia trifoliata subsp. australis. Hortic. Res. 8:33. doi: 10.1038/s41438-020-00458-y
Hurst, L. D. (2002). The Ka/Ks ratio: diagnosing the form of sequence evolution. Trends Genet. 18:486. doi: 10.1016/s0168-9525(02)02722-1
Jones, J. D., Vance, R. E., and Dangl, J. L. (2016). Intracellular innate immune surveillance devices in plants and animals. Science 354:aaf6395. doi: 10.1126/science.aaf6395
Jupe, F., Pritchard, L., Etherington, G. J., Mackenzie, K., Cock, P. J., Wright, F., et al. (2012). Identification and localisation of the NB-LRR gene family within the potato genome. BMC Genomics 13:75. doi: 10.1186/1471-2164-13-75
Kalyaanamoorthy, S., Minh, B. Q., Wong, T. K. F., von Haeseler, A., and Jermiin, L. S. (2017). ModelFinder: fast model selection for accurate phylogenetic estimates. Nat. Methods 14, 587–589. doi: 10.1038/nmeth.4285
Kim, D., Paggi, J. M., Park, C., Bennett, C., and Salzberg, S. L. (2019). Graph-based genome alignment and genotyping with HISAT2 and HISAT-genotype. Nat. Biotechnol. 37, 907–915. doi: 10.1038/s41587-019-0201-4
Kourelis, J., and van der Hoorn, R. A. L. (2018). Defended to the Nines: 25 Years of Resistance Gene Cloning Identifies Nine Mechanisms for R Protein Function. Plant Cell 30, 285–299. doi: 10.1105/tpc.17.00579
Kumar, S., Stecher, G., Li, M., Knyaz, C., and Tamura, K. (2018). MEGA X: molecular Evolutionary Genetics Analysis across Computing Platforms. Mol. Biol. Evol. 35, 1547–1549. doi: 10.1093/molbev/msy096
Leister, D. (2004). Tandem and segmental gene duplication and recombination in the evolution of plant disease resistance genes. Trends Genet. 20, 116–122. doi: 10.1016/j.tig.2004.01.007
Li, H., Handsaker, B., Wysoker, A., Fennell, T., Ruan, J., Homer, N., et al. (2009). The Sequence Alignment/Map format and SAMtools. Bioinformatics 25, 2078–2079. doi: 10.1093/bioinformatics/btp352
Li, J., Ding, J., Zhang, W., Zhang, Y., Tang, P., Chen, J. Q., et al. (2010). Unique evolutionary pattern of numbers of gramineous NBS-LRR genes. Mol. Genet. Genomics 283, 427–438. doi: 10.1007/s00438-010-0527-6
Li, L., Yao, X. H., Zhong, C. H., Chen, X. Z., and Huang, H. W. (2010). Akebia: a Potential New Fruit Crop in China. Hortscience 45, 4–10. doi: 10.21273/Hortsci.45.1.4
Liu, G. Y., Ma, S. C., Zheng, J., Zhang, J., and Lin, R. C. (2007). Two new triterpenoid saponins from Akebia quinata (Thunb.) decne. J. Integr. Plant Biol. 49, 196–201. doi: 10.1111/j.1744-7909.2007.00362.x
Liu, S., Liu, Y., Yang, X., Tong, C., Edwards, D., Parkin, I. A., et al. (2014). The Brassica oleracea genome reveals the asymmetrical evolution of polyploid genomes. Nat. Commun. 5:3930. doi: 10.1038/ncomms4930
Liu, Z., Xie, J., Wang, H., Zhong, X., Li, H., Yu, J., et al. (2019). Identification and expression profiling analysis of NBS-LRR genes involved in Fusarium oxysporum f.sp. conglutinans resistance in cabbage. 3 Biotech 9:202. doi: 10.1007/s13205-019-1714-8
Lowe, R., Shirley, N., Bleackley, M., Dolan, S., and Shafee, T. (2017). Transcriptomics technologies. PLoS Comput. Biol. 13:e1005457. doi: 10.1371/journal.pcbi.1005457
Lozano, R., Hamblin, M. T., Prochnik, S., and Jannink, J. L. (2015). Identification and distribution of the NBS-LRR gene family in the Cassava genome. BMC Genomics 16:360. doi: 10.1186/s12864-015-1554-9
Ma, J., Zhang, C., Yang, D., Xie, Y., and Sun, H. (2020). Research Progress of Sweet Potato Virus Disease in China. J. Hebei Agric. Sci. 24, 51–56. doi: 10.12148/hbnykx.20200051
Ma, Y., Chhapekar, S. S., Lu, L., Oh, S., Singh, S., Kim, C. S., et al. (2021). Genome-wide identification and characterization of NBS-encoding genes in Raphanus sativus L. and their roles related to Fusarium oxysporum resistance. BMC Plant Biol. 21:47. doi: 10.1186/s12870-020-02803-8
Meyers, B. C., Kozik, A., Griego, A., Kuang, H., and Michelmore, R. W. (2003). Genome-wide analysis of NBS-LRR-encoding genes in Arabidopsis. Plant Cell 15, 809–834. doi: 10.1105/tpc.009308
Mun, J. H., Yu, H. J., Park, S., and Park, B. S. (2009). Genome-wide identification of NBS-encoding resistance genes in Brassica rapa. Mol. Genet. Genomics 282, 617–631. doi: 10.1007/s00438-009-0492-0
Nepal, M. P., Andersen, E. J., Neupane, S., and Benson, B. V. (2017). Comparative Genomics of Non-TNL Disease Resistance Genes from Six Plant Species. Genes 8:249. doi: 10.3390/genes8100249
Neupane, S., Andersen, E. J., Neupane, A., and Nepal, M. P. (2018). Genome-Wide Identification of NBS-Encoding Resistance Genes in Sunflower (Helianthus annuus L.). Genes 9:384. doi: 10.3390/genes9080384
Nguyen, L. T., Schmidt, H. A., von Haeseler, A., and Minh, B. Q. (2015). IQ-TREE: a fast and effective stochastic algorithm for estimating maximum-likelihood phylogenies. Mol. Biol. Evol. 32, 268–274. doi: 10.1093/molbev/msu300
Pan, H., Deng, L., Feng, D., Zhong, C., and Li, L. (2020). First Report of Anthracnose Caused by Colletotrichum gloeosporioides on Akebia trifoliata in China. Plant Dis. doi: 10.1094/PDIS-07-20-1525-PDN [Online ahead of print].
Porter, B. W., Paidi, M., Ming, R., Alam, M., Nishijima, W. T., and Zhu, Y. J. (2009). Genome-wide analysis of Carica papaya reveals a small NBS resistance gene family. Mol. Genet. Genomics 281, 609–626. doi: 10.1007/s00438-009-0434-x
Qian, L. H., Zhou, G. C., Sun, X. Q., Lei, Z., Zhang, Y. M., Xue, J. Y., et al. (2017). Distinct Patterns of Gene Gain and Loss: diverse Evolutionary Modes of NBS-Encoding Genes in Three Solanaceae Crop Species. G3 7, 1577–1585. doi: 10.1534/g3.117.040485
Scortichini, M., Marcelletti, S., Ferrante, P., Petriccione, M., and Firrao, G. (2012). Pseudomonas syringae pv. actinidiae: a re-emerging, multi-faceted, pandemic pathogen. Mol. Plant Pathol. 13, 631–640. doi: 10.1111/j.1364-3703.2012.00788.x
Shao, Z. Q., Xue, J. Y., Wang, Q., Wang, B., and Chen, J. Q. (2019). Revisiting the Origin of Plant NBS-LRR Genes. Trends Plant Sci. 24, 9–12. doi: 10.1016/j.tplants.2018.10.015
Shao, Z. Q., Xue, J. Y., Wu, P., Zhang, Y. M., Wu, Y., Hang, Y. Y., et al. (2016). Large-Scale Analyses of Angiosperm Nucleotide-Binding Site-Leucine-Rich Repeat Genes Reveal Three Anciently Diverged Classes with Distinct Evolutionary Patterns. Plant Physiol. 170, 2095–2109. doi: 10.1104/pp.15.01487
Song, H., Guo, Z., Hu, X., Qian, L., Miao, F., Zhang, X., et al. (2019). Evolutionary balance between LRR domain loss and young NBS-LRR genes production governs disease resistance in Arachis hypogaea cv. Tifrunner. BMC Genomics 20:844. doi: 10.1186/s12864-019-6212-1
Sun, Y., Moore, M. J., Zhang, S., Soltis, P. S., Soltis, D. E., Zhao, T., et al. (2016). Phylogenomic and structural analyses of 18 complete plastomes across nearly all families of early-diverging eudicots, including an angiosperm-wide analysis of IR gene content evolution. Mol. Phylogenet. Evol. 96, 93–101. doi: 10.1016/j.ympev.2015.12.006
Tameling, W. I., Elzinga, S. D., Darmin, P. S., Vossen, J. H., Takken, F. L., Haring, M. A., et al. (2002). The tomato R gene products I-2 and MI-1 are functional ATP binding proteins with ATPase activity. Plant Cell 14, 2929–2939. doi: 10.1105/tpc.005793
Traut, T. W. (1994). The functions and consensus motifs of nine types of peptide segments that form different types of nucleotide-binding sites. Eur. J. Biochem. 222, 9–19. doi: 10.1111/j.1432-1033.1994.tb18835.x
Tuskan, G. A., Difazio, S., Jansson, S., Bohlmann, J., Grigoriev, I., Hellsten, U., et al. (2006). The genome of black cottonwood, Populus trichocarpa (Torr. & Gray). Science 313, 1596–1604. doi: 10.1126/science.1128691
Wang, D., Zhang, Y., Zhang, Z., Zhu, J., and Yu, J. (2010). KaKs_Calculator 2.0: a toolkit incorporating gamma-series methods and sliding window strategies. Genomics Proteomics Bioinformatics 8, 77–80. doi: 10.1016/s1672-0229(10)60008-3
Wang, W., Zhang, Y., Wen, Y., Berkey, R., Ma, X., Pan, Z., et al. (2013). A comprehensive mutational analysis of the Arabidopsis resistance protein RPW8.2 reveals key amino acids for defense activation and protein targeting. Plant Cell 25, 4242–4261. doi: 10.1105/tpc.113.117226
Wang, Y., Tang, H., Debarry, J. D., Tan, X., Li, J., Wang, X., et al. (2012). MCScanX: a toolkit for detection and evolutionary analysis of gene synteny and collinearity. Nucleic Acids Res. 40:e49. doi: 10.1093/nar/gkr1293
Xiao, S., Ellwood, S., Calis, O., Patrick, E., Li, T., Coleman, M., et al. (2001). Broad-spectrum mildew resistance in Arabidopsis thaliana mediated by RPW8. Science 291, 118–120. doi: 10.1126/science.291.5501.118
Xue, J. Y., Zhao, T., Liu, Y., Liu, Y., Zhang, Y. X., Zhang, G. Q., et al. (2019). Genome- Wide Analysis of the Nucleotide Binding Site Leucine-Rich Repeat Genes of Four Orchids Revealed Extremely Low Numbers of Disease Resistance Genes. Front. Genet. 10:1286. doi: 10.3389/fgene.2019.01286
Ye, Y. F., Jiang, N., Fu, G., Liu, W., Hu, F. Y., Liu, L. H., et al. (2013). First Report of Corynespora cassiicola Causing Leaf Spot on Akebia trifoliate. Plant Dis. 97:1659. doi: 10.1094/PDIS-04-13-0454-PDN
Zhang, Y. M., Chen, M., Sun, L., Wang, Y., Yin, J., Liu, J., et al. (2020). Genome-Wide Identification and Evolutionary Analysis of NBS-LRR Genes From Dioscorea rotundata. Front. Genet. 11:484. doi: 10.3389/fgene.2020.00484
Zhang, Y. M., Shao, Z. Q., Wang, Q., Hang, Y. Y., Xue, J. Y., Wang, B., et al. (2016). Uncovering the dynamic evolution of nucleotide-binding site-leucine-rich repeat (NBS-LRR) genes in Brassicaceae. J. Integr. Plant Biol. 58, 165–177. doi: 10.1111/jipb.12365
Zhang, Z., Li, X., and Liu, Y. (2015). Biological characteristics and biological control of leaf spot disease pathogen on Akebia trifoliata. J. shaanxi Normal Univ. 43, 61–66. doi: 10.15983/j.cnki.jsnu.2015.04.353
Zhao, Y., Weng, Q., Song, J., Ma, H., Yuan, J., Dong, Z., et al. (2016). Bioinformatics Analysis of NBS-LRR Encoding Resistance Genes in Setaria italica. Biochem. Genet. 54, 232–248. doi: 10.1007/s10528-016-9715-3
Zhou, J., and Zhou, Z. (2017). Anthrax of apple and its control technology. Shanxi Fruits 4, 76–77. doi: 10.16010/j.cnki.14-1127/s.2019.04.028
Keywords: Akebia trifoliata, NBS genes, gene duplication, pathogen, genome-wide analysis
Citation: Yu X, Zhong S, Yang H, Chen C, Chen W, Yang H, Guan J, Fu P, Tan F, Ren T, Shen J, Zhang M and Luo P (2021) Identification and Characterization of NBS Resistance Genes in Akebia trifoliata. Front. Plant Sci. 12:758559. doi: 10.3389/fpls.2021.758559
Received: 16 August 2021; Accepted: 08 October 2021;
Published: 29 October 2021.
Edited by:
Maria Raffaella Ercolano, University of Naples Federico II, ItalyReviewed by:
Vishal Acharya, Institute of Himalayan Bioresource Technology (CSIR), IndiaGuangyi Fan, Beijing Genomics Institute (BGI), China
Copyright © 2021 Yu, Zhong, Yang, Chen, Chen, Yang, Guan, Fu, Tan, Ren, Shen, Zhang and Luo. This is an open-access article distributed under the terms of the Creative Commons Attribution License (CC BY). The use, distribution or reproduction in other forums is permitted, provided the original author(s) and the copyright owner(s) are credited and that the original publication in this journal is cited, in accordance with accepted academic practice. No use, distribution or reproduction is permitted which does not comply with these terms.
*Correspondence: Peigao Luo, lpglab@sicau.edu.cn