 Qi Zhang
 Yajun Yun1
 Zhiren Wang
- 1Peking University HuiLongGuan Clinical Medical School, Beijing HuiLongGuan Hospital, Beijing, China
- 2College of Basic Medical and Clinical Pharmacy, China Pharmaceutical University, Nanjing, China
The microbiota–gut–brain axis plays a critical role in the pathogenesis of major depressive disorder (MDD) and related subclinical symptoms. However, studies on the gut microbiota in MDD are inconsistent, and data on MDD's effects on sleep are lacking. This study aimed to analyze the gut microbiota composition and sleep quality of patients with MDD. We performed 16S rRNA sequencing of stool samples from 36 patients with MDD and 45 healthy controls (HC). Sleep quality was assessed using the Pittsburgh Sleep Quality Index, depressive severity with the Hamilton Depression Scale, and insomnia severity using the Insomnia Severity Index. Forty-eight microbiota targets showed significant differences between MDD and HC. In MDD, six microbiota targets were associated with the severity of depression, 11 with sleep quality, and 3 with sleep severity. At the genus level, Dorea was simultaneously related to depression and sleep quality, while Intestinibacter was more closely related to sleep problems. Coprococcus and Intestinibacter were associated with sleep quality independent of the severity of depression. In conclusion, the present findings enable a better understanding of the relationship between gut microbiota and MDD-related symptoms. Gut microbiota alterations may become potential biomarkers and/or treatment targets for sleep quality in MDD.
Introduction
Major depressive disorder (MDD) is a common psychiatric illness influencing ~300 million people (1), with lifetime prevalence rates of about 10.8% as reported in a survey of 30 countries (2) and exerting a huge clinical and social burden.
Several hypotheses, including the monoamine hypothesis, the subclinical inflammation hypothesis (3, 4), and hypothalamic–pituitary axis (HPA) dysregulation, have been proposed to explain its underlying etiology (5). Another promising hypothesis is gut–brain axis (GBA) dysfunction (6). The gut microbiota affects both the gastrointestinal system and central nervous system (CNS) function. Bacteria can produce neurotransmitters such as GABA, dopamine, and serotonin which affect emotional and sleep states (7). Because of their neuroactive properties and their effects on other gut–brain signaling pathways, including immune and endocrine systems, the main metabolites produced by intestinal dietary fiber bacterial fermentation, short-chain fatty acids (SCFAs), are speculated to be directly or indirectly involved in communication along the brain–gut axis (8, 9).
Several studies have attempted to prove the association between the gut microbiota and depression, but with inconsistent results. For instance, Jiang et al. found that the gut microbiome diversity in MDD was higher than that in HC, and the proportion of Bacteroides, Proteus, and Actinomycetes was significantly higher than in HC (10). Chung et al. found no significant difference in bacterial abundance and diversity between the two groups, but found increasing Actinobacteria and Firmicutes and decreasing Bacteroidetes and Proteobacteria in MDD. Furthermore, they found that the severity of depression correlated with bacterial composition (11). Aside from anhedonia and the enduring depressed mood, sleep disturbance is a common issue for MDD patients, present during the whole course of the disease even as a residual symptom. More than 90% of patients with depression have sleep disorders, and a small number of patients complain of drowsiness (12). Previous hypothesis considered that sleep and depression were a one-way causal relationship in which depression leads to sleep disorders, but new evidence seems to claim a bidirectional relationship between them. However, at present, no universally acknowledged theory explains the pathophysiologic mechanism between depression and sleep. In the past decade, known theories including the S-deficiency hypothesis (13), HPA dysfunction hypothesis (14), circadian rhythm (15, 16), rapid eye movement (REM) phase advance hypothesis (17), and neuroimmune mechanisms (18) can only partly explain the cause of insomnia in depression. Therefore, a novel mechanism involving the gut–brain axis has been proposed (12, 13, 19).
There is considerable evidence indicating that gut microbiome can regulate sleep and mental states (20). Previous studies have shown a positive association between sleep quality, the F/B ratio, a greater relative abundance of Blautia and Ruminococcus (Firmicutes), and lower proportions of Prevotella, Bacteroidetes, and TM7-3a (21, 22). Despite the lack of research on this topic in the context of depression, three cross-sectional studies analyzing sleep and intestinal microbiota in bipolar disorder and irritable bowel syndrome found negative correlations between Faecalibacterium, Lactobacillus, and sleep quality (23, 24) among bipolar disorder patients, while baseline intestinal and gut microbiota diversity had a negative correlation with the Hamilton Depression Rating Scale (HAM-D) score in irritable bowel syndrome (25). Therefore, to fill the evidence gap in MDD, the current study focused on (1) characterizing the gut microbiota distributions of participants with MDD and (2) determining whether gut bacteria differentially correlate with sleep quality.
Methods and Materials
Participants
We recruited 36 patients with MDD and 45 healthy controls from inpatients at Peking University Huilongguan Clinical Medical School, Beijing Huilongguan Hospital between January 2020 and October 2020. The MDD group inclusion criteria were as follows: (1) 18–55 years of age, (2) diagnosed with MDD and a depressive episode of at least moderate severity according to ICD-10 criteria (F32.1, F32.2, F33.1, F33.2) by two trained psychiatrists (26), (3) total scores of the 17-item version HAM-D >17 (26), and (4) drug naive or without treatment for ≥1 week and without long-acting antipsychotics >6 months before the study. Healthy controls were recruited from nearby communities and were screened out with any history of psychiatric disorders or psychosis among their first-degree relatives. The candidates of HC were hospital staff, care workers, and patients' accompanying family members and friends with no consanguinity. For all participants in our study, physical examination results, laboratory test results (blood and urine analyses), imaging results, and past history were collected before admission to exclude those with history of persistent infection, allergy, or inflammatory diseases whether systematic or local inflammation. Exclusion criteria for both patients and control groups were as follows: (1) a prior medical history of central nervous system disease, severe head injury, substance abuse or dependence, intellectual disability, and other severe medical records; (2) recent use of antibiotics or probiotic synbiotics within 30 days of study participation; (3) history of gastrointestinal surgery or severe congenital abnormalities; (4) night shift or rotating schedule within the past 3 months; (5) history of electroconvulsive therapy within the previous 6 months; (6) pregnancy; and (7) comorbidities associated with other sleep disorders (e.g., sleep apnea).
All candidates were subjected to similar living conditions during the entire hospitalization period and received the same hospital diet and followed a similar daily routine.
This study was approved by the Institutional Review Board of Beijing Huilongguan Hospital (Beijing Huilongguan Ethics Committee # 2019-43), and all participants provided written informed consent.
Data Collection
All participants were interviewed on the day of admission. Patients' clinical symptoms were assessed by trained psychiatrists or psychologists using the 17-item HAM-D. The Pittsburgh Sleep Quality Index (PSQI) was assessed based on self-reported (subjective) sleep quality, including sleep duration, onset latency, sleep efficiency, sleep quality, sleep disturbance, sedative-hypnotic drugs, daily function, and total score over the past month (27). We used the Insomnia Severity Index (ISI) to evaluate the subjective perception of insomnia severity (28). As a seven-item and five-point Likert self-report questionnaire, the global score can range from 0 to 28 and is classified as follows: not clinically significant insomnia (0–7), subthreshold insomnia (8–14), moderate insomnia (15–21), and severe insomnia (22–28).
Fecal samples (≥1 g) collected within 2 days after admission or after the elution period were placed in a sample tube containing 2 ml of RNA stabilization solution (TinyGen, Bio-Tech, Shanghai, China) and stored at −80°C until DNA extraction.
Details on the methods for library preparation and 16S gene amplicon sequencing are provided in the Supplementary Methods. After sequence processing, according to different similarity levels, all sequences were divided into operational taxonomic units (OTUs), which were usually based on biological information statistical analysis at 97% similarity level.
Determination of Bacterial Counts
DNA amplification was performed in the V4–V5 regions of the 16S rRNA gene and barcode sequences were added. Unique fusion primers were designed based on the general primers (515F 5′-GTGCCAGCMGCCGCGGTAA-3′, 926R 5′-CCGTCAATTCMTTTGAGTTT-3′). Sequencing was performed with Illumina 5′ (Illumina, San Diego, CA, USA) following the manufacturer's instructions (29). One unit Phusion DNA Polymerase (New England Biolabs, USA) was used to complete the initial PCR reactions. A DNA gel extraction kit (Axygen, USA) was used to purify the barcodes. PCR products and the FTC-3000™ real-time PCR (Funglyn, Shanghai) were used for quantification. Thermal cycling included an initial denaturation at 94°C for 2 min, followed by 25 cycles of denaturation at 94°C for 30 s, annealing at 56°C for 30 s, elongation at 72°C for 30 s, and a final extension at 72°C for 5 min. The PCR products from different samples were mixed at equal ratios. Eight PCR cycles were used to incorporate two unique barcodes to either of the ends of the amplicons. Finally, we used a DNA gel extraction kit (Axygen, USA) to purify the library and a 2 × 250-bp paired-end sequencing on the NovaSeq platform using NovaSeq 6000 SP 500 Cycle Reagent Kit (Illumina, USA) at TinyGen Bio-Tech (Shanghai) Co., Ltd.
Raw pyrosequencing reads were run through Trimmomatic (version 0.35) (30), and in order to remove low-quality base pairs, we used the parameters—SLIDINGWINDOW: 50:20, MINLEN: 50—while the FLASH program (version 1.2.11) was used to process default parameters. Low-quality contigs were removed based on the screen.seqs command using the following filtering parameters: maxambig = 0, minlength = 200, maxlength = 485, maxhomop = 8. A combination of software mothur (31) (version 1.33.3), UPARSE (usearch version v8.1.1756, http://drive5.com/uparse/) (32), and R (version 3.6.0) was used as quality filter. After sequence processing, according to different similarity levels, all sequences were divided into OTUs. Since OTUs are usually based on biological information statistical analysis at 97% similarity level, singleton OTUs were deleted using the UPARSE pipeline (http://drive5.com/uparse/).
Bioinformatics and Statistical Analyses
For alpha diversity (Shannon, Simpson, and evenness indices), rarefaction curves were calculated using mothur and plotted by R. Phylogenetic beta diversity measures, weighted and unweighted UniFrac distance matrix were calculated using mothur and visualized with principal coordinate analysis (PCoA). Bray–Curtis and Jaccard metrics were calculated using the vegan package in R and visualized by R as UniFrac analysis. To compare within- and between-group similarity, analysis of similarity (ANOSIM) was performed with “vegan” package of R, based on (un) Weighted.unifrac distance. Canoco 5 RDA software was used to analyze the correlation between clinical indices and intestinal community variation.
Linear discriminant analysis effect size (LEfSe) analysis was used to identify taxa significantly enriched in the MDD and HC groups. The linear discriminant analysis (LDA) score was computed for taxa differentially abundant between the two groups. A taxon at p < 0.05 (Kruskal–Wallis test) and log10[LDA] ≥2.0 (or ≤ -2.0) were considered significant.
Demographic and clinical variables were compared between MDD and HC using the chi-square test for categorical variables, the independent-samples t-test for normal continuous variables, and the Mann–Whitney U-test for non-normal continuous variables. Taxa that have abundance >0.01% were reserved for analysis. The MDD group and HC were compared at the levels of phylum, class, order, family, genus, and species by the Wilcoxon signed-rank test. We performed partial correlations (adjusted for age, sex, and BMI) between bacterial counts and the total HAM-D-17 score. Moreover, partial correlation analysis (adjusted for age, sex, and BMI) was used to examine the correlations between bacterial counts and other variables such as total PSQI and ISI scores. Linear regression analyses were used to assess the most influential taxa on sleep quality in MDD at the genus and species levels after correcting for age, gender, BMI, and HAM-D scores. Differences were considered statistically significant when the two-tailed p < 0.05. False discovery rate (FDR, Benjamini–Hochberg) was used for perform multiple testing. p < 0.05 was considered significant. Analysis was performed using the Statistical Package for the Social Sciences version 25.0 (IBM Corp, Chicago, Illinois, USA).
Results
Demographic and Clinical Characteristics
Stool samples were collected from 36 patients with MDD and 45 healthy controls. Demographic and clinical characteristics were displayed in Table 1. There were no significant demographic differences between MDD and HC. However, the differences in HAM-D, ISI, and PSQI between the MDD and HC groups were significant. The mean age of onset was 31.39 ± 13.53 years, and illness duration was 5.36 ± 6.24 years. By thorough clinical tests, including blood and imaging examinations, participants had no local or systemic inflammation. We also collected the data of high-sensitivity C-reactive protein (hs-CRP) to exclude inflammation. They were all below the clinical threshold, and there was no significant difference between the two groups (Table 1).
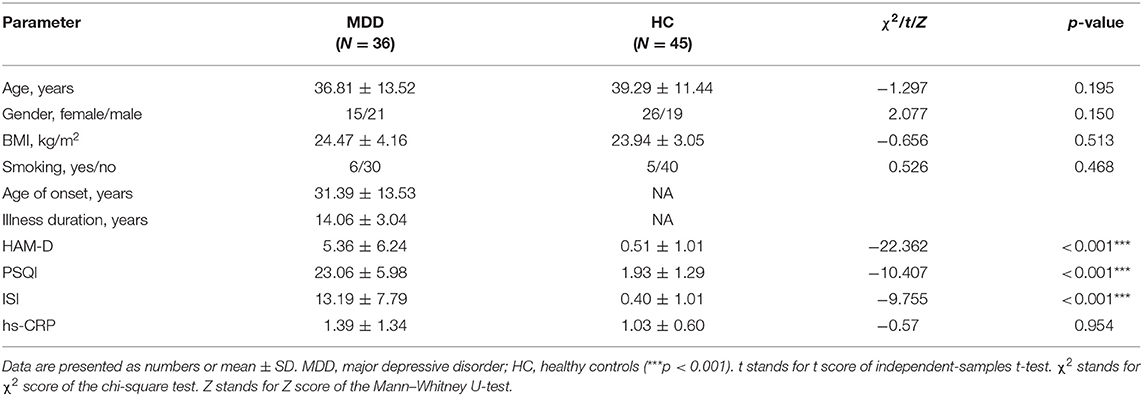
Table 1. Demographic and clinical characteristics in MDD patients and HC.
Gut Microbiota Diversity Index Between MDD and HC
Chao, ACE, Shannon, and Simpson indices were used to compare the alpha diversity between the MDD and HC groups. The Chao and ACE diversity indices reflect microbial species richness, while Shannon and Simpson diversity indices reflect community richness and evenness. No difference in alpha diversity between patients with MDD and HC was observed (p > 0.05). Differences in community structure dispersion between the two groups were measured using Bray–Curtis analysis (Figure 1A), and community membership dispersion was assessed by Jaccard dissimilarity (Figure 1B). We used Canoco 5 RDA software to analyze the correlation between clinical indices and intestinal community variation. The relationship between the distribution of microflora and clinical indices is shown in Figure 2. PSQI, HAM-D, and ISI played important roles on the distribution of microflora in MDD patients, while BMI and age played important roles on HC. Among them, HAM-D has the most significant effect on community variation (p < 0.05) (Supplementary Table 5). Furthermore, unweighted and weighted ANOSIMs revealed significant differences between the two groups. Beta diversity was measured based on the unweighted (r = 0.067, p = 0.007) and the weighted (r = 0.075, p = 0.007) UniFrac distance matrix of the differences between groups, as shown in Figure 3, suggesting dissimilar microbiota composition.
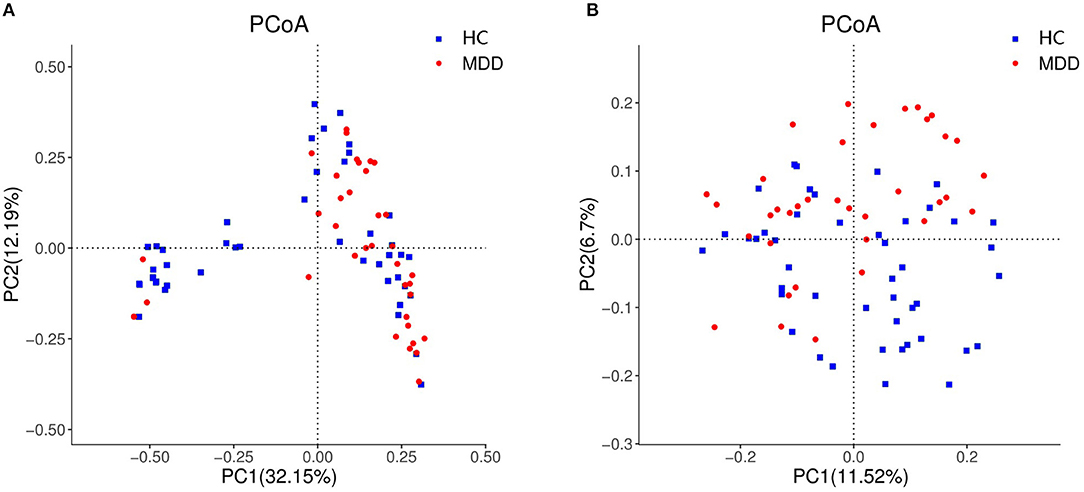
Figure 1. Beta diversity as a principal coordinate analysis (PCoA) plot based on Bray–Curtis dissimilarity (A) and Jaccard dissimilarity (B).
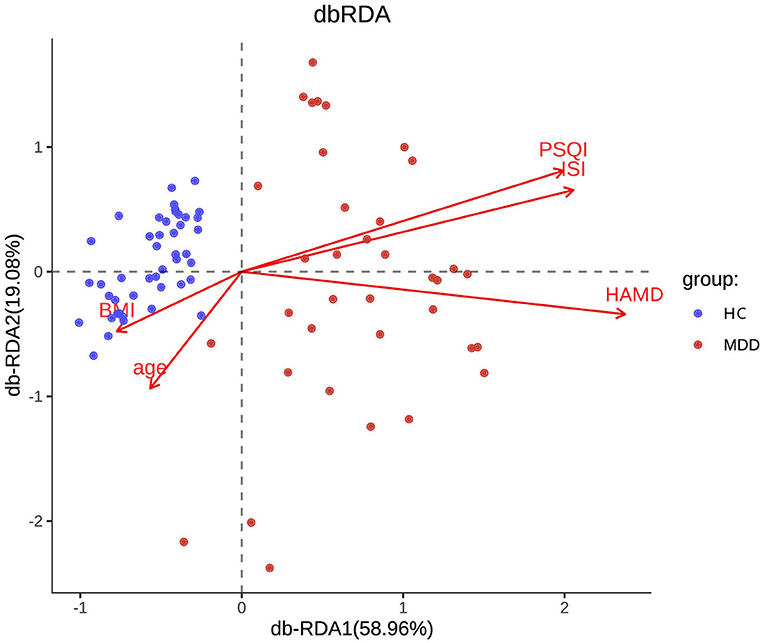
Figure 2. RDA two-way sequence diagram of intestinal bacterial community and its main environmental factors driven by variation.
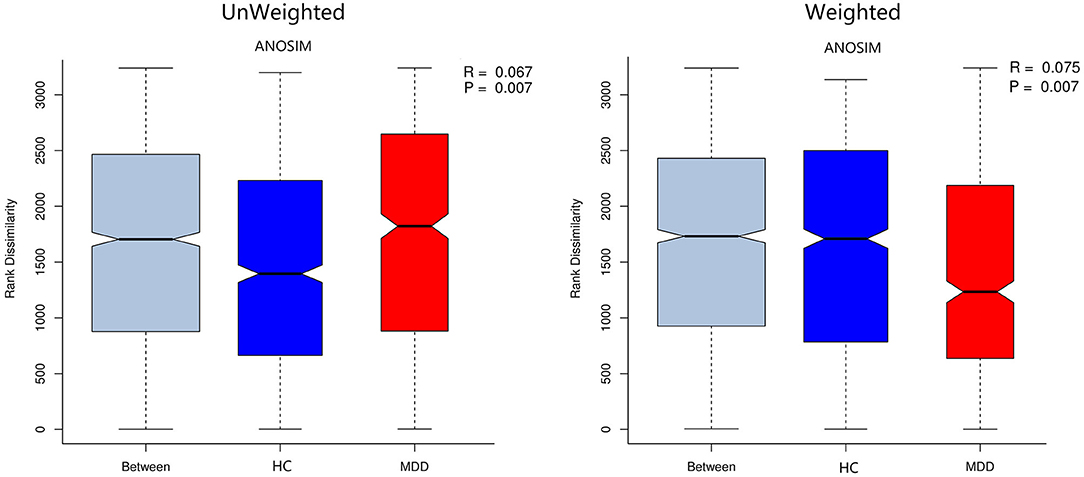
Figure 3. Unweighted and weighted analyses of similarities (ANOSIMs) based on the distance matrix of UniFrac differences of the fecal microbial communities in the MDD group and HC. r > 0 means the difference between groups is greater than that within groups.
Composition of Microbial Communities Between MDD and HC
We obtained 3,565,920 quality-filtered read pairs from 81 study participants (36 MDD patients and 45 HC), with an average of 44,024 read pairs per sample. Gut bacterial communities at the phylum, family, and genus levels detected in MDD and HC subjects are shown in Figure 4. In order to explore the differences among groups, all OTUs with ≥0.01% fractional representation in either of the groups were considered. As expected, Bacteroidetes and Firmicutes accounted for about 93% of all bacteria and were the two most common dominant taxa among the two groups. At the phylum and class levels, there were no significant differences between groups (p > 0.05).
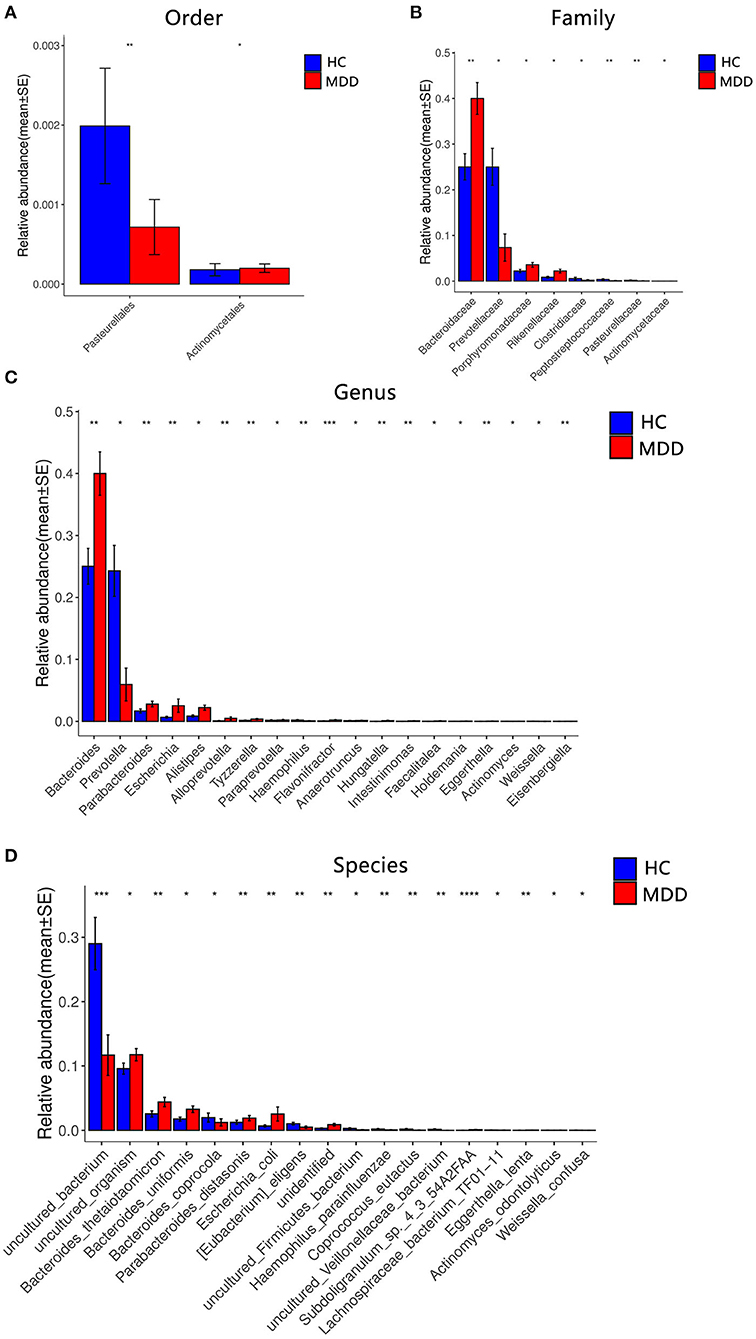
Figure 4. Comparison of the microbial abundance among the MDD group and HC. Dominant bacteria with relative abundances >0.01%. After exclusion, the Wilcoxon signed-rank test was applied to identify the differentially abundant orders (A), families (B), genera (C), and species (D). Among these, the highest means of the phylogenetic abundance in the enriched cohort were drawn as bar plots (*p < 0.05, **p < 0.01, ***p < 0.001, ****p < 0.0001).
A significant difference (Wilcoxon signed-rank test, p < 0.05) between the two groups affected two orders: Pasteurellales and Actinomycetae. At the family level, eight families showed significant differences between the two groups: the top four being Bacteroidaceae, Prevotellaceae, Porphyromonadaceae, and Rikenellaceae. At the genus level, 19 genera showed significant differences between the two groups; the top four were Bacteroides, Prevotella, Parabacteroides, and Escherichia. At the species level, 18 species showed significant differences between the two groups; the top four were uncultured_bacterium, uncultured_organism, Bacteroides_thetaiotaomicron, and Bacteroides_uniformis. After the strict FDR correction, at the genus level, 10 genera showed significant differences between the two groups; the top four were Flavonifractora, Alloprevotella, Parabacteroides, and Hungatella. At the species level, four species showed significant differences between the two groups; they were Subdoligranulum_sp._4_3_54A2FAA, uncultured_bacterium, Eggerthella_lenta, and uncultured_Veillonellaceae_bacterium. No significant differences were identified at the family and order levels. The abundance of these microbiota targets is presented in Figure 4, Table 2, and Supplementary Table 1.
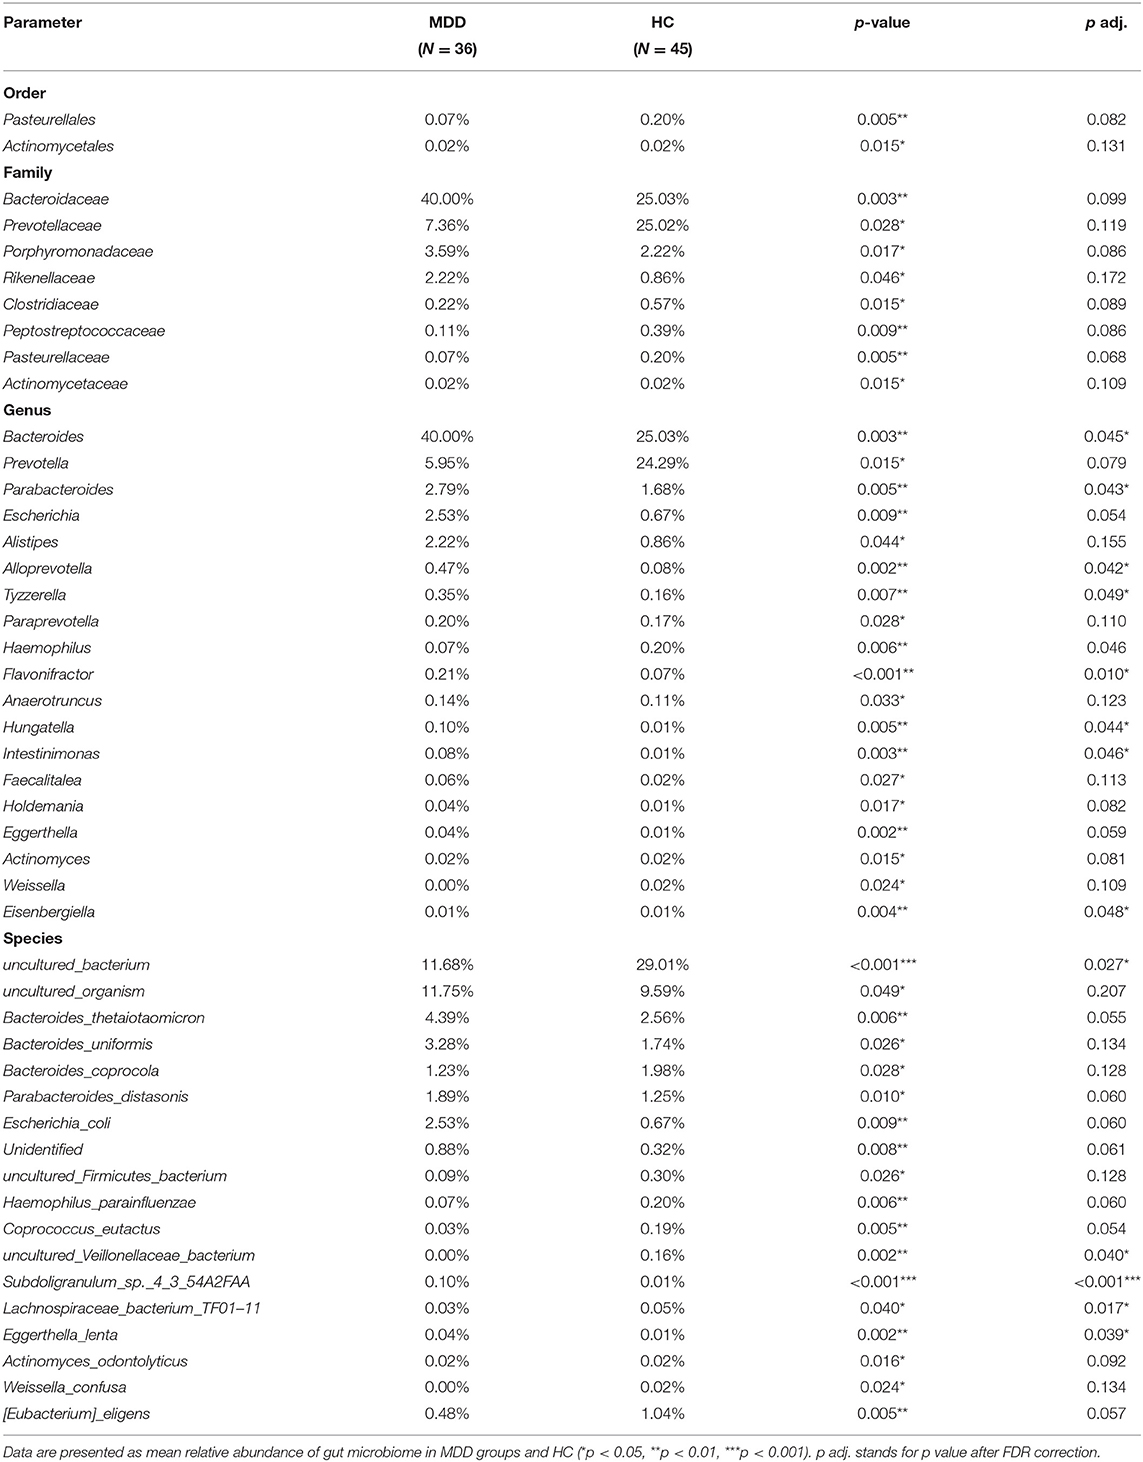
Table 2. Taxa abundances in MDD and HC.
Based on the LDA score, we found that Bacteroidaceae, Bacteroides, and uncultured_Mesorhizobium_sp. were associated with healthy controls and uncultured_bacterium, Prevotellaceae, and Prevotella with the MDD group (Figure 5).
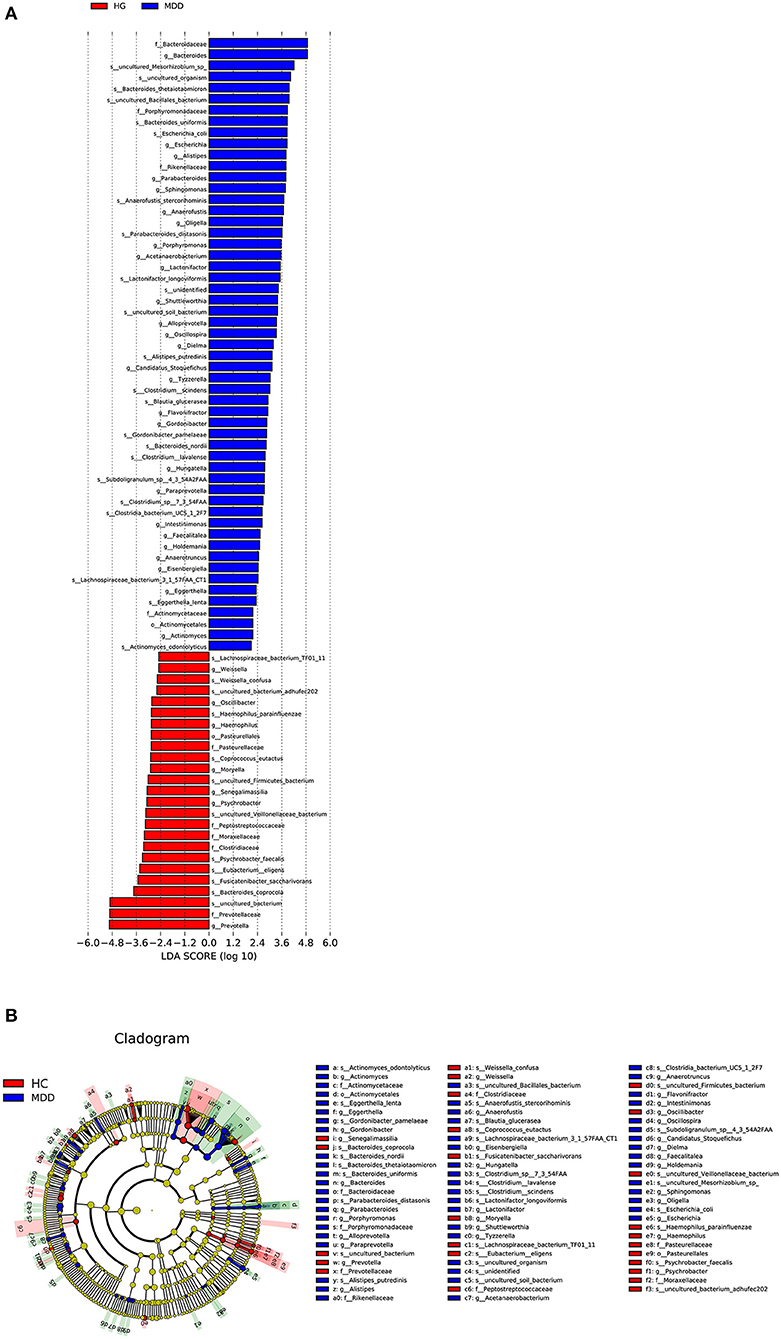
Figure 5. (A) Taxonomic biomarkers found by LEfSe in HC (blue) and MDD (red). Only taxa with p < 0.05 and LDA score (log10) are shown. (B) Cladogram indicating the phylogenetic relatedness of the discriminant taxa.
Correlations of Microbiota Abundance With Severity of Depression and Sleep Quality in MDD
After controlling for potential confounders (age, sex, BMI), the results of partial correlation analysis indicated no correlation between alpha diversity and ISI and HAM-D scores, while a moderate correlation was observed between Chao and PSQI scores (r = −0.345, p = 0.049). At the genus level, Dorea (r = 0.355, p = 0.042), Butyricicoccus (r = 0.364, p = 0.037), and Peptococcus (r = 0.403, p = 0.020) showed moderate correlations with the HAM-D score, while Blautia (r = 0.406, p = 0.019), Coprococcus (r = 0.508, p = 0.003), Dorea (r = 0.399, p = 0.022), and Intestinibacter (r = −0.559, p = 0.001) showed moderate to strong correlations with the PSQI score, and Intestinibacter (r = −0.489, p = 0.004) a moderate one with the ISI score. In addition, the species Bacteroides_stercoris (r = −0.368, p = 0.035), Bacteroides_uniformis (r = 0.424, p = 0.014), and Parasutterella_secunda (r = 0.358, p = 0.041) showed moderate correlations with HAM-D score; Blautia_obeum (r = −0.392, p = 0.024), Streptococcus_salivarius_subsp._salivarius (r = −0.352, p = 0.045), Coprococcus_comes (r = 0.408, p = 0.018), Blautia_sp. (r = −0.411, p = 0.018), butyrate_producing_bacterium_L250 (r = −0.357, p = 0.041), Dorea_formicigenerans (r = −0.419, p = 0.015), and uncultured_Coprococcus_sp. (r = −0.345, p = 0.049) show moderate correlation with PSQI score; and uncultured_Clostridiales_bacterium (r = 0.357, p = 0.042) and Blautia_obeum (r = −0.350, p = 0.046) show moderate correlation with ISI. Correlations with HAM-D, PSQI, and ISI scores are shown in Table 3 and Supplementary Table 2. Notably, Dorea commonly correlated with HAM-D and PSQI scores in patients with MDD. After FDR correction, at the genera level, Intestinibacter with PSQI was still significant. At the species level, no correlation was shown.
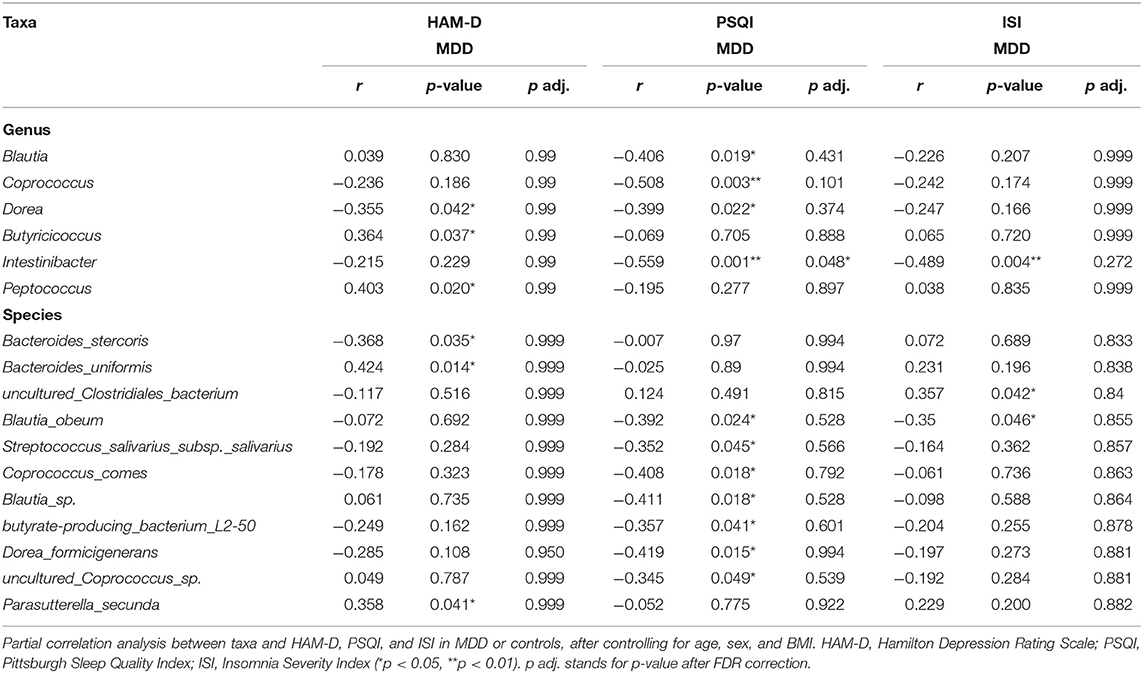
Table 3. Partial correlations between taxa and HAM-D, PSQI, and ISI scores in MDD.
In HC, after controlling for potential confounders (age, sex, BMI), the results of partial correlation analysis are shown in Supplementary Table 2. At the genus level, Haemophilus (r = 0.517, p < 0.001) showed strong correlations with the HAM-D score, Acidaminococcus (r = −0.345, p = 0.025) showed moderate correlations with the PSQI score, and Haemophilus (r = 0.753, p < 0.001) had a strong correlation with the ISI score. In addition, the species Haemophilus_parainfluenzae (r = 0.517, p < 0.001) showed strong correlations with HAM-D score. Haemophilus_parainfluenzae (r = 0.752, p < 0.001) and Clostridium_paraputrificum (r = 0.670, p < 0.001) showed strong correlations with ISI. After FDR correction, at the genera level, the correlations between Haemophilus and HAM-D and ISI were still significant. At the species level, Haemophilus_parainfluenzae with HAM-D, Haemophilus_parainfluenzae, and Clostridium_paraputrificum with ISI were still significant.
When adding severity of depression to potential confounding factors, the most relevant taxa with sleep quality in MDD at the genus levels were Coprococcus (β = −0.322, p = 0.021) and Intestinibacter (β = −0.455, p = 0.006), and the results are shown in Table 4.

Table 4. Linear regression analysis results for PSQI at the genus level.
Differences of MDD Patients With or Without Sleep Disorder
We divided the MDD patients into two groups according PSQI scores (>5). Figures 6A,B show the relative abundance of all the patients at the genus level and species level, respectively. A significant difference was shown between the two groups (Supplementary Table 3). At the genus level, Streptococcus, Dorea, Barnesiella, and Intestinibacter decreased in MDD patients with sleep disorder, while Coprococcus increased. At the species level, Blautia_obeum, Streptococcus_salivarius_subsp._salivarius, Dorea_formicigenerans, uncultured_Coprococcus_sp., and Ruminococcus_lactaris decreased in MDD patients with sleep disorder, and Clostridium_sp. increased. After FDR correction, no significant difference was found between the two groups.
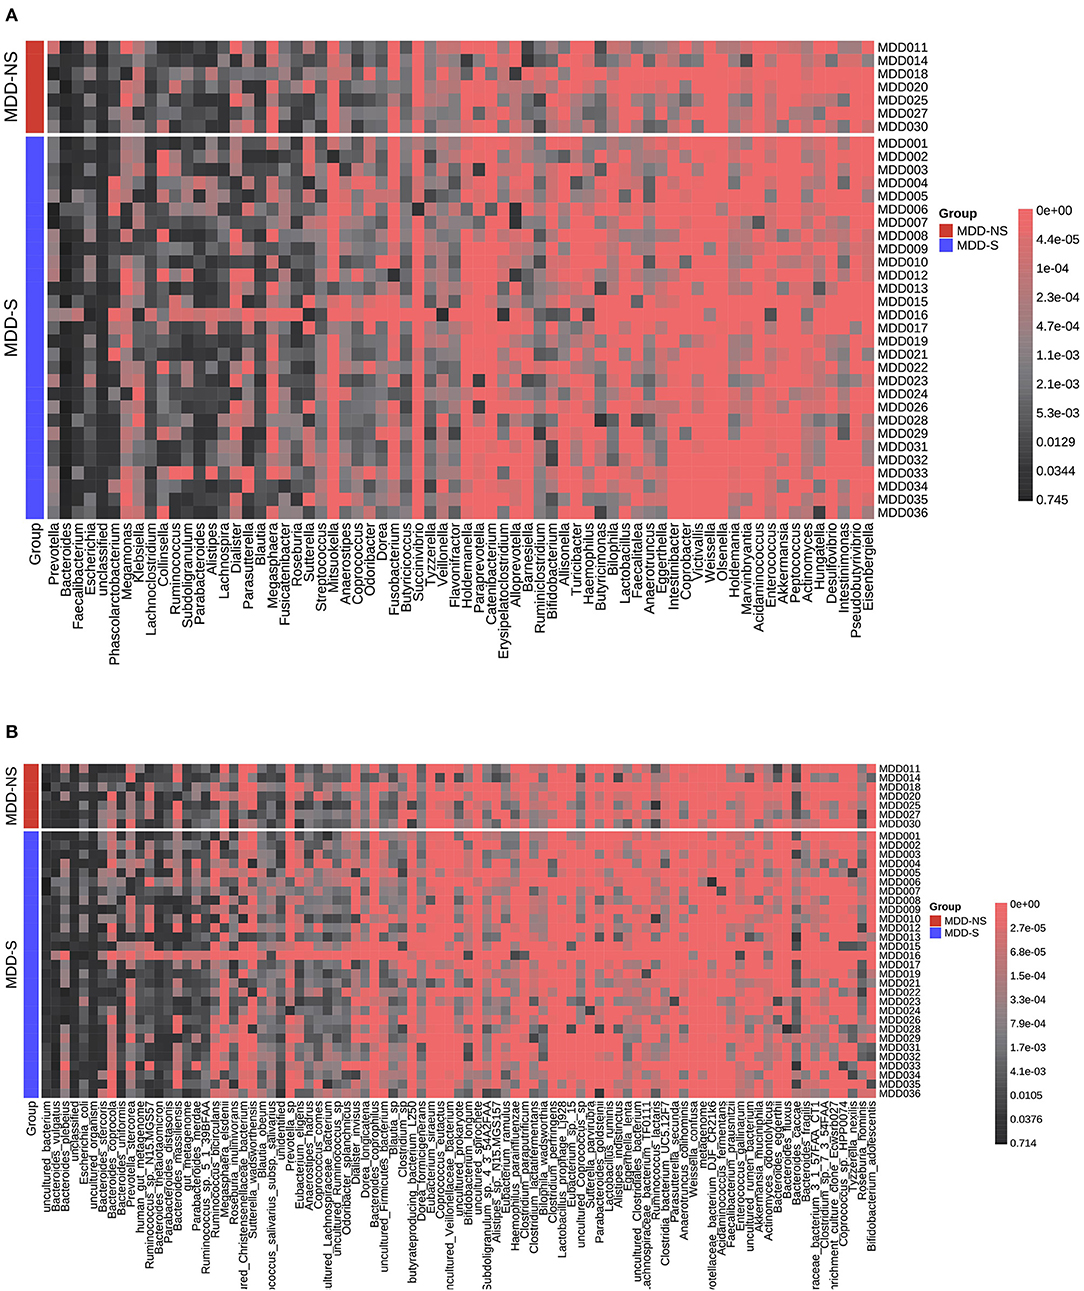
Figure 6. Relative abundance distribution for MDD-S and MDD-NS at the genus level (A) and species level (B). MDD-S stands for MDD patients with sleep disorder (PSQI > 5), and MDD-NS stands for MDD patients without sleep disorder (PSQI ≤ 5).
Discussion
Our study demonstrated significant gut flora differences between MDD and HC and found partially similar results to previous studies, as well as differences. Notably, we explore the composition of the microbiota of patients with MDD in relation to sleep quality and the severity of insomnia. We considered medication factors by limiting drug natural washout period, and we enrolled patients without any treatment >1 week and without long-acting antipsychotics >6 months.
In our study, some of the microbiota targets at the order, family, genus, and species levels indicated significant differences between MDD and HC. At the family level, a higher abundance of Actinomycineae and Porphyromonadaceae and a lower abundance of Prevotellaceae were observed in MDD (11, 33). At the genus level, higher Bacteroides, Parabacteroides, and Alistipes and lower Prevotella and Eggerthella were observed in MDD (11, 34–36). These results are consistent with previous reports. Transplanting the fecal flora from depressive patients to mice showed similar behaviors and microflora phenotype in those mice as the donor patients, indicating that the gut microbiome could cause depressive symptoms by affecting the metabolism (37). Growing research supports the effect of microbiota on brain networks and the regulation of negative affect. Alistipes can produce indole to influence tryptophan metabolism, which is vital for emotion regulation (38). However, the lower abundance of Peptostreptococcaceaea and Rikenellaceae in MDD was not found in our study. Rikenellaceae is a butyrate producer that can attenuate inflammation levels in order to improve emotion (39). Peptostreptococcaceaea belongs to Firmicutes which can affect glucose metabolism to mediate inflammation levels (40). A neuroimaging study found that patients with MDD had higher concentrations of Bacteroides and lower Prevotella and showed differences of brain structure and function associated with emotion (41). Age, BMI, gender, nations, diet, region, diagnostic criteria, mediation, lifestyles, sample size, and subclinical symptoms often disturb the reproducibility and accuracy of results (11, 42). In our study, age, BMI, and gender were similar between the two groups, and a mediation factor was also considered. Interestingly, our study found that Dorea, Butyricicoccus, and Peptococcus were associated with HAM-D scores measuring the severity of depression, which has never been reported before (9, 26, 43, 44).
Another contribution of our study was to further clarify the correlation of gut microbiota and concomitant sleep symptoms. We clustered the gut bacterial distributions based on existing similarity. PSQI and ISI represent different aspects of sleep, unlike ISI, sleep latency, sleep duration, and sleep efficiency components based on free-text numerical responses, while ISI concentrated on perceived feeling (45). At the genus level, Blautia, Coprococcus, Dorea, and Intestinibacter were negatively correlated with PSQI, with Intestinibacter being simultaneously negatively correlated with PSQI and ISI. Moreover, in our study, after controlling for the HAM-D score, Coprococcus and Intestinibacter were associated with sleep quality, independent of the severity of depression. However, contrary to our findings, a recent study showed that higher sleep quality was associated with a high proportion of bacteria from the Verrucomicrobia and Lentisphaerae phyla (46). Recent reviews have summarized the potential mechanism of sleep and MBGA: immunoregulatory pathway (cytokines), neuroendocrine pathway (HPA axis, CNS, neurotransmitters), vagus nerve pathway, and gut microbial metabolite pathway (SCFAs) (20, 47). Butyrate producers (Blautia, Coprococcus) may influence sleep quality because butyrate may potentially serve as a sleep-inducing signal molecule to enhance sleep (48), and the results were consistent with those of previous studies (49). Depressive patients were observed to exhibit similar phenomena, indicating that the two gut bacteria were more relevant to sleep rather than depressive symptoms. Depression and sleep are both affected by circadian activity, and no single hypothesis can explain the complex mechanisms of the comorbidity of depression and insomnia (20). Dorea was observed to decrease with HAM-D and PSQI. Thus, altered gut microbiota composition may correlate not only with an increased MDD severity but also with lower sleep quality. Indeed, Huang et al. found that Dorea decreased in depressive patients, although no previous study has reported its link with sleep (50). Since Dorea is known for fermenting polysaccharides into SCFAs (51) and SCFAs, including butyrate and acetate, play important roles in clock gene expression, which is closely related to circadian rhythm and sleep quality, it is possible that Dorea mediates sleep deficits in MDD (52). However, it is not clear why Intestinibacter is associated with sleep, whether via immune inflammatory mechanisms or carbohydrate metabolism (53–55).
In our study, the correlation of gut microbiome and clinical symptoms in patients and in cases and controls was different. Previous studies reported the correlation between gut microbiome and sleep quality in animals or in healthy controls. Blautia and Ruminococcus were reported to have a negative correlation with PSQI score, and Prevotella was positively correlated with PSQI score in young healthy individuals (22). A recent study reported that probiotics could improve sleep quality and has a role in anti-inflammatory mechanism (47). Our study identified that Acidaminococcus was associated with better sleep quality, and it also identified the heterogeneity of microbiome in MDD and HC. Different gut flora were associated with different metabolites, metabolic pathways, and inflammatory pathways. Sleep and circadian rhythms could influence microbiome composition by inflammation and breakdown of the epithelial barrier (56). The inflammatory reaction mechanism is induced by the microbiome and then triggers the CNS and aggravates insomnia and depression (57).
As for alpha diversity, our results are consistent with the latest meta-analysis, which found no difference in alpha diversity between patients with MDD and HC (58). History studies showed ambiguous results of beta diversity, including increasing and no difference due to individual heterogeneity and using different measuring instruments and analysis software (35, 36, 59). Our results reported different microbiota compositions between the two groups, similar to Chung et al. (11). In the future, more extensive sampling is needed to verify the results. Most scholars believe that the higher the microbiome diversity, the better the health (60). Zhang et al. reported no overt changes in microbiome richness or composition after sleep restriction (21). However, another study indicated that alpha diversity was positively associated with sleep efficiency and total sleep time and negatively associated with sleep fragmentation (49). The marginal significance in community richness observed in our study may be limited by the small sample size, while the short-term loss of sleep may not affect the gut microbiome diversity (61). It is worth noting that RDA analysis pointed out that sleep quality, severity of insomnia, and depression were main environmental factors, which drove the variation of microbiome in MDD patients not in HC. Therefore, in MDD patients, clinical symptoms were significantly related to the changes of microflora.
Considering our results, some limitations were noted. First, part of our results did not pass strict FDR correction (p adj. value should be <0.05), and we believe the negative results failing multiple testing would give a systematic view regarding our study. Also, the small sample size with limited power makes it impossible to identify more related factors. Further studies are needed to enlarge the sample size. Second, a cross-sectional study cannot prove causality; therefore, a longitudinal study is warranted. Although we controlled medication and diet after admission to minimize confounding, long-term dietary and medication effects should be considered. Our healthy controls consisted of hospital workers (N = 14) and patients' families or friends with no consanguinity (N = 31). They were all from Beijing, with similar geographical location, and in relatively consistent dietary habits. As a previous study pointed out that there were differences in the microbiome of hospital workers and non-hospital workers (62), we further compared the difference between healthy hospital workers (HCW) and non-hospital workers (non-HCW). There was no significant difference between them in our study (Supplementary Table 4). Recruiting patients focusing on the same area, applying the dietary questionnaire, and collecting the patients' medication history will help increase the reliability of results. Thirdly, we did not measure the stool moisture in our research, because the stools were immediately placed in a sample tube containing 2 ml of RNA stabilization solution. Further study should consider the impact of stool consistency. Additionally, as a common sequencing method, we used 16S RNA sequences, despite new methods such as shotgun metagenomics often reflecting more reliability and repeatability, but at a higher cost. Lastly, functional microbiota analysis, immunological status, gut barrier integrity, and metabolomics should also be integrated in future studies.
Conclusions
The microbiomes of patients with major depressive disorder in China were found to be significantly different from those of healthy controls. In summary, 48 microbiota targets were associated with MDD, 6 with severity of depression, 11 with sleep quality, and 3 with insomnia severity. At the genus level, Dorea was simultaneously related to depression and sleep quality, and Intestinibacter was more closely associated with sleep-related problems. The most interesting finding was that the presence of Coprococcus and Intestinibacter was associated with sleep quality independent of the severity of depression. We identified several specific taxa related to sleep health, which suggests that the microbiome may be related to both sleep and severity of illness at the same time. Overall, our findings are consistent with previous microbiome studies on depression and constitute a preliminary exploration of the role of dysbacteriosis in sleep disorders in MDD patients.
Data Availability Statement
The datasets presented in this study can be found in online repositories. The names of the repository/repositories and accession number(s) can be found at: https://www.ncbi.nlm.nih.gov/, PRJNA687871.
Ethics Statement
The studies involving human participants were reviewed and approved by the Institutional review board of Beijing Huilongguan Hospital (# 2019–43). The patients/participants provided their written informed consent to participate in this study.
Author Contributions
QZ conducted data collection and analysis and drafted and revised the manuscript. FY and ZW designed the experiments. YY, WZ, and TM collected the data. HA proofread the manuscript. All authors contributed to the article and approved the submitted version.
Funding
This work was supported by Beijing Municipal Science and Technology Project (Z181100001518005, Z171100001017021); Beijing Hospitals Authority Ascent Plan (DFL20182001); and Capital's Funds for Health Improvement and Research (CFH2020-1-2131).
Conflict of Interest
The authors declare that the research was conducted in the absence of any commercial or financial relationships that could be construed as a potential conflict of interest.
Supplementary Material
The Supplementary Material for this article can be found online at: https://www.frontiersin.org/articles/10.3389/fpsyt.2021.645045/full#supplementary-material
References
1. Gotlib IH, Hammen CL. Handbook of Depression, 3rd Edition. New York, NY: Guilford Publications (2015).
2. Lim G Y, Tam WW, Lu Y, Ho C S, Zhang M W, Ho R C. Prevalence of depression in the community from 30 countries between 1994 and 2014. Sci Rep. (2018) 8:2861. doi: 10.1038/s41598-018-21243-x
3. Breit S, Kupferberg A, Rogler G, Hasler G. Vagus nerve as modulator of the brain-gut axis in psychiatric and inflammatory disorders. Front Psychiatry. (2018) 9:44. doi: 10.3389/fpsyt.2018.00044
4. Feng Q, Chen WD, Wang YD. Gut microbiota: an integral moderator in health and disease. Front Microbiol. (2018) 9:151. doi: 10.3389/fmicb.2018.00151
5. Asarnow LD. Depression and sleep: what has the treatment research revealed and could the HPA axis be a potential mechanism? Curr Opin Psychol. (2020) 34:112–6. doi: 10.1016/j.copsyc.2019.12.002
6. Liang S, Wu X, Hu X, Wang T, Jin F. Recognizing depression from the Microbiota-Gut-Brain axis. Int J Mol Sci. (2018) 19:1592. doi: 10.3390/ijms19061592
7. Averina OV, Danilenko VN. [Human intestinal microbiota: role in development and functioning of the nervous system]. Mikrobiologiia. (2017) 86:5–24. doi: 10.1134/S0026261717010040
8. Stilling RM, van de Wouw M, Clarke G, Stanton C, Dinan TG, Cryan JF. The neuropharmacology of butyrate: the bread and butter of the microbiota-gut-brain axis? Neurochem Int. (2016) 99:110–32. doi: 10.1016/j.neuint.2016.06.011
9. Cheung SG, Goldenthal AR, Uhlemann AC, Mann JJ, Miller JM, Sublette ME. Systematic review of gut microbiota and major depression. Front Psychiatry. (2019) 10:34. doi: 10.3389/fpsyt.2019.00034
10. Jiang HY, Zhang X, Yu ZH, Zhang Z, Deng M, Zhao JH, et al. Altered gut microbiota profile in patients with generalized anxiety disorder. J Psychiatr Res. (2018) 104:130–6. doi: 10.1016/j.jpsychires.2018.07.007
11. Chung YE, Chen HC, Chou HL, Chen IM, Lee MS, Chuang LC, et al. Exploration of microbiota targets for major depressive disorder and mood related traits. J Psychiatr Res. (2019) 111:74–82. doi: 10.1016/j.jpsychires.2019.01.016
12. Tsuno N, Besset A, Ritchie K. Sleep and depression. J Clin Psychiatry. (2005) 66:1254–69. doi: 10.4088/JCP.v66n1008
13. Borbély AA. The S-deficiency hypothesis of depression and the two-process model of sleep regulation. Pharmacopsychiatry. (1987) 20:23–9. doi: 10.1055/s-2007-1017069
14. Antonijevic I. HPA axis and sleep: identifying subtypes of major depression. Stress. (2008) 11:15–27. doi: 10.1080/10253890701378967
15. Ivanov FI. [Biological rhythms in psychopathology (biological patterns in psychiatry)]. Zh Nevropatol Psikhiatr Im S S Korsakova. (1981) 81:589–97.
16. Salvatore P, Indic P, Murray G, Baldessarini RJ. Biological rhythms and mood disorders. Dialog Clin Neurosci. (2012) 14:369–79. doi: 10.31887/DCNS.2012.14.4/psalvatore
17. Armitage R. Sleep and circadian rhythms in mood disorders. Acta Psychiatr Scand Suppl. (2007) 2007:104–15. doi: 10.1111/j.1600-0447.2007.00968.x
18. Imeri L, Opp MR. How (and why) the immune system makes us sleep. Nat Rev Neurosci. (2009) 10:199–210. doi: 10.1038/nrn2576
19. Biological rhythms in psychiatry: order and disorder. Society of Biological Psychiatry. Forty-Fifth Annual Convention & Scientific Program. New York, NY: Program and abstracts (1990).
20. Li Y, Hao Y, Fan F, Zhang B. The role of microbiome in insomnia, circadian disturbance and depression. Front Psychiatry. (2018) 9:669. doi: 10.3389/fpsyt.2018.00669
21. Zhang SL, Bai L, Goel N, Bailey A, Jang CJ, Bushman FD, et al. Human and rat gut microbiome composition is maintained following sleep restriction. Proc Natl Acad Sci USA. (2017) 114:E1564–71. doi: 10.1073/pnas.1620673114
22. Grosicki GJ, Riemann BL, Flatt AA, Valentino T, Lustgarten MS. Self-reported sleep quality is associated with gut microbiome composition in young, healthy individuals: a pilot study. Sleep Med. (2020) 73:76–81. doi: 10.1016/j.sleep.2020.04.013
23. Evans SJ, Bassis CM, Hein R, Assari S, Flowers SA, Kelly MB, et al. The gut microbiome composition associates with bipolar disorder and illness severity. J Psychiatr Res. (2017) 87:23–9. doi: 10.1016/j.jpsychires.2016.12.007
24. Aizawa E, Tsuji H, Asahara T, Takahashi T, Teraishi T, Yoshida S, et al. Bifidobacterium and Lactobacillus counts in the gut microbiota of patients with bipolar disorder and healthy controls. Front Psychiatry. (2018) 9:730. doi: 10.3389/fpsyt.2018.00730
25. Kurokawa S, Kishimoto T, Mizuno S, Masaoka T, Naganuma M, Liang KC, et al. The effect of fecal microbiota transplantation on psychiatric symptoms among patients with irritable bowel syndrome, functional diarrhea and functional constipation: An open-label observational study. J Affect Disord. (2018) 235:506–12. doi: 10.1016/j.jad.2018.04.038
26. Liśkiewicz P, Kaczmarczyk M, Misiak B, Wroński M, Baba-Kubiś A, Skonieczna-Zydecka K, et al. Analysis of gut microbiota and intestinal integrity markers of inpatients with major depressive disorder. Prog Neuropsychopharmacol Biol Psychiatry. (2020) 106:110076. doi: 10.1016/j.pnpbp.2020.110076
27. Buysse DJ, Reynolds CF, Monk TH, Berman SR, Kupfer DJ. The Pittsburgh sleep quality index: a new instrument for psychiatric practice and research. Psychiatry Res. (1989) 28:193–213. doi: 10.1016/0165-1781(89)90047-4
28. Bastien CH, Vallieres A, Morin CM. Validation of the Insomnia Severity Index as an outcome measure for insomnia research. Sleep Med. (2001) 2:297–307. doi: 10.1016/S1389-9457(00)00065-4
29. Caporaso JG, Lauber CL, Walters WA, Berg-Lyons D, Huntley J, Fierer N, et al. Ultra-high-throughput microbial community analysis on the Illumina HiSeq and MiSeq platforms. Isme J. (2012) 6:1621–4. doi: 10.1038/ismej.2012.8
30. Bolger AM, Lohse M, Usadel B. Trimmomatic: a flexible trimmer for Illumina sequence data. Bioinformatics. (2014) 30:2114–20. doi: 10.1093/bioinformatics/btu170
31. Schloss PD, Westcott SL, Ryabin T, Hall JR, Hartmann M, Hollister EB, et al. Introducing mothur: open-source, platform-independent, community-supported software for describing and comparing microbial communities. Appl Environ Microbiol. (2009) 75:7537–41. doi: 10.1128/AEM.01541-09
32. Edgar RC. UPARSE: highly accurate OTU sequences from microbial amplicon reads. Nat Methods. (2013) 10:996–8. doi: 10.1038/nmeth.2604
33. Chen Z, Li J, Gui S, Zhou C, Chen J, Yang C, et al. Comparative metaproteomics analysis shows altered fecal microbiota signatures in patients with major depressive disorder. Neuroreport. (2018) 29:417–25. doi: 10.1097/WNR.0000000000000985
34. Naseribafrouei A, Hestad K, Avershina E, Sekelja M, Linløkken A, Wilson R, et al. Correlation between the human fecal microbiota and depression. Neurogastroenterol Motil. (2014) 26:1155–62. doi: 10.1111/nmo.12378
35. Jiang H, Ling Z, Zhang Y, Mao H, Ma Z, Yin Y, et al. Altered fecal microbiota composition in patients with major depressive disorder. Brain Behav Immun. (2015) 48:186–94. doi: 10.1016/j.bbi.2015.03.016
36. Lai WT, Deng WF, Xu SX, Zhao J, Xu D, Liu YH, et al. Shotgun metagenomics reveals both taxonomic and tryptophan pathway differences of gut microbiota in major depressive disorder patients. Psychol Med. (2019) 51:90–101. doi: 10.1017/S0033291719003027
37. Zheng P, Zeng B, Zhou C, Liu M, Fang Z, Xu X, et al. Gut microbiome remodeling induces depressive-like behaviors through a pathway mediated by the host's metabolism. Mol Psychiatry. (2016) 21:786–96. doi: 10.1038/mp.2016.44
38. Song Y, Könönen E, Rautio M, Liu C, Bryk A, Eerola E, et al. Alistipes onderdonkii sp. nov. and Alistipes shahii sp. nov., of human origin. Int J Syst Evol Microbiol. (2006) 56:1985–90. doi: 10.1099/ijs.0.64318-0
39. Ye J, Lv L, Wu W, Li Y, Shi D, Fang D, et al. Butyrate protects mice against methionine-choline-deficient diet-induced non-alcoholic steatohepatitis by improving gut barrier function, attenuating inflammation and reducing endotoxin levels. Front Microbiol. (2018) 9:1967. doi: 10.3389/fmicb.2018.01967
40. Doumatey AP, Adeyemo A, Zhou J, Lei L, Adebamowo SN, Adebamowo C, et al. Gut microbiome profiles are associated with Type 2 diabetes in Urban Africans. Front Cell Infect Microbiol. (2020) 10:63. doi: 10.3389/fcimb.2020.00063
41. Tillisch K, Mayer EA, Gupta A, Gill Z, Brazeilles R, Le Nevé B, et al. Brain structure and response to emotional stimuli as related to gut microbial profiles in healthy women. Psychosom Med. (2017) 79:905–13. doi: 10.1097/PSY.0000000000000493
42. Łoniewski I, Misera A, Skonieczna-Zydecka K, Kaczmarczyk M, Kazmierczak-Siedlecka K, Misiak B, et al. Major depressive disorder and gut microbiota - association not causation. A scoping review. Prog Neuropsychopharmacol Biol Psychiatry. (2020) 106:110111. doi: 10.1016/j.pnpbp.2020.110111
43. Madan A, Thompson D, Fowler JC, Ajami NJ, Salas R, Frueh BC, et al. The gut microbiota is associated with psychiatric symptom severity and treatment outcome among individuals with serious mental illness. J Affect Disord. (2020) 264:98–106. doi: 10.1016/j.jad.2019.12.020
44. Chen JJ, Zheng P, Liu YY, Zhong XG, Wang HY, Guo YJ, et al. Sex differences in gut microbiota in patients with major depressive disorder. Neuropsychiatr Dis Treat. (2018) 14:647–55. doi: 10.2147/NDT.S159322
45. Omachi TA. Measures of sleep in rheumatologic diseases: Epworth Sleepiness Scale (ESS), Functional Outcome of Sleep Questionnaire (FOSQ), Insomnia Severity Index (ISI), and Pittsburgh Sleep Quality Index (PSQI). Arthritis Care Res. (2011) 63(Suppl. 11):S287–96. doi: 10.1002/acr.20544
46. Anderson JR, Carroll I, Azcarate-Peril MA, Rochette AD, Heinberg LJ, Peat C, et al. A preliminary examination of gut microbiota, sleep, and cognitive flexibility in healthy older adults. Sleep Med. (2017) 38:104–7. doi: 10.1016/j.sleep.2017.07.018
47. Matenchuk BA, Mandhane PJ, Kozyrskyj AL. Sleep, circadian rhythm, and gut microbiota. Sleep Med Rev. (2020) 53:101340. doi: 10.1016/j.smrv.2020.101340
48. Szentirmai É, Millican NS, Massie AR, Kapás L. Butyrate, a metabolite of intestinal bacteria, enhances sleep. Sci Rep. (2019) 9:7035. doi: 10.1038/s41598-019-43502-1
49. Smith RP, Easson C, Lyle SM, Kapoor R, Donnelly CP, Davidson EJ, et al. Gut microbiome diversity is associated with sleep physiology in humans. PLoS ONE. (2019) 14:e0222394. doi: 10.1371/journal.pone.0222394
50. Huang Y, Shi X, Li Z, Shen Y, Shi X, Wang L, et al. Possible association of firmicutes in the gut microbiota of patients with major depressive disorder. Neuropsychiatr Dis Treat. (2018) 14:3329–37. doi: 10.2147/NDT.S188340
51. Leone V, Gibbons SM, Martinez K, Hutchison AL, Huang EY, Cham CM, et al. Effects of diurnal variation of gut microbes and high-fat feeding on host circadian clock function and metabolism. Cell Host Microbe. (2015) 17:681–9. doi: 10.1016/j.chom.2015.03.006
52. Jiao N, Baker SS, Nugent CA, Tsompana M, Cai L, Wang Y, et al. Gut microbiome may contribute to insulin resistance and systemic inflammation in obese rodents: a meta-analysis. Physiol Genomics. (2018) 50:244–54. doi: 10.1152/physiolgenomics.00114.2017
53. Poggiogalle E, Jamshed H, Peterson CM. Circadian regulation of glucose, lipid, and energy metabolism in humans. Metabolism. (2018) 84:11–27. doi: 10.1016/j.metabol.2017.11.017
54. Rosario D, Benfeitas R, Bidkhori G, Zhang C, Uhlen M, Shoaie S, et al. Understanding the representative gut microbiota dysbiosis in metformin-treated Type 2 diabetes patients using genome-scale metabolic modeling. Front Physiol. (2018) 9:775. doi: 10.3389/fphys.2018.00775
55. Forbes JD, Chen CY, Knox NC, Marrie RA, El-Gabalawy H, de Kievit T, et al. A comparative study of the gut microbiota in immune-mediated inflammatory diseases-does a common dysbiosis exist? Microbiome. (2018) 6:221. doi: 10.1186/s40168-018-0603-4
56. Bravo JA, Forsythe P, Chew MV, Escaravage E, Savignac HM, Dinan TG, et al. Ingestion of Lactobacillus strain regulates emotional behavior and central GABA receptor expression in a mouse via the vagus nerve. Proc Natl Acad Sci USA. (2011) 108:16050–5. doi: 10.1073/pnas.1102999108
57. Hsiao EY, McBride SW, Hsien S, Sharon G, Hyde ER, McCue T, et al. Microbiota modulate behavioral and physiological abnormalities associated with neurodevelopmental disorders. Cell. (2013) 155:1451–63. doi: 10.1016/j.cell.2013.11.024
58. Sanada K, Nakajima S, Kurokawa S, Barceló-Soler A, Ikuse D, Hirata A, et al. Gut microbiota and major depressive disorder: a systematic review and meta-analysis. J Affect Disord. (2020) 266:1–13. doi: 10.1016/j.jad.2020.01.102
59. Liu RT, Rowan-Nash AD, Sheehan AE, Walsh RFL, Sanzari CM, Korry BJ, et al. Reductions in anti-inflammatory gut bacteria are associated with depression in a sample of young adults. Brain Behav Immun. (2020) 88:308–24. doi: 10.1016/j.bbi.2020.03.026
60. Matsuoka K, Kanai T. The gut microbiota and inflammatory bowel disease. Semin Immunopathol. (2015) 37:47–55. doi: 10.1007/s00281-014-0454-4
61. Benedict C, Vogel H, Jonas W, Woting A, Blaut M, Schürmann A, et al. Gut microbiota and glucometabolic alterations in response to recurrent partial sleep deprivation in normal-weight young individuals. Mol Metab. (2016) 5:1175–86. doi: 10.1016/j.molmet.2016.10.003
Keywords: gut microbiome, major depressive disorder, sleep quality, 16S rRNA sequencing, insomnia
Citation: Zhang Q, Yun Y, An H, Zhao W, Ma T, Wang Z and Yang F (2021) Gut Microbiome Composition Associated With Major Depressive Disorder and Sleep Quality. Front. Psychiatry 12:645045. doi: 10.3389/fpsyt.2021.645045
Received: 22 December 2020; Accepted: 29 March 2021;
Published: 21 May 2021.
Edited by:
Polymnia Georgiou, University of Maryland, Baltimore, United StatesReviewed by:
Gerard M. Moloney, University College Cork, IrelandKaren Ann Scott, University of Florida, United States
Copyright © 2021 Zhang, Yun, An, Zhao, Ma, Wang and Yang. This is an open-access article distributed under the terms of the Creative Commons Attribution License (CC BY). The use, distribution or reproduction in other forums is permitted, provided the original author(s) and the copyright owner(s) are credited and that the original publication in this journal is cited, in accordance with accepted academic practice. No use, distribution or reproduction is permitted which does not comply with these terms.
*Correspondence: Fude Yang, yangfd2002@163.com