Consumer Preference Testing of Boiled Sweetpotato Using Crowdsourced Citizen Science in Ghana and Uganda
 Mukani Moyo1
  Reuben Ssali2
  Sam Namanda3
  Mariam Nakitto3 Eric K. Dery2 Daniel Akansake2
  Joseph Adjebeng-Danquah4
  Jacob van Etten5
  Kauê de Sousa5,6
  Hannele Lindqvist-Kreuze7
  Edward Carey2
  Tawanda Muzhingi1,8*
- 1International Potato Center, CGIAR Program on Roots Tubers and Bananas, Nairobi, Kenya
- 2International Potato Center, CGIAR Program on Roots Tubers and Bananas, Kumasi, Ghana
- 3International Potato Center, CGIAR Program on Roots Tubers and Bananas, Kampala, Uganda
- 4Council for Scientific and Industrial Research–Savanna Agricultural Research Institute, Nyankpala, Ghana
- 5Digital Inclusion Area, Bioversity International, Maccarese, Italy
- 6Department of Agricultural Sciences, Inland Norway University of Applied Sciences, Hamar, Norway
- 7International Potato Center, CGIAR Program on Roots Tubers and Bananas, Lima, Peru
- 8Department of Food, Bioprocessing and Nutrition Sciences, North Carolina State University, Raleigh, NC, United States
Crowdsourced citizen science is an emerging approach in plant sciences. The triadic comparison of technologies (tricot) approach has been successfully utilized by demand-led breeding programmes to identify varieties for dissemination suited to specific geographic and climatic regions. An important feature of this approach is the independent way in which farmers individually evaluate the varieties on their own farms as “citizen scientists.” In this study, we adapted this approach to evaluate consumer preferences to boiled sweetpotato [Ipomoea batatas (L.) Lam] roots of 21 advanced breeding materials and varieties in Ghana and 6 released varieties in Uganda. We were specifically interested in evaluating if a more independent style of evaluation (home tasting) would produce results comparable to an approach that involves control over preparation (centralized tasting). We compiled data from 1,433 participants who individually contributed to a home tasting (de-centralized) and a centralized tasting trial in Ghana and Uganda, evaluating overall acceptability, and indicating the reasons for their preferences. Geographic factors showed important contribution to define consumers' preference to boiled sweetpotato genotypes. Home and centralized tasting approaches gave similar rankings for overall acceptability, which was strongly correlated to taste. In both Ghana and Uganda, it was possible to robustly identify superior sweetpotato genotypes from consumers' perspectives. Our results indicate that the tricot approach can be successfully applied to consumer preference studies.
Introduction
Sweetpotato [Ipomoea batatas (L.) Lam] is grown as a staple root crop in Ghana and Uganda. It complements cassava and yams and competes with other starchy crops such as maize and plantain/bananas to supplement household income (Abong' et al., 2016; Glato et al., 2017). It is a nutritionally rich, climate-smart crop with good adaptability under low rainfall conditions, poor soils, and minimal farm inputs or labor (Abidin et al., 2017; Low et al., 2020). These agronomic attributes, together with the relatively short growing period, make it an ideal candidate crop for enhancing food security and improving livelihoods in Africa (Orr and Mwale, 2001; Low et al., 2009; Fiorella et al., 2016; Mzali, 2019). The resilient crop displays an array of storage root flesh colors which include various shades of white, cream, yellow, orange, and purple, all with unique nutritional properties (Nabubuya et al., 2012; Ellong et al., 2014; Chandrasekara and Kumar, 2016). The orange fleshed varieties are high in β-carotene, a precursor of Vitamin A in the human body, whilst purple fleshed varieties are excellent sources of anthocyanins with important antioxidant and anti-inflammatory properties (Low et al., 2007; Montilla et al., 2011; Jenkins et al., 2015; Salawu et al., 2015; Zhu et al., 2018; Bao and Fweja, 2020).
Despite the relative importance of sweetpotato to Africa, nutritionally and as a food security crop, it remains generally underutilized by different end-users along the value chain (Andrade et al., 2009; Mwanga et al., 2011). Knowledge gaps due to low investments in sweetpotato research present key challenges to drive demand or adoption of new varieties in most African regions with suitable climatic conditions (Low et al., 2017; Manners and van Etten, 2018). Over the last decade, improvements in demand-led breeding programs, albeit small, have increasingly re-directed research priorities toward stimulating and enhancing variety uptake and adoption along the different nodes of the value chain. Shifting the focus of breeding programs to consumer preferred traits, especially based on sensory acceptance attributes, has been shown to be a worthwhile strategy to drive demand for new sweetpotato varieties along the value chain (Wismer et al., 2005; Jaron et al., 2015; Baafi et al., 2016).
Consumer preference toward a particular crop variety is often influenced by quality attributes such as appearance, smell, texture, and taste, amongst others, which need to be taken into account in such studies (Kihinga, 2007; Siegrist and Hartmann, 2020). Sensory evaluation studies concerning consumer preference are thus important for demand led breeding strategies but remain challenging to perform with low-income consumers in Africa (Kamdem, 2016). In order to identify the most preferred crop variety, for example, consumers would be presented with the varieties to taste and score for best or most preferred variety. Breeding trials often have a large array (sometimes more than 10) of varieties to select from. As a result, these studies are often laborious, time-consuming, and costly. New approaches for acceptability and preference tests based on crowdsourced citizen science can reduce costs and have been successfully applied in agriculture (Minet et al., 2017).
For the field evaluation of varieties, innovation has led to a cost-effective approach that could also be useful for food science applications. Tricot employs a crowdsourcing approach where farmers become “citizen scientists,” assisting researchers in data generation and collection (van Etten et al., 2016, 2019). The approach enables large tasks to be split into small, manageable tasks through an incomplete block design, which can be distributed to many participants over large regions. The planting material is randomized into incomplete blocks of three varieties. Each farmer receives a seed package with three coded varieties to plant and score in their own field. Data is then retrieved from the individual participants and processed using the digital platform ClimMob (https://climmob.net) to generate statistical analyses based on models suitable for ranking data (Turner et al., 2020). In this way, a wide array of crop varieties can be analyzed by different farmers within the same region to identify the most suitable and preferred variety for release or promotion. Studies have shown the accuracy of farmer-generated data (Steinke and Van Etten, 2016) and their usefulness to study genotype by environment interactions (van Etten et al., 2019).
The ranking of three items that is core to the tricot approach is equivalent to best-worst scaling (or “maximum difference scaling”), which is a method that is increasingly popular in food science, because it can be easily adapted and applied across cultures since it does not rely on verbal anchors (Moskowitz, 2005; Flynn and Marley, 2014). Using best-worst scaling, the consumer is prompted to select the “least preferred” and “most preferred” variety from a set of samples. When it is done with only three items, best-worst scaling is equivalent to ranking. Best-worst scaling is one option among a large set of methods in affective sensory analysis, including preference ranking, magnitude scales, hedonic scales, and pair-wise comparisons (Coetzee and Taylor, 1996; Hein et al., 2008; Voicu, 2013; Carabante and Prinyawiwatkul, 2018). Preference ranking is often a challenge in studies which involve many samples to evaluate due to consumer fatigue. Elderly consumers and consumers with low literacy levels struggle with magnitude and hedonic scaling. Generally, there is a good understanding of the relative value of each of these methods and best-worst scaling with incomplete blocks of three items does not present a deviation from accepted practice. The novelty of tricot as a citizen science approach is its relatively simple format that provides the possibility to work with large samples of consumers, who can perform the tests in their home environments, which may provide a perspective closer to target use environments of food.
In this study, the tricot approach was applied to evaluate the preferences for boiled sweetpotato of consumers from Ghana and Uganda. In the tricot approach, consumers were “citizen scientists” and generated data on variety preferences based on key quality attributes of boiled sweetpotato. We focused on the boiled root of sweetpotato, which is the most common preparation method in both Ghana and Uganda, even though other methods are also used (such as steaming, frying, roasting, baking) (Oggema et al., 2007). The objectives of the study were to (i) validate the suitability of the tricot tool for evaluating consumer preferences to released and advanced selections of sweetpotato clones, (ii) compare two ways to implement the approach; centralized and home tasting, and (iii) document the key aspects of the method to inform future applications.
Materials and Methods
Study Sites
The study was conducted in Ghana (West Africa) and Uganda (East Africa) using released varieties and advanced breeding materials of sweetpotato available in the different regions (Figure 1). In Ghana, the study was conducted in the Northern, Upper East, Upper West, and Savannah regions. We selected areas known for high sweetpotato production and consumption: Tolon and Kumbungu districts (Northern Region); Bongo, Bawku, and Kasena-Nankana districts (Upper East Region); Sissala West and Wa Municipal (Upper West Region); and Bole and West Gonja districts (Savannah Region). In Uganda, three regions were selected: Gulu (northern Uganda), Soroti/Serere (eastern Uganda), and Wakiso district (central Uganda). Gulu and Soroti/Serere are rural whilst Wakiso is a peri-urban sweetpotato growing region. Consumption of sweetpotato is important in all selected areas in Uganda.
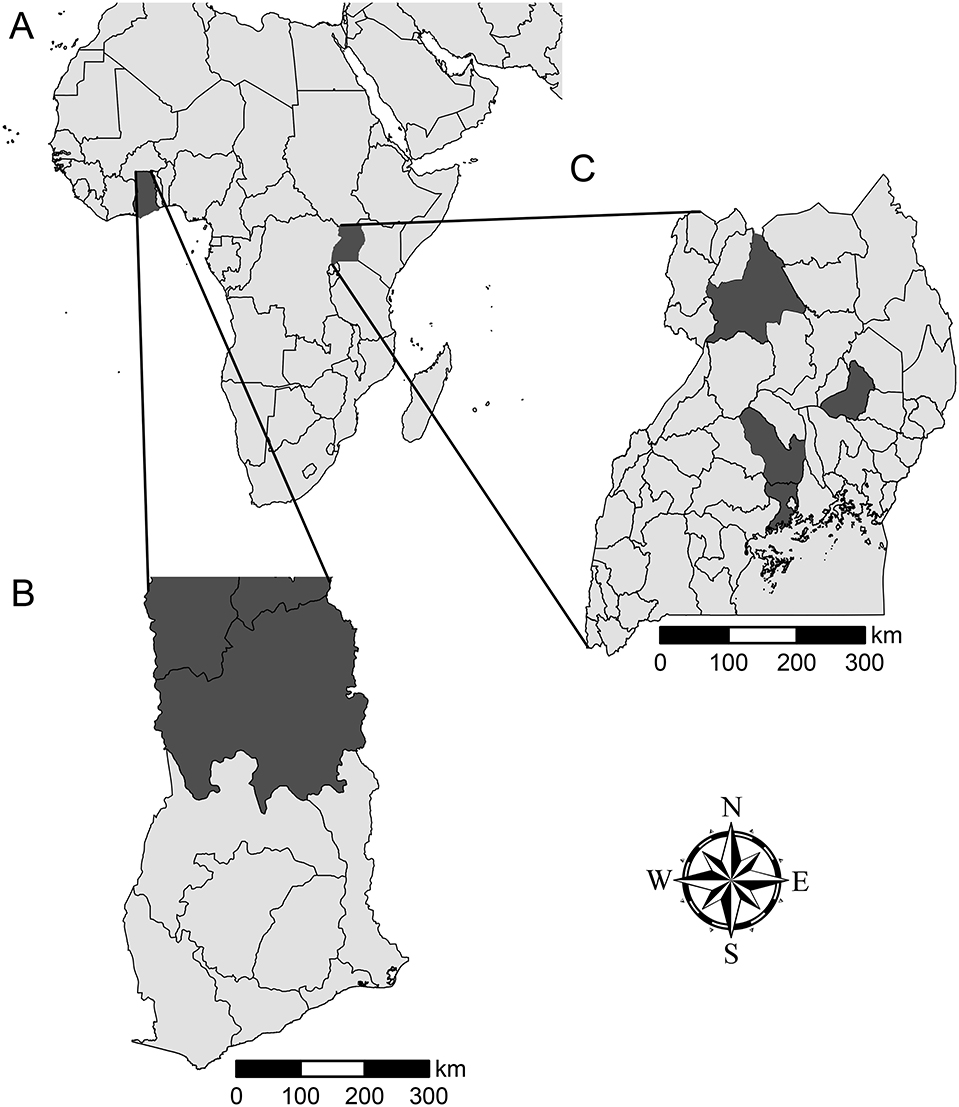
Figure 1. Research sites. (A) Overview of Africa with Ghana and Uganda highlighted. (B) Overview of Ghana, with the districts of Northern, Upper East, and Upper West highlighted. (C) Overview of Uganda, with the districts of Gulu, Soroti/Serere, and Wakiso highlighted.
Selected Sweetpotato Genotypes
We tested 27 sweetpotato genotypes: 21 genotypes (15 at the later breeding stages and 6 released varieties) in Ghana and 6 released and widely grown varieties in Uganda. The roots in Ghana were acquired from on-farm demonstration trials in the different regions whilst the roots in Uganda were acquired from local farmers in each region. In both countries, the roots were harvested at full maturity and utilized within 48 h post-harvest. Nutritional profiles of raw roots of all the genotypes from the different regions are shown in Table 1. The study was conducted in the last quarter of 2019.
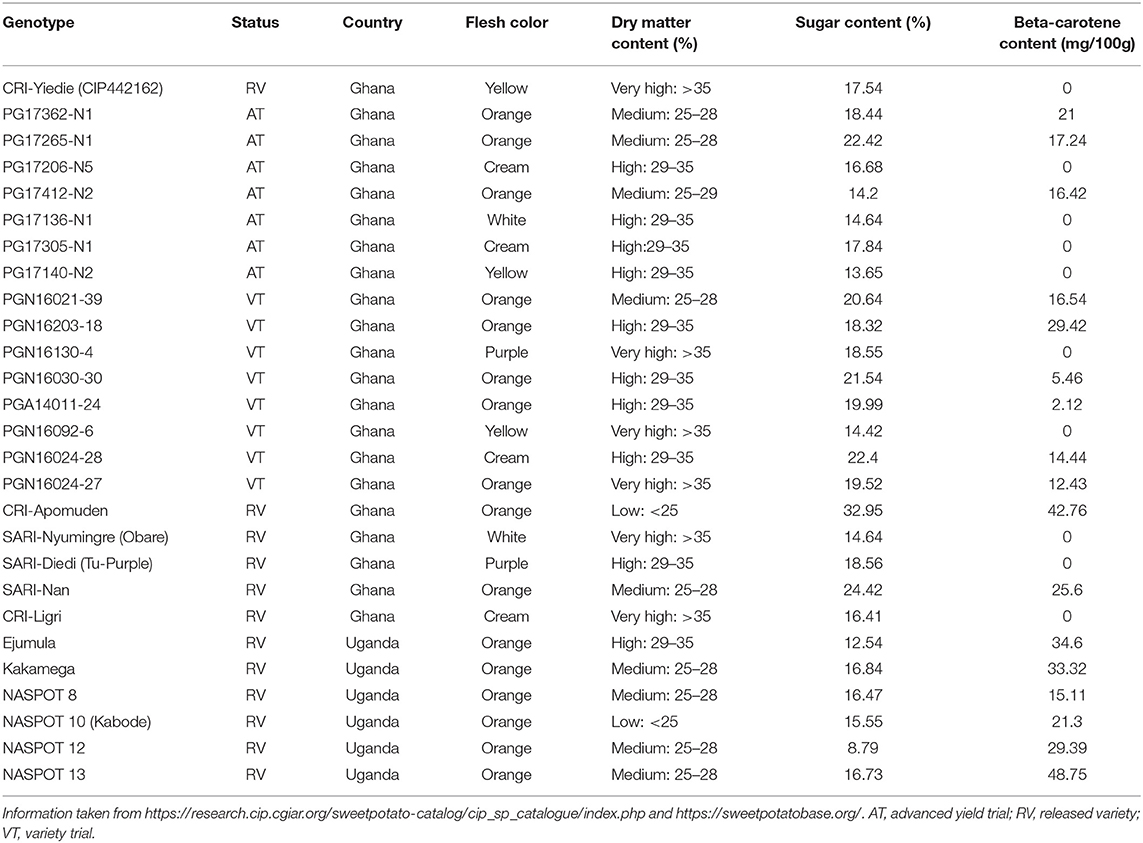
Table 1. Characteristics of the sweetpotato genotypes utilized in this study.
Experimental Design
A total of 1,433 participants contributed to the study (Table 2). In both Ghana and Uganda, the trials were split into a centralized and a home tasting trial.
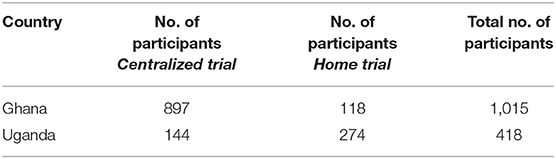
Table 2. Total number of participants in centralized and home tasting trials in Ghana and Uganda.
The tricot approach was used (van Etten et al., 2019) to study consumer preferences. This trial was supported by the ClimMob digital platform (http://climmob.net/), which streamlines the process. The objective of the study was shared with community leaders who also coordinated and interpreted in the local languages to ensure every participant understood the aims of the study. Potential participants who consented to being part of the study and having evidence photographs taken, with possibility of being published for research purposes only, signed up to participate. Sets of three genotypes from the country-specific sets of genotypes listed in Table 1 were allocated randomly to participants as incomplete blocks, maintaining balance by assigning roughly equal frequencies of each genotype, where possible. In Ghana, some varieties were slightly underrepresented as they were in short supply from the demonstration trials. They were however included for comparative purposes for their flesh colors and nutritional attributes. Genotypes in each incomplete block were labeled as A, B, and C and presented anonymously to prevent bias in the evaluation. Each participant evaluated their assigned set choosing the genotype which, according to their opinion, had the best and the worst characteristic for a given trait. The middle-ranking genotype is inferred from the answers on the best and worst, leading to a complete ranking of each set (incomplete block) of three varieties. In Uganda, three characteristics were evaluated; taste, color, and overall acceptability (OA); whereas in Ghana, only OA was assessed. The decision to exclude taste and color analyses from the Ghana data was based on a high percentage of missing and/or incomplete data. In both countries, participants were asked to provide the reason for evaluating a given genotype as best or worst. Table 3 describes the frequency, disaggregated by gender and trial, for each genotype tested.
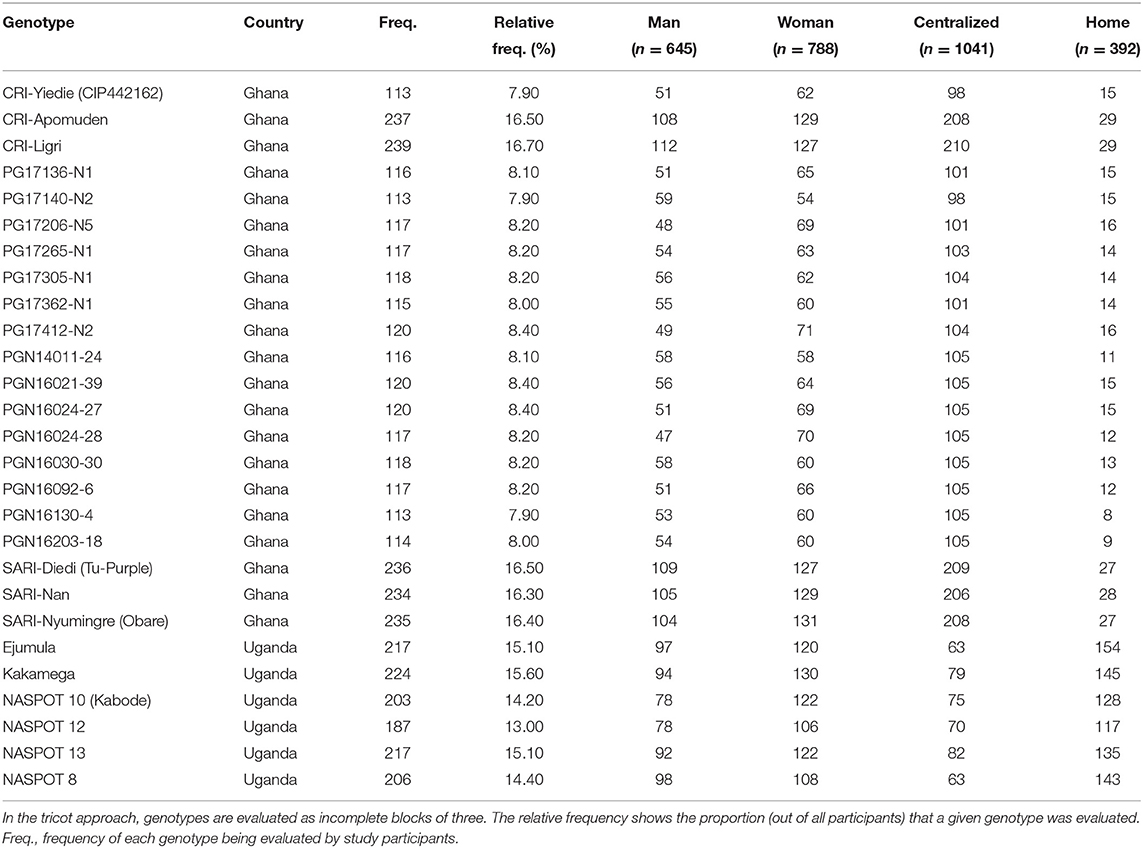
Table 3. Frequency of genotypes assessed in this study.
Home Tasting Trials
In the home tasting trials, participating households were identified with the help of local field agents associated with sweetpotato research and development activities and/or community leaders in the respective study areas. In Ghana, samples were distributed to individual households through the help of field agents. In Uganda, participants gathered at common locations within the community for briefing, orientation on the study procedures and distribution of the coded samples to individual household representatives. The genotypes were provided to each household as raw, unpeeled roots. Participants were instructed to prepare the roots following their usual preparation method, keeping the three coded samples distinguishable from each other. Each household was also issued with questionnaires (see the format in the Supplementary Appendix 1). Each household representative was requested to have only adult members (≥18 years) within the household complete the questionnaires after tasting. Individuals younger than 18 years old were not included in this study for ethical reasons. In Ghana, the research teams visited all individual households to recover the questionnaires. In Uganda, the research teams visited a representative sample of the households to recover the completed questionnaires whilst the rest were collected at the centralized tasting venues. The differences in the implementation of the study in the two countries were based on pilot studies conducted in the target regions on identifying tailored solutions to collecting consumer preference data.
Centralized Tasting Trials
The other approach taken was to test in central locations, the centralized tasting trials. In Ghana, locations close to fresh-produce markets were visited in the presence of community representatives and sweetpotato buyers were intercepted and requested to participate in the trial. In Uganda, community leaders and local field agents mobilized participants to gather at common locations, such as schools, for the tasting (Figure 2). The roots were utilized for the centralized tasting exercises within 48 h post-harvest in all regions. In all regions of Ghana, preparation of the samples included thoroughly washing the roots to remove soil particles and any sprouts and then boiling in plain water until optimally cooked. The same procedure was followed in Soroti/Serere and Gulu in Uganda, except the roots were covered with banana leaves during boiling. In Wakiso (Uganda), the roots were washed, peeled, wrapped in banana leaves, and steamed, as per the local practice. Each individual participant was served with three randomly selected and coded cooked varieties and handed a questionnaire to complete (see the format in the Supplementary Appendix 2). Drinking water was provided to rinse the mouth before tasting the next variety. Local community members were recruited as translators to assist those who could not read or write. All questionnaires were recovered at the tasting venues.
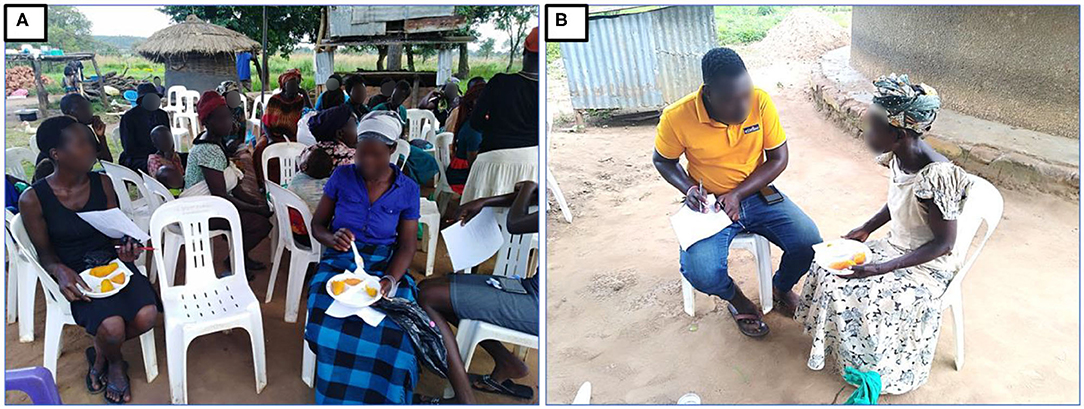
Figure 2. (A) Community members in Gulu (northern Uganda) gathered for the tasting of boiled sweetpotato. (B) Members of the community who could not read or write were assisted by translators to complete the questionnaires (all pictures were taken with consent from participants for research purposes).
Data Analysis
All analyses were done in R (R Core Team, 2020). Genotype preferences were assessed using the PlackettLuce package (Turner et al., 2020), an implementation of the Plackett-Luce model (Luce, 1959; Plackett, 1975) in R. The Plackett-Luce model estimates the “worth parameter,” the probability that a genotype wins against all other genotypes in the set. The model follows the Luce's Choice Axiom, which states that the probability that one item beats another is independent from the presence or absence of any other items in the set (Luce, 1959). To consider explanatory variables, we created Plackett-Luce Trees (PLT) through model-based recursive partitioning (Zeileis et al., 2008). For model-based recursive partitioning with the PLT we used the variables district, age (integer number) and gender (man, woman). Rankings from home and centralized tasting trials were analyzed independently. The PLT models had a cut-off value of α = 0.1 and a minimum group size of 10. The procedure to select splitting variables for the PLT are described by Turner et al. (2020). This procedure first fits a Plackett-Luce model to the full data, then assesses the stability of the worth parameters. If there is significant instability, the model splits the full data by the covariate showing the strongest instability. The process is repeated until there is no more significant instability.
Supporting Software
Organizing the data relied on the R packages gosset (de Sousa et al., 2020), janitor (Firke, 2020), readxl (Wickham and Bryan, 2019), tidytext (Silge and Robinson, 2016) and tidyverse (Wickham et al., 2019). Statistical analyses were performed using the packages gtools (Warnes et al., 2020), gosset (de Sousa et al., 2020), multcompView (Graves et al., 2019), PlackettLuce (Turner et al., 2020), and qvcalc (Firth, 2020). Charts were produced using packages ggparty (Borkovec and Madin, 2019), ggplot2 (Wickham, 2016), and patchwork (Pedersen, 2020). All the data and R code used in this research are available through Zenodo (Moyo et al., 2020). Most methods are also available for automatic report generation in the ClimMob platform (https://climmob.net).
Results
Crowdsourced Citizen Science Supports the Identification of Promising Genotypes
In a first analysis, we aggregated the results from the 27 tested genotypes, and the group of 1,433 total participants from the two target countries from both home and centralized tasting trials (Figure 3). In Ghana, eight varieties showed a positive favourability score, which means they were more frequently ranked as better than the other varieties in the incomplete blocks. These included four released varieties SARI-Nyumingre (Obare), SARI-Nan, CRI-Yiedie (CIP442162) and CRI-Ligri; and four advanced clones PG17136 N1, PG17305-N1, PG17362-N1, and PGN16021-39 (Figure 3A). In Uganda, only Ejumula and NASPOT 13, displayed positive favourability scores (Figure 3B). Reference varieties were identified as NASPOT 8 for Uganda and SARI-Nyumingre (Obare) for Ghana, representing the most commonly planted and consumed varieties in the different communities.
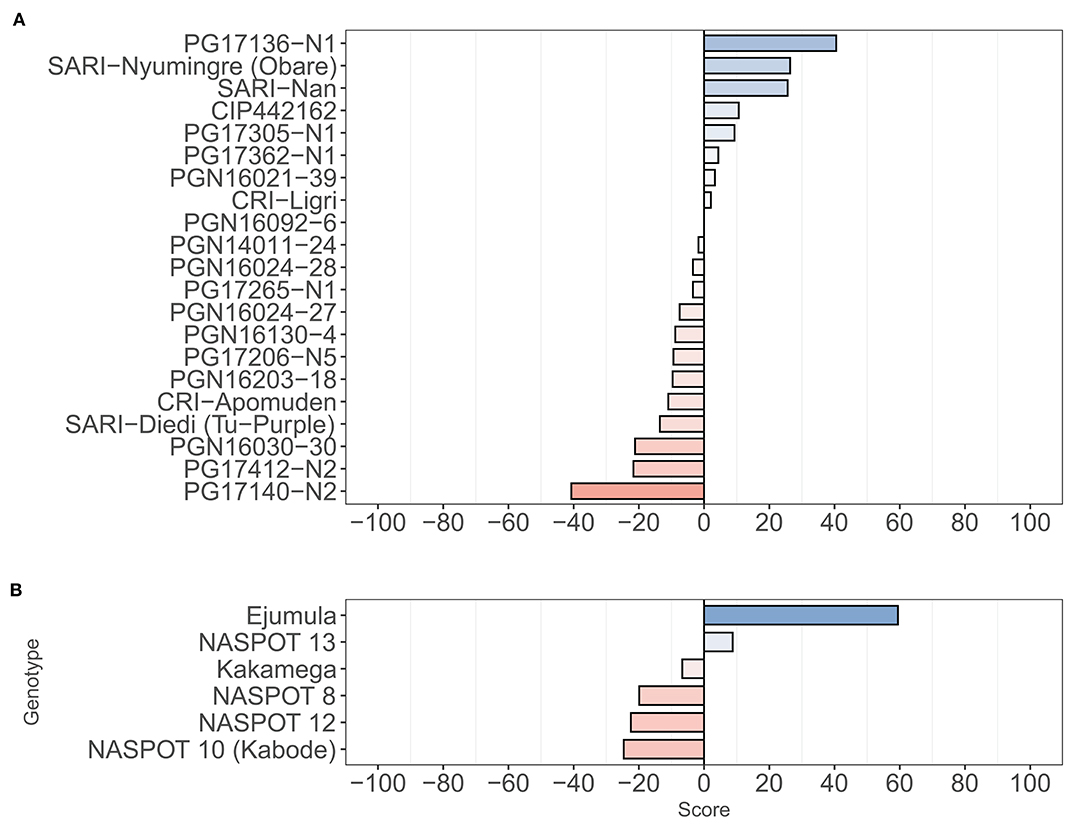
Figure 3. Favourability score for the genotypes evaluated in (A) Ghana and (B) Uganda. Score is based on the relative number of times a given genotype is preferred over the others in pairwise contests in both home and centralized tasting trials.
We then disaggregated the rankings among trials (home and centralized) to assess whether the participants ranked the genotypes differently between trials. The relation between model estimates for home testing and centralized testing was assessed using a method proposed by Bland and Altman (1986). In Ghana, a marked difference is shown for the model estimates between the centralized tasting trial (Figure 4A) and the home tasting trial (Figure 4B). The genotype PG17136-N1 outperformed the reference [SARI-Nyumingre (Obare)] in both trials. However, while in the centralized trial only one genotype (SARI-Nan) had similar performance (same preference) compared to the reference, the home trial shows that other six genotypes performed equally compared to the reference. This weak relationship between estimates is shown in Figure 4C, where the genotypes PG17206-N5 and PGN16030-30 had different levels of performance among trials.
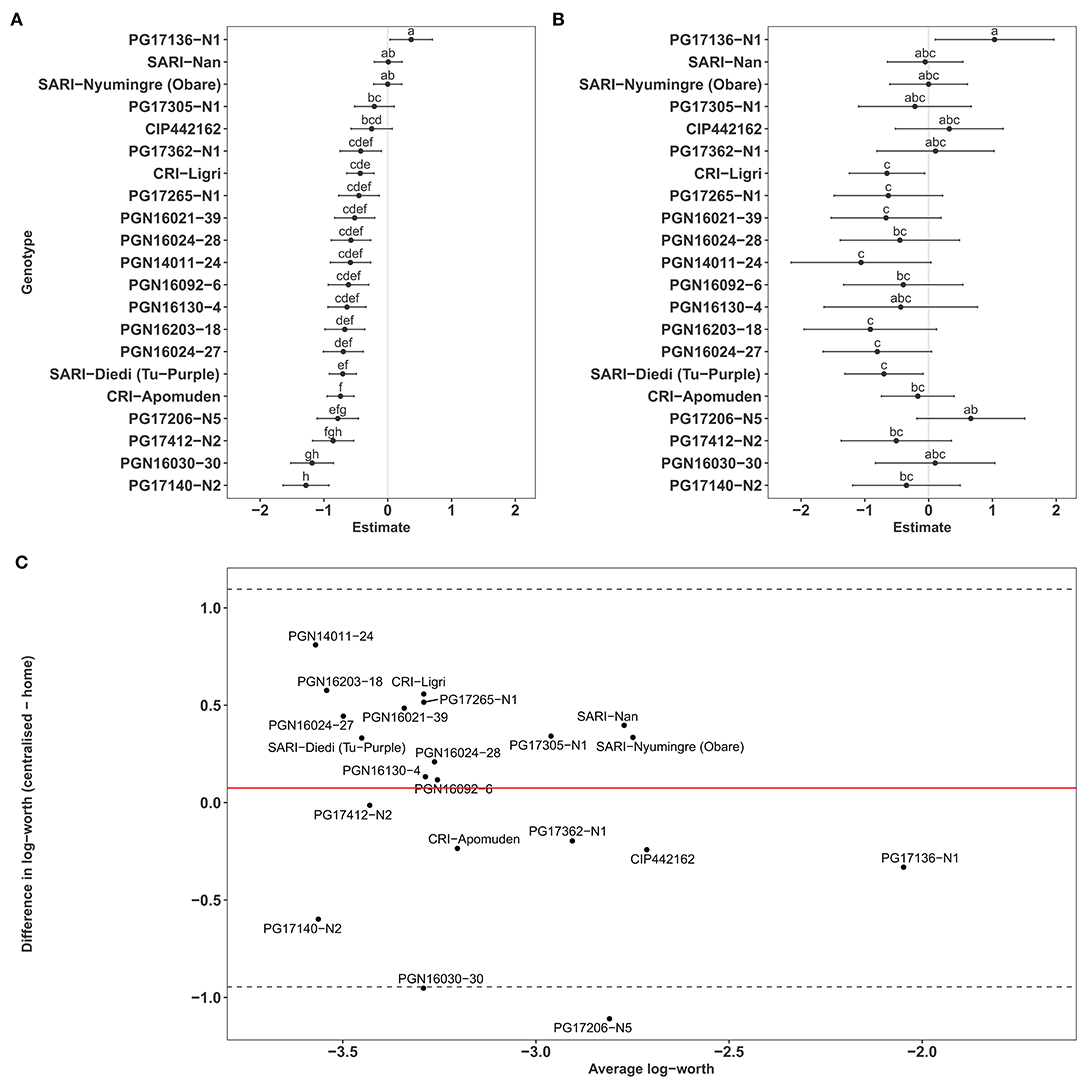
Figure 4. Plackett-Luce Model estimates (log-worth parameters) from tested genotypes in Ghana. Different letters indicate significant differences at p < 0.05. (A) Log-worth parameters from centralized tasting. (B) Log-worth parameters from home tasting. (C) Differences between log-worth parameters in centralized and home tasting in Ghana. The genotype “SARI-Nyumingre (Obare)” is set as a reference (log-worth arbitrarily set to zero). In (C), solid red line represents the mean of difference in log-worth (centralized–home), upper dashed lines represent the mean + 2SD (standard deviation), bottom dashed line represent the mean−2SD.
The results show a stronger relationship between the home trial and centralized trial for Uganda (Figures 5A,B). The genotype Ejumula outperformed all the others in both trials. The second-preferred genotype was different for each trial. In the centralized trial, Kakamega, NASPOT 8 (the reference) and NASPOT 13 had statistically similar performance. In contrast, in the home trial, NASPOT 13 outperformed the reference for second rank. Figure 5C shows the difference in model estimates between the two trials as a comparison for their correlation.
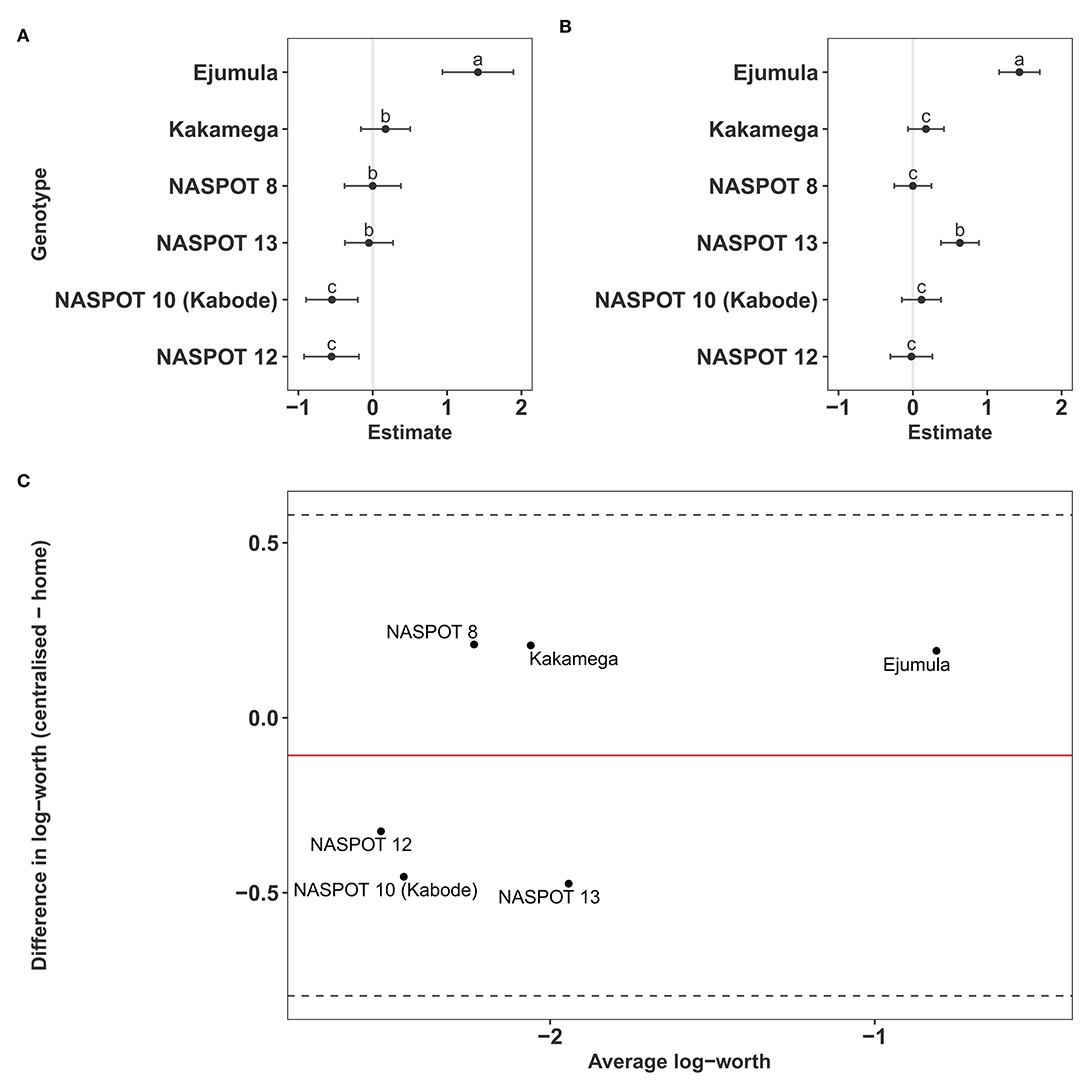
Figure 5. Plackett-Luce Model estimates (log-worth parameters) from tested genotypes in Uganda. Different letters indicate significant differences at p < 0.05. (A) Log-worth parameters from centralized tasting. (B) Log-worth parameters from home tasting. (C) Difference between log-worth parameters in centralized and home tasting in Uganda. The genotype “NASPOT 8” is set as a reference (log-worth arbitrarily set to zero). In (C), solid red line represents the mean of difference in log-worth (centralized–home), upper dashed lines represent the mean + 2SD (standard deviation), bottom dashed line represent the mean−2SD.
Overall, the Plackett-Luce estimates for the ranked preferences show that in Ghana, PG17136-N1 (an advanced trial variety) outperformed the reference [SARI-Nyumingre (Obare)] and was the most preferred genotype among the participants (Table 4). The genotypes SARI-Nan and CRI-Yiedie (CIP442162) were ranked as second and showed no difference compared to the reference. Least preference was estimated to the advanced varieties PG17412-N2, PGN16030-30, and PG17140-N2.
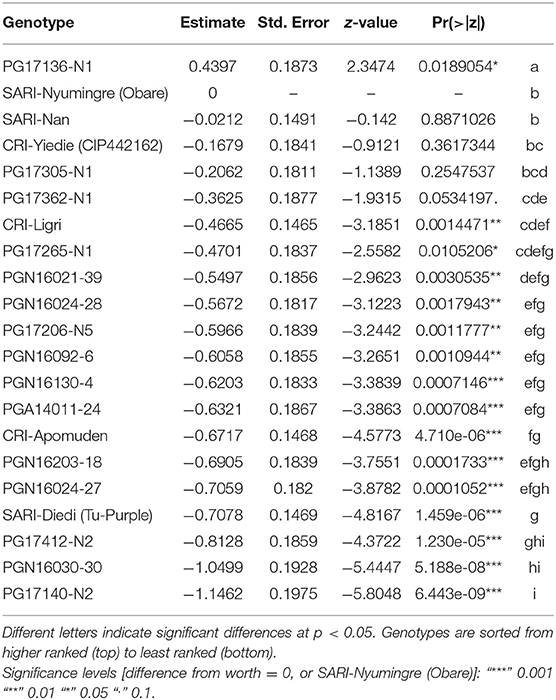
Table 4. Plackett-Luce Model estimates from genotypes tested in Ghana.
In Uganda, two genotypes outperformed the reference “NASPOT 8.” The genotype Ejumula was the most preferred (Table 5). NASPOT 13 is the second preferred genotype, showing significant difference compared to the reference. NASPOT 10 (Kabode) and NASPOT 12 ranked as least preferred genotypes, but with no significant difference compared to the reference NASPOT 8.
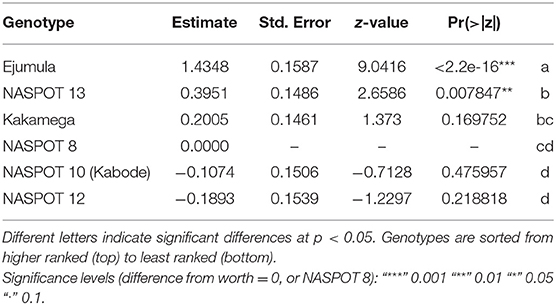
Table 5. Plackett-Luce Model estimates from genotypes tested in Uganda.
Characteristics That Drive Consumer Preference
In addition to overall acceptability (OA), “taste” and “color” attributes of boiled sweetpotato were also evaluated in Uganda. The Kendall correlation (τ) between the overall acceptability and the other traits, shows that “taste” is the main driver for the participants final decision in ranking a given genotype as best or worst (Table 6). In 88% of the times that a given genotype was ranked as best for the trait “taste,” the given genotype was also ranked as best for OA. The same is found for the worst performance in 81% of the cases. We identified a negative Kendall correlation between OA and “color,” showing that this was not a driver for the participants decision in ranking the genotypes in Uganda.
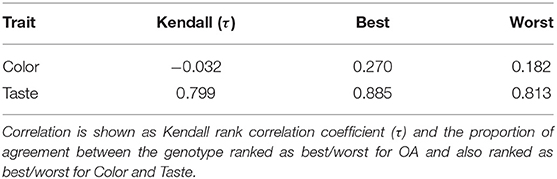
Table 6. Correlation between rankings provided for overall acceptability (OA), Color and Taste assessed in Uganda.
Participants were requested to use their own vocabulary/descriptors for the best and worst genotypes in both Ghana and Uganda and a summary of these reasons is provided in Figure 6A. Results from home and centralized tasting trials were combined for this analysis. Overall, the main driver for the best rankings was that a given variety had a good taste or a preferred level of sweetness. Worst rankings were given by a tasteless flavor, bad appearance, or an excessively sweet flavor. The most common sentiments associated with each tested genotype are shown in Figures 6B,C.
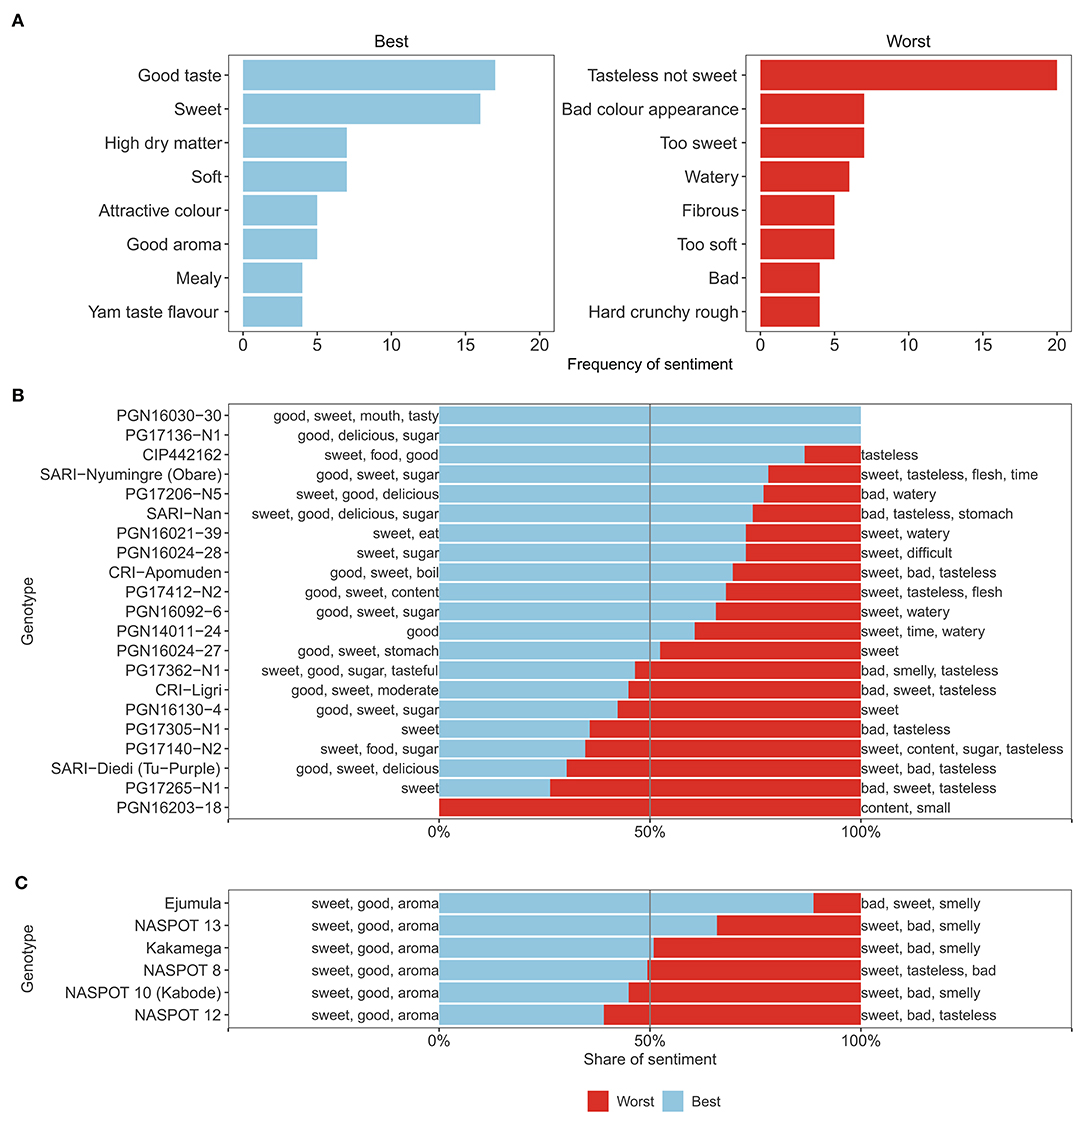
Figure 6. Sentiment analysis for the drivers of consumer preference for boiled sweetpotato genotypes. (A) Overview of the drivers of best and worst appreciation of boiled sweetpotato genotypes in Ghana and Uganda. (B) Share of sentiment for the evaluation of a given genotype as best or worst in Ghana. (C) Share of sentiment for the evaluation of a given genotype as best or worst in Uganda. Sentiments on the left side are the most common words associated with a given genotype for best preference. Sentiments in the right are the most common words associated with a given genotype for worst preference.
Socio-Economic and Geographical Segmentation of Consumers
Recursive partitioning trees (Zeileis et al., 2008) were used to distinguish groups of participants with similar preferences using socio-economic and geographical covariates for the home and centralized trials separately. In Ghana, we found groups split by district in the centralized tasting and we found no split in the home tasting trial (Figure 7). In the centralized tasting the genotypes PG17136-N1, SARI-Nyumingre (Obare) and CIP442162 outperformed the others among participants in the districts of Bongo and Bole. The genotypes SARI-Nan and PG17136-N1 outperformed the other genotypes among the participants in the districts of Kasena-Nankana West. In the Home tasting trials the genotype PG17136-N1 outperformed all the other genotypes regardless of the district.
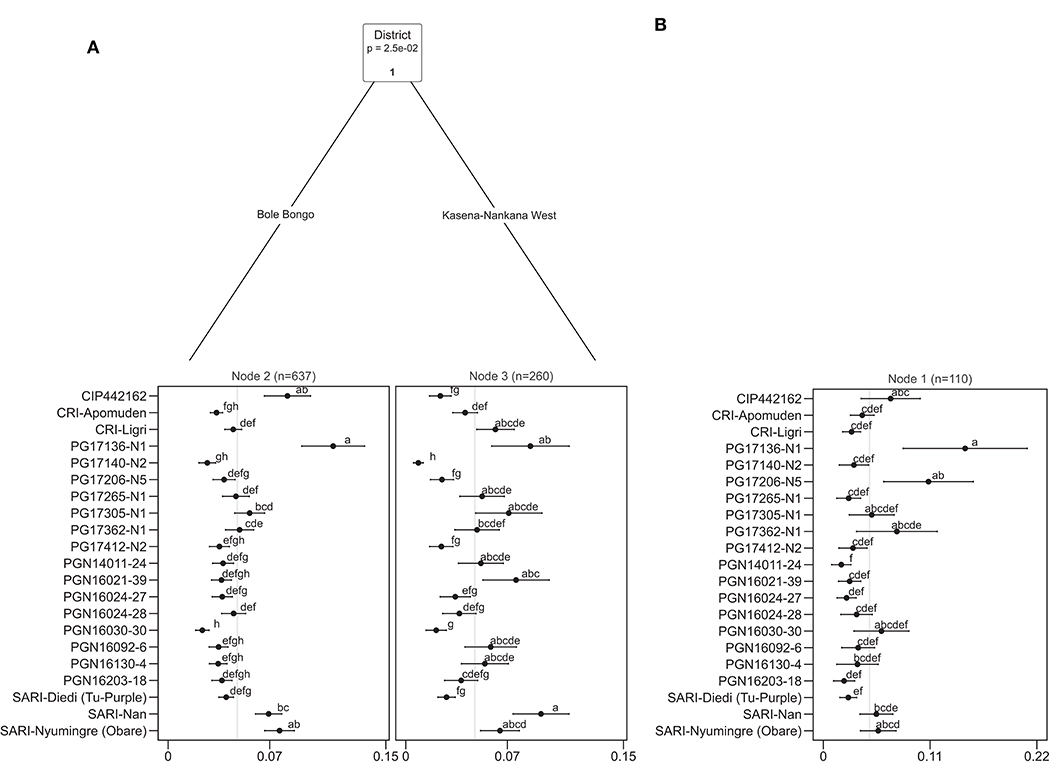
Figure 7. Plackett-Luce Tree of crowdsourcing citizen-science evaluation on sweetpotato genotypes in (A) centralized tasting and (B) home tasting in Ghana. The horizontal axis of each panel represents the probability of winning for the genotypes. Error bars show quasi-SEs. The gray vertical line indicates the average probability of winning (1/number of genotypes). In this case, the model selected the district as the splitting covariate. Different letters indicate significant differences at p < 0.1.
For Uganda, the results for both tasting approaches show two groups with different preference split by District (Figure 8). In the centralized tasting, the genotype Ejumula showed outstanding performance with a 60% probability in outperforming the other genotypes in all the districts. The difference in performance is shown for the second significantly different genotypes, in Gulu it is NASPOT 12 and NASPOT 8, whereas in Soroti/Serere and Wakiso it is Kakamega and NASPOT 13 (Figure 8A). For the home tasting, the genotype NASPOT 12 showed higher probability of winning against the other genotypes in the district of Gulu, while the genotype Ejumula was the preferred one in Soroti/Serere and Wakiso.
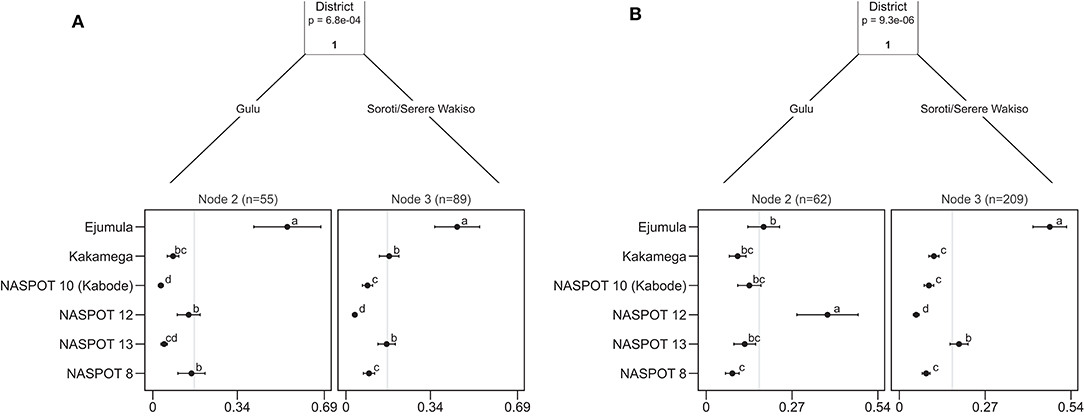
Figure 8. Plackett-Luce Tree of crowdsourcing citizen-science evaluation on sweetpotato genotypes in (A) Centralized tasting and (B) Home tasting in Uganda. The horizontal axis of each panel represents the probability of winning for the genotypes. Error bars show quasi-SEs. The gray vertical line indicates the average probability of winning (1/number of genotypes). In this case, the model selected the district as the splitting covariate. Different letters indicate significant differences at p < 0.1.
We then assessed the averaged probability of winning across the Plackett-Luce nodes shown for Ghana (Figure 7) and Uganda (Figure 8, Table 7). This measure produced similar recommendations for both Ghana and Uganda, recommending PG17136-N1 and Ejumula as the best choices respectively.
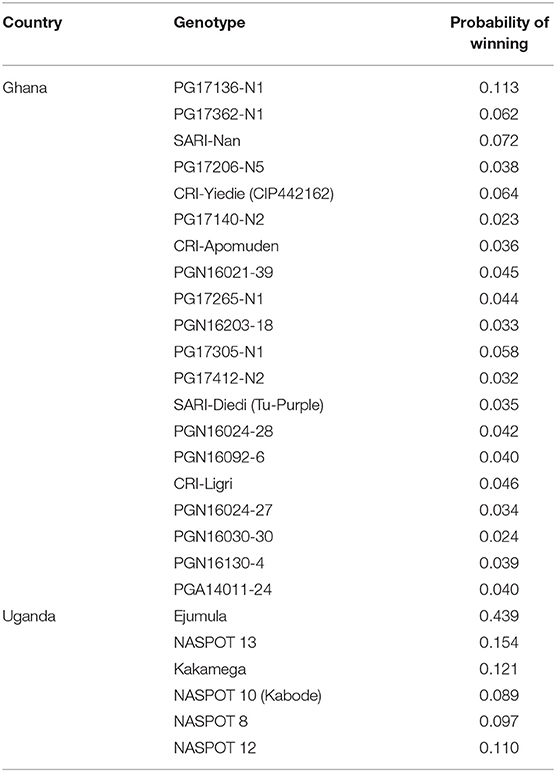
Table 7. Expected probability of winning (average of all nodes in the Plackett-Luce Tree) across the nodes in the Plackett-Luce Trees for Ghana and Uganda.
Insights From Implementing Home and Centralized Tasting Approaches
Home tasting was a more independent style of evaluation whilst centralized tasting involved control over sample preparation. Key aspects of implementing the two approaches in Ghana and Uganda are documented in Table 8.
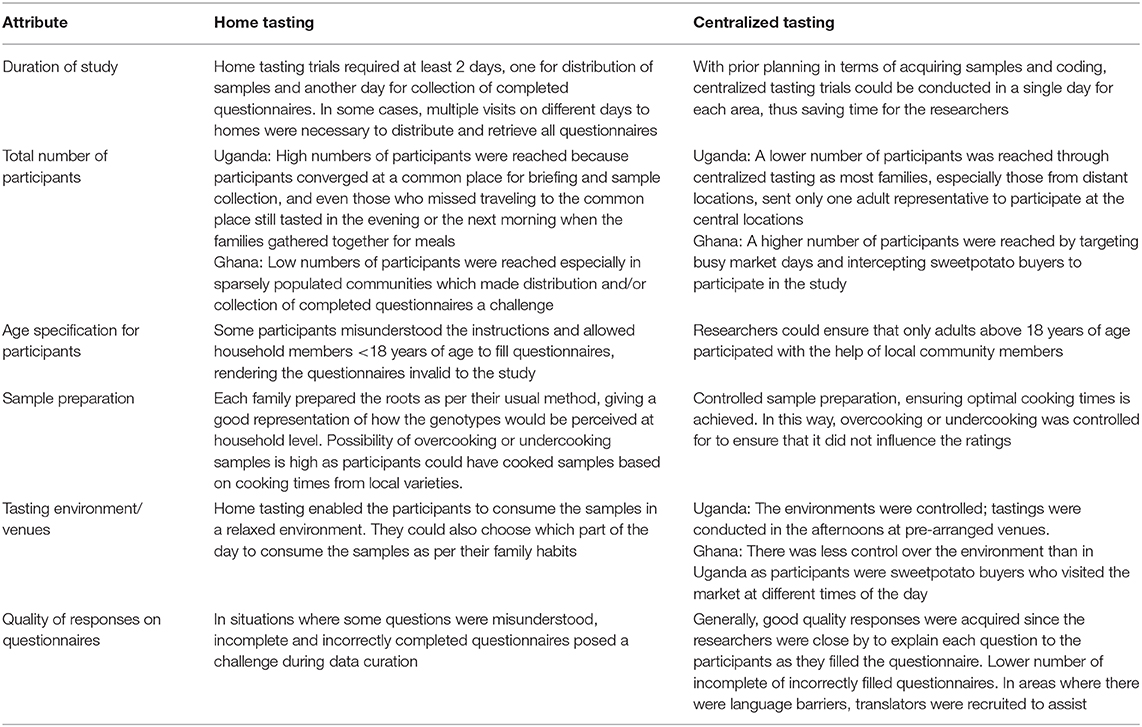
Table 8. Comparison between home and centralized tasting as approaches for consumer preference studies using the tricot method.
Discussion
Overall Preferences
In Ghana, PG17136-N1, a white fleshed, high dry matter clone at the advanced trial stage of the breeding pipeline, had the highest favourability score from a selection of 21 genotypes, and ranked highest in both home and centralized tasting approaches (Figure 3A, Table 4). PG17136-N1 was not significantly different statistically from SARI-Nyumingre (Obare), the currently most popular variety in the area, if centralized and home tasting are considered separately. However, if the data from home and centralized tasting are pooled, the difference is statistically significant (p < 0.05; Table 4). Based on these findings, we consider that the identification of PG17136-N1 as a material that is superior to SARI-Nyumingre (Obare) is robust for the study area.
Consumers in Uganda identified Ejumula, an orange fleshed, high dry matter clone as their most preferred variety, with the highest favourability score amongst the six that were evaluated in both home and centralized tasting approaches (Figure 3B, Table 5). Ejumula is a local landrace with low field resistance to sweetpotato virus disease (SPVD) and Alternaria blight. Our results support previous reports that the maintenance of this variety by farmers, in spite of its disease susceptibility, is likely due to its superior consumption characteristics (Mwanga et al., 2007). Notably, Ejumula is a donor parent to NASPOT 13 in the breeding pipeline, which was also highly acceptable by consumers. Both Ejumula and NASPOT 13 are ranked superior to NASPOT 8, which is the most commonly cultivated variety within the target communities.
In both Ghana and Uganda, the study has identified a variety that consistently outperforms the local check variety and has the highest score regardless of the method of tasting (home or centralized). While the top varieties were consistent, there were differences in the order of rankings for the remainder of the varieties when comparing the two approaches (Figures 4, 5). More inconsistencies in rank order are expected among lower ranking items, as negative aspects may overwhelm their ability to tease out subtle differences. However, most inconsistencies are within the bounds of the confidence of the parameter estimates. The home tasting results in Ghana display low statistical significance, probably due to the low number of participants (n = 118) given the number of varieties that were tested (n = 21) (Table 2, Figure 4). Statistically, this small sample size increased variation and hampered the discrimination power of the trial (Granato et al., 2014). In anticipation of such variation, future studies should aim at increasing consumer population size, particularly for home tasting, than would be required for controlled or lab-based analyses.
Differences are not only random and due to sample sizes, however, as there were important methodological differences between the centralized and home trials. Centralized tasting was conducted with experimental control over sample preparation, particularly cooking time and amount of water added to boil the roots. In addition, tasting conditions such as serving temperature and environment were consistent for all the varieties in each location. On the other hand, participants were instructed to follow their usual preparation method for home tasting, with no instruction on conditions under which samples should be evaluated. The possible differences in cooking times and serving temperatures between the two approaches could have affected the sensory attributes of the samples and in turn their perception and appreciation by the consumers. In future studies, it should be attempted to characterize the preparation practices, actual use, and adoption context of the varieties at household level and include these aspects in the statistical analysis.
Another possible explanation for the recorded differences between rank order from home and centralized tasting is a mismatch between the consumer population samples between the two approaches. People with different gender, socio-economic, and age profiles are likely to have been selected in centralized and home tasting trials. We expect that home tasting provides a less biased sample, as selection is more inclusive. However, in future studies, it would be recommended to record these aspects and include them in the statistical analysis as much as possible.
Factors That Influence Overall Preferences
Apart from overall acceptability, also color and taste attributes were evaluated in Uganda (Table 6), but not in Ghana. In Uganda, color was not identified as a driver for the consumers' decision in ranking the varieties. These results could have been influenced by the range of hues in the set of varieties tested. On the other hand, consumers identified taste as the main driver for the rankings with “good taste” and “sweet” being the most common descriptors used for the best ranking variety whilst, “not sweet” and “tasteless” were amongst the most common descriptors for the worst ranking varieties (Figure 6). Our results are in line with those reported by Mwanga et al. (2020) for Lira and Kamwenge districts in Uganda, where consumers preferred sweet tasting sweetpotato genotypes. Sweetness is a sensory attribute commonly perceived when consuming foods rich in sugars. Kakamega, NASPOT 10 (Kabode) and NASPOT 13 were described as “too sweet” by some participants and the average sugar content in raw roots is 16.84, 15.55, and 16.73%, respectively (Table 1). None of the participants described NASPOT 8 as “too sweet” even though the raw roots display sugar content higher than that of NASPOT 10 (Kabode) at 16.47%. Raw roots contain sucrose, glucose, and fructose whilst the boiling process results in starch being hydrolysed to maltose, a major contributor to the “sweet” taste in cooked sweet potato. Thus, the nutritional profiles of the raw roots do not give a clear picture of the profiles of the boiled samples, especially since sugars are known to leach out during boiling (Lyimo et al., 2010; Guillén et al., 2017). Nutrient retention databases (USDA., 2007) are a useful resource but tend to lack variety specific data on some nutritional components. Generating data on variety specific nutrient retention studies would be important to understand consumer preferences to cooked sweetpotato.
Geographic location was identified as a distinguishing factor for consumer preferences to boiled sweetpotato in both Ghana and Uganda (Figures 7, 8). These results highlight the complexity of consumer preferences toward any given product and the need to understand the underlying socio-economic variables of target populations (Rakotosamimanana and De Kock, 2020). Variety promotion may target different varieties in different areas, although in this case, probably the same single variety could be promoted across all study areas if only one variety had to be selected.
Study Execution Aspects
This research enabled us to document and compare key aspects of the two approaches (home and centralized tasting) employed for evaluating consumer preferences to boiled sweetpotato to highlight the dynamics to be considered when conducting similar studies in future (Table 8). From both countries, it was evident that centralized tasting gave the researchers more control over sample preparation, tasting environment, and reduced the number of rejected questionnaires since they could supervise every step of the process.
In Ghana, consumers participated in centralized tasting during the course of the day since they were intercepted next to busy sweetpotato markets. This strategy ensured that participants were limited to those who bought sweetpotato for their families and are therefore, likely sweetpotato consumers themselves. Since market sites were centralized, consumers from different villages had more or less equal opportunities to participate making the data generated more comprehensive. One drawback to this approach includes the difficulty to obtain the undivided attention of the consumers who had not anticipated to spend much time at the market. Their lack of attention to details on the questionnaires could have compromised the quality of their responses. In Uganda, venues were pre-arranged, and participants were mobilized to meet at specific times. This increased the likelihood that the researchers had the undivided attention of the consumers during the course of the activity. It also meant, however, that only consumers who were not engaged elsewhere at that particular time could participate and this could have potentially eliminated a valuable segment of consumers. Future studies could conduct centralized tastings over several days and provide options to participate during different time slots to accommodate the schedules of different consumers.
The home tasting trials presented different experiences and challenges in both countries. In Ghana, samples, and questionnaires were distributed to individual households and recovered similarly. This approach ensured that each household had the undivided attention of the research team during the visits and could easily seek clarification on the completion of the questionnaires. The scattered distribution of households in some districts however made it logistically impossible for some consumers to be included in the study, potentially causing a sampling bias. In Uganda, representatives of households congregated at centralized locations for sample collection and briefing on completion of the questionnaires. Whilst this approach saved time for the research team, it potentially excluded households which were engaged in other activities at the pre-arranged time of the meeting day. Future studies should aim at assigning more time and resources to this approach to enable more consumer households to be visited for sample distribution and recovery of completed questionnaires.
Conclusions
This study applied the tricot method to consumer evaluation of boiled sweetpotato in Ghana and Uganda. The most preferred genotypes were consistent across different implementations of the tricot approach (centralized vs. home tasting) and user segments. Based on these results, PG17136-N1 is the most preferred genotype in Ghana amongst the communities that participated in this study whilst Ejumula is the most preferred in Uganda. Taste was identified as the main driver for the consumers' ranking of the genotypes with geographic location also playing an important role. Overall, these results prove that tricot is a robust tool which could effectively be adapted to consumer preference studies. Using tricot for both on-farm trials and consumer preference studies provides an opportunity for a single, methodologically consistent approach to inform release decisions for varieties that meet both farmer and consumer expectations. Tricot can therefore contribute to coordinated efforts of breeders and food scientists to deliver varieties that are likely to meet demand along different nodes of the sweetpotato value chain.
Future studies should consider the choice to conduct either home or centralized tasting approaches or a combination of both, each option having strengths and weaknesses. Also, sample sizes and recruitment strategies should be carefully considered. Collecting more contextual data about the food preparation methods and context and socio-economic characteristics of the participants and their households could feed into a more refined analysis and a possible correction of participant selection biases. The burden to the participant should be kept to a minimum, however. Also, researchers should resist the temptation to use experimental control to reduce variation and increase statistical power. The strength of the tricot citizen science approach is its potential to bring testing closer to the use context, making it representative of likely future use of the tested materials.
Data Availability Statement
The data and R code used in this research are available through Zenodo, https://doi.org/10.5281/zenodo.4117591 (Moyo et al., 2020).
Ethics Statement
Oral consent was obtained from the individual(s) for the publication of any potentially identifiable images or data included in this article.
Author Contributions
TM, EC, HL-K, MM, RS, JE, and KS designed the concept of the research study and the research tools. MM, RS, SN, MN, ED, DA, and JA-D conducted the field work. TM and EC supervised the overall research activities. KS and JE analyzed the data. MM, RS, KS, and JE wrote the manuscript. All authors reviewed all versions of the manuscript and contributed by suggesting novel additional analyses and interpretations.
Funding
This research was undertaken as part of, and funded by, the CGIAR Research Program on Roots, Tubers and Bananas (RTB) and supported by CGIAR Trust Fund contributors (https://www.cgiar.org/funders/).
Conflict of Interest
The authors declare that the research was conducted in the absence of any commercial or financial relationships that could be construed as a potential conflict of interest.
Acknowledgments
We would like to thank all funders who supported this research through their contributions to the CGIAR Trust Fund (https://www.cgiar.org/funders/). We also acknowledge the support of the regional communities and sweet potato associations in Ghana and Uganda who participated in the study.
Supplementary Material
The Supplementary Material for this article can be found online at: https://www.frontiersin.org/articles/10.3389/fsufs.2021.620363/full#supplementary-material
References
Abidin, P. E., Carey, E., Mallubhotla, S., and Sones, K. (2017). Sweetpotato Cropping Guide. Nairobi: Africa Soil Health Consortium.
Abong', G. O., Ndanyi, V. C. M., Kaaya, A., Shibairo, S., Okoth, M. W., Lamuka, P. O., et al. (2016). A review of production, post-harvest handling and marketing of sweetpotatoes in Kenya and Uganda. Curr. Res. Nutr. Food Sci. 4, 162–181. doi: 10.12944/CRNFSJ.4.3.03
Andrade, M., Barker, I., Cole, D., Fuentes, S., Gruneberg, W., Kapinga, R., et al. (2009). Unleashing the Potential of Sweetpotato in Sub-Saharan Africa: Current Challenges and Way Forward. Working Paper 2009–1. Lima: International Potato Center (CIP).
Baafi, E., Manu-Aduening, J., Gracen, V. E., Ofori, K., Carey, E. E., and Blay, E. T. (2016). Development of end-user preferred sweetpotato varieties. J. Agricul. Sci. 8, 57–73. doi: 10.5539/jas.v8n2p57
Bao, B. M., and Fweja, L. W. T. (2020). Evaluation of the potential of freshly bred orange-fleshed sweet potato varieties in combating vitamin A deficiency. Tanz. J. Sci. 46, 1–8.
Bland, M. J., and Altman, D. G. (1986). Statistical methods for assessing agreement between two methods of clinical measurement. J. Chem. Inf. Model 53, 1689–1699.
Borkovec, M., and Madin, N. (2019). ggparty: “ggplot” Visualizations for the “partykit” Package. R Package Version 1.0.0. CRAN R Project. Available online at: https://cran.r-project.org/package=ggparty
Carabante, K. M., and Prinyawiwatkul, W. (2018). Data analyses of a multiple-samples sensory ranking test and its duplicated test: a review. J. Sens. Stud. 33, 1–13. doi: 10.1111/joss.12435
Chandrasekara, A., and Kumar, T. J. (2016). Roots and tuber crops as functional foods : a review on phytochemical constituents and their potential health benefits. Int. J. Food Sci. 2016:3631647. doi: 10.1155/2016/3631647
Coetzee, H., and Taylor, J. R. N. (1996). The use and adaptation of the paired-comparison method in the sensory evaluation of hamburger-type patties by illiterate/semi-literate consumers. Food Qual. Prefer 7, 81–85. doi: 10.1016/0950-3293(95)00039-9
de Sousa, K., van Etten, J., Dumble, S., Greliche, N., and Steinke, J. (2020). gosset: Modelling Metadata and Crowdsourcing Citizen Science. CRAN R Project. Available online at: https://agrobioinfoservices.github.io/gosset/
Ellong, E. N., Billard, C., and Adenet, S. (2014). Comparison of physicochemical, organoleptic and nutritional abilities of eight sweet potato (Ipomoea batatas) varieties. Food Nutr. Sci. 5, 196–311. doi: 10.4236/fns.2014.52025
Fiorella, K. J., Chen, R. L., Milner, E. M., and Fernald, L. C. H. (2016). Agricultural interventions for improved nutrition: a review of livelihood and environmental dimensions. Glob. Food Secur. 8, 39–47. doi: 10.1016/j.gfs.2016.03.003
Firke, S. (2020). Janitor: Simple Tools for Examining and Cleaning Dirty Data. R Package Version 2.0.1. CRAN R Project. Avaialble online at: https://cran.r-project.org/package=janitor
Firth, D. (2020). qvcalc: Quasi Variances for Factor Effects in Statistical Models. R Package Version 1.0.2. CRAN R Project. Avaialble online at: https://cran.r-project.org/package=qvcalc
Flynn, T. N., and Marley, A. A. J. (2014). “Best-worst scaling: theory and methods,” in Handbook of Choice Modelling, eds S. Hess and A. Daly (Cheltenham: Edward Elgar Publishing), 178–201.
Glato, K., Aidam, A., Kane, N. A., Bassirou, D., Couderc, M., Zekraoui, L., et al. (2017). Structure of sweet potato (Ipomoea batatas) diversity in West Africa covaries with a climatic gradient. PLoS ONE 12:e0177697. doi: 10.1371/journal.pone.0177697
Granato, D., de Araújo Calado, V. Ô. M., and Jarvis, B. (2014). Observations on the use of statistical methods in food science and technology. Food Res. Int. 5, 137–149. doi: 10.1016/j.foodres.2013.10.024
Graves, S., Piepho, H.-P., Selzer, L., and Dorai-Raj, S. (2019). multcompView: Visualizations of Paired Comparisons. R Package Version 0.1-8. CRAN R Project. Available online at: https://cran.r-project.org/package=multcompView
Guillén, S., Mir-Bel, J., Oria, R., and Salvador, M. L. (2017). Influence of cooking conditions on organoleptic and health-related properties of artichokes, green beans, broccoli and carrots. Food Chem. 217, 209–216. doi: 10.1016/j.foodchem.2016.08.067
Hein, K. A., Jaeger, S. R., Tom Carr, B., and Delahunty, C. M. (2008). Comparison of five common acceptance and preference methods. Food Qual. Prefer 19, 651–661. doi: 10.1016/j.foodqual.2008.06.001
Jaron, G., Katie, P. H., Allison, K., Alison, C., Travis, R., and Leigh, A. (2015). Root, Tuber, and Banana Textural Traits a Review of the Available Food Science and Consumer Preferences Literature. Seattle, WA: Evans School of Public Affairs; University of Washington.
Jenkins, M., Shanks, C. B., and Houghtaling, B. (2015). Orange-fleshed sweet potato: Successes and remaining challenges of the introduction of a nutritionally superior staple crop in Mozambique. Food Nutr. Bull. 36, 327–353. doi: 10.1177/0379572115597397
Kamdem, M. J. D. (2016). Developing Sensory Evaluation Methods for Consumers With Low Literacy Levels Applicable in Developing Countries. Pretoria: University of Pretoria, MSc Food Science.
Kihinga, T. J. (2007). Consumer Preference and Acceptability for Sweet Potato Varieties in the Lake zone of Tanzania. Morogoro: University of Agriculture.
Low, J., Ball, A., Magezi, S., Njoku, J., Mwanga, R., Andrade, M., et al. (2017). Sweet potato development and delivery in sub-Saharan Africa. Afr. J. Food Agricult. Nutr. Develop. 17, 11955–11972. doi: 10.18697/ajfand.78.HarvestPlus07
Low, J., Lynam, J., Lemaga, B., Crissman, C., Barker, I., Thiele, G., et al. (2009). “Chapter 16 of The Sweetpotato” in Sweetpotato in Sub-Saharan Africa, eds G. Loebenstein and G. Thottappilly (Springer Science + Business Media), 359–390.
Low, J. W., Arimond, M., Osman, N., Cunguara, B., Zano, F., and Tschirley, D. (2007). A food-based approach introducing orange-fleshed sweet potatoes increased vitamin A intake and serum retinol concentrations in young children in rural Mozambique. J. Nutr. 137, 1320–1327. doi: 10.1093/jn/137.5.1320
Low, J. W., Ortiz, R., Vandamme, E., Andrade, M., Biazin, B., and Grüneberg, W. J. (2020). Nutrient-dense orange-fleshed sweetpotato: advances in drought-tolerance breeding and understanding of management practices for sustainable next-generation cropping systems in Sub-Saharan Africa. Front. Sustain. Food Syst. 4:50. doi: 10.3389/fsufs.2020.00050
Lyimo, M. E., Gimbi, D. M, and Kihinga, T. (2010). Effect of processing methods on nutrient contents of six sweet potato varieties grown in lake zone of tanzania. Tanz. J. Agricult. Sci. 10, 55–61.
Manners, R., and van Etten, J. (2018). Are agricultural researchers working on the right crops to enable food and nutrition security under future climates? Glob. Environ. Change 53, 182–194. doi: 10.1016/j.gloenvcha.2018.09.010
Minet, J., Curnel, Y., Gobin, A., Goffart, J. P., Mélard, F., Tychon, B., et al. (2017). Crowdsourcing for agricultural applications: a review of uses and opportunities for a farmsourcing approach. Comput. Electron. Agricult. 142, 126–138. doi: 10.1016/j.compag.2017.08.026
Montilla, E. C., Hillebrand, S., and Winterhalter, P. (2011). Anthocyanins in purple sweet potato (Ipomoea batatas L.) varieties. Fruit Veg. Cereal Sci. Biotechnol. 5, 19–24.
Moskowitz, H. R. (2005). Thoughts on subjective measurement, sensory metrics and usefulness of outcomes. J. Sens. Stud. 20, 347–362. doi: 10.1111/j.1745-459X.2005.00029.x
Moyo, M., Ssali, R., Namanda, S., Nakitto, M., Dery, E. K., Akansake, D., et al. (2020). Replication data for: Consumer Preference Testing of Boiled Sweetpotato (Ipomoea batatas (L.) Lam.) Using Crowdsourced Citizen Science in Ghana and Uganda. Meyrin: Zenodo.
Mwanga, R. O. M., Mayanja, S., Swanckaert, J., Nakitto, M., zum Felde, T., Grüneberg, W., et al. (2020). Development of a food product profile for boiled and steamed sweetpotato in Uganda for effective breeding. Int. J. Food Sci. Technol. 1–14. doi: 10.1111/ijfs.14792. [Epub ahead of print].
Mwanga, R. O. M., Niringiye, C., Alajo, A., Kigozi, B., Namukula, J., Mpembe, I., et al. (2011). “NASPOT 11”, a sweetpotato cultivar bred by a participatory plant-breeding approach in Uganda. HortScience 46, 317–321. doi: 10.21273/HORTSCI.46.2.317
Mwanga, R. O. M., Odongo, B., Niringiye, C., Alajo, A., Abidin, P. E., Kapinga, R., et al. (2007). Release of two orange-fleshed sweetpotato cultivars, “SPK004” (‘Kakamega') and “Ejumula”, in Uganda. HortScience 42, 1728–1730. doi: 10.21273/HORTSCI.42.7.1728
Nabubuya, A., Namutebi, A., Byaruhanga, Y., Narvhus, J., and Wicklund, T. (2012). Potential use of selected sweetpotato (Ipomea batatas Lam) varieties as defined by chemical and flour pasting characteristics. Food Nutr Sci. 3, 889–896. doi: 10.4236/fns.2012.37118
Oggema, J. N., Kinyua, M. G., Ouma, J. P., and Owuoche, J. O. (2007). Agronomic performance of locally adapted sweet potato (Ipomoea batatas (L) Lam.) cultivars derived from tissue culture regenerated plants. Afr. J. Biotechnol. 6, 1418–1425.
Orr, A., and Mwale, B. (2001). Adapting to adjustment: smallholder livelihood strategies in southern Malawi. World Dev. 29, 1325–1343. doi: 10.1016/S0305-750X(01)00042-0
Pedersen, T. L. (2020). patchwork: The Composer of Plots. R Package Version 1.0.1. CRAN R Project. Available online at: https://cran.r-project.org/package=patchwork
Plackett, R. L. (1975). The analysis of permutations. J. R. Stat. Sock. Ser. C 24, 193–202. doi: 10.2307/2346567
R Core Team (2020). R: A Language and Environment for Statistical Computing. Version 4.0.2. CRAN R Project. Available online at: https://r-project.org/
Rakotosamimanana, V. R., and De Kock, H. L. (2020). Sensory studies with low-income, food-insecure consumers. Curr. Opin. Food Sci. 33, 108–114. doi: 10.1016/j.cofs.2020.03.010
Salawu, S. O., Udi, E., Akindahunsi, A. A., Boligon, A. A., and Athayde, M. L. (2015). Antioxidant potential, phenolic profile and nutrient composition of flesh and peels from Nigerian white and purple skinned sweet potato (Ipomea batatas L.). Asian J. Plant Sci. Res. 5, 14–23.
Siegrist, M., and Hartmann, C. (2020). Consumer acceptance of novel food technologies. Nature Food 1, 343–350. doi: 10.1038/s43016-020-0094-x
Silge, J., and Robinson, D. (2016). tidytext: text mining and analysis using tidy data principles in R. J. Open Sour. Softw. 1:37. doi: 10.21105/joss.00037
Steinke, J., and van Etten, J. (2016). Farmer Experimentation for Climate Adaptation With Triadic Comparisons of Technologies (tricot): A Methodological Guide. Rome: Bioversity International.
Turner, H. L., van Etten, J., Firth, D., and Kosmidis, I. (2020). Modelling rankings in R: the PlackettLuce package. Comput. Stat. 2020, 1027–1057. doi: 10.1007/s00180-020-00959-3
USDA. (2007). USDA Table of Nutrient Retention Factors, Release 6. National Academy Press. Availble online at: www.nal.usda.gov/fnic/foodcomp/Data/retn6/retn06.pdf
van Etten, J., Beza, E., Calderer, L., Van Duijvendijk, K., Fadda, C., Fantahun, B., et al. (2016). First experiences with a novel farmer citizen science approach: crowdsourcing participatory variety selection through on-farm triadic comparison of technologies (TRICOT). Exp. Agricult. 55, 1–22. doi: 10.1017/S0014479716000739
van Etten, J., de Sousa, K., Aguilar, A., Barrios, M., Coto, A., Dell'Acqua, M., et al. (2019). Crop variety management for climate adaptation supported by citizen science. Proc. Natl. Acad. Sci. U.S.A. 116, 4194–4199. doi: 10.1073/pnas.1813720116
Voicu, M.-C. (2013). Characteristics of the consumer preferences research process. Glob. Econ. Observ. 1, 126–134.
Warnes, G. R., Bolker, B., and Lumley, T. (2020). gtools: Various R Programming Tools. R Package Version 3.8.2. CRAN R Project. Avaialble online at: https://cran.r-project.org/package=gtools
Wickham, H. (2016). ggplot2: Elegant Graphics for Data Analysis. New York, NY: Springer-Verlag. Available online at: https://ggplot2.tidyverse.org
Wickham, H., Averick, M., Bryan, J., Chang, W., D', L., Mcgowan, A., et al. (2019). Welcome to the Tidyverse. J. Open Sour. Softw. 4:1686. doi: 10.21105/joss.01686
Wickham, H., and Bryan, J. (2019). readxl: Read Excel Files. R Package Version 1.3.1. CRAN R Project. Available online at: https://cran.r-project.org/package=readxl
Wismer, W. V., Harker, F. R., Gunson, F. A., Rossiter, K. L., Lau, K., Seal, A. G., et al. (2005). Identifying flavour targets for fruit breeding: a kiwifruit example. Euphytica 141, 93–104. doi: 10.1007/s10681-005-5891-7
Zeileis, A., Hothorn, T., and Hornik, K. (2008). Model-based recursive partitioning. J. Comput. Graph. Stat. 17, 492–514. doi: 10.1198/106186008X319331
Keywords: tricot approach, crop evaluation, underutilized crops, Ipomoea batatas, West Africa, East Africa
Citation: Moyo M, Ssali R, Namanda S, Nakitto M, Dery EK, Akansake D, Adjebeng-Danquah J, van Etten J, de Sousa K, Lindqvist-Kreuze H, Carey E and Muzhingi T (2021) Consumer Preference Testing of Boiled Sweetpotato Using Crowdsourced Citizen Science in Ghana and Uganda. Front. Sustain. Food Syst. 5:620363. doi: 10.3389/fsufs.2021.620363
Received: 22 October 2020; Accepted: 05 January 2021;
Published: 03 February 2021.
Edited by:
Alex de Sherbinin, Columbia University, United StatesReviewed by:
Sunette M. Laurie, Agricultural Research Council of South Africa (ARC-SA), South AfricaGabriel da Silva Medina, University of Brasilia, Brazil
Copyright © 2021 Moyo, Ssali, Namanda, Nakitto, Dery, Akansake, Adjebeng-Danquah, van Etten, de Sousa, Lindqvist-Kreuze, Carey and Muzhingi. This is an open-access article distributed under the terms of the Creative Commons Attribution License (CC BY). The use, distribution or reproduction in other forums is permitted, provided the original author(s) and the copyright owner(s) are credited and that the original publication in this journal is cited, in accordance with accepted academic practice. No use, distribution or reproduction is permitted which does not comply with these terms.
*Correspondence: Tawanda Muzhingi, T.Muzhingi@cgiar.org; tmuzhin@ncsu.edu