Multi-Omics Driven Metabolic Network Reconstruction and Analysis of Lignocellulosic Carbon Utilization in Rhodosporidium toruloides
 Joonhoon Kim1,2,3
  Samuel T. Coradetti1,4
  Young-Mo Kim1,3
  Yuqian Gao1,3 Junko Yaegashi2,3
  Jeremy D. Zucker1,3 Nathalie Munoz1,3 Erika M. Zink3
  Kristin E. Burnum-Johnson1,3
  Scott E. Baker1,2,3
  Blake A. Simmons1,2,5
  Jeffrey M. Skerker6
  John M. Gladden1,2,4*
  Jon K. Magnuson1,2,3*
- 1Department of Energy, Agile BioFoundry, Emeryville, CA, United States
- 2Department of Energy, Joint BioEnergy Institute, Emeryville, CA, United States
- 3Pacific Northwest National Laboratory, Richland, WA, United States
- 4Sandia National Laboratories, Livermore, CA, United States
- 5Lawrence Berkeley National Laboratory, Berkeley, CA, United States
- 6Department of Bioengineering, University of California, Berkeley, Berkeley, CA, United States
An oleaginous yeast Rhodosporidium toruloides is a promising host for converting lignocellulosic biomass to bioproducts and biofuels. In this work, we performed multi-omics analysis of lignocellulosic carbon utilization in R. toruloides and reconstructed the genome-scale metabolic network of R. toruloides. High-quality metabolic network models for model organisms and orthologous protein mapping were used to build a draft metabolic network reconstruction. The reconstruction was manually curated to build a metabolic model using functional annotation and multi-omics data including transcriptomics, proteomics, metabolomics, and RB-TDNA sequencing. The multi-omics data and metabolic model were used to investigate R. toruloides metabolism including lipid accumulation and lignocellulosic carbon utilization. The developed metabolic model was validated against high-throughput growth phenotyping and gene fitness data, and further refined to resolve the inconsistencies between prediction and data. We believe that this is the most complete and accurate metabolic network model available for R. toruloides to date.
Introduction
An oleaginous yeast Rhodosporidium toruloides is a non-model basidiomycete fungus known for its ability to produce carotenoids and accumulate lipids. The high flux in lipid and carotenoid biosynthetic pathways makes R. toruloides a promising host organism for producing biofuels and value-added bioproducts from carbon sources derived from lignocellulosic biomass (Wiebe et al., 2012; Fei et al., 2016; Yaegashi et al., 2017; Park et al., 2018; Zhuang et al., 2019). It is also known for the tolerance of inhibitory compounds in lignocellulosic biomass hydrolyzate as well as the ability to consume aromatic compounds related to lignin degradation products (Yaegashi et al., 2017; Sundstrom et al., 2018). For example, R. toruloides can utilize hexoses, pentoses, and aromatic compounds that are found in lignocellulosic biomass hydrolyzate such as glucose, xylose, and p-coumaric acid, and produce bisabolene or amorphadiene (Yaegashi et al., 2017). Genome sequence and annotation are available for several R. toruloides strains and efficient transformation methods have been developed (Zhu et al., 2012; Zhang et al., 2016; Liu et al., 2017; Coradetti et al., 2018). More advanced genetic tools and parts to engineer R. toruloides have been recently developed including RB-TDNAseq, CRISPR/Cas9 editing, RNA interference, and promoter libraries (Coradetti et al., 2018; Liu et al., 2019; Nora et al., 2019; Otoupal et al., 2019).
Previous studies of R. toruloides metabolism primarily focused on the lipid production and carotenoid production and several multi-omics studies have been performed to date (Zhu et al., 2012; Lee et al., 2014; Bommareddy et al., 2017; Coradetti et al., 2018). However, it is still not fully clear how different carbon sources present in lignocellulosic biomass hydrolyzate are utilized. There are multiple reports indicating that R. toruloides’s metabolism of glucose, xylose, or glycerol is different from Saccharomyces cerevisiae’s. For example, R. toruloides is an oleaginous yeast and generates cytosolic acetyl-CoA from citrate using ATP-citrate lyase whereas S. cerevisiae does not have ATP-citrate lyase and uses the pyruvate dehydrogenase bypass (Rodriguez et al., 2016). When grown on D-xylose, R. toruloides transiently accumulates D-arabinitol (or D-arabitol) while S. cerevisiae accumulates xylitol (Jagtap and Rao, 2018). The regulation of genes involved in glycerol metabolism including glycerol kinase and glycerol 3–phosphate dehydrogenase was also found to be different between R. toruloides and S. cerevisiae (Bommareddy et al., 2017). Fatty acids are degraded by peroxisomal β-oxidation in S. cerevisiae, but both mitochondrial and peroxisomal β-oxidation pathways are shown to be present and necessary for efficient fatty acid degradation in R. toruloides. The growth of S. cerevisiae is known to be inhibited by some phenolic compounds that are found in lignocellulosic biomass hydrolyzate including p-coumaric acid, ferulic acid, and coniferyl aldehyde, and S. cerevisiae can convert them to less inhibitory products, but it is unable to grow on them as sole carbon sources (Adeboye et al., 2015). On the other hand, R. toruloides grows on p-coumaric acid, ferulic acid, vanillic acid, p-hydroxybenzoic acid, and benzoic acid (Yaegashi et al., 2017), but the catabolism of aromatic compounds related to lignin is not well studied in fungi yet. Therefore, there is a need for a metabolic network model to systematically investigate the metabolism of non-model oleaginous basidiomycete yeast, R. toruloides. In this work, we reconstruct the genome-scale metabolic network of R. toruloides using high-quality published models and perform manual curation using functional annotation and multi-omics data in a fully reproducible manner. Every step of the reconstruction and curation was written in electronic notebooks starting from the reconstruction of a draft metabolic network to the evaluation of the resulting metabolic model. The developed metabolic model and multi-omics data were used to study the utilization of carbon sources that are present in lignocellulosic biomass hydrolyzate in R. toruloides.
Materials and Methods
Metabolic Network Reconstruction
The R. toruloides IFO0880 genome sequence, gene models, and gene annotation from a previous study (Coradetti et al., 2018) was used for the metabolic network reconstruction. The same study identified R. toruloides proteins that have orthologous proteins in several different eukaryotic organisms using OrthoMCL (Li et al., 2003). To this list we further added orthologous proteins in Escherichia coli K-12 MG1655 and Pseudomonas putida KT2440, identified with a separate OrthoMCL analysis including proteins from R. toruloides NP11, Saccharomyces cerevisiae, Lipomyces starkeyi, and Yarrowia lipolytica. The list of orthologous proteins was used to gather metabolic reactions from BiGG Models (King et al., 2016), a repository containing high-quality manually curated genome-scale metabolic models. Among the models available in BiGG Models, genome-scale metabolic models of S. cerevisiae (Mo et al., 2009), Chlamydomonas reinhardtii (Chang et al., 2011), human (Duarte et al., 2007), mouse (Sigurdsson et al., 2010), E. coli (Monk et al., 2017), and P. putida (Nogales et al., 2008) were used for reconstruction since these models covered most of the orthologous proteins found in R. toruloides. In addition, a genome-scale metabolic model of another oleaginous yeast Y. lipolytica CLIB122 (Wei et al., 2017) was included. For each protein in R. toruloides, metabolic reactions from other metabolic models were added to the R. toruloides metabolic network if orthologous proteins were associated with the reactions, and their gene association was updated with the R. toruloides protein identifiers. The function and localization of proteins was determined by Joint Genome Institute’s annotation on MycoCosm (Grigoriev et al., 2014), WoLF PSORT (Horton et al., 2007) prediction, and the presence of peroxisomal targeting sequences PTS1 and PTS2 predicted by FIMO (Grant et al., 2011) using MEME (Bailey and Elkan, 1994) motifs from known peroxisomal protein sequences.
Metabolic Network Modeling
COBRApy (Ebrahim et al., 2013) was used for curation, evaluation, and modeling of the reconstructed metabolic network. Metabolic models were imported from either the BiGG Models directly or a JSON file constructed from supplemental files from publications. Lieven et al. (2014) was also used to track the development and evaluate the quality of the metabolic model. Escher (King et al., 2015) was used to build metabolic pathway maps and visualize omics data. BOFdat (Lachance et al., 2019) was used to update the biomass composition from experimental data.
Phenotype Microarrays
Phenotype microarray plates and standard components for yeast phenotypic analysis were obtained from Biolog Inc. (Hayward, CA). Wild type R. toruloides IFO0880 was precultured to log phase in LB broth at 30°C, 200 RPM in 10 mL culture tubes. Cells were centrifuged 5 min at 3000 RCF, 22°C, washed twice in sterile water, then resuspended OD 600 of 0.005 in Biolog inoculation fluid IFY-0 with 1 μM nicotinic acid (Sigma, N4126), 1 μM myo-inositol (Sigma, I5125), 1 μM thiamine HCl (Sigma, T1270), 1 μM p-aminobenzoic acid (Sigma, A9878), and 1 μM calcium pantothenate (Sigma, 21210) plus Biolog dye mix E (a proprietary, tetrazolium-based dye) and 1 μM menadione sodium bisulfite (Sigma, M5750). For nitrogen, phosphorous, and sulfur sources 100 mM glucose was added to the inoculation fluid. Hundred microliters of the cell suspension was added to each well in plates PM1, PM2, PM3, and PM4. Plates were sealed with clear sealing film (Axygen, CTP-103) and incubated for 120 h at 30°C in the dark. Respiration in each condition was detected by measuring reduction of the dye by comparing absorbance at 590 nm to absorbance at 750 nm.
Fitness Analysis With RB-TDNAseq
Fitness analysis was performed as described in a previous study (Coradetti et al., 2018). Briefly, the three aliquots of the random insertion mutant pool were thawed on ice and recovered in 100 mL YPD (BD Difco, 242820) for two generations (OD 0.2 to OD 0.8). A 10 mL of each starter culture was pelleted and frozen as an initial “time 0” sample. The remaining cells were pelleted 5 min at 4000 RCF, 22°C, washed twice with sterile water and inoculated at OD 0.1 in 50 mL SD media plus 76 mM KH2PO4 (Sigma, P9791), 24 mM K2HPO4 (Sigma, P3786), and 100 nM FeSO4 (Sigma, 215422) with 1% w/v carbon source. Cultures were grown to OD 600 = 5–10 (20–50 h depending on carbon source) at 30°C, 200 RPM in baffled flasks (25630-250, DWK Life Sciences). Ten milliliters mL samples were pelleted and frozen for DNA extraction. DNA extraction, barcode amplification, and sequencing was performed as described in Coradetti et al. (2018), except that we used primers including dual indexes to prevent “index swapping” on the HiSeq 4000 instrument (Costello et al., 2018) and different lengths of random bases for improved phasing (Price et al., 2019). Fitness analysis was performed with the RBseq software package version 1.0.6, an updated implementation of the algorithms (available at https://github.com/stcoradetti/RBseq). Raw barcode sequencing data are available at the NCBI Sequence Read Archive (PRJNA595384). Fitness scores are available at the fungal fitness browser.1
Lipid Content by Fatty Acid Methyl-Ester Analysis
Twenty milligrams of lyophilized cell mass was suspended in 750 μl 3N methanolic HCl (Sigma, 40104-U) and 50 μl chloroform (Sigma, CX1050-1). A total of 100 μl of 10 mg/mL tridecanoic acid methyl ester (Sigma, T0627) in methanol (Sigma, 34860) was added as an internal standard and all the resuspended cell mass was transferred to bead-bug screw-top tubes with glass beads. Tubes were shaken vigorously in a Retsch Tissue Lyser at 30 cycles/second for 5 min to break up cell aggregates and disrupt cell walls, then incubated in an 80°C water bath for 2 h with occasional vortexing. fatty acid methyl-esters (FAMEs) were extracted with 500 μl n-hexane (Sigma, 650552), and diluted 1:10 in hexane. Methyl esters of palmitic, palmitoleic, heptadecanoic, stearic, oleic, linoleic, alpha linoleic, arachidic, behenic, and lignoceric acid were separated in a DB-wax column (Agilent, 123-7012) on a Thermo Scientific Focus gas chromatograph (AS 3000 II) with a flame ionization detector. Standard curves of ratios of peak areas from standards of those FAMEs (Sigma) to tridecanoic acid methyl ester (internal standard) were established. FAME concentrations were determined by comparing ratios of peak areas of FAMEs to the internal standard in the samples.
Media and Growth Conditions for Multi-Omics Experiment
Wild type R. toruloides IFO0880 was grown in synthetic defined (SD) medium supplemented with different carbon sources (1% glucose, 1% glucose + 1% D-xylose, 1% D-xylose, 1% L-arabinose, or 1% p-coumarate). The SD medium was made with Difco yeast nitrogen base without amino acids (Becton, Dickinson & Co., Sparks, MD) and complete supplemental mixture (Sunrise Science Products, San Diego, CA). Cells were pre-cultured in LB media, and pelleted and washed once with sterile ddH2O before inoculation. Initial pH was adjusted to 7.4 with NaOH, and cells were inoculated to 30 mL of medium with a starting optical density at 600 nm of 0.1. Cultures were grown at 30°C and shaken at 200 rpm. Samples were taken in triplicates at 24 and 48 h in SD glucose, at 24, 66, and 90 h in SD glucose + D-xylose, at 66 and 90 h in SD D-xylose, at 40 and 66 h in SD L-arabinose, and at 40 and 90 h in SD p-coumarate. RNA extraction was performed on Promega’s Maxwell RSC machine using Plant RNA extraction kit (Promega Corporation, Madison, WI). For proteomics and metabolomics, cells were pelleted and washed twice with 100 mM NH4HCO3 at pH 7.8, and spent media was filtered through a 0.45 μm filter.
RNA Sequencing and Analysis
RNA samples were sequenced and processed at Joint Genome Institute (SRP143805, SRP143806, SRP143807, SRP143808, SRP143809, SRP143810, SRP143811, SRP143812, SRP143813, SRP143814, SRP143815, SRP143816, SRP143817, SRP143818, SRP143819, SRP143820, SRP143821, SRP143822, SRP143823, SRP143824, SRP143825, SRP143826, SRP143827, SRP143828, SRP143829, SRP143830, SRP143831, SRP143832, SRP143833, SRP143834, SRP143835, SRP143836, and SRP143838). Raw read counts were used to perform differential gene expression analysis using DESeq2 (Love et al., 2014).
Metabolite Extraction
Metabolites were extracted from the cell pellets using MPLEx method (Nakayasu et al., 2016; Kim and Heyman, 2018). Briefly, the cell pellets were extracted with a solvent mixture of four volumes of a chloroform and methanol mix (2:1) with a volume of nanopure water. Strong vortexing and ice-cold temperature were also used in the protocol to aid the disruption of the cells. After centrifugation, the aqueous layer and half of the organic layer (containing polar and non-polar metabolites, respectively) were combined for GC-MS analysis. The remaining volume of the organic layer was kept for lipidomics analysis. Collected liquid fractions were transferred to new clean vials and subsequently dried in a speed-vacuum concentrator. The denatured protein disk, located between the aqueous and organic layers during the MPLEx protocol, were separately stored for proteomics analysis. All the samples were dried completely and stored in the −80°C freezer until the instrumental analysis.
Metabolomics Analysis
The stored metabolite extracts were completely dried under speed-vacuum to remove moisture and chemically derivatized as previously reported (Kim et al., 2015). Briefly, the extracted metabolites were derivatized by methoxyamination and trimethylsilyation (TMS), then the samples were analyzed by GC-MS. GC-MS raw data files were processed using the Metabolite Detector software, version 2.5 beta (Hiller et al., 2009). Retention indices (RI) of detected metabolites were calculated based on the analysis of a FAMEs mixture, followed by their chromatographic alignment across all analyses after deconvolution. Metabolites were initially identified by matching experimental spectra to a PNNL augmented version of Agilent GC-MS metabolomics Library, containing spectra and validated RI for over 850 metabolites. Then, the unknown peaks were additionally matched with the NIST17/Wiley11 GC-MS library. All metabolite identifications and quantification ions were validated and confirmed to reduce deconvolution errors during automated data-processing and to eliminate false identifications. All metabolomics raw data files are available at OSF data depository https://osf.io/tnqwx/.
Lipidomics
The lipid samples were analyzed using liquid chromatography tandem mass spectrometry (LC-MS/MS) as outlined before (Kyle et al., 2017). Briefly, lipid fractions were re-dried in vacuo to remove moisture and reconstituted in 50 μl methanol, 10 μl of which was injected onto a reversed phase Waters CSH column (3.0 mm × 150 mm × 1.7 μm particle size) connected to a Waters Acquity UPLC H class system interfaced with a Velos-ETD Orbitrap mass spectrometer. Lipid molecular species were separated over a 34 min gradient [mobile phase A: acetonitrile/water (40:60) containing 10 mM ammonium acetate; mobile phase B: acetonitrile/isopropanol (10:90) containing 10 mM ammonium acetate] at a flow rate of 250 μl/min. Samples were analyzed in both positive and negative ionization using higher-energy collision dissociation and collision-induced dissociation to obtain high coverage of the lipidome. Confident lipid identifications were made using in-house developed identification software LIQUID (Kyle et al., 2017) where the tandem mass spectrum was examined for diagnostic ion fragments along with associated hydrocarbon chain fragment information. To facilitate quantification of lipids, a reference database for lipids identified from the MS/MS data was created and features from each analysis were then aligned to the reference database based on their identification, m/z and retention time using MZmine 2 (Pluskal et al., 2010). Aligned features were manually curated and peak apex intensity values were generated for subsequent statistical analysis.
Proteomics
The protein disks were dissolved in 100 mM NH4HCO3 containing 8 M urea and the protein concentration was measured by BCA assay. Disulfide bonds were reduced by adding dithiothreitol to a final concentration of 5 mM and incubating at 60°C for 30 min. Samples were alkylated with a final concentration of 40 mM iodoacetamide for 1 h at 37°C. The reaction was then diluted 10-fold with 100 mM NH4HCO3 followed by the addition of CaCl2 to 1 mM final concentration. Digestion was carried out for 3 h at 37°C with 1:50 (weight:weight) trypsin-to-protein ratio. Salts and reagents were removed by solid-phase extraction using C18 cartridges according to the manufacturer instructions and the resulting peptides were dried in a vacuum centrifuge. The peptides were then resuspended in milliQ water and 500 ng of material was loaded onto in-house packed reversed-phase capillary columns (70-cm × 75 μm i.d.) with 3-μm Jupiter C18. The separation was carried out using a nanoAcquity HPLC system (Waters Corporation) at room temperature. The mobile phase A is 0.1% formic acid in water while mobile phase B is 0.1% formic acid in acetonitrile. The elution was carried out at 300 nL/min with the following gradient: 0–2 min 1% B; 2–20 min 8% B; 20–75 min 12% B; 75–97 min 30% B; 97–100 min 45% B; 100–105 min 95% B; 105–110 min 95% B; 110–140 min 1% B. MS analysis was carried out using a Q Exactive HF (Thermo Fisher Scientific) in data dependent mode. Mass spectrometer settings were as following: full MS (AGC, 1 × 10⁶; resolution, 30,000; m/z range, 350–2000; maximum ion time, 20 ms); MS/MS (AGC, 1 × 10⁵; resolution, 15,000; m/z range, 200–2000; maximum ion time, 200 ms; minimum signal threshold, 2.5 × 10⁴; isolation width, 2 Da; dynamic exclusion time setting, 45 s; collision energy, NCE 30).
All mass spectrometry data were searched using MS-GF+ (Kim and Pevzner, 2014) and MASIC (Monroe et al., 2008) software. MS-GF+ software was used to identify peptides by scoring MS/MS spectra against peptides derived from the whole protein sequence database. MASIC software was used to generate the selected ion chromatographs (SICs) of all the precursors in MSMS datasets and calculate their peak areas as abundance. MASICResultsMerger2 was used to append the relevant MASIC stats for each peptide hit result in MS-GF+. The MS-GF+ data were then filtered based on 1% false discovery rate (FDR) and less than 5-ppm mass accuracy to generate a list of qualified peptide hit results. The abundances of peptides were determined as the highest peak area identified for the peptide within a sample. RRollup algorithm in InfernoRDN software (Polpitiya et al., 2008) was used to calculate the final protein abundance based on peptide abundance.
Results
Metabolic Network Reconstruction Workflow
We documented every step of the metabolic network reconstruction process (Figure 1) using Jupyter Notebooks3 to keep records of changes in metabolic network content and the rationale behind them. We divided the process in multiple notebooks for each stage of reconstruction process (Supplementary File 1).
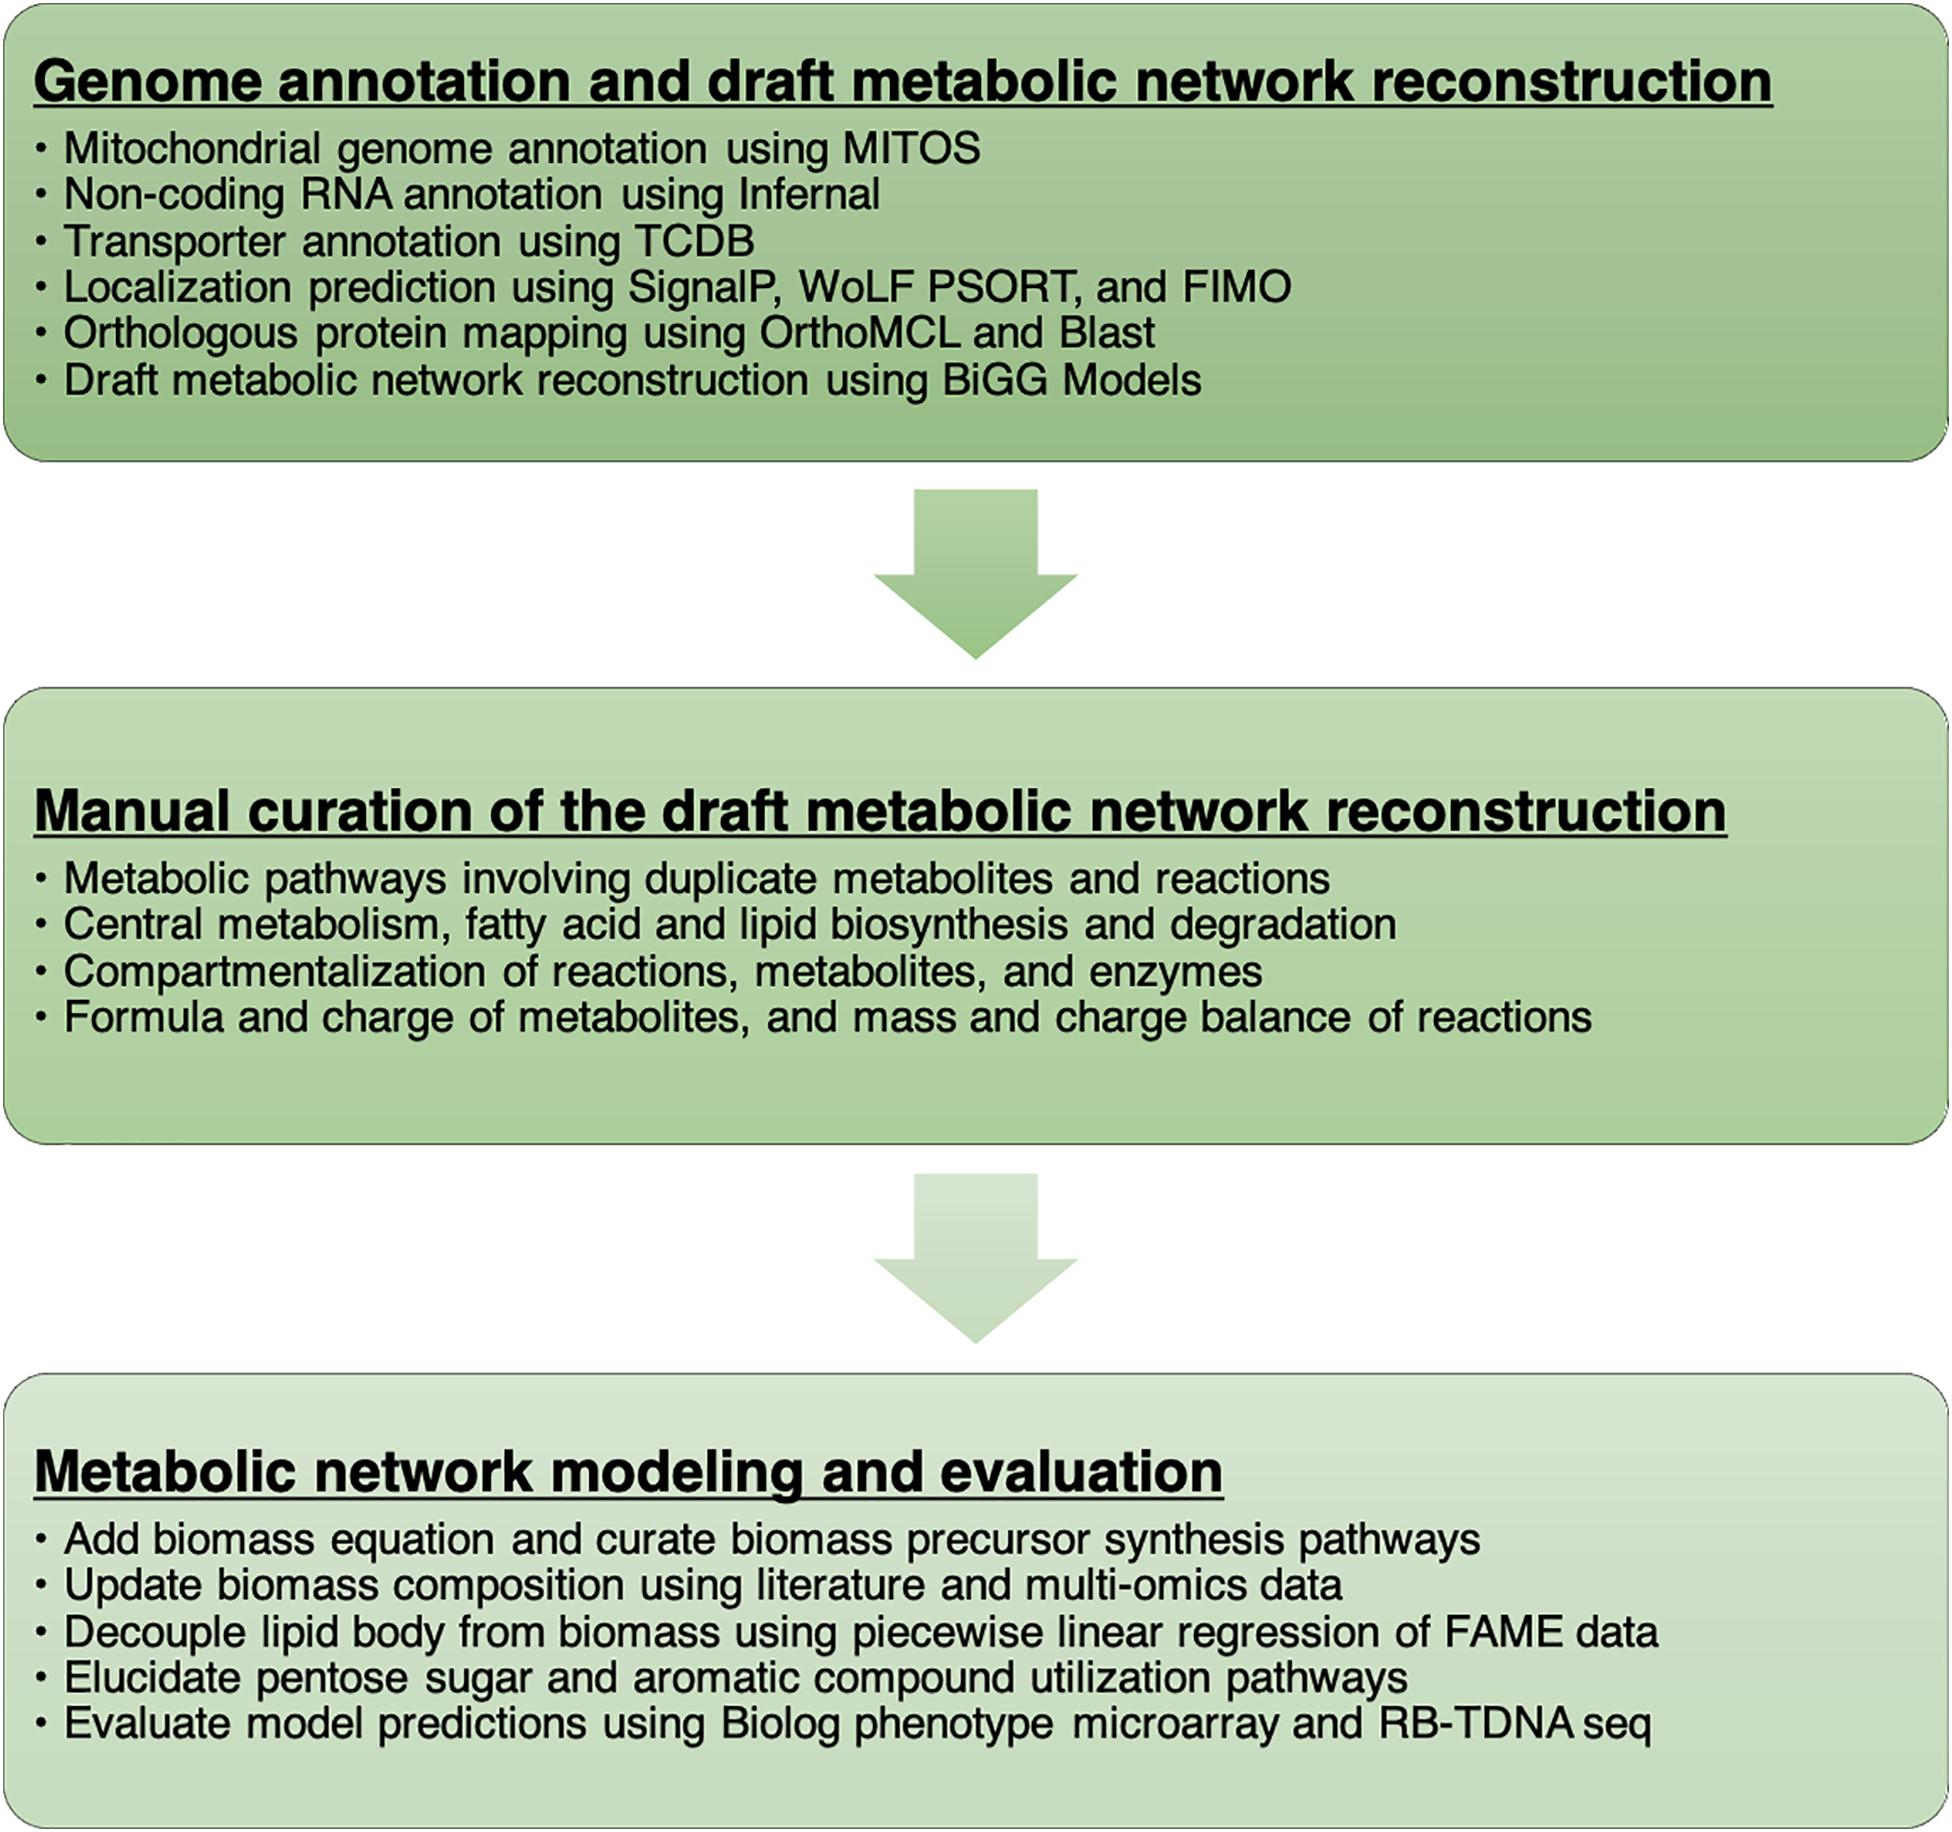
Figure 1. A workflow to develop the metabolic network model of R. toruloides.
Genome Annotation and Draft Metabolic Network Reconstruction
First, we used orthologous protein groups from OrthoMCL and published metabolic models to build a draft metabolic network reconstruction. Metabolic reactions were taken from published models when any orthologous protein was found in gene-reaction association information. OrthoMCL orthologous groups consist of orthologs and recent paralogs (i.e., gene duplication after speciation and likely to retain similar function) from at least two species (Li et al., 2003). It is generally thought that gene function is more conserved among orthologous genes than between-species paralogs. Recent studies of gene function versus evolutionary history have demonstrated that paralogs can provide more information that previously thought (Stamboulian et al., 2020) but that this added value comes mostly from within species paralogs in taxa with a large corpus of extant biochemical data. Thus, to build our initial metabolic network we transferred functions from orthologous protein groups only. However, during our manual refinement, in rare cases where we had functional data from R. toruloides or for filling gaps in pathways for which we have high confidence to exist in R. toruloides, we transferred functional prediction from paralogs in other species.
The initial draft reconstruction of R. toruloides metabolic network consisted of 1596 proteins, 3804 reactions, and 3589 metabolites. Among the 1596 proteins, 1137 proteins had orthologous R. toruloides proteins, but 459 were not yet mapped to R. toruloides proteins. Manual investigation of functional annotation and BLAST search were used to determine whether the unmapped proteins were present or absent in R. toruloides. For the reactions associated with a protein absent in R. toruloides, the absent protein was removed from the gene association if there were isozymes and at least one mapped isozyme was present. A reaction was removed from the metabolic network if the absent protein was a subunit of an enzyme complex and no other isozyme was present. One of the reasons why the number of reactions and metabolites in the initial reconstruction was very large was that protein localization was not yet considered, and same reactions in multiple compartments were present including compartments that are present in other organisms but absent in R. toruloides. These reactions were examined and either removed or assigned to appropriate compartments based on the localization prediction and the presence of a signal peptide sequence. It was also found that, although reconstructed from published metabolic models, the initial reconstruction contained many erroneous reactions and metabolites including duplicate reactions or metabolites with different names as well as mass or charge imbalanced reactions.
Manual Curation of the Draft Metabolic Network Reconstruction
Manual curation of the metabolic network reconstruction was performed to first identify and remove duplicate metabolites and reactions. As duplicate or incorrect metabolites and reactions were found, thorough inspection of the metabolic pathway involving them was performed. Functional annotation and localization of each gene in the pathway was confirmed, duplicate or erroneous metabolites and reactions were removed or corrected, and missing metabolites and reactions were either created based on literature and metabolic pathway database or added from other metabolic models in BiGG database. For example, metabolic pathways involving ferricytochrome c were first investigated since duplicate metabolite identifiers exist in BiGG database (ficytc/focytc versus ficytC/focytC). Lactate dehydrogenase and related enzymes involving cytochrome c had many duplicated reactions and incorrect compartment assignments. Cytochrome c oxidase, peroxidase, reductase, NADH:ubiquinone reductase and other mitochondrial electron transport chain reactions were curated. R. toruloides is known to have coenzyme Q9 (ubiquinone-9) with nine isoprenyl units (Yamada and Kondo, 1973), and our lipidomics analysis also detected coenzyme Q9. The ubiquinone synthesis reactions from other existing models were modified to include 9 isoprenyl units. Heme biosynthesis reactions were also manually curated since heme O and heme A synthesis reactions in BiGG database had incorrect stoichiometries.
There were many incorrect reactions involved in fatty acid biosynthesis and beta-oxidation, especially for unsaturated fatty acids. Impossible lumped reactions were removed considering the cis and trans configuration of fatty acids, and irrelevant fatty acid reactions (bacteria or plant specific unsaturated fatty acids) were removed. Long-chain fatty acid biosynthesis and fatty acid desaturase reactions were moved from cytosol to endoplasmic reticulum, and short-chain peroxisomal fatty acid beta-oxidation reactions were moved to mitochondria since R. toruloides possesses both mitochondrial and peroxisomal beta-oxidation enzymes. Sphingolipid metabolism was extended to include sphingolipid desaturase, methyltransferase, and fungal ceramide biosynthesis and the reactions were placed in endoplasmic reticulum. Localization of reactions involved in phospholipid biosynthesis and remodeling, and triacylglycerol were also updated.
Rhodosporidium toruloides naturally produces and accumulates carotenoids that are derived from mevalonate pathway products. Metabolic reactions and genes in mevalonate pathway and sterol biosynthesis were inspected, and it was found that an ERG27 ortholog is missing in R. toruloides. A previous phylogenomics study of sterol synthesis found that a 3-ketosteroid reductase exists in vertebrates and fungi (HSD17B7 in vertebrates and ERG27 in S. cerevisiae) but is missing in land plants and other eukaryotic phyla (Desmond and Gribaldo, 2009). More recent studies have suggested that enzymes that oxidizes the C-3 hydroxyl group of sterols to a ketone also reduces the C-3 ketone in tomato (Lee et al., 2019) or sterol-producing bacteria (Lee et al., 2018). On the other hand, in human aldo-keto reductases of the 1C subfamily are involved in 3-ketosteroid reduction and known to be promiscuous (Penning et al., 2015). We found three aldo-keto reductase family proteins in R. toruloides (protein ID 13153, 14209, and 14213) that are homologous to human aldo-keto reductases 1C. One of the aldo-keto reductases (14213) had a predicted signal peptide by SignalP and predicted localization in endoplasmic reticulum by WoLF PSORT, and was assigned to reactions catalyzed by the 3-ketosteroid reductase. Carotenoid biosynthesis in endoplasmic reticulum and accumulation in lipid droplets were added based on previous studies (Sun et al., 2017; Ma et al., 2019; Rabeharindranto et al., 2019).
The reactions and genes in the central metabolic pathways were manually checked for their co-factor usage and localization. Reactions in the compartments that are present in other organisms but irrelevant in R. toruloides were either moved to appropriate compartments or removed from the model if redundant. Reactions with incomplete gene-to-protein-to-reaction association (e.g., missing subunits) were either removed from the model or updated with corresponding genes if found. Reactions were checked for mass and charge balance, and chemical formula and charge information was updated for all metabolites. When needed, chemical equations were modified based on metabolic databases or new evidence in literature. The curated metabolic reconstruction consisted of 1106 genes, 1934 reactions, and 2010 metabolites (1246 unique metabolites) in nine compartments.
Metabolic Network Modeling and Growth Simulation
A biomass reaction from the S. cerevisiae metabolic model and exchange reactions for external metabolites were added to the metabolic network reconstruction to develop a draft metabolic model that can be used to make growth and flux predictions. In addition, transport reactions for water, carbon dioxide, and oxygen in different compartments were added. We first examined whether each biomass precursor in the biomass reaction can be synthesized in an aerobic glucose minimal medium. A flux balance analysis (FBA) problem maximizing the biomass production was solved, and the shadow prices of metabolites were examined to identify biomass components that could not be synthesized. The cytosolic components in S. cerevisiae biomass reaction whose biosynthesis reactions were moved to endoplasmic reticulum were replaced with the respective metabolites in endoplasmic reticulum, and transport reactions for fatty acids, phospholipids, and sterols were added to allow lipid production. In addition, mitochondrial transport reactions for several amino acids and their precursors were added and incorrect reactions in lysine biosynthesis were manually curated to allow synthesis of all components in S. cerevisiae biomass reaction. Several reactions generating a free proton gradient across mitochondrial membrane via a loop were identified by mixed-integer programming and removed to prevent unrealistic ATP production.
We used multi-omics and other experimental measurement to update the biomass reaction. The DNA composition was updated using the genome sequence, RNA composition was updated using transcriptomics data, amino acid composition was updated using proteomics data, and lipid composition was updated using fatty acid methyl ester analysis. For lipid composition, we measured fatty acid profiles in multiple media conditions to cover from low lipid to high lipid production states (Figure 2A). We observed that the weight percentages of a subset of individual fatty acids linearly increased from a low lipid condition (e.g., YPD) to a high lipid condition (e.g., YNB CN120) whereas the weight percentages of the other fatty acids remained relatively constant. We assumed those fatty acids that were linearly increasing to be the major components in the lipid body, and used segmented linear regression to estimate the fatty acid composition in “lean” cell mass where the majority of lipids are phospholipids, and the fatty acid composition in lipid body where the majority of lipids are triacylglycerols and sterol esters (Figure 2B). The fatty acid composition in “lean” cell mass was estimated from the y-intercepts and used in the biomass equation, and the fatty acid composition in lipid body was estimated from the slopes and used in demand reactions for triacylglycerols and sterol esters accumulation in lipid droplet. This allows for the simulation of cell growth and lipid accumulation in lipid body separately, and also enables the simulation of lipid mobilization using sink reactions for triacylglycerol and sterol esters in lipid droplet. Next, we added commonly known trace elements including cofactors and vitamins to the biomass equation and examined using FBA whether they could be synthesized. The reactions involved in folate, thiamine pyrophosphate, quinone, and biotin biosynthesis were manually curated to enable their biosynthesis. It was necessary to add demand reactions for 8-amino-7-oxononanoate and lipoate since we were not able to find all the required enzymes for their synthesis.
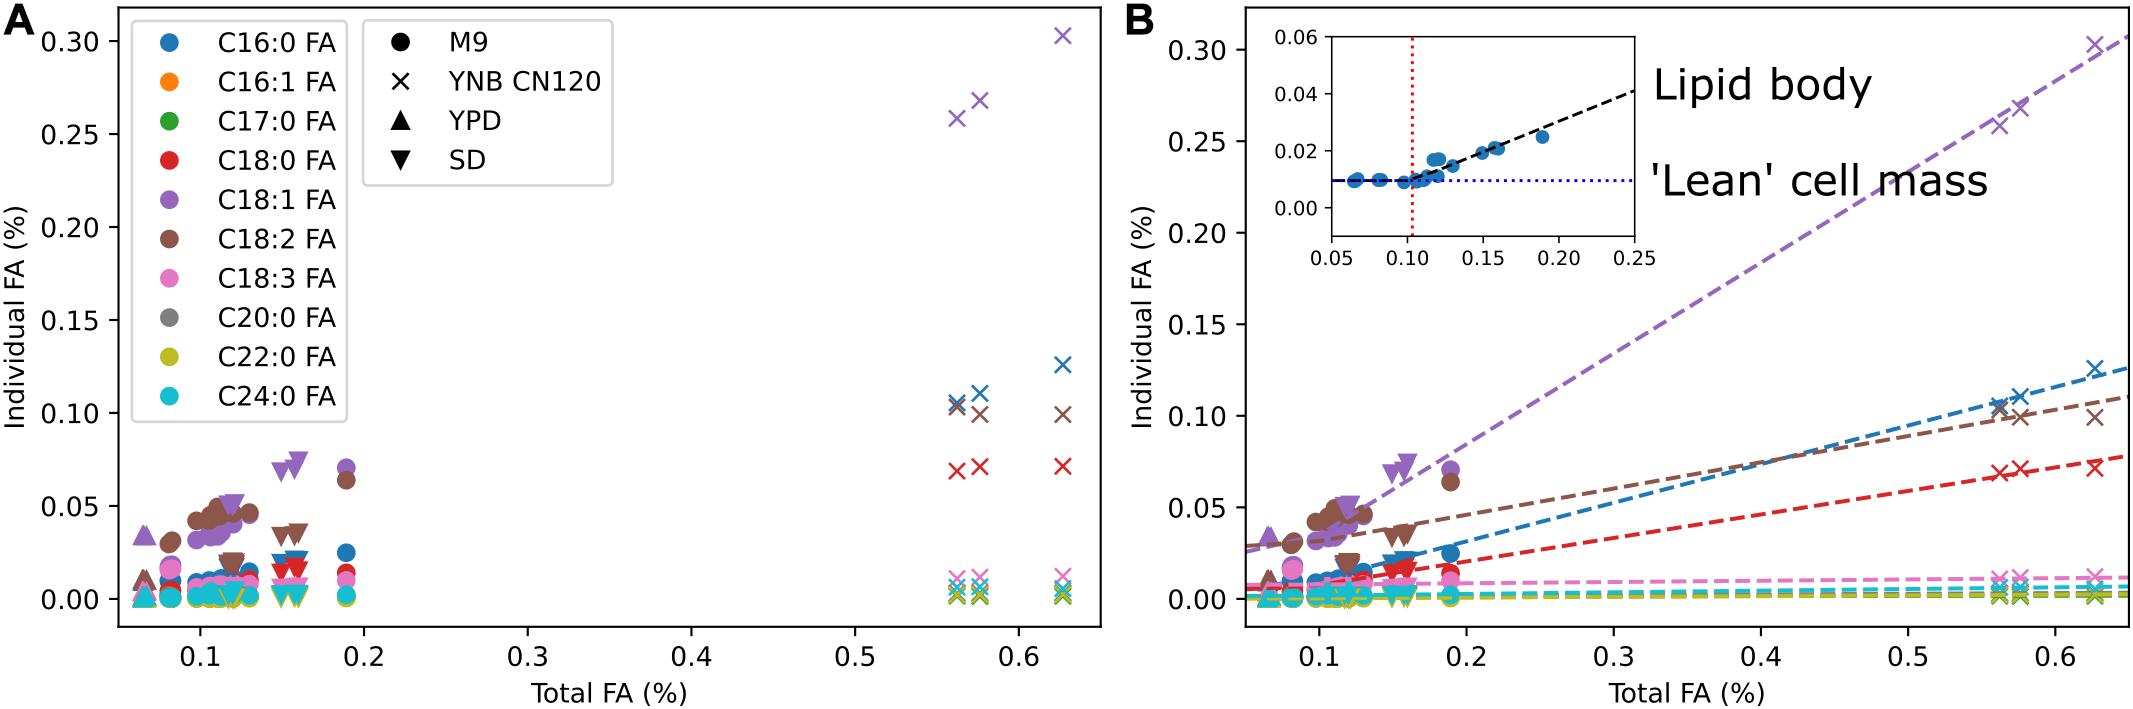
Figure 2. Fatty acid composition of R. toruloides in different media conditions and segmented linear regression. (A) Fatty acid composition by fatty acid methyl ester analysis in M9, YNB with C to N ratio of 120, YPD, and SD media. Colors indicate different fatty acid species and shapes indicate different media. (B) Estimation of fatty acid content in “lean” cell mass and fatty acid content in lipid body using segmented linear regression. Dashed lines are segmented linear regression for each fatty acid k using the equation yk = mk(x–x0) + bk. The inset shows the slope mk in a black dashed line, the x-intercept x0 in a red dotted line, and the y-intercept bk in a blue dotted line for fatty acid k.
We tested the model’s capability to predict growth on carbon sources that can be often found in lignocellulosic biomass hydrolyzate – glucose, D-xylose, L-arabinose, and p-coumarate. The initial metabolic model was able to predict growth on glucose, but not on D-xylose, L-arabinose, and p-coumarate. We examined the existing reactions in the model to identify the missing links within known catabolic pathways. In order to predict growth on D-xylose, the xylose reductase reaction was needed. Two potential xylose reductase encoding genes were found in R. toruloides with sequences that are similar to larA and xyrA in Aspergillus niger. For growth on L-arabinose, the L-arabinose transporter, L-arabinitol 4-dehydrogenase, and L-xylulose reductase reactions were needed but BLAST of known genes for these reactions resulted in multiple hits with moderate scores. For p-coumarate utilization, four reactions in the known p-coumarate degradation pathway in bacteria were present in the model. We identified genes that could potentially catalyze the missing reactions in the known p-coumarate degradation pathway using functional annotation and BLAST searches. However, additional experimental data was still needed to identify which of these candidates are actually responsible for the missing or added metabolic functions in the D-xylose, L-arabinose, and p-coumarate utilization pathways. We therefore performed multi-omics experiments for R. toruloides grown in these carbon sources to elucidate the genes and reactions necessary for their utilization.
Multi-Omics Analysis of Lignocellulosic Carbon Utilization in R. toruloides
We performed transcriptomics, proteomics, and metabolomics analysis to investigate genes involved in carbon utilization pathways in R. toruloides. Cells were grown with glucose, glucose + D-xylose, D-xylose, L-arabinose, or p-coumarate as carbon source, and samples were taken during exponential growth phase and stationary phase. An additional sample was taken between exponential and stationary phase for cells grown with glucose + D-xylose to study the co-utilization pattern. Gene expression profiles in cells grown on D-xylose, L-arabinose, or p-coumarate was compared to glucose in order to identify genes specifically upregulated or downregulated by each carbon source. RB-TDNA sequencing was also performed in glucose, D-xylose, L-arabinose, p-coumarate and other related metabolites. RB-TDNA sequencing uses sequence barcoded random insertions throughout the genome to identify genes required for growth in a given condition. A mixed population of hundreds of thousands of different mutant strains, each bearing an insertion at a different genomic location, is cultured in the condition of interest. The relative abundances of all barcoded strains in the population are simultaneously measured from a single sample by high throughput sequencing. For the more than 6000 genes with three or more independently tracked insertions within their coding sequence, those abundances are aggregated into a single “fitness score” for mutations in each gene in the tested condition. Genes with an essential function in a given condition (e.g., an enzymatic reaction in catabolic pathway) will have negative fitness scores in that condition. Transcriptomics, proteomics, and fitness scores were used to assign genes to reactions when annotations were ambiguous or multiple isozymes with substrate promiscuity were present. Metabolomics data was used to identify intermediates in utilization pathways to provide additional support for the proposed pathways.
We first investigated the metabolic pathways and associated genes involved in D-xylose and L-arabinose utilization using the multi-omics data. The functional annotation and multi-omics data suggested that R. toruloides uses an alternative pathway involving D-arabinitol and D-ribulose forming ribulose-5-phosphate instead of the known fungal xylose pathway forming D-xylulose-5-phosphate (Figure 3 and Table 1). Two genes in R. toruloides NP11 were annotated as D-arabinitol dehydrogenase, RHTO_07702 and RHTO_07844, and used to identify potential arabinitol dehydrogenases in strain IFO0880. Protein ID 9990 was identified as an ortholog of RHTO_07844 by OrthoMCL, and a BLAST search found matches to D-arabinitol 2-dehydrogenases (converting D-arabinitol to D-ribulose) with relatively high identity (over 50%). Consistent with this annotation, Protein ID 9990 had significant fitness defects in many pentose sugars and alcohols including D-xylose, xylitol, D-xylulose, D-arabinitol, L-arabinose, L-lyxose, and L-arabinitol, but not in D-ribulose. Protein ID 9837 was identified as an ortholog of RHTO_07702 by OrthoMCL, and a BLAST search found matches to D-arabinitol dehydrogenase (NADP+), D-arabinitol 2-dehydrogenases, and D-arabinitol 4-dehydrogenase (converting D-xylulose to D-arabinitol) with lower identity (less than 40%). BLAST analysis of Aspergillus niger D-arabinitol 4-dehydrogenase (An04g09410) against the R. toruloides genome found several hits including protein ID 9837 suggesting its role as D-arabinitol 4-dehydrogenase. However, protein ID 9837 had a weaker fitness defect suggesting that other enzymes participate in the conversion of D-xylulose to D-arabinitol. Among other BLAST hits, protein ID 8905 was upregulated in D-xylose and L-arabinose and had some fitness defect during growth on pentose sugars and alcohols. Therefore, the weak fitness defects for either protein ID 9837 and protein ID 8905 are consistent with genetic redundancy at this step in the xylose utilization pathway. The proposed alternative pathway is supported by our observation that the D-xylulose kinase (protein ID 16850) had very low RNA abundance and no detectable peptides in every condition we tested, and that mutants for protein ID 16850 had no significant fitness defect in any condition tested. Another supporting observation is that the D-ribulose kinase (protein ID 14368) had significant fitness defects in all pentose sugar and alcohol media conditions tested. This pathway is also consistent with recent observations that R. toruloides grown on D-xylose transiently accumulates D-arabinitol in the culture media (Jagtap and Rao, 2018). In summary, our omics and genetic data supports an alternative D-xylose and L-arabinose utilization pathway involving a D-ribulose-5-phosphate intermediate rather than a D-xylulose-5-phosphate intermediate (Figure 3).
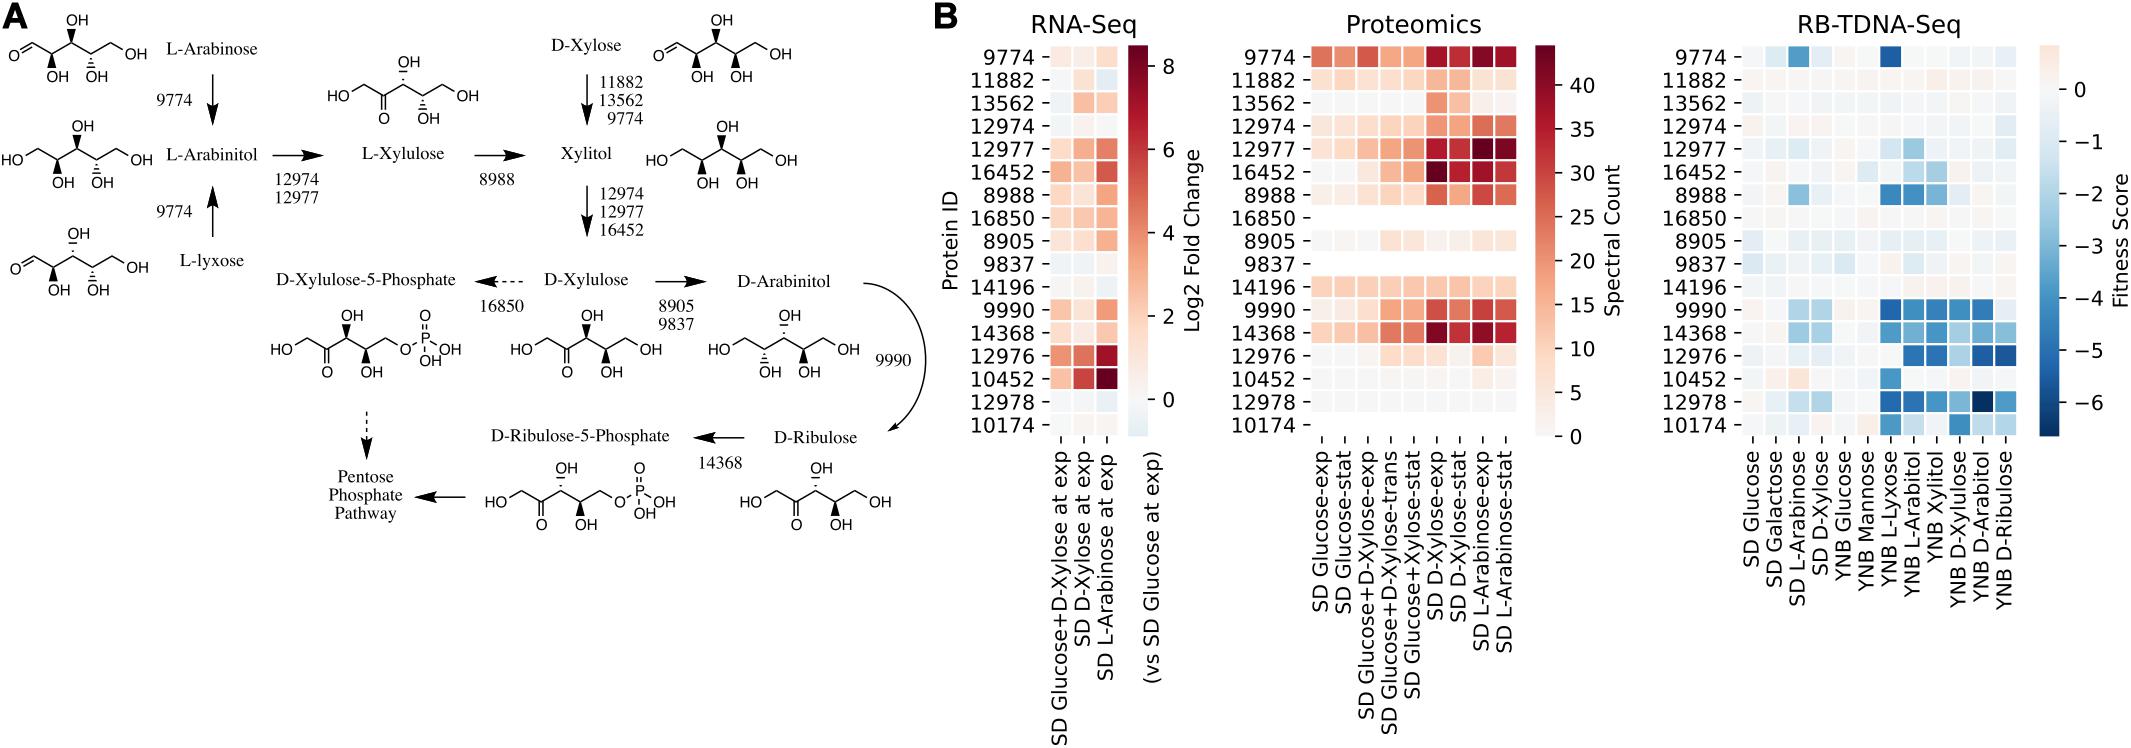
Figure 3. Pentose utilization pathway in R. toruloides. (A) Pentose sugars and alcohols are converted to D-ribulose-5-phosphate via D-arabinitol dehydrogenases before entering the pentose phosphate pathway. (B) Gene expression, protein expression, and fitness scores for pentose utilization pathway genes (exp, exponential phase; trans, transition phase; stat, stationary phase).
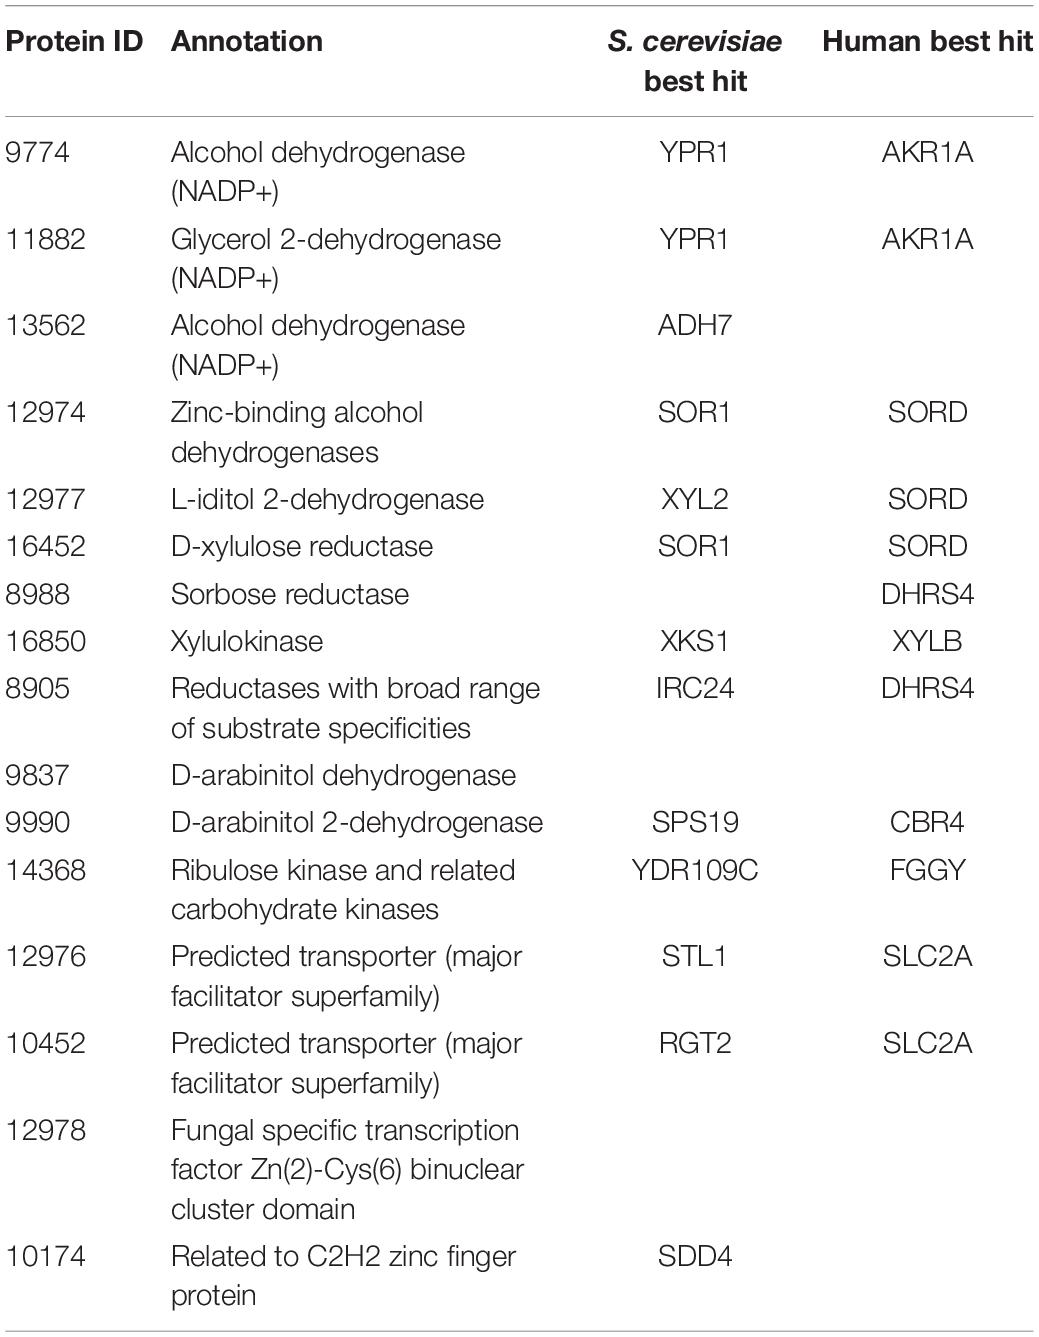
Table 1. Genes involved in pentose sugar and alcohol utilization.
Next, we propose that R. toruloides metabolizes p-coumarate to protocatechuate by a beta-oxidation-like pathway in the peroxisome (Figure 4 and Table 2). Previously known p-coumarate utilization pathway in bacteria such as P. putida contains p-coumaroyl-CoA hydratase/aldolase or feruloyl-CoA hydratase/lyase that hydrolyzes p-coumaroyl-CoA to 3S-(4-hydroxyphenyl)-3-hydroxy-propanoyl-CoA and subsequently produces 4-hydroxybenzoyl-CoA and acetyl-CoA. We found that, in R. toruloides grown in p-coumarate media, enzymes that are similar to peroxisomal fatty acid beta-oxidation enzymes ACSL (long-chain acyl-CoA synthetase), FOX2 (multifunctional enzyme, 3-hydroxyacyl-CoA dehydrogenase, and enoyl-CoA dehydratase), and POT1 (3-ketoacyl-CoA thiolase) were upregulated. Our fitness data from RB-TDNAseq on p-coumarate and previously published RB-TDNAseq data on oleic and ricinoleic acid (Coradetti et al., 2018) shows that these enzymes are distinct from the mitochondrial or peroxisomal fatty acid beta-oxidation enzymes (Figure 5 and Table 3) since they did not have a fitness defect in oleic or ricinoleic acid media. Mitochondrial or peroxisomal fatty acid beta-oxidation genes did not have significant fitness defect in p-coumarate or ferulate media (Figure 5 and Table 3). The predicted localization of the enzymes involved in p-coumarate indicates that p-coumarate is first degraded to protocatechuate in the peroxisome, and protocatechuate is transported to the cytosol for further degradation via the 3-oxoadipate pathway. Degradation of p-coumarate and ferulate via a beta-oxidation like pathway would result in 4-hydroxybenzoate and vanillate, respectively. Protocatechuate and 4-hydroxybenzoate were detected in the intracellular and extracellular metabolomics of cells grown on p-coumarate (Figure 4C). An enzyme similar to kynurenine 3-monooxygenase BNA4 showed fitness defect in p-coumarate, but not in ferulate, which indicates it is likely to be a 3-hydroxybenzoate 4-monooxygenase producing protocatechuate from 4-hydroxybenzoate. 4-hydroxybenzoate may also be transported to mitochondria for quinone biosynthesis. A fitness defect in mitochondrial oxoadipate carrier ODC2 suggests that 3-oxoadipate is transported from cytosol to mitochondria for the final steps in the beta-ketoadipate pathway generating succinyl-CoA and acetyl-CoA which can feed into the TCA cycle. Interestingly, several genes involved in aromatic amino acid metabolism showed a significant fitness defect in p-coumarate, although they showed some degree of fitness defect in other media conditions. For example, four genes in the tryptophan degradation pathway to 2-amino-3-carboxymuconate semialdehyde via kynurenine (BNA1, BNA2, BNA4, and BNA5) as well as cytosolic aspartate aminotransferase AAT2 had pronounced fitness defects in p-coumarate and ferulate (Figure 5 and Table 3). Since p-coumarate and 4-hydroxybenzoate are known to be ubiquinone precursors and they are synthesized from aromatic amino acids, it is possible that high concentration of these compounds affects the regulation of aromatic amino acid pathway genes and fitness defect becomes more pronounced. Taken together, the omics and genetic data support a proposed p-coumarate utilization pathway that involves formation of protocatechuate in the peroxisome, followed by ortho-cleavage in the cytosol, and then 3-oxoadipate degradation in the mitochondria (Figure 4). Multi-omics analysis and manual curation improved the metabolic model, but their scope was still limited to lignocellulosic carbon utilization pathways. In the next section, we performed a genome-scale evaluation and iteratively improved the model using high-throughput growth phenotyping and functional genomics.
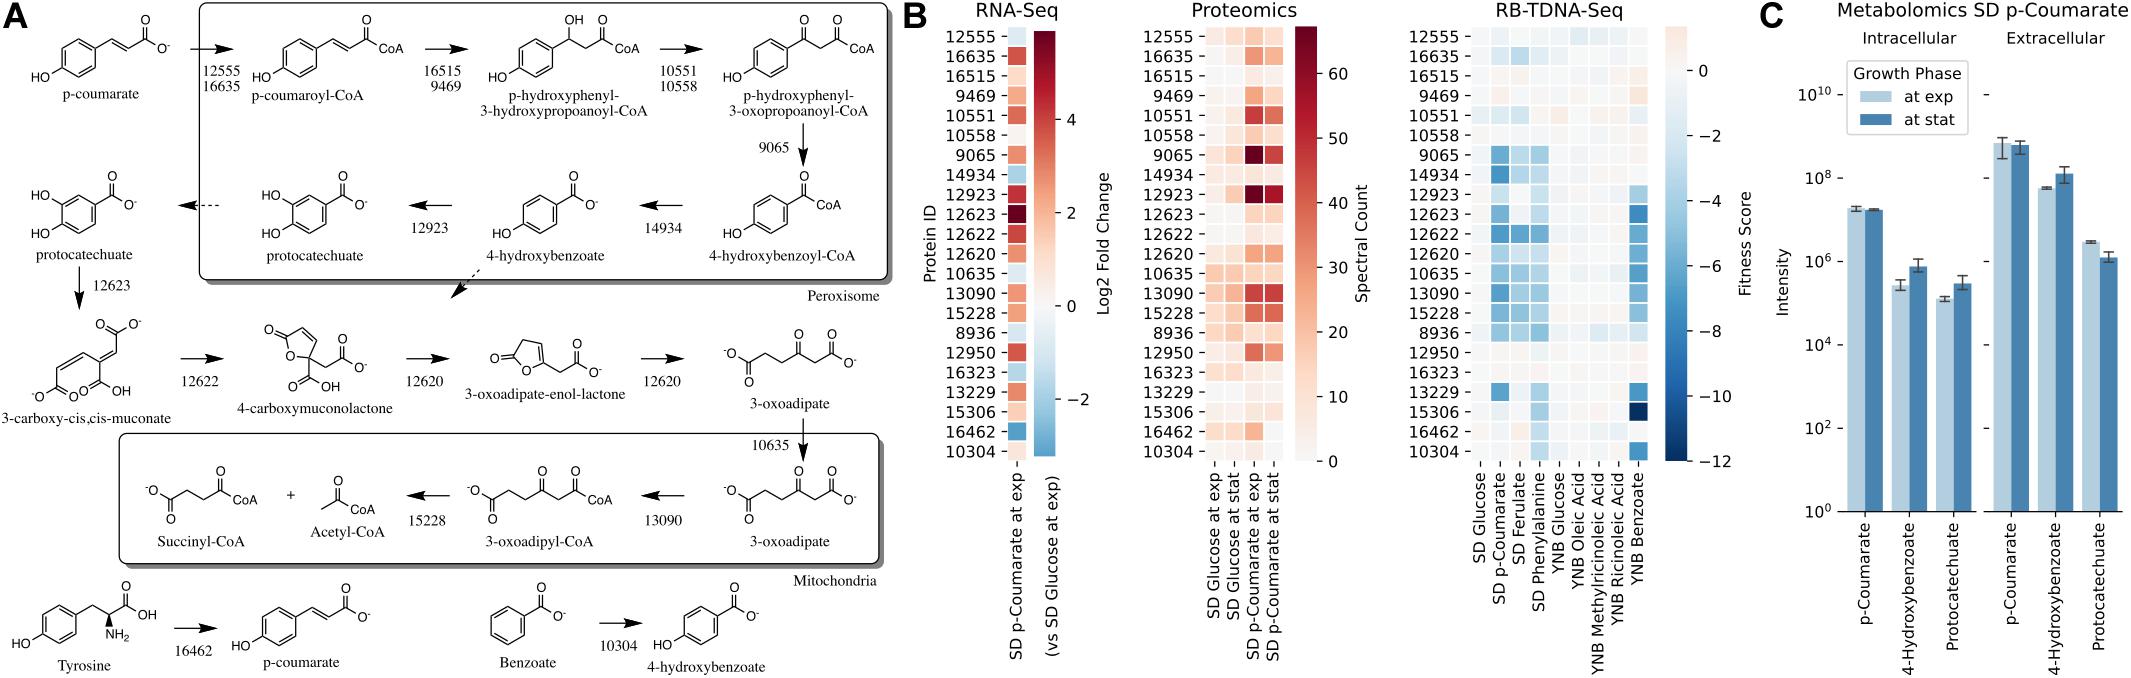
Figure 4. p-Coumarate utilization pathway in R. toruloides. (A) p-Coumarate degradation to protocatechuate by a beta-oxidation like pathway in peroxisome, protocatechuate degradation to 3-oxoadipate by the ortho-cleavage pathway in cytosol, and 3-oxoadipate degradation in mitochondria. (B) Gene expression, protein expression, and fitness scores for p-coumarate utilization pathway genes (exp, exponential phase; stat, stationary phase). (C) Intracellular and extracellular measurement of p-coumarate and intermediates in p-coumarate condition (not detected in glucose, glucose + D-xylose, D-xylose, and L-arabinose conditions).
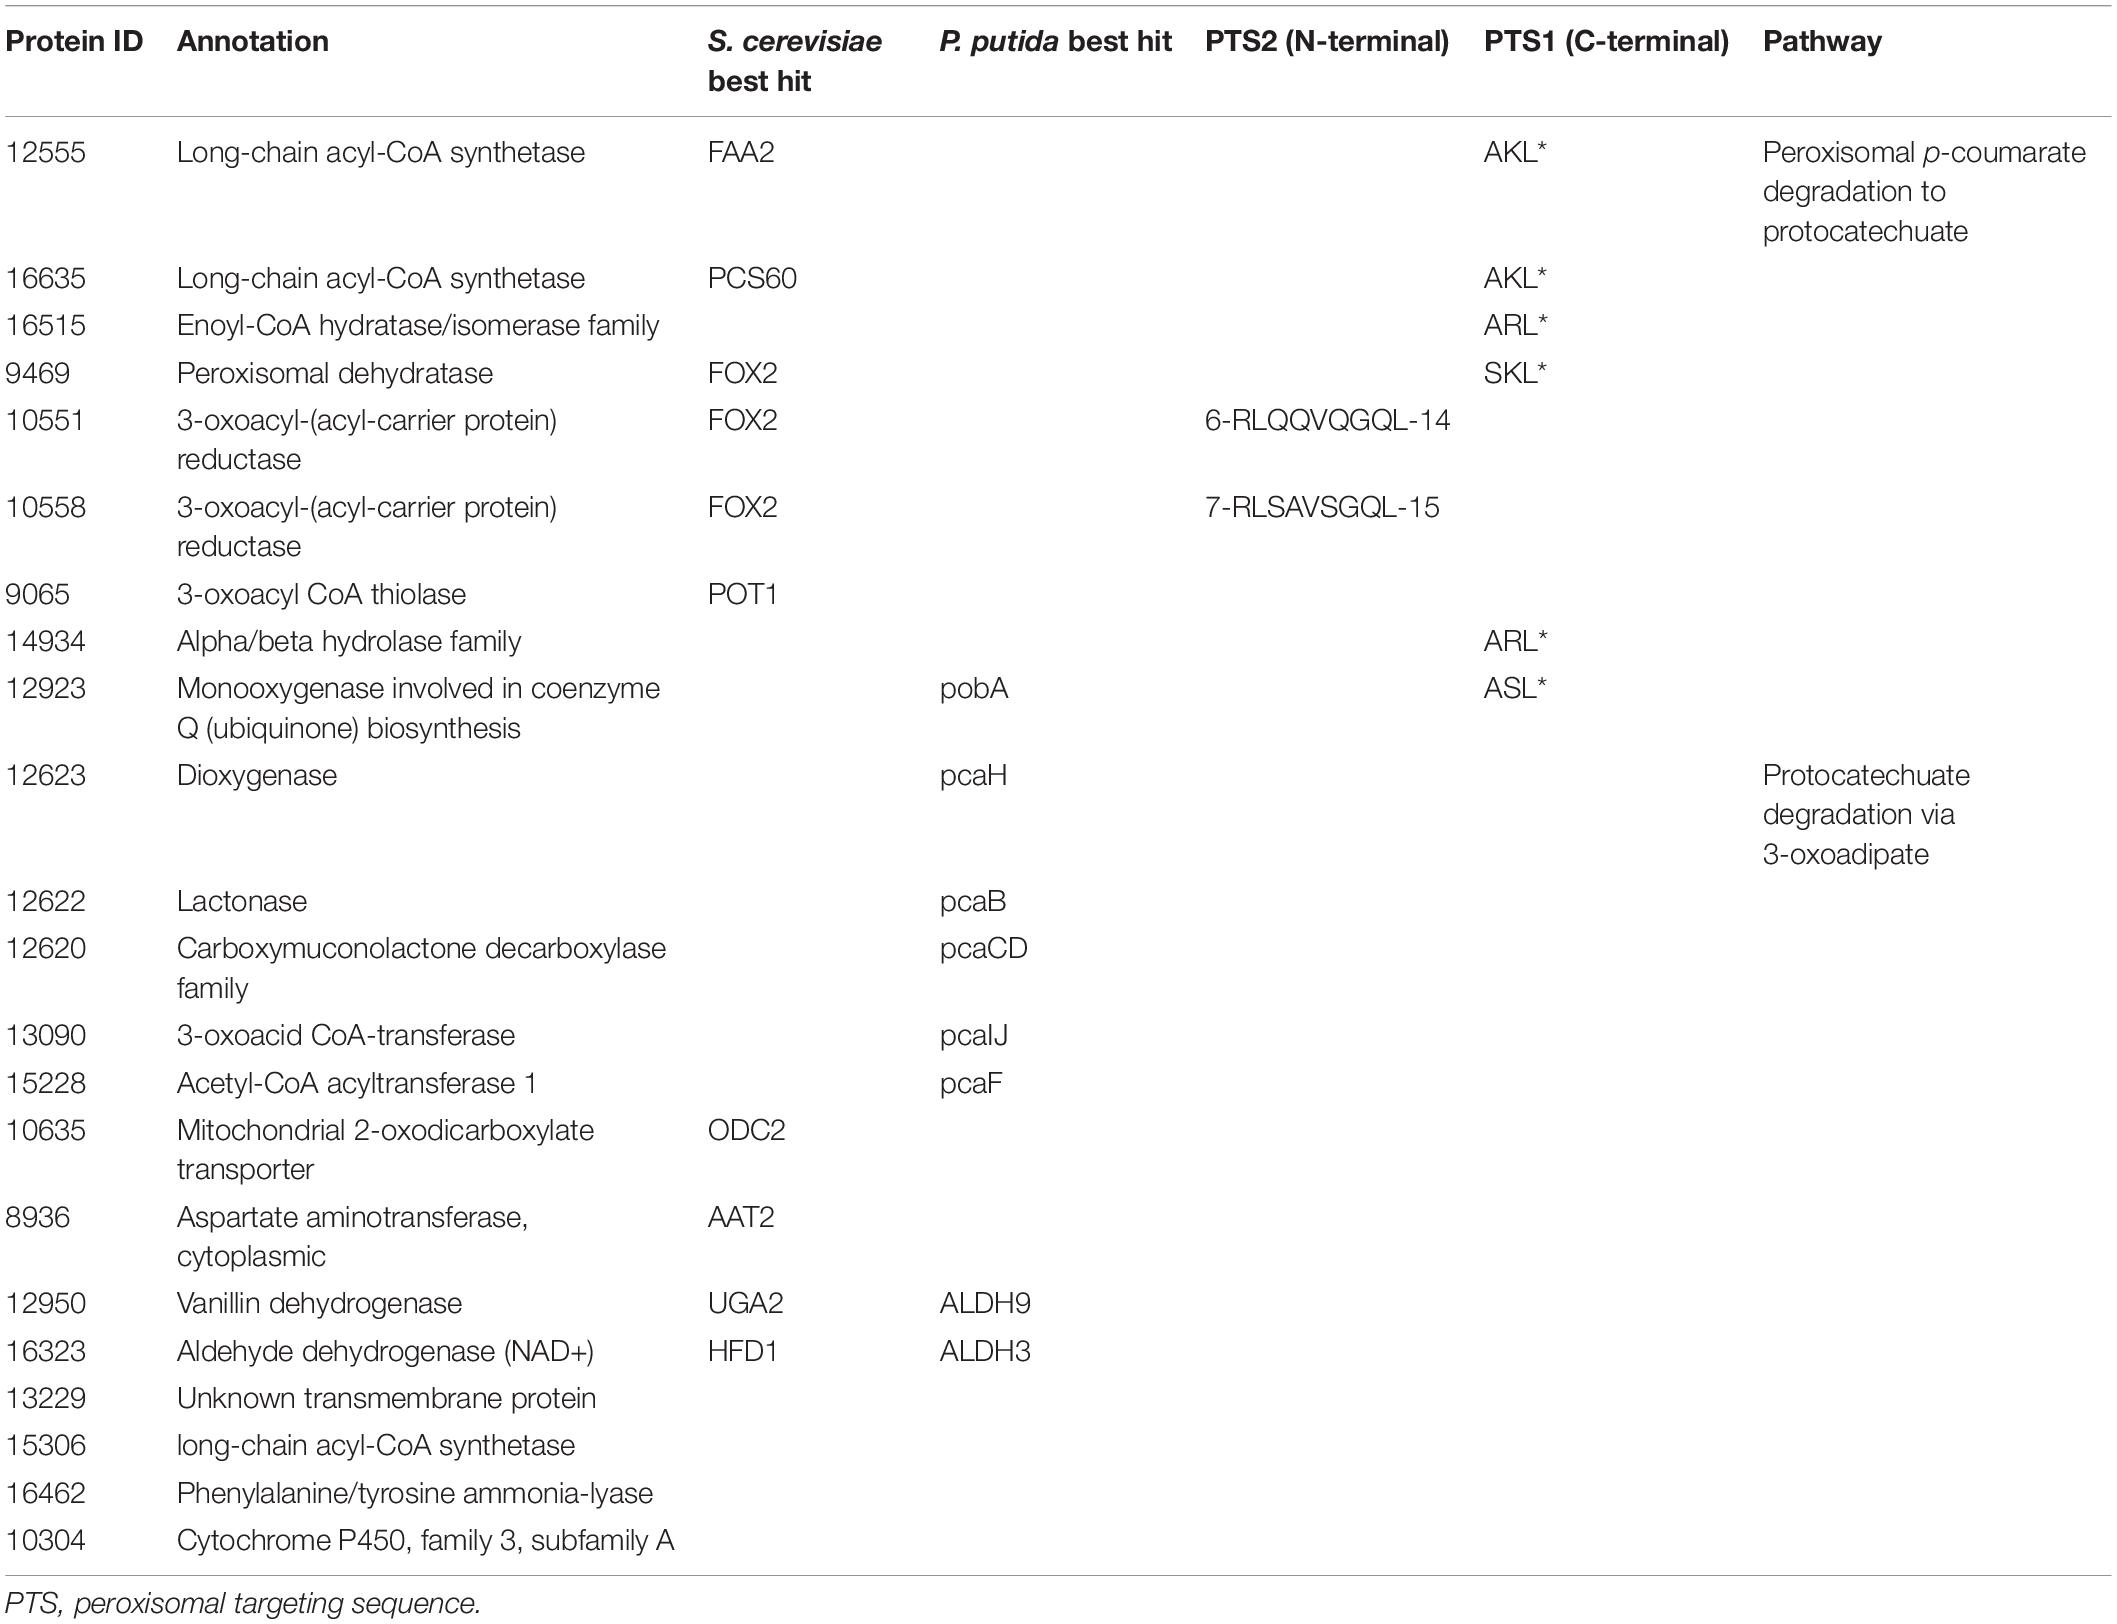
Table 2. Genes involved in p-coumarate utilization.
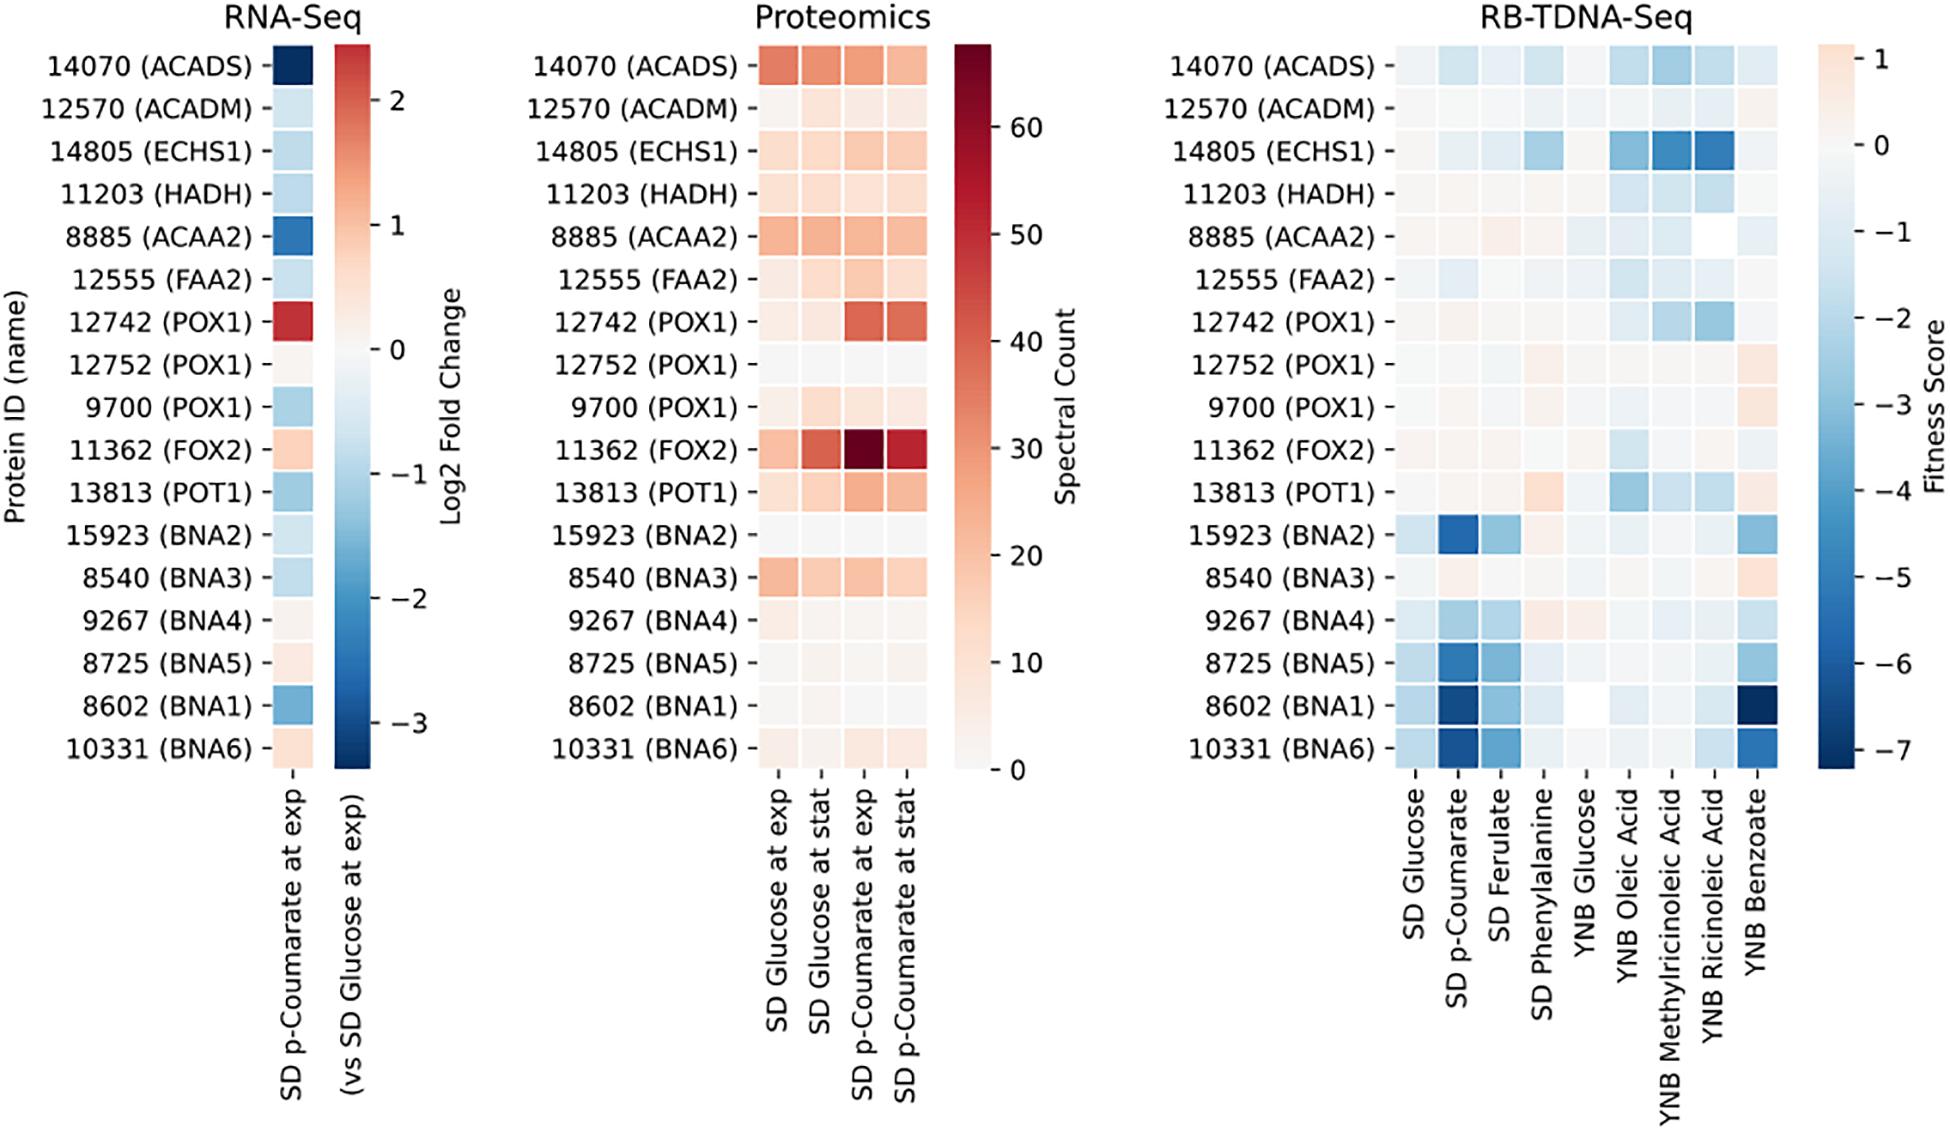
Figure 5. Gene expression, protein expression, and fitness scores for fatty acid beta-oxidation and NAD biosynthesis pathway genes (exp, exponential phase; stat, stationary phase).
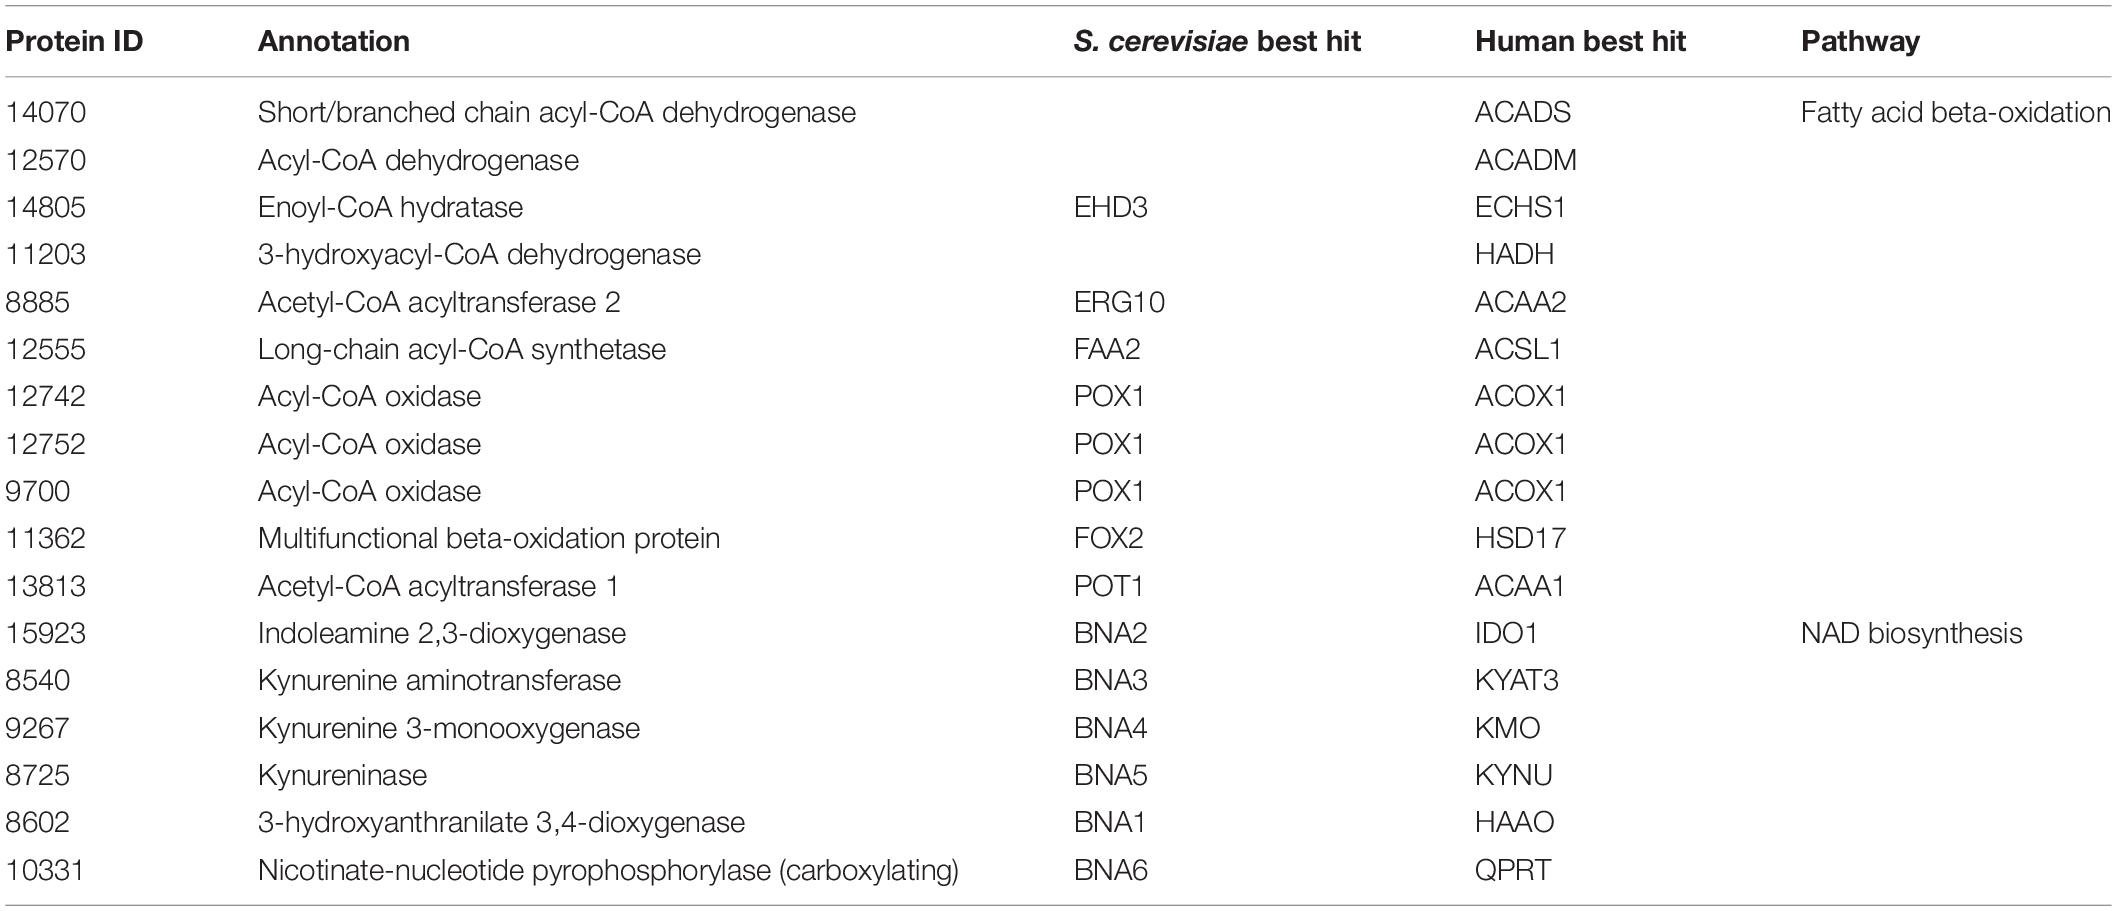
Table 3. Genes involved in fatty acid beta-oxidation and NAD biosynthesis.
Validation and Reconciliation of Growth Phenotype and Gene Essentiality Predictions
We tested the developed metabolic model’s capability to predict growth on different carbon, nitrogen, sulfur, and phosphate sources. Growth phenotype data from Biolog Phenotype MicroArrays were used to evaluate the model predictions (Figure 6). Among 384 conditions in Biolog plates (PM1, PM2, PM3B, and PM4A), 116 conditions could be simulated with the model since not all the metabolites were present in the metabolic network. Of these 116 conditions, the model correctly predicted 76 positive and 12 negative growth phenotypes, and incorrectly predicted 6 false positive and 22 false negative growth phenotypes. The overall accuracy was 75.9%, comparable to previously published metabolic models of other organisms [e.g., E. coli iAF1260 model (Feist et al., 2007) with 75.9% accuracy in 170 conditions]. We then manually refined the model to include more metabolites found in Biolog plates and reconcile the inconsistencies. The updated model was able to simulate 213 conditions in Biolog plates with 78.4% accuracy and Matthew’s correlation coefficient of 0.493.
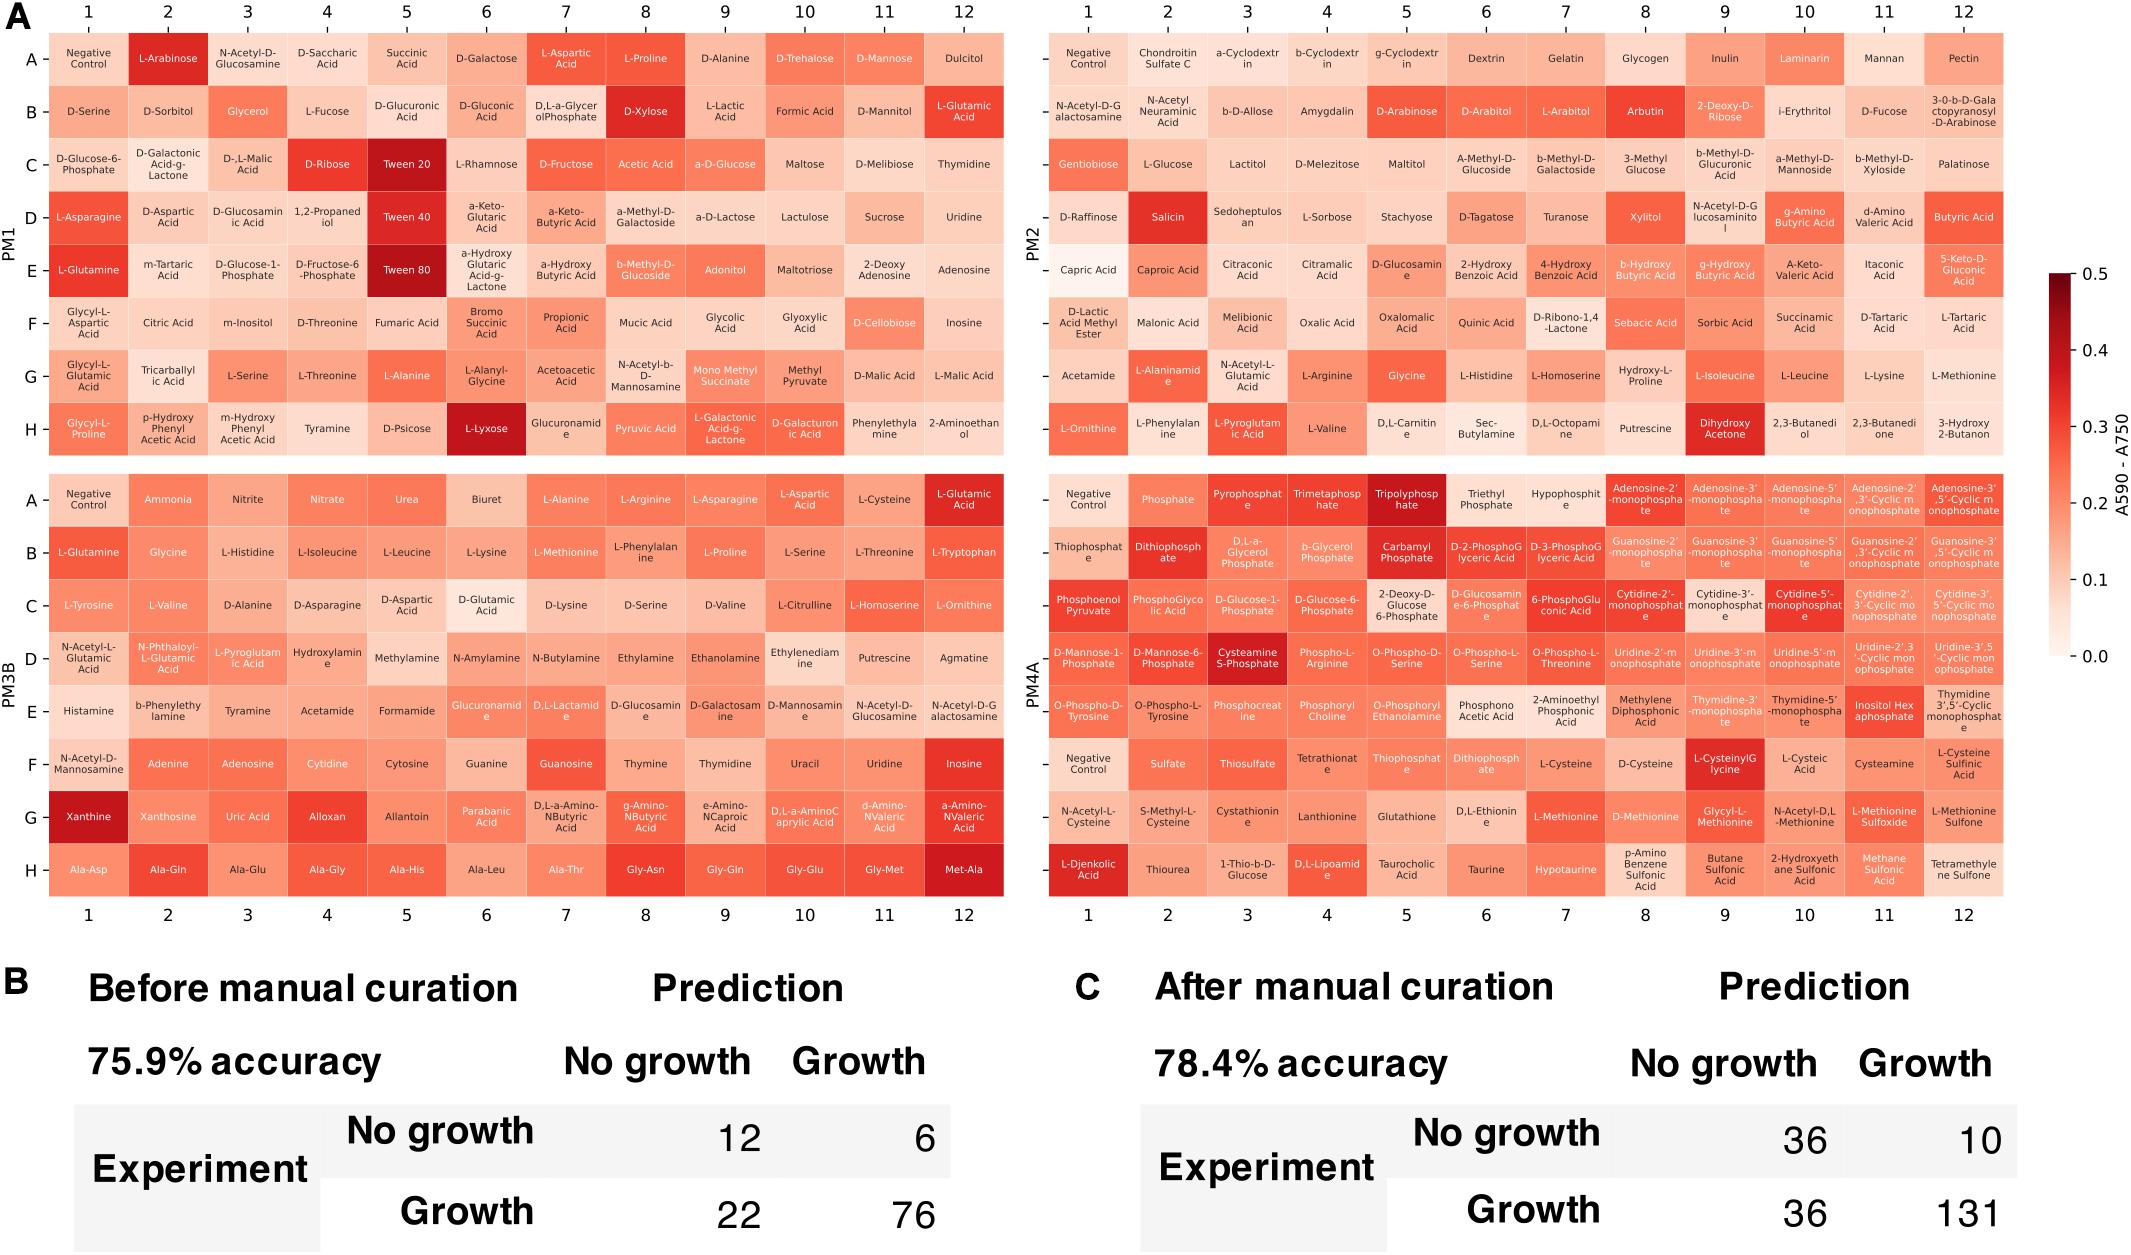
Figure 6. Model evaluation using high-throughput growth phenotype data. (A) Biolog phenotype microarray data (white indicates low growth and red indicates high growth). Comparison of model predicted growth and experimental data (B) before and (C) after manual curation to include more metabolites.
We used the fitness scores from RB-TDNAseq to evaluate the model’s capability to predict conditionally essential genes in different growth conditions (Figure 7). Genes were considered essential if they were classified as essential in our previous RB-TDNAseq study (Coradetti et al., 2018) or fitness score was less than a cut-off value. There were 1147 genes in the model, but 15 genes were mitochondrial and excluded from this analysis since their essentiality was not available from the RB-TDNAseq data. The model predicted gene essentiality for 1132 genes in 27 different growth conditions with 72.7% accuracy and Matthew’s correlation coefficient of 0.388. The model was further refined to resolve the inconsistencies and several genes with erroneous ortholog mapping were removed from the model. The refined model had 1142 genes, 2398 reactions, and 2051 metabolites (1205 unique metabolites), and predicted gene essentiality for 1127 non-mitochondrial genes in 27 conditions with 78.6% accuracy and Matthew’s correlation coefficient of 0.406 [see Supplementary File 5 for a comparison with a previously published model (Dinh et al., 2019)]. Among these 1127 genes, 281 genes were essential across all conditions, 772 genes were not essential under any conditions, and 74 genes were essential under only certain conditions. For these 74 conditionally essential genes, the refined model predicted gene essentiality with 78.7% accuracy.
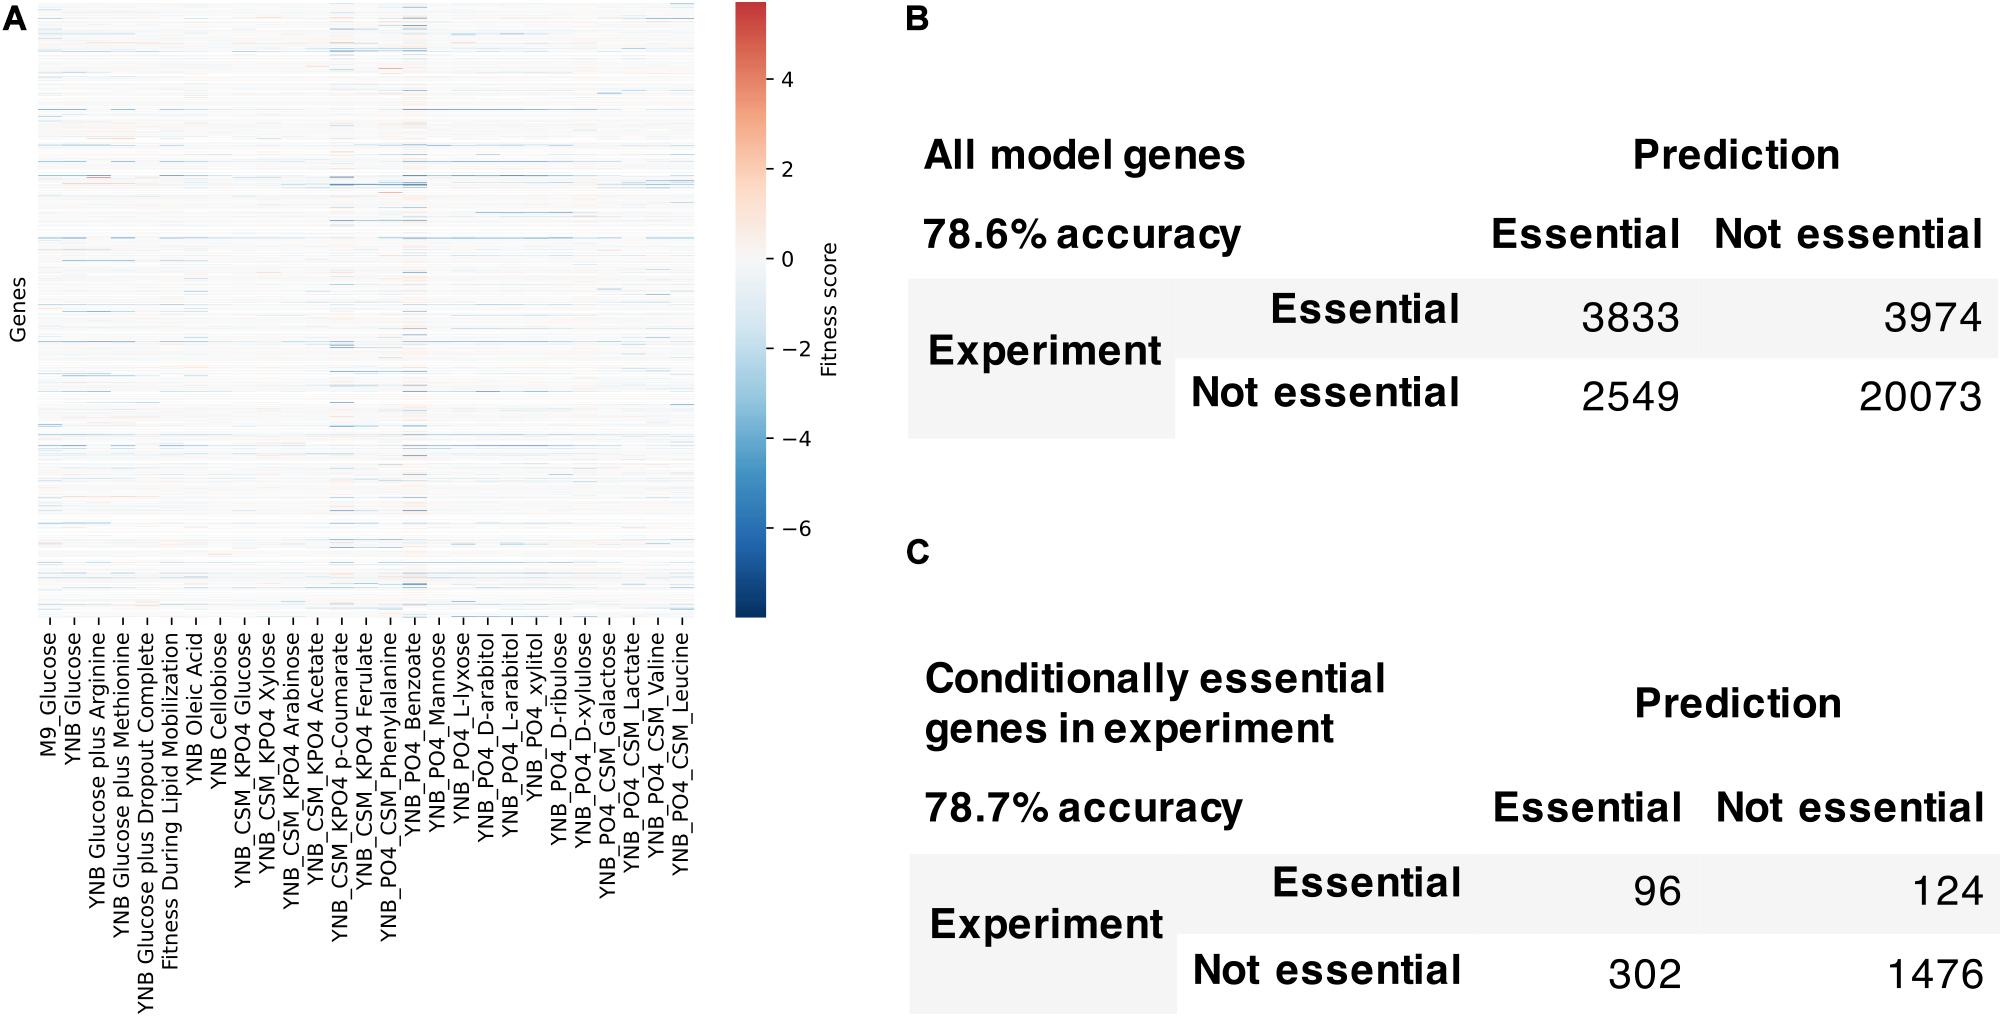
Figure 7. Model evaluation using high-throughput gene essentiality data. (A) RB-TDNA sequencing fitness score data for all genes in the model. Comparison of model predicted gene essentiality and experimental data for (B) all model genes and (C) conditionally essential genes in experiment.
Discussion
In this work, we have developed a genome-scale metabolic network model of R. toruloides and utilized the model to study the metabolic pathways for utilizing carbon sources derived from lignocellulosic biomass. The initial metabolic network was reconstructed from high-quality published metabolic network models of other organisms using orthologous protein mapping. There is some risk of incorrect reaction identification from the false positives in ortholog identification due to horizontal gene transfer (HGT), and there are many examples that highlight the importance of HGT in ascomycete yeasts (Goncalves et al., 2018; Shen et al., 2018; Kominek et al., 2019; Devia et al., 2020). However, ortholog identification continues to be a standard practice for the initial reconstruction of genome-scale metabolic networks for non-model organisms and currently we do not have evidence of large scale HGT in R. toruloides. As with any model, our model will need to be improved and re-evaluated over time in cases of HGT and as new metabolic pathways are characterized. The developed model contains 1141 genes, 2398 reactions, and 2051 metabolites (1205 unique metabolites) in nine compartments. The lipid body was separated from the biomass equation allowing the independent simulation of lipid accumulation or mobilization in oleaginous yeasts. The separation of the lipid body from biomass eliminated the need for more than one biomass equation depending on the growth condition or lipid content. Multi-omics analysis and metabolic network reconstruction identified unique reactions and enzymes as well as their localization for unique pentose and aromatic compound utilization pathways in R. toruloides. The pentose and aromatic compound utilization pathways proposed in this study have not been suggested in previously published multi-omics studies or genome-scale metabolic models of R. toruloides (Bommareddy et al., 2015; Dinh et al., 2019; Tiukova et al., 2019a,b; Lopes et al., 2020; Pinheiro et al., 2020). The first genome-scale metabolic model for R. toruloides was recently built for strain NP11 (Tiukova et al., 2019b), and a proteomics study of xylose metabolism was conducted by the same research group (Tiukova et al., 2019a). Another genome-scale metabolic model was shortly after published for strain IFO0880 utilizing the functional genomics data (Coradetti et al., 2018). More recent studies utilized these models to study the utilization of different carbon sources, but their focus was primarily on lipid production (Lopes et al., 2020; Pinheiro et al., 2020). The metabolic network model developed in this study was reconstructed and manually curated reproducibly using multi-omics data and electronic notebooks, and validated against high-throughput growth phenotypes in 213 growth conditions and conditional gene essentiality in 27 growth conditions with high prediction accuracies, significantly expanding the breadth and depth of metabolic coverage from previously published models (Dinh et al., 2019; Tiukova et al., 2019b). We believe that the developed metabolic network for R. toruloides is most complete and accurate to date, and the multi-omics data and metabolic model presented in this study will be useful for studying and engineering R. toruloides for lignocellulosic biomass conversion.
Data Availability Statement
The RNA sequencing data (SRP143805–SRP143836 and SRP143838) and RB-TDNA sequencing data (PRJNA595384) are available at the NCBI Sequence Read Archive. Fitness scores are available at the fungal fitness browser (http://fungalfit.genomics.lbl.gov). The mass spectrometry proteomics data are deposited to the ProteomeXchange Consortium via the PRIDE (Perez-Riverol et al., 2019) partner repository with the dataset identifier PXD022377 and 10.6019/PXD02237. The metabolomics data are deposited to the Open Science Framework (OSF) and available at https://osf.io/tnqwx/. Processed multi-omics dataset is available as a Supplementary File. The Jupyter notebooks, processed multi-omics dataset, and genome-scale metabolic network model files will also be made available on a GitHub repository (https://github.com/AgileBioFoundry/Rt_IFO0880).
Author Contributions
JK, SC, JS, JG, and JM conceived and designed the experiments. JK, SC, JZ, JY, NM, Y-MK, YG, and KB-J performed the experiments and analyzed the data. JK, SC, Y-MK, and YG wrote the initial manuscript. All authors read, revised, and approved the final manuscript.
Conflict of Interest
The authors declare that the research was conducted in the absence of any commercial or financial relationships that could be construed as a potential conflict of interest.
Funding
The work was part of the DOE Agile BioFoundry (http://agilebiofoundry.org), supported by the United States Department of Energy, Office of Energy Efficiency and Renewable Energy, Bioenergy Technologies Office, under Award No. DE-NL0030038. This work was part of the DOE Joint BioEnergy Institute (http://www.jbei.org), supported by the United States Department of Energy, Office of Science, Office of Biological and Environmental Research, through contract DE-AC02-05CH11231 between Lawrence Berkeley National Laboratory and the United States Department of Energy. A portion of this research was performed under the Facilities Integrating Collaborations for User Science (FICUS) initiative (Proposal ID 49515), and used resources at the DOE Joint Genome Institute and the Environmental Molecular Sciences Laboratory, which are DOE Office of Science User Facilities. Both facilities are sponsored by the Office of Biological and Environmental Research and operated under Contract Nos. DE-AC02-05CH11231 (JGI) and DE-AC05-76RL01830 (EMSL). The views expressed in the article do not necessarily represent the views of the U.S. Department of Energy or the United States Government.
Supplementary Material
The Supplementary Material for this article can be found online at: https://www.frontiersin.org/articles/10.3389/fbioe.2020.612832/full#supplementary-material
Supplementary File 1 | Jupyter notebooks for metabolic network model development and multi-omics data analysis.
Supplementary File 2 | Genome-scale metabolic network model of R. toruloides IFO0880 in JSON, SBML, and MAT format and the Memote HTML report.
Supplementary File 3 | Genome annotation of R. toruloides IFO0880.
Supplementary File 4 | Multi-omics dataset for R. toruloides IFO0880.
Supplementary File 5 | Comparison of gene essentiality predictions by the developed model and a previously published model.
Footnotes
- ^ http://fungalfit.genomics.lbl.gov
- ^ https://omics.pnl.gov/software/masic-results-merger
- ^ https://jupyter.org
References
Adeboye, P. T., Bettiga, M., Aldaeus, F., Larsson, P. T., and Olsson, L. (2015). Catabolism of coniferyl aldehyde, ferulic acid and p-coumaric acid by Saccharomyces cerevisiae yields less toxic products. Microb. Cell Fact. 14:149. doi: 10.1186/s12934-015-0338-x
Bailey, T. L., and Elkan, C. (1994). Fitting a mixture model by expectation maximization to discover motifs in biopolymers. Proc. Int. Conf. Intell. Syst. Mol. Biol. 2, 28–36.
Bommareddy, R. R., Sabra, W., Maheshwari, G., and Zeng, A. P. (2015). Metabolic network analysis and experimental study of lipid production in Rhodosporidium toruloides grown on single and mixed substrates. Microb. Cell Fact. 14:36. doi: 10.1186/s12934-015-0217-5
Bommareddy, R. R., Sabra, W., and Zeng, A. P. (2017). Glucose-mediated regulation of glycerol uptake in Rhodosporidium toruloides: insights through transcriptomic analysis on dual substrate fermentation. Eng. Life Sci. 17, 282–291. doi: 10.1002/elsc.201600010
Chang, R. L., Ghamsari, L., Manichaikul, A., Hom, E. F., Balaji, S., Fu, W., et al. (2011). Metabolic network reconstruction of Chlamydomonas offers insight into light-driven algal metabolism. Mol. Syst. Biol. 7:518. doi: 10.1038/msb.2011.52
Coradetti, S. T., Pinel, D., Geiselman, G. M., Ito, M., Mondo, S. J., Reilly, M. C., et al. (2018). Functional genomics of lipid metabolism in the oleaginous yeast Rhodosporidium toruloides. eLife 7:e32110. doi: 10.7554/eLife.32110
Costello, M., Fleharty, M., Abreu, J., Farjoun, Y., Ferriera, S., Holmes, L., et al. (2018). Characterization and remediation of sample index swaps by non-redundant dual indexing on massively parallel sequencing platforms. BMC Genom. 19:332. doi: 10.1186/s12864-018-4703-0
Desmond, E., and Gribaldo, S. (2009). Phylogenomics of sterol synthesis: insights into the origin, evolution, and diversity of a key eukaryotic feature. Genome Biol. Evol. 1, 364–381. doi: 10.1093/gbe/evp036
Devia, J., Bastias, C., Kessi-Perez, E. I., Villarroel, C. A., De Chiara, M., Cubillos, F. A., et al. (2020). Transcriptional activity and protein levels of horizontally acquired genes in yeast reveal hallmarks of adaptation to fermentative environments. Front. Genet. 11:293. doi: 10.3389/fgene.2020.00293
Dinh, H. V., Suthers, P. F., Chan, S. H. J., Shen, Y., Xiao, T., Deewan, A., et al. (2019). A comprehensive genome-scale model for Rhodosporidium toruloides IFO0880 accounting for functional genomics and phenotypic data. Metab. Eng. Commun. 9:e00101. doi: 10.1016/j.mec.2019.e00101
Duarte, N. C., Becker, S. A., Jamshidi, N., Thiele, I., Mo, M. L., Vo, T. D., et al. (2007). Global reconstruction of the human metabolic network based on genomic and bibliomic data. Proc. Natl. Acad. Sci. U.S.A. 104, 1777–1782. doi: 10.1073/pnas.0610772104
Ebrahim, A., Lerman, J. A., Palsson, B. O., and Hyduke, D. R. (2013). COBRApy: COnstraints-based reconstruction and analysis for python. BMC Syst. Biol. 7:74. doi: 10.1186/1752-0509-7-74
Fei, Q., O’Brien, M., Nelson, R., Chen, X., Lowell, A., and Dowe, N. (2016). Enhanced lipid production by Rhodosporidium toruloides using different fed-batch feeding strategies with lignocellulosic hydrolysate as the sole carbon source. Biotechnol. Biofuels 9:130. doi: 10.1186/s13068-016-0542-x
Feist, A. M., Henry, C. S., Reed, J. L., Krummenacker, M., Joyce, A. R., Karp, P. D., et al. (2007). A genome-scale metabolic reconstruction for Escherichia coli K-12 MG1655 that accounts for 1260 ORFs and thermodynamic information. Mol. Syst. Biol. 3:121. doi: 10.1038/msb4100155
Goncalves, C., Wisecaver, J. H., Kominek, J., Oom, M. S., Leandro, M. J., Shen, X. X., et al. (2018). Evidence for loss and reacquisition of alcoholic fermentation in a fructophilic yeast lineage. eLife 7:e33034. doi: 10.7554/eLife.33034
Grant, C. E., Bailey, T. L., and Noble, W. S. (2011). FIMO: scanning for occurrences of a given motif. Bioinformatics 27, 1017–1018. doi: 10.1093/bioinformatics/btr064
Grigoriev, I. V., Nikitin, R., Haridas, S., Kuo, A., Ohm, R., Otillar, R., et al. (2014). MycoCosm portal: gearing up for 1000 fungal genomes. Nucleic Acids Res. 42, D699–D704. doi: 10.1093/nar/gkt1183
Hiller, K., Hangebrauk, J., Jager, C., Spura, J., Schreiber, K., and Schomburg, D. (2009). MetaboliteDetector: comprehensive analysis tool for targeted and nontargeted GC/MS based metabolome analysis. Anal. Chem. 81, 3429–3439. doi: 10.1021/ac802689c
Horton, P., Park, K. J., Obayashi, T., Fujita, N., Harada, H., Adams-Collier, C. J., et al. (2007). WoLF PSORT: protein localization predictor. Nucleic Acids Res. 35, W585–W587. doi: 10.1093/nar/gkm259
Jagtap, S. S., and Rao, C. V. (2018). Production of D-arabitol from D-xylose by the oleaginous yeast Rhodosporidium toruloides IFO0880. Appl. Microbiol. Biotechnol. 102, 143–151. doi: 10.1007/s00253-017-8581-1
Kim, S., and Pevzner, P. A. (2014). MS-GF+ makes progress towards a universal database search tool for proteomics. Nat. Commun. 5:5277. doi: 10.1038/ncomms6277
Kim, Y. M., and Heyman, H. M. (2018). Mass spectrometry-based metabolomics. Methods Mol. Biol. 1775, 107–118. doi: 10.1007/978-1-4939-7804-5_10
Kim, Y. M., Nowack, S., Olsen, M. T., Becraft, E. D., Wood, J. M., Thiel, V., et al. (2015). Diel metabolomics analysis of a hot spring chlorophototrophic microbial mat leads to new hypotheses of community member metabolisms. Front. Microbiol. 6:209. doi: 10.3389/fmicb.2015.00209
King, Z. A., Drager, A., Ebrahim, A., Sonnenschein, N., Lewis, N. E., and Palsson, B. O. (2015). Escher: a web application for building, sharing, and embedding data-rich visualizations of biological pathways. PLoS Comput. Biol. 11:e1004321. doi: 10.1371/journal.pcbi.1004321
King, Z. A., Lu, J., Drager, A., Miller, P., Federowicz, S., Lerman, J. A., et al. (2016). BiGG models: a platform for integrating, standardizing and sharing genome-scale models. Nucleic Acids Res. 44, D515–D522. doi: 10.1093/nar/gkv1049
Kominek, J., Doering, D. T., Opulente, D. A., Shen, X. X., Zhou, X., DeVirgilio, J., et al. (2019). Eukaryotic acquisition of a bacterial operon. Cell 176, 1356–1366.e1310. doi: 10.1016/j.cell.2019.01.034
Kyle, J. E., Crowell, K. L., Casey, C. P., Fujimoto, G. M., Kim, S., Dautel, S. E., et al. (2017). LIQUID: an-open source software for identifying lipids in LC-MS/MS-based lipidomics data. Bioinformatics 33, 1744–1746. doi: 10.1093/bioinformatics/btx046
Lachance, J. C., Lloyd, C. J., Monk, J. M., Yang, L., Sastry, A. V., Seif, Y., et al. (2019). BOFdat: generating biomass objective functions for genome-scale metabolic models from experimental data. PLoS Comput. Biol. 15:e1006971. doi: 10.1371/journal.pcbi.1006971
Lee, A. K., Banta, A. B., Wei, J. H., Kiemle, D. J., Feng, J., Giner, J. L., et al. (2018). C-4 sterol demethylation enzymes distinguish bacterial and eukaryotic sterol synthesis. Proc. Natl. Acad. Sci. U.S.A. 115, 5884–5889. doi: 10.1073/pnas.1802930115
Lee, H. J., Nakayasu, M., Akiyama, R., Kobayashi, M., Miyachi, H., Sugimoto, Y., et al. (2019). Identification of a 3beta-hydroxysteroid Dehydrogenase/3-ketosteroid reductase involved in alpha-tomatine biosynthesis in tomato. Plant Cell Physiol. 60, 1304–1315. doi: 10.1093/pcp/pcz049
Lee, J. J., Chen, L., Shi, J., Trzcinski, A., and Chen, W. N. (2014). Metabolomic profiling of Rhodosporidium toruloides grown on glycerol for carotenoid production during different growth phases. J. Agric. Food Chem. 62, 10203–10209. doi: 10.1021/jf502987q
Lieven, C., Beber, M. E., Olivier, B. G., Bergmann, F. T., Ataman, M. P., Babaei, P., et al. (2020). MEMOTE for standardized genome-scale metabolic model testing. Nat. Biotechnol. doi: 10.1038/s41587-020-0446-y
Li, L., Stoeckert, C. J. Jr., and Roos, D. S. (2003). OrthoMCL: identification of ortholog groups for eukaryotic genomes. Genome Res. 13, 2178–2189. doi: 10.1101/gr.1224503
Liu, H., Jiao, X., Wang, Y., Yang, X., Sun, W., Wang, J., et al. (2017). Fast and efficient genetic transformation of oleaginous yeast Rhodosporidium toruloides by using electroporation. FEMS Yeast Res. 17:fox017.
Liu, X., Zhang, Y., Liu, H., Jiao, X., Zhang, Q., Zhang, S., et al. (2019). RNA interference in the oleaginous yeast Rhodosporidium toruloides. FEMS Yeast Res. 19:foz031. doi: 10.1093/femsyr/foz031
Lopes, H. J. S., Bonturi, N., Kerkhoven, E. J., Miranda, E. A., and Lahtvee, P. J. (2020). C/N ratio and carbon source-dependent lipid production profiling in Rhodotorula toruloides. Appl. Microbiol. Biotechnol. 104, 2639–2649. doi: 10.1007/s00253-020-10386-5
Love, M. I., Huber, W., and Anders, S. (2014). Moderated estimation of fold change and dispersion for RNA-seq data with DESeq2. Genome Biol. 15:550. doi: 10.1186/s13059-014-0550-8
Ma, T., Shi, B., Ye, Z., Li, X., Liu, M., Chen, Y., et al. (2019). Lipid engineering combined with systematic metabolic engineering of Saccharomyces cerevisiae for high-yield production of lycopene. Metab. Eng. 52, 134–142. doi: 10.1016/j.ymben.2018.11.009
Mo, M. L., Palsson, B. O., and Herrgard, M. J. (2009). Connecting extracellular metabolomic measurements to intracellular flux states in yeast. BMC Syst. Biol. 3:37. doi: 10.1186/1752-0509-3-37
Monk, J. M., Lloyd, C. J., Brunk, E., Mih, N., Sastry, A., King, Z., et al. (2017). iML1515, a knowledgebase that computes Escherichia coli traits. Nat. Biotechnol. 35, 904–908. doi: 10.1038/nbt.3956
Monroe, M. E., Shaw, J. L., Daly, D. S., Adkins, J. N., and Smith, R. D. (2008). MASIC: a software program for fast quantitation and flexible visualization of chromatographic profiles from detected LC-MS(/MS) features. Comput. Biol. Chem. 32, 215–217. doi: 10.1016/j.compbiolchem.2008.02.006
Nakayasu, E. S., Nicora, C. D., Sims, A. C., Burnum-Johnson, K. E., Kim, Y. M., Kyle, J. E., et al. (2016). MPLEx: a robust and universal protocol for single-sample integrative proteomic, metabolomic, and lipidomic analyses. mSystems 1:e0043-16. doi: 10.1128/mSystems.00043-16
Nogales, J., Palsson, B. O., and Thiele, I. (2008). A genome-scale metabolic reconstruction of Pseudomonas putida KT2440: iJN746 as a cell factory. BMC Syst. Biol. 2:79. doi: 10.1186/1752-0509-2-79
Nora, L. C., Wehrs, M., Kim, J., Cheng, J. F., Tarver, A., Simmons, B. A., et al. (2019). A toolset of constitutive promoters for metabolic engineering of Rhodosporidium toruloides. Microb. Cell Fact. 18:117. doi: 10.1186/s12934-019-1167-0
Otoupal, P. B., Ito, M., Arkin, A. P., Magnuson, J. K., Gladden, J. M., and Skerker, J. M. (2019). Multiplexed CRISPR-Cas9-based genome editing of Rhodosporidium toruloides. mSphere 4:e0099-19. doi: 10.1128/mSphere.00099-19
Park, Y. K., Nicaud, J. M., and Ledesma-Amaro, R. (2018). The engineering potential of Rhodosporidium toruloides as a workhorse for biotechnological applications. Trends Biotechnol. 36, 304–317. doi: 10.1016/j.tibtech.2017.10.013
Penning, T. M., Chen, M., and Jin, Y. (2015). Promiscuity and diversity in 3-ketosteroid reductases. J. Steroid Biochem. Mol. Biol. 151, 93–101. doi: 10.1016/j.jsbmb.2014.12.003
Perez-Riverol, Y., Csordas, A., Bai, J., Bernal-Llinares, M., Hewapathirana, S., Kundu, D. J., et al. (2019). The PRIDE database and related tools and resources in 2019: improving support for quantification data. Nucleic Acids Res. 47, D442–D450. doi: 10.1093/nar/gky1106
Pinheiro, M. J., Bonturi, N., Belouah, I., Miranda, E. A., and Lahtvee, P. J. (2020). Xylose metabolism and the effect of oxidative stress on lipid and carotenoid production in Rhodotorula toruloides: insights for future biorefinery. Front. Bioeng. Biotechnol. 8:1008. doi: 10.3389/fbioe.2020.01008
Pluskal, T., Castillo, S., Villar-Briones, A., and Oresic, M. (2010). MZmine 2: modular framework for processing, visualizing, and analyzing mass spectrometry-based molecular profile data. BMC Bioinform. 11:395. doi: 10.1186/1471-2105-11-395
Polpitiya, A. D., Qian, W. J., Jaitly, N., Petyuk, V. A., Adkins, J. N., Camp, D. G., et al. (2008). DAnTE: a statistical tool for quantitative analysis of -omics data. Bioinformatics 24, 1556–1558. doi: 10.1093/bioinformatics/btn217
Price, M. N., Ray, J., Iavarone, A. T., Carlson, H. K., Ryan, E. M., Malmstrom, R. R., et al. (2019). Oxidative pathways of deoxyribose and deoxyribonate catabolism. mSystems 4:e00297-18. doi: 10.1128/mSystems.00297-18
Rabeharindranto, H., Castano-Cerezo, S., Lautier, T., Garcia-Alles, L. F., Treitz, C., Tholey, A., et al. (2019). Enzyme-fusion strategies for redirecting and improving carotenoid synthesis in S. cerevisiae. Metab. Eng. Commun. 8:e00086. doi: 10.1016/j.mec.2019.e00086
Rodriguez, S., Denby, C. M., Van Vu, T., Baidoo, E. E., Wang, G., and Keasling, J. D. (2016). ATP citrate lyase mediated cytosolic acetyl-CoA biosynthesis increases mevalonate production in Saccharomyces cerevisiae. Microb. Cell Fact. 15:48. doi: 10.1186/s12934-016-0447-1
Shen, X. X., Opulente, D. A., Kominek, J., Zhou, X., Steenwyk, J. L., Buh, K. V., et al. (2018). Tempo and mode of genome evolution in the budding yeast subphylum. Cell 175, 1533–1545.e1520. doi: 10.1016/j.cell.2018.10.023
Sigurdsson, M. I., Jamshidi, N., Steingrimsson, E., Thiele, I., and Palsson, B. O. (2010). A detailed genome-wide reconstruction of mouse metabolism based on human Recon 1. BMC Syst. Biol. 4:140. doi: 10.1186/1752-0509-4-140
Stamboulian, M., Guerrero, R. F., Hahn, M. W., and Radivojac, P. (2020). The ortholog conjecture revisited: the value of orthologs and paralogs in function prediction. Bioinformatics 36(Suppl._1), i219–i226. doi: 10.1093/bioinformatics/btaa468
Sun, W., Yang, X., Wang, X., Lin, X., Wang, Y., Zhang, S., et al. (2017). Homologous gene targeting of a carotenoids biosynthetic gene in Rhodosporidium toruloides by Agrobacterium-mediated transformation. Biotechnol. Lett. 39, 1001–1007. doi: 10.1007/s10529-017-2324-3
Sundstrom, E., Yaegashi, J., Yan, J. P., Masson, F., Papa, G., Rodriguez, A., et al. (2018). Demonstrating a separation-free process coupling ionic liquid pretreatment, saccharification, and fermentation with Rhodosporidium toruloides to produce advanced biofuels. Green Chem. 20, 2870–2879. doi: 10.1039/c8gc00518d
Tiukova, I. A., Brandenburg, J., Blomqvist, J., Sampels, S., Mikkelsen, N., Skaugen, M., et al. (2019a). Proteome analysis of xylose metabolism in Rhodotorula toruloides during lipid production. Biotechnol. Biofuels 12:137. doi: 10.1186/s13068-019-1478-8
Tiukova, I. A., Prigent, S., Nielsen, J., Sandgren, M., and Kerkhoven, E. J. (2019b). Genome-scale model of Rhodotorula toruloides metabolism. Biotechnol. Bioeng. 116, 3396–3408. doi: 10.1002/bit.27162
Wei, S., Jian, X., Chen, J., Zhang, C., and Hua, Q. (2017). Reconstruction of genome-scale metabolic model of Yarrowia lipolytica and its application in overproduction of triacylglycerol. Bioresour. Bioprocess 4:51. doi: 10.1186/s40643-017-0180-6
Wiebe, M. G., Koivuranta, K., Penttila, M., and Ruohonen, L. (2012). Lipid production in batch and fed-batch cultures of Rhodosporidium toruloides from 5 and 6 carbon carbohydrates. BMC Biotechnol. 12:26. doi: 10.1186/1472-6750-12-26
Yaegashi, J., Kirby, J., Ito, M., Sun, J., Dutta, T., Mirsiaghi, M., et al. (2017). Rhodosporidium toruloides: a new platform organism for conversion of lignocellulose into terpene biofuels and bioproducts. Biotechnol. Biofuels 10:241. doi: 10.1186/s13068-017-0927-5
Yamada, Y., and Kondo, K. (1973). Coenzyme q system in the classification of the yeast genera Rhodotorula and Cryptococcus, and the yeast-like genera Sporobolomyces and Rhodosporidium. J. Gen. Appl. Microbiol. 19, 59–77. doi: 10.2323/jgam.19.59
Zhang, S., Skerker, J. M., Rutter, C. D., Maurer, M. J., Arkin, A. P., and Rao, C. V. (2016). Engineering Rhodosporidium toruloides for increased lipid production. Biotechnol. Bioeng. 113, 1056–1066. doi: 10.1002/bit.25864
Zhu, Z., Zhang, S., Liu, H., Shen, H., Lin, X., Yang, F., et al. (2012). A multi-omic map of the lipid-producing yeast Rhodosporidium toruloides. Nat. Commun. 3:1112. doi: 10.1038/ncomms2112
Keywords: Rhodosporidium toruloides, multi-omics, metabolic networks, genome-scale models, lignocellulosic biomass
Citation: Kim J, Coradetti ST, Kim Y-M, Gao Y, Yaegashi J, Zucker JD, Munoz N, Zink EM, Burnum-Johnson KE, Baker SE, Simmons BA, Skerker JM, Gladden JM and Magnuson JK (2021) Multi-Omics Driven Metabolic Network Reconstruction and Analysis of Lignocellulosic Carbon Utilization in Rhodosporidium toruloides. Front. Bioeng. Biotechnol. 8:612832. doi: 10.3389/fbioe.2020.612832
Received: 30 September 2020; Accepted: 04 December 2020;
Published: 08 January 2021.
Edited by:
Dong-Yup Lee, Sungkyunkwan University, South KoreaReviewed by:
Christopher Rao, University of Illinois at Urbana–Champaign, United StatesJulio Augusto Freyre-Gonzalez, National Autonomous University of Mexico, Mexico
Copyright © 2021 Kim, Coradetti, Kim, Gao, Yaegashi, Zucker, Munoz, Zink, Burnum-Johnson, Baker, Simmons, Skerker, Gladden and Magnuson. This is an open-access article distributed under the terms of the Creative Commons Attribution License (CC BY). The use, distribution or reproduction in other forums is permitted, provided the original author(s) and the copyright owner(s) are credited and that the original publication in this journal is cited, in accordance with accepted academic practice. No use, distribution or reproduction is permitted which does not comply with these terms.
*Correspondence: John M. Gladden, jmgladden@lbl.gov; Jon K. Magnuson, jon.magnuson@pnnl.gov