Experimental and Computational Comparison of Intervertebral Disc Bulge for Specimen-Specific Model Evaluation Based on Imaging
 Marlène Mengoni
 Fernando Y. Zapata-Cornelio
  Vithanage N. Wijayathunga
 Ruth K. Wilcox
- School of Mechanical Engineering, Institute of Medical and Biological Engineering, University of Leeds, Leeds, United Kingdom
Finite element modelling of the spinal unit is a promising preclinical tool to assess the biomechanical outcome of emerging interventions. Currently, most models are calibrated and validated against range of motion and rarely directly against soft-tissue deformation. The aim of this contribution was to develop an in vitro methodology to measure disc bulge and assess the ability of different specimen-specific modelling approaches to predict disc bulge. Bovine bone-disc-bone sections (N = 6) were prepared with 40 glass markers on the intervertebral disc surface. These were initially magnetic resonance (MR)-imaged and then sequentially imaged using peripheral-qCT under axial compression of 1 mm increments. Specimen-specific finite-element models were developed from the CT data, using three different methods to represent the nucleus pulposus geometry with and without complementary use of the MR images. Both calibrated specimen-specific and averaged compressive material properties for the disc tissues were investigated. A successful methodology was developed to quantify the disc bulge in vitro, enabling observation of surface displacement on qCT. From the finite element model results, no clear advantage was found in using geometrical information from the MR images in terms of the models’ ability to predict stiffness or disc bulge for bovine intervertebral disc.
Introduction
Globally, back pain causes more disability than any other condition (James et al., 2018). While the specific causes are often unclear, changes to the structure and morphology of the intervertebral disc (IVD) are frequently implicated (de Schepper et al., 2010; Brinjikji et al., 2015). The development of new surgical interventions for the IVD have been hampered by the limitations in current preclinical testing methods. In particular, in vitro testing is challenging due to the hydrated nature of the tissues and natural variation that occurs between samples (Vadalà et al., 2015; Sikora et al., 2018). In silico finite element (FE) models are a promising preclinical testing tool, capable of targeting specific situations, organ/tissue behaviour, and accounting for population variation (Schmidt et al., 2007; Mengoni et al., 2016). In particular, there is potential for FE analysis to be used to examine nucleus augmentation or replacement where design variables, such as the biomaterial properties or device size, and patient variables such as the properties of the surrounding tissues can be parametrically altered and evaluated. The credibility of such models depends, among other things, on the correct description of the mechanical properties for a specific context of use and on relevant validation (Jones and Wilcox, 2008).
Both calibration and validation of in silico models of the spine have been commonly undertaken using averaged data from in vitro experiments, including range of motion and load-displacement behaviour as well as IVD pressure (e.g., Schmidt et al., 2006, 2007; Ayturk and Puttlitz, 2011; Adam et al., 2015; Brummund et al., 2017). Since there often exists large specimen-to-specimen variation in the measured values, this approach does not allow direct validation or calibration of an individual specimen behaviour.
Comparisons between specimen-specific models and corresponding in vitro experimental tests of the same specimen have been undertaken in a limited number of studies, using global measures of behaviour such as stiffness or range of motion (e.g., Maquer et al., 2015; Sikora et al., 2018; Stadelmann et al., 2018). A number of methods of measuring localised deformation or strain have been applied to the disc, such as laser scanning (Heuer et al., 2007; Fewster et al., 2020), potentiometer based surface tracking (Brinckmann and Horst, 1985; Brinckmann and Grootenboer, 1991), stereo digital image correlation (Spera et al., 2011), and magnetic resonance (MR) imaging (O’Connell et al., 2007, 2011; Showalter et al., 2016; Tavana et al., 2020). However, these methods of measuring local tissue displacement have not yet been applied to validate specimen-specific in silico models. Local tissue displacement such as disc bulge can be a good measure to evaluate the capacity of a model to replicate the biomechanics of the disc directly, rather than of the disc and the motion segment geometry analysed through global measures. Disc bulge is also an indirect measure of the capacity of the annulus to sustain the nucleus compression.
Specimen-specific FE models are often constructed from computed tomography (CT) or MR image data. The use of high-resolution CT image data is considered to be the gold standard for the development of computational models of hard tissues due to the feasibility of generating image-based material parameters and the reliability of the image data (Jones and Wilcox, 2008). However, a CT protocol optimised for hard tissues will not be able to effectively provide information on IVD soft tissue structures. Magnetic resonance imaging can allow different soft tissue structures to be differentiated, although limitations of resolution in 3D scans, coupled with sensitivities to tissue condition and orientation (Wijayathunga et al., 2019), make the use of MR data more challenging for model generation.
Since both CT and MR data can be acquired in preclinical studies, there is potential to use both modalities to combine the advantages of each. When testing tissue ex vivo for preclinical assessment of therapies, it is not clear which geometrical information from both modalities affects the accuracy of FE models of the IVD for information of interest such as stiffness or bulge. Therefore, the main aims of this study were:
1. To develop a methodology to quantify the local surface deformations of the IVD in vitro (“disc bulge”) in such a way that direct comparisons could be made with FE model predictions.
2. To assess the ability of a simple specimen-specific finite element (FE) methodology to predict the disc bulge, using different approaches to represent the internal geometry of the IVD.
Materials and Methods
Bovine caudal IVDs were used in this study due to the similarities to human discs (Beckstein et al., 2008) and the lack of facet joints; this tissue is also often used in preclinical assessment of intervertebral disc repair (e.g., Chan et al., 2010; Miles et al., 2016; Hom et al., 2019; among other groups). The tissue was obtained from food-chain animals for which no ethical approval was required. In the experimental arm of the study, the IVDs were imaged using MRI before being sequentially loaded and imaged under CT. In the computational arm, FE models were generated from the initial image data. Experimental load-displacement values were used to calibrate the compressibility of the disc tissues, whilst the disc surface bulge, measured experimentally at 40 points, was used for point-wise comparison of the predicted disc displacement. The experimental and computational arms of this study are described in detail below and summarised in Figure 1.
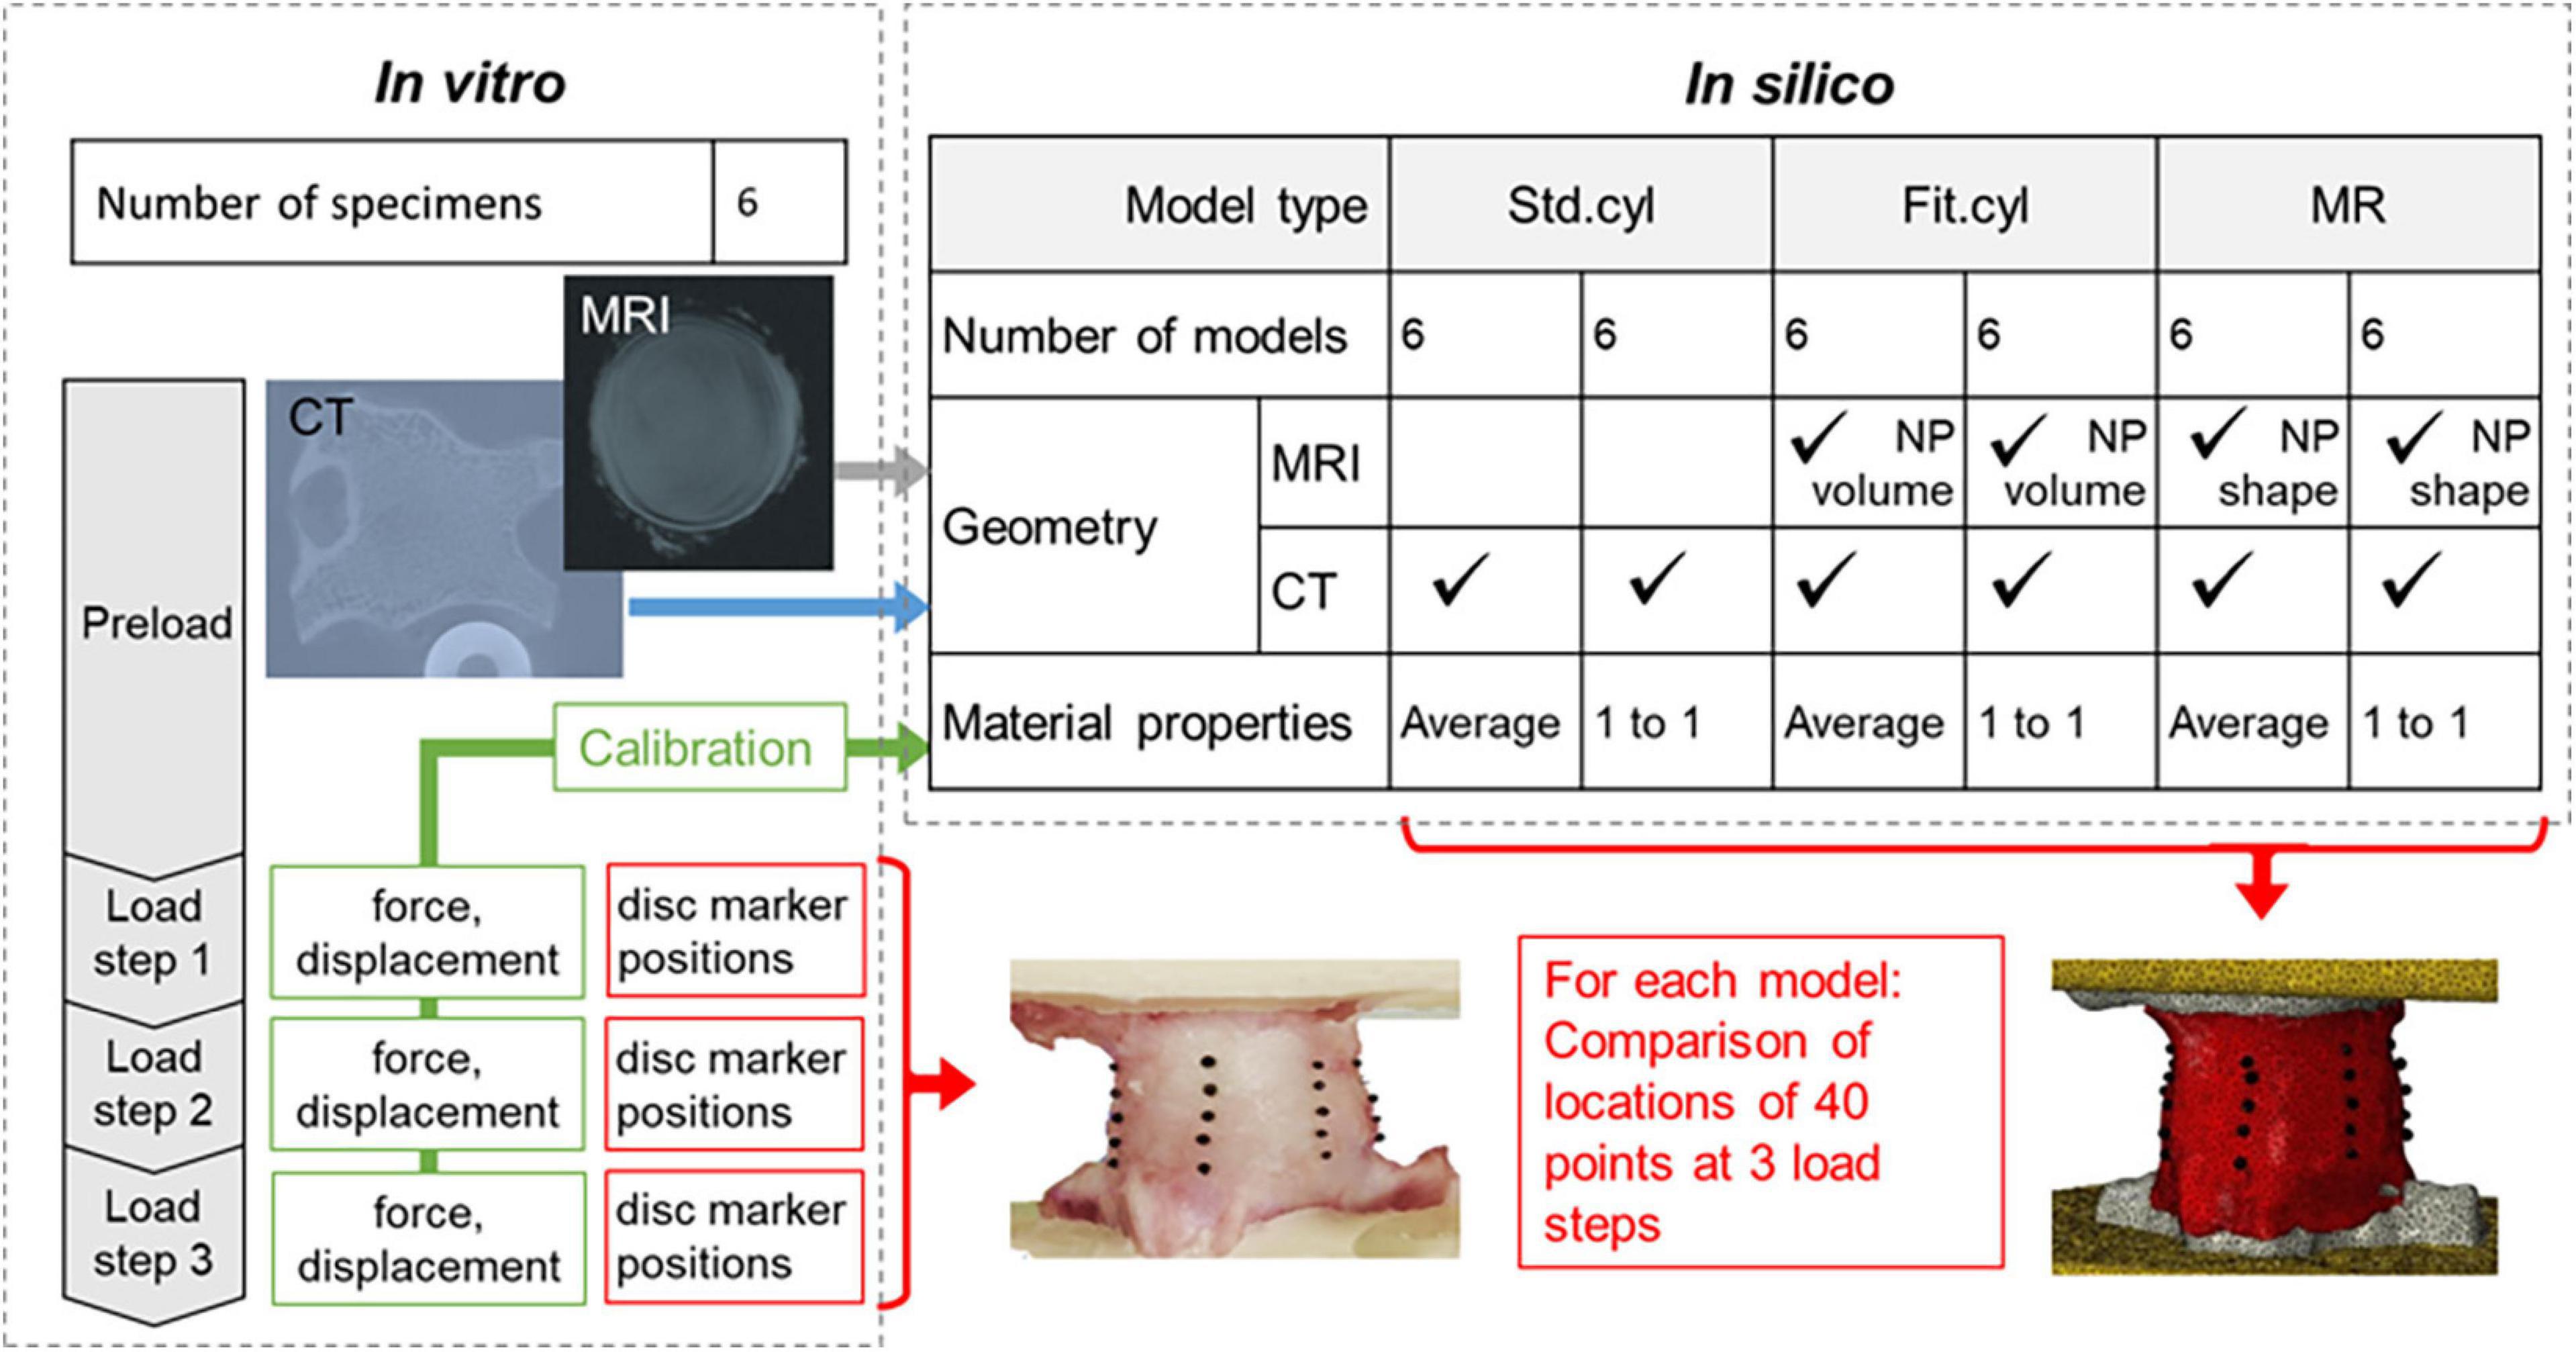
Figure 1. Overview of the experimental in vitro and computational in silico arms of the study.
Specimen Preparation, Imaging, and Mechanical Testing
The bovine tissue was sourced from a local abattoir and frozen at −80°C prior to use. Six osteodiscs (half vertebra-disc-half vertebra sections) were extracted from coccygeal levels 1–4 of two tails by making parallel cuts through adjacent vertebrae, leaving approximately 15 mm of bone on each side of the IVD (Sikora et al., 2018). The specimens were potted into polymethyl methacrylate (PMMA) endcaps (Figure 2A). CT- and MR-compatible large markers (PinPoint® Multi-Modality Fiducial Marker, Oncology Imaging Systems Ltd., United Kingdom) were embedded into the surface of the endcaps. Additionally, forty glass fiducial markers (∼1 mm diameter) were attached to the surface of each disc using petroleum jelly where required. These were arranged along eight locations on craniocaudal lines spaced at 45-degree intervals (Figure 2B), and with five glass markers per line.
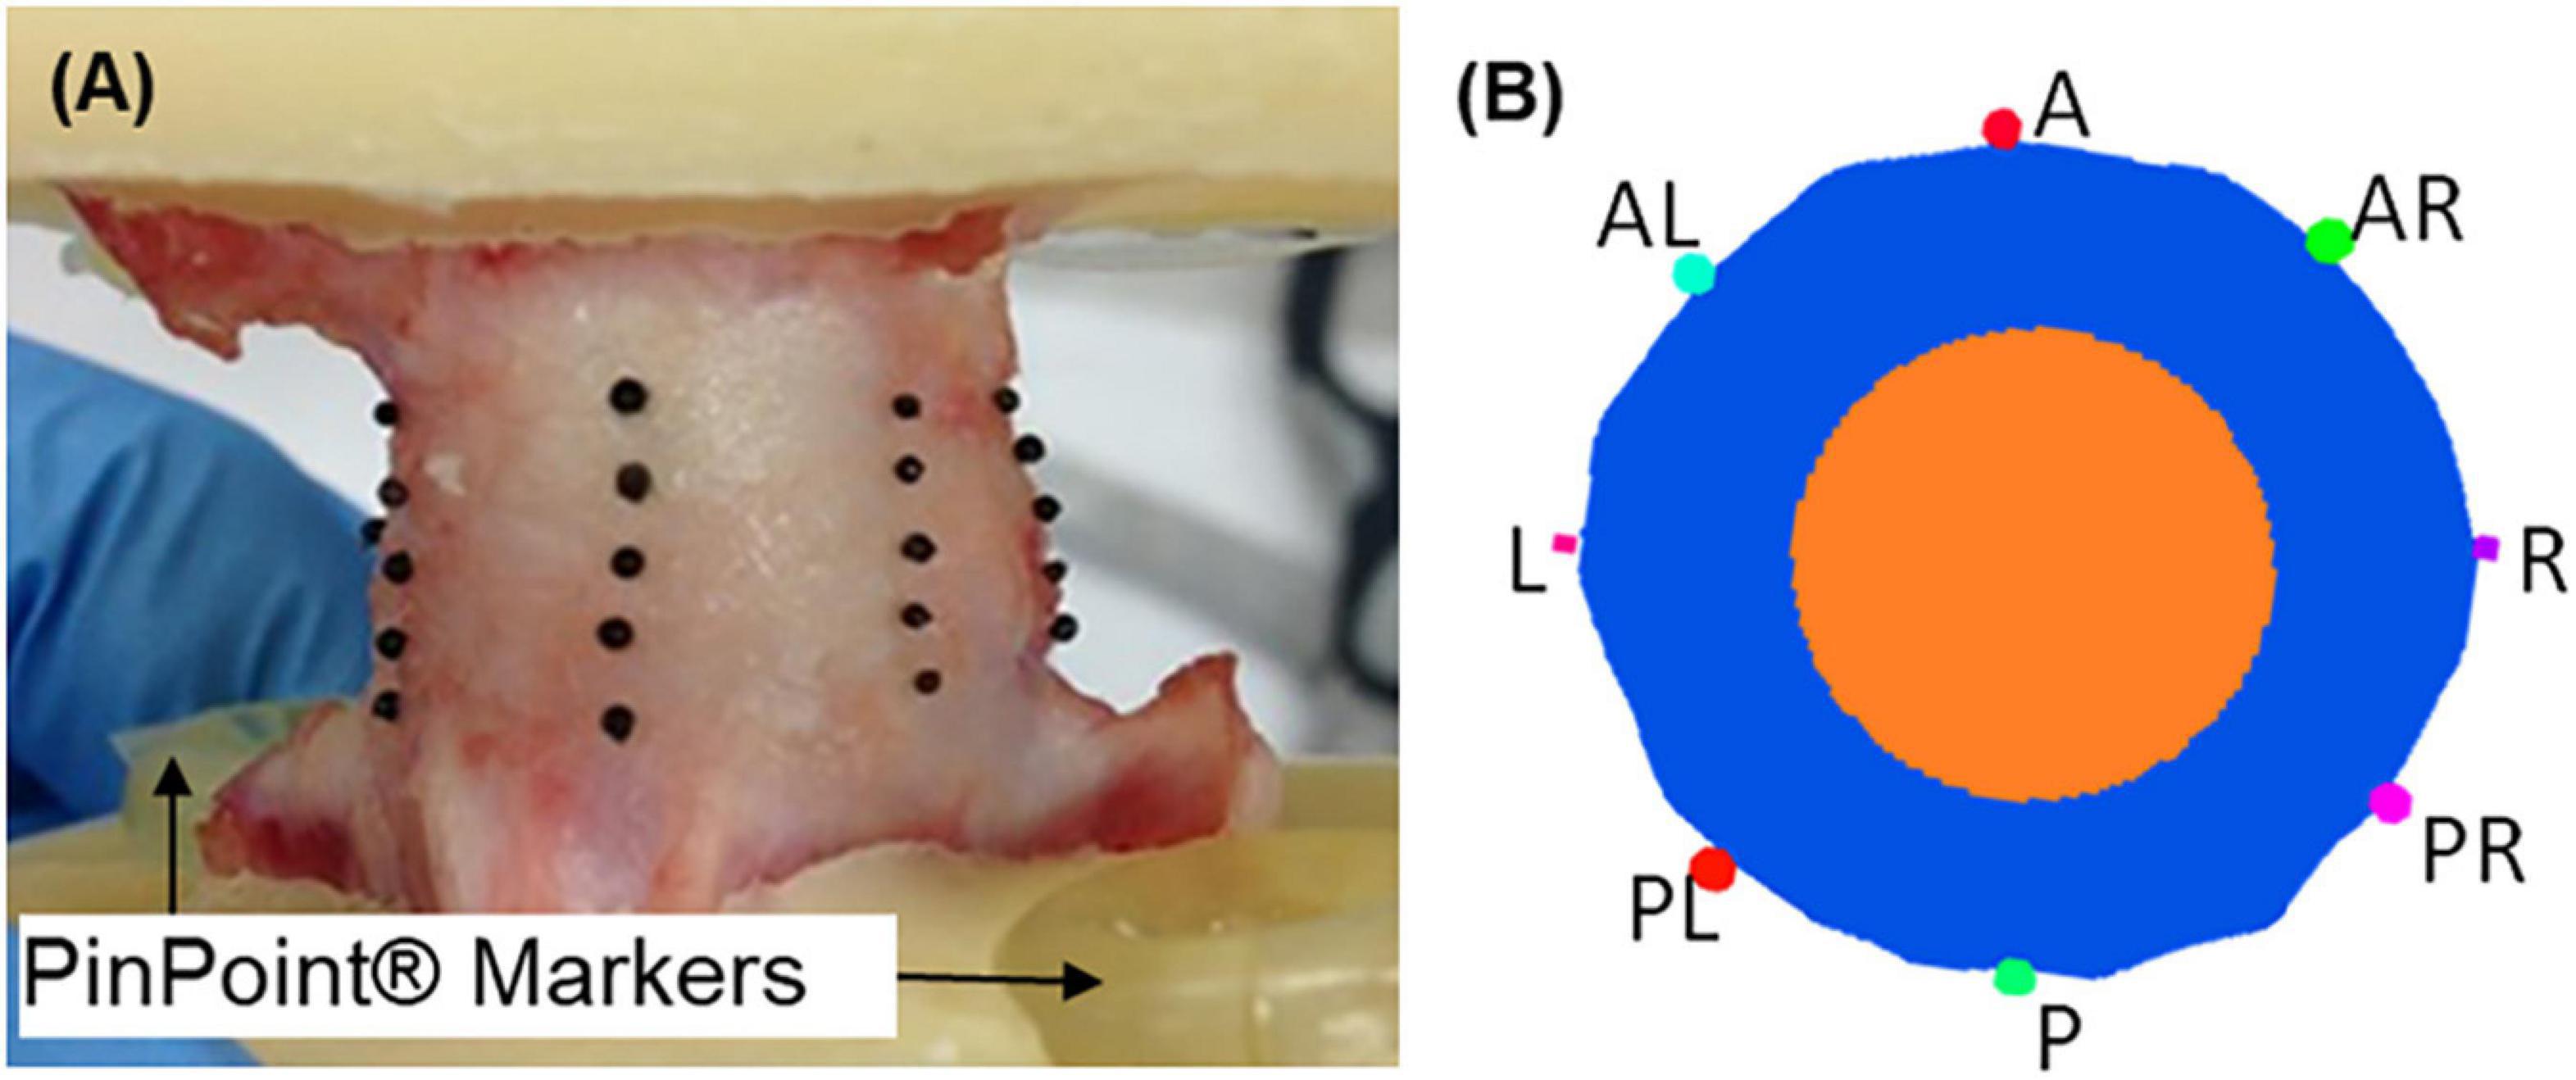
Figure 2. (A) Osteodisc prepared for mechanical testing, with glass fiducial markers, CT- and MR-compatible PinPoint® markers, and PMMA endcaps. (B) Transverse plane slice through the intervertebral disc showing segmentation of the annulus fibrosus (blue), nucleus pulpous (orange) and fiducial glass beads, with classification of the eight zones of the disc (A, anterior; P, posterior; L, left; R, right).
Each potted osteodisc was placed between parallel Delrin fixtures in a rig that facilitated consistent positioning and alignment relative to the global axes on a 3T MR platform (MAGNETOM® Verio, Siemens Healthineers, Erlangen, Germany). The specimens were imaged using a T2-weighted turbo spin-echo sequence with 0.3 × 0.3 mm in-plane resolution and slice thickness of 1 mm.
The specimens were transferred to a CT-compatible compression rig (Figure 3A) fabricated in-house (Sikora, 2013). The rig enabled the specimens to be manually compressed via a screw-driven piston with transverse displacements and rotations constrained; the applied load was measured using a universal load cell (SLC31/01000, RDP Electronics Ltd., United Kingdom).
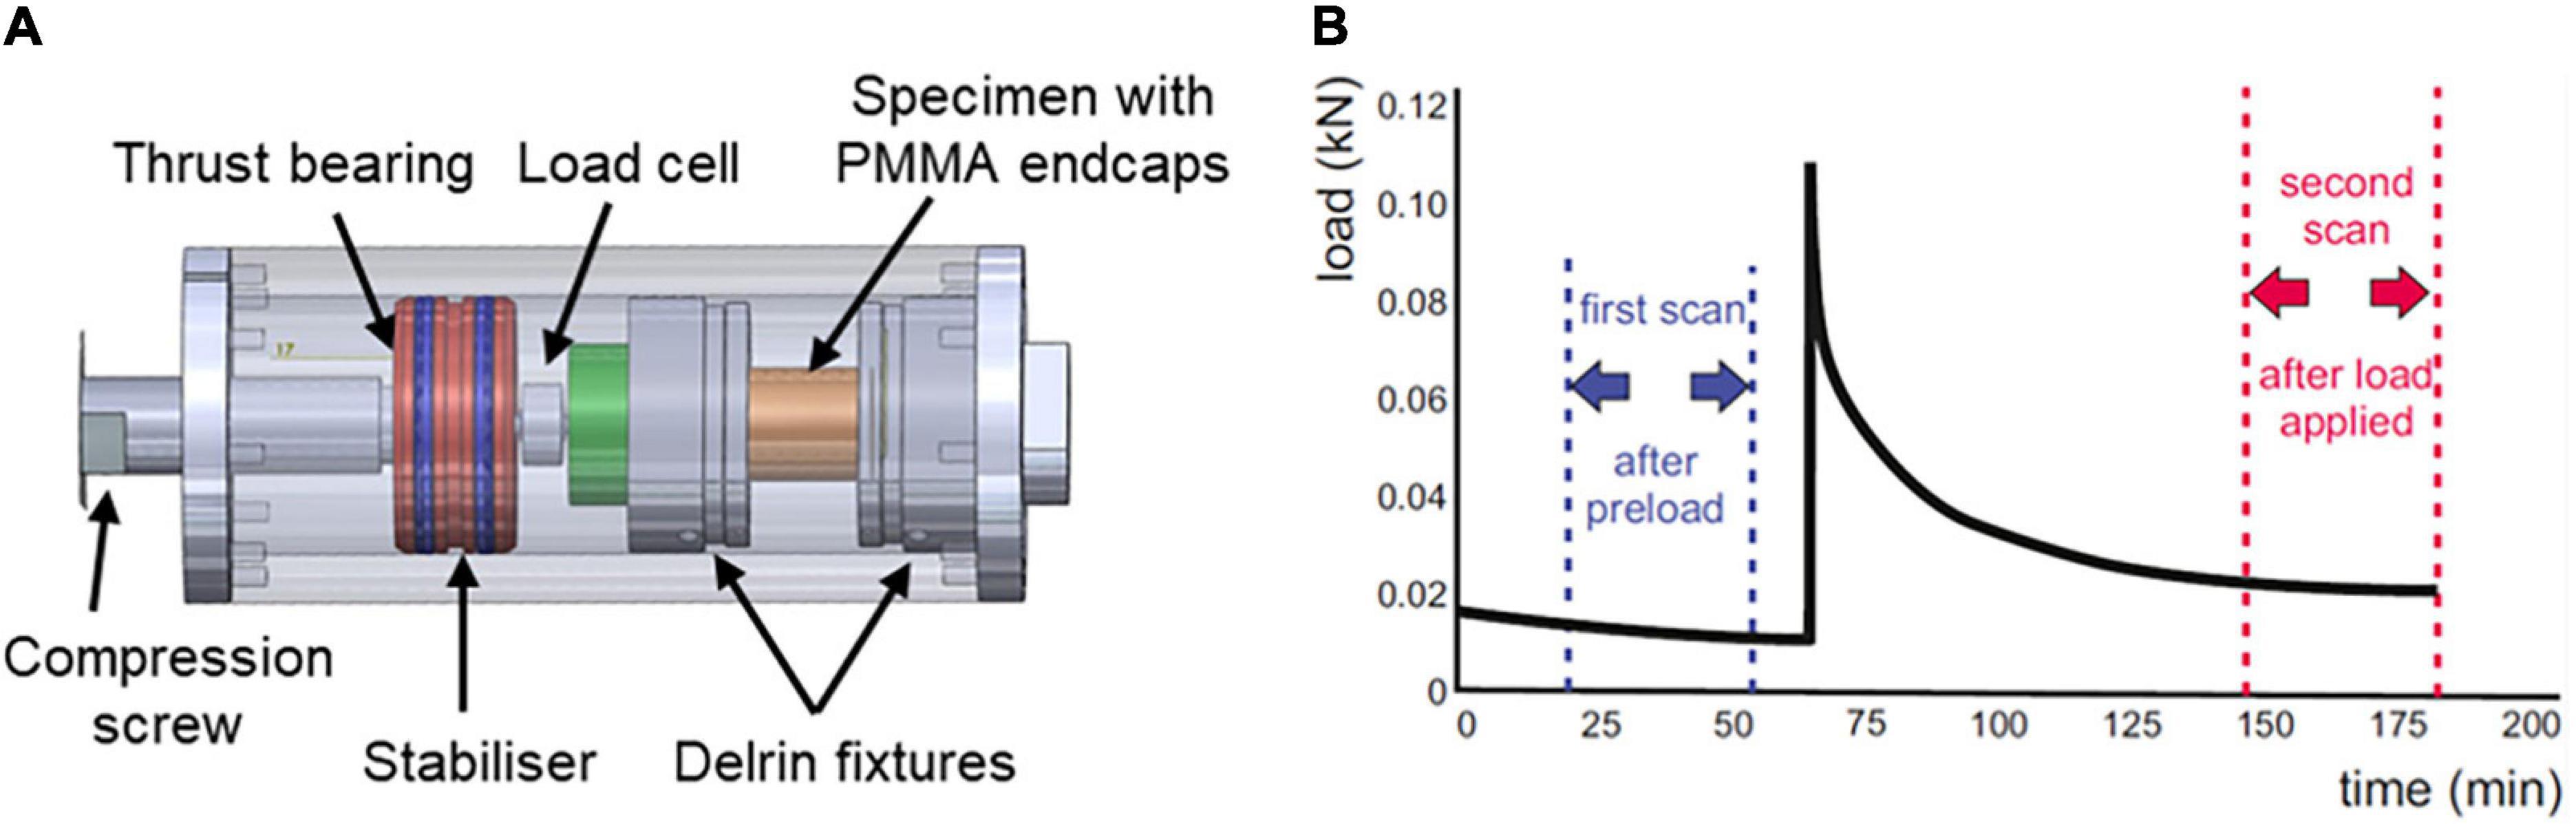
Figure 3. (A) The CT-compatible compression rig. (B) Illustration of the timing of the CT image acquisition, showing the first “preloaded” scan and second scan following load step 1.
Each specimen was then axially compressed and imaged in a high-resolution peripheral-qCT scanner (XtremeCT, Scanco Medical, Switzerland) at an isotropic resolution of 82 μm (60 kVp and 900 μA), under a constant displacement. The specimen was placed between parallel platens and an initial pre-load of 50 N was applied to maintain alignment prior to the first scan. This was followed by four sequential axial compression displacement steps of approximately 1 mm each with a hold period of 90 min after each step prior to the subsequent CT scan to allow the specimen to relax (Figure 3B). This displacement increment was selected following pilot studies to enable the disc marker lateral displacements to be measurable at the image resolution. The exact applied displacement for each step was measured from the image data during image processing. The manual rotation of the screw to apply the displacement was performed very slowly (>30 s) to keep the strain-rate low.
Image Processing and in vitro Bulge Calculation
Computed tomography images were imported into Simpleware ScanIP (v 7.0, Synopsys, United States) after their greyscale-values had been rescaled to enable the use of previously calibrated bone properties (Zapata-Cornelio et al., 2017). The rescaled CT images at each compression step were rigidly registered to the CT images of specimens in their initial preloaded state (“preloaded CT images”), using the most caudal vertebrae as reference. Coordinates for all glass markers on the registered images were automatically calculated, using image processing and recognition (Python v2.7 with OpenCV v3.0). This automatic method was validated by manually extracting the marker positions on the CT images for one specimen.
Intervertebral disc bulge at each marker was calculated as the displacement of the marker centroid in the transverse plane, between the deformed and the initial stage.
Magnetic resonance images were resampled to the same resolution as the CT images, and rigidly registered to the preloaded CT images, using the PinPoint® markers as references.
Finite Element Modelling
The preloaded CT images were segmented in Simpleware ScanIP to separate bone, intervertebral disc, individual glass markers, and cement endcaps (Figure 4A), using automatic thresholding and manual operations for the outer surface of the annulus fibrosus (AF). The segmented markers were used to identify the closest node on the disc surface and were not subsequently included in the FE analysis. The registered MR images were segmented to isolate the nucleus pulposus (NP) and compute its volume (Figure 4B).
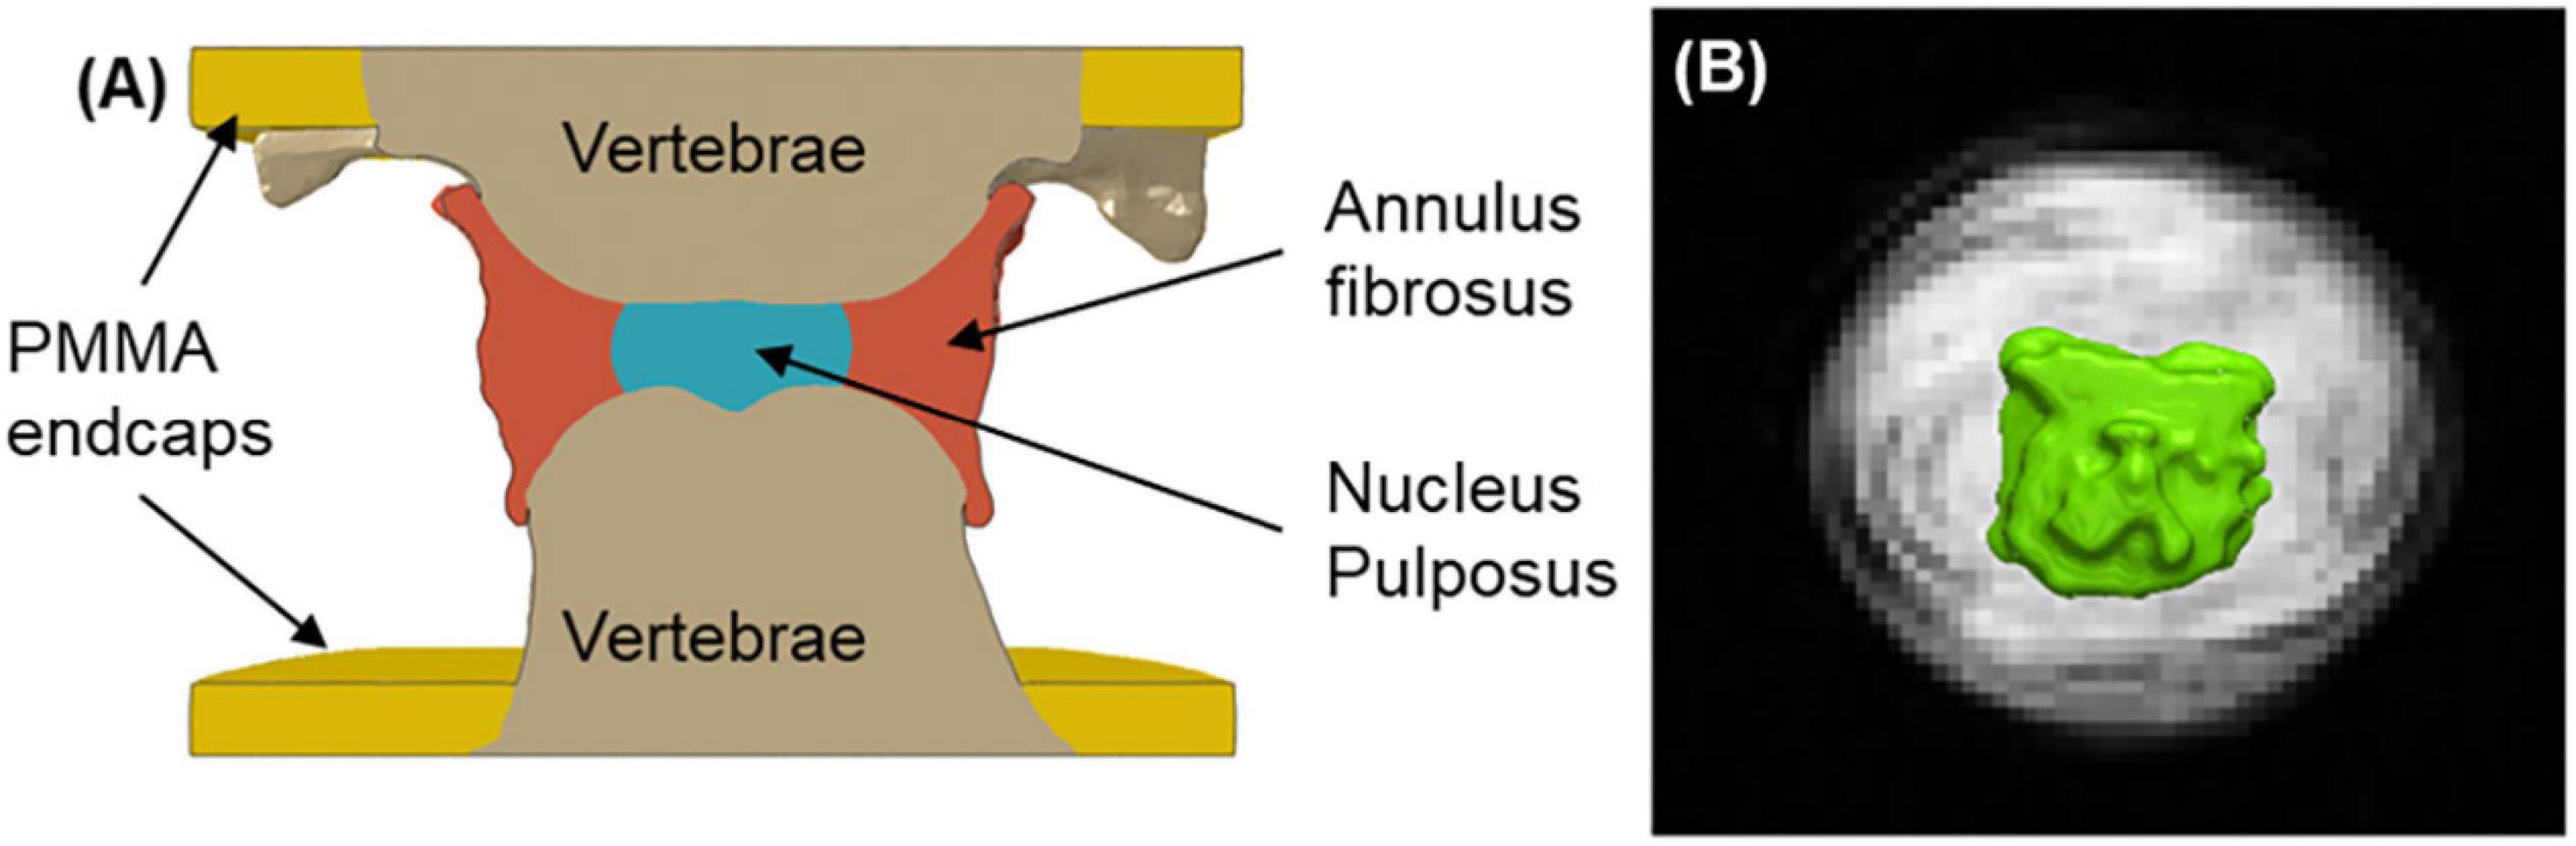
Figure 4. (A) Longitudinal section through an FE model of one specimen (std. cyl. model). (B) Volume rendering (in green) of an MRI-segmented nucleus pulposus, with an axial slice through the centre of the disc, showing defined annulus fibrosus lamellar structure.
Given that accurate distinction of different soft tissue structures using image contrast was difficult on the CT scan, the NP and AF were separated as below to create three nucleus model types:
1. A cylindrical NP, centred within the AF in the transverse plane, with dimensions in such a way that NP:AF diameter ratio was 0.5 (Mengoni et al., 2017) (std. cyl. model);
2. A cylindrical NP, centred within the AF in the transverse plane, with dimensions so that the volume of the NP matched that measured on the MR image of the specimen (fit. cyl. model);
3. The NP geometry directly derived from the segmented MR image (MR model).
All specimens were modelled in a specimen-specific approach, with non-linear quasi-static FE analysis run in parallel using Abaqus CAE 2017 (Simulia, Dassault Systèmes).
The 18 models (six specimens each with three nucleus model types) were meshed with linear tetrahedral elements with size between 0.5 and 1.0 mm following previous mesh convergence studies (Jones and Wilcox, 2007; Luxmoore, 2013, see data associated with this paper for mesh size comparison). This led to an average of 1.15 million elements per model (range 0.9–1.6 million), 620 thousand of which represented the IVD (range 400–850 thousand). Boundary conditions were applied to simulate the experimental setup: the inferior face of the lower endcap was clamped while the superior face of the upper endcap was constrained in translation and rotation in the transverse plane. An axial compressive displacement was applied to the upper endcap, the magnitude of which was matched to the displacement measured in successive CT scans. The constitutive model and parameters used for the AF have been validated for a compression up to 30% (Sikora et al., 2018). As it is not known if it is valid for the displacement obtained in the fourth experimental step which yield over 50% compression, only the first three experimental compression steps were modelled.
The material parameters are summarised in Table 1. Bone was modelled as a linear elastic material, with element-by-element elastic modulus scaled using the underlying greyscale value of the CT image data, and Poisson’s ratio of 0.3. In order to use a greyscale-based equation for the bone modulus (Zapata-Cornelio et al., 2017), the images underlying the high-resolution segmentation were down-sampled to an isotropic resolution of 0.5 mm. The greyscale-based model requires first a normalisation of the greyscale to 0–255. A linear mapping between the greyscale and the element elasticity modulus is then applied, with a mapping coefficient previously validated for bovine tails (Zapata-Cornelio et al., 2017). The cement endcaps were assigned an elastic modulus of 2.45 GPa, and Poisson’s ratio of 0.3 (Tarsuslugil et al., 2014). The annulus fibrosus was modelled using a Holzapfel exponential model (Gasser et al., 2006), with an oblique/counter-oblique fibre orientation at 20° to the transverse plane and fibre properties previously validated for a similar axial loading setup (Mengoni et al., 2017; Sikora et al., 2018). The nucleus pulposus was modelled as a Mooney-Rivlin material (Adam et al., 2015).
Table 1. Material parameters.
For each model, NP and AF compressibility values were calibrated in order to replicate the experimental peak axial load achieved at each displacement step (1-to-1 calibration), producing different values of tissues compressibility for each model. The cost function of the optimisation was the RMS difference between the experimental and computational loads for each displacement step, optimised using a Trust Region Reflective method with opti4Abq (Mengoni, 2021). The calibration process was considered successful when the cost function was below 10% of the maximum experimental load, with initial conditions using the compressibility of water (1/2,200 MPa–1) for both AF and NP. Only the compressibility values were calibrated because they have been shown to have the largest effect on the outcome of this type of models (Mengoni et al., 2017). As a comparison, FE models were also run where the compressibility of the disc tissues was set to the average value across all six specimens of the 1-to-1 calibrations within each nucleus model type (average compressibility models). Here the same value of tissue compressibility was applied to all specimens within each nucleus model type.
Data Analysis
The data associated with this study (CT and MR images, key anatomical measurements, FE models, and results of calibration) is openly available on the University of Leeds data repository (Mengoni and Wilcox, 2019).
All statistical analysis was performed using R v.3.5.0 (R Foundation for Statistical Computing) and statistical significance was set at p < 0.05.
Experimental Data
The applied displacement was measured from the micro-CT scan, measuring the distance between the inner surfaces of the PMMA endcaps.
To compare bulge values across samples and marker locations at each step, the in vitro bulge at each marker was normalised with respect to the applied displacement at each step. The normalisation was required as each specimen had a slightly different applied displacement. The normalised bulge was compared between the eight marker locations with a Welch-corrected ANOVA test after assessing normality with a Shapiro test and heteroscedasticity with a Levene test. Where a statistically significant difference was found, a post-hoc analysis was performed using a pairwise t-test with pooled SD and Bonferroni correction.
Computing Equivalent Poisson’s Ratio
Compressibility values obtained by the optimisation algorithm were transformed into equivalent Poisson’s ratio, assuming a linear-equivalent material model for both the annulus fibrosus and the nucleus pulposus (for which the shear modulus G = 2C10; Timoshenko and Goodier, 1970):
Where K is the bulk modulus value obtained from the optimisation of compressibility, C10 = 0.07MPa for the nucleus pulposus (Table 1) and C10 = 1.92MPa for the annulus fibrosus (value from a linear fit at small strain of the stress/strain data obtained from the Holzapfel model and parameters as in Table 1). Such a Poisson’s ratio is provided as an easily interpretable parameter for comparison rather than a material parameter used in a model.
Comparison of Experimental and Computational Data
The computational axial load required for each displacement step was compared to the experimental equivalent using concordance correlation coefficients for each model type (three types of nucleus models and either one-to-one calibration or average compressibility). The concordance correlation coefficient is a measure of the agreement between values measured by two methods (Lin, 1989), hence of the ability of the in silico models to reproduce in vitro data.
As well as comparing bulge values between marker locations similarly to the experimental data analysis, the bulge was compared between in vitro and in silico values for each model type using a concordance correlation coefficient. Markers for which experimental displacement was in the lower tenth percentile were not included in this analysis to avoid comparisons with the smallest experimental displacements, which are likely to be more error-prone.
Results
Experimental Specimens Mechanical Testing
The NP volume computed from the MR images ranged from 7 to 17% of the disc volume, with equivalent NP diameters between 26 and 41% of the corresponding AF average diameters. These volumes were consistently smaller than the standard cylindrical NP used in the std. cyl. FE models, which assumed an NP:AF diameter ratio of 50%.
The mechanical testing data showed a stiffening behaviour through the four loading steps (Figure 5). The applied displacement at each step across all samples was 0.89 ± 0.14 mm (mean ± st. dev.; measurement error of 82 μm); with a non-linear increase in force up to maximum of 2.0 kN.
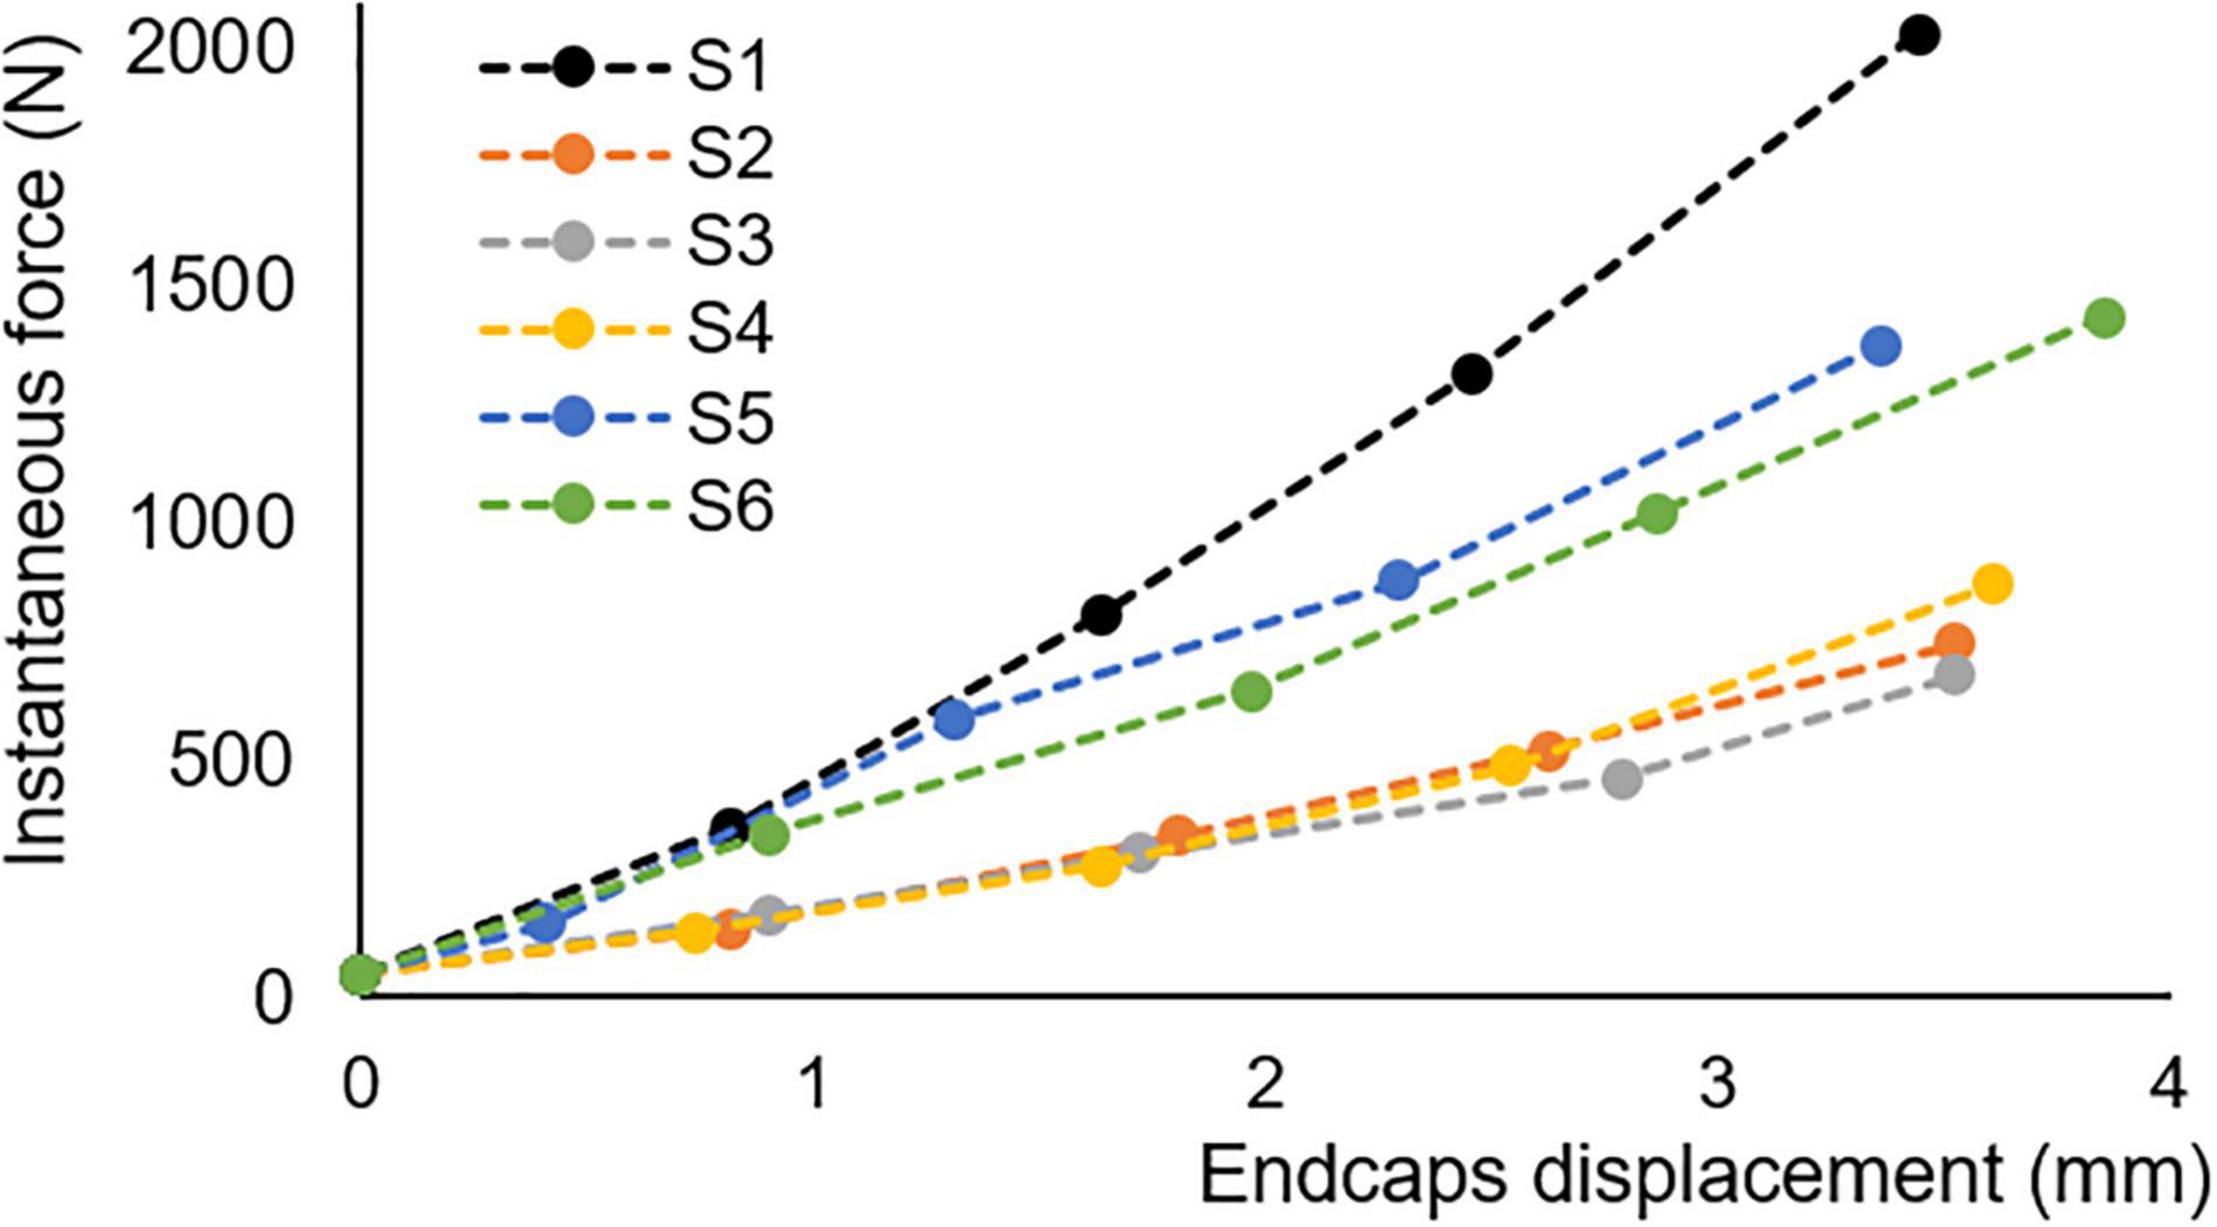
Figure 5. In vitro load-displacement for all specimens, extracted from 2 spines (samples S1, S5, and S6 come from one spine; samples S2–4 come from the other spine); the load is the peak load measured, the displacement is as measured on CT scans with a resolution of 82 μm.
The differences between the markers initial positions computed automatically and extracted manually were lower than 90 μm (i.e., about one pixel) in the transverse plane where bulge is computed. They were lower than 350 μm (i.e., about four pixels) in the axial direction whereas the axial distance between markers was about 800 μm.
The measured disc bulge across all steps and all markers was 0.24 ± 0.11 mm, 0.48 ± 0.22 mm, 0.67 ± 0.30 mm, and 0.84 ± 0.36 mm (mean ± st. dev. across all specimens and markers) for displacement steps 1–4, respectively (Figure 6). Generally, the anterior bulge was larger than the posterior bulge, with the differences being significant between some regions at each step (Table 2).
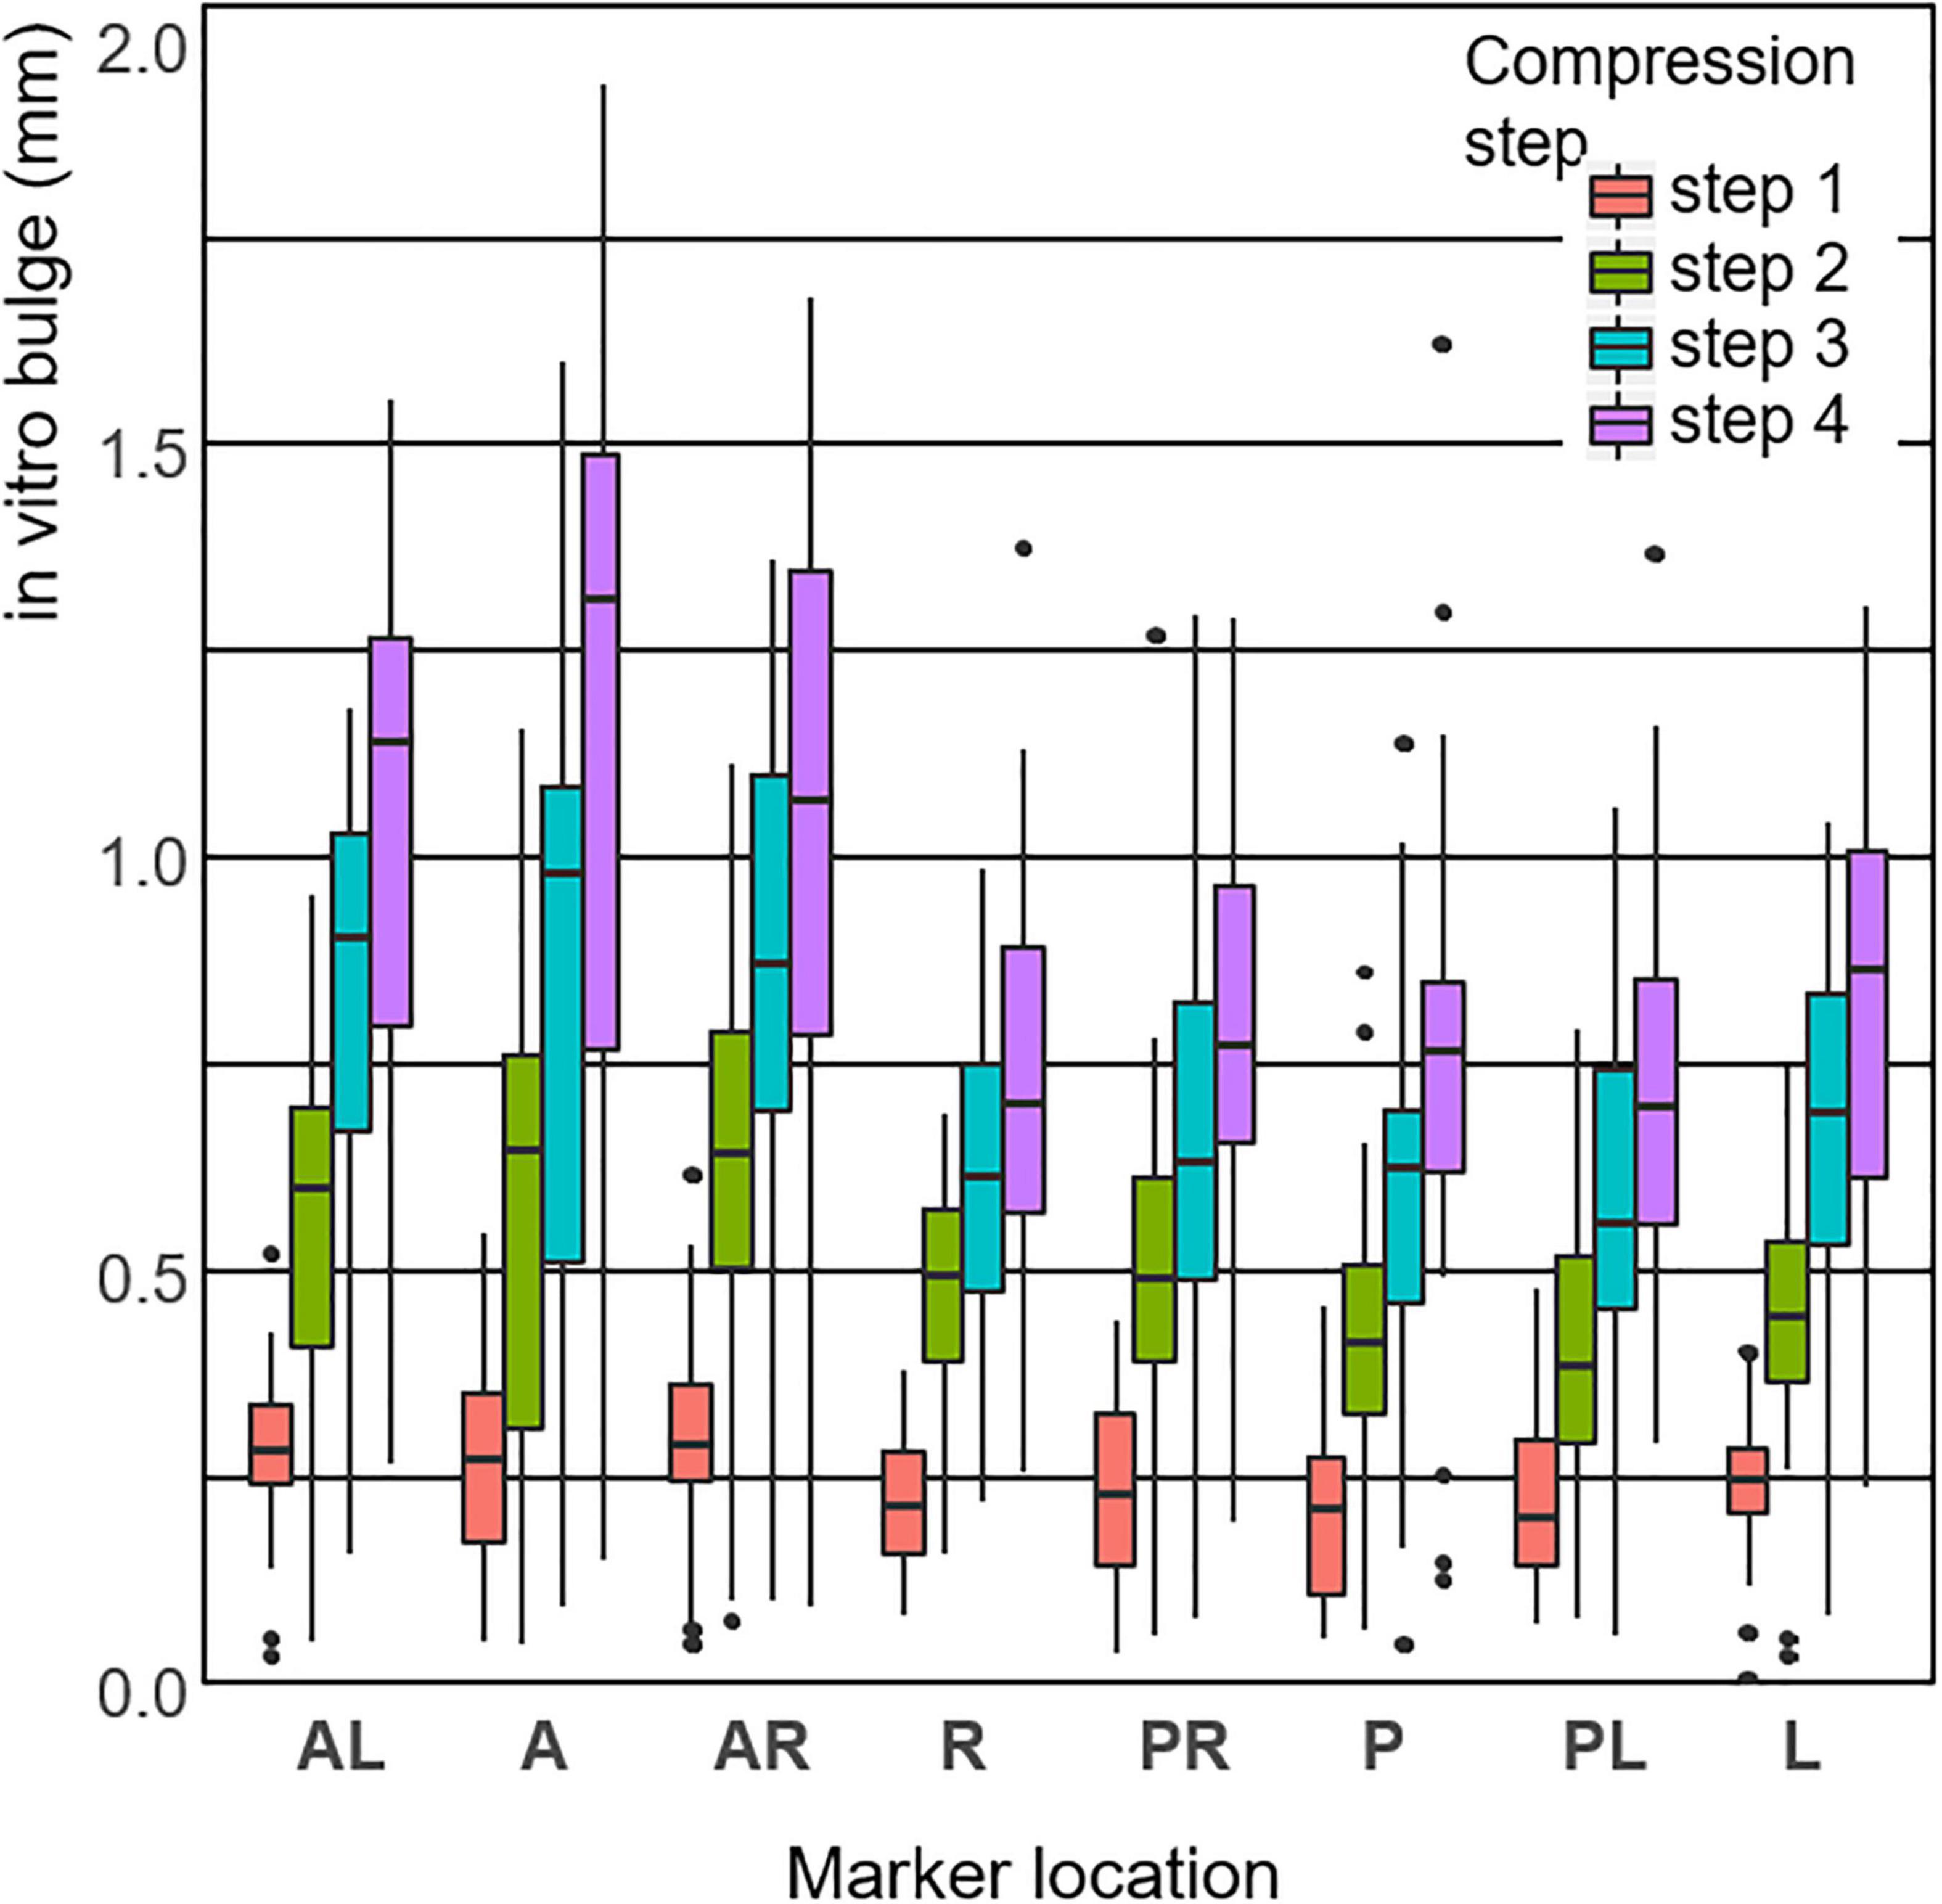
Figure 6. Box-plot distribution of the in vitro surface disc bulge, measured by marker location (defined in Figure 2) and load step.

Table 2. Region pairs at which a significant difference in in vitro bulge is observed (A, anterior; P, posterior; L, left; R, right), comparison made for the bulge normalised with respect to the applied displacement (numbers indicate the compression steps at which the difference occurs).
Calibration of in silico Material Parameters Using in vitro Load-Displacement Data
The calibration of compressibility values performed for each specimen led to a convergence of the RMS difference in the force for five specimens (and all nucleus model types), while for the final one it terminated due to convergence of the values of the parameters. For this specimen, the achieved RMS difference in force for all nucleus model types was between 10 and 15% of the load experimentally measured at displacement step 3.
The optimisation yielded equivalent Poisson’s ratio values for the AF (mean ± std. dev.) of 0.494 ± 0.004 in the std. cyl models, and of 0.438 ± 0.08 for the other two nucleus model types (no significant differences between these two types). Equivalent Poisson’s ratios for the NP were 0.493 ± 0.003 in the std. cyl models, and 0.482 ± 0.01 for the other two nucleus model types.
Following one-to-one calibration, the concordance correlation coefficients for loads at all time steps for all specimens were above 0.988 for all nucleus model types; while a reduction was observed for each of them in the average compressibility models (see Table 3 and Figure 7).
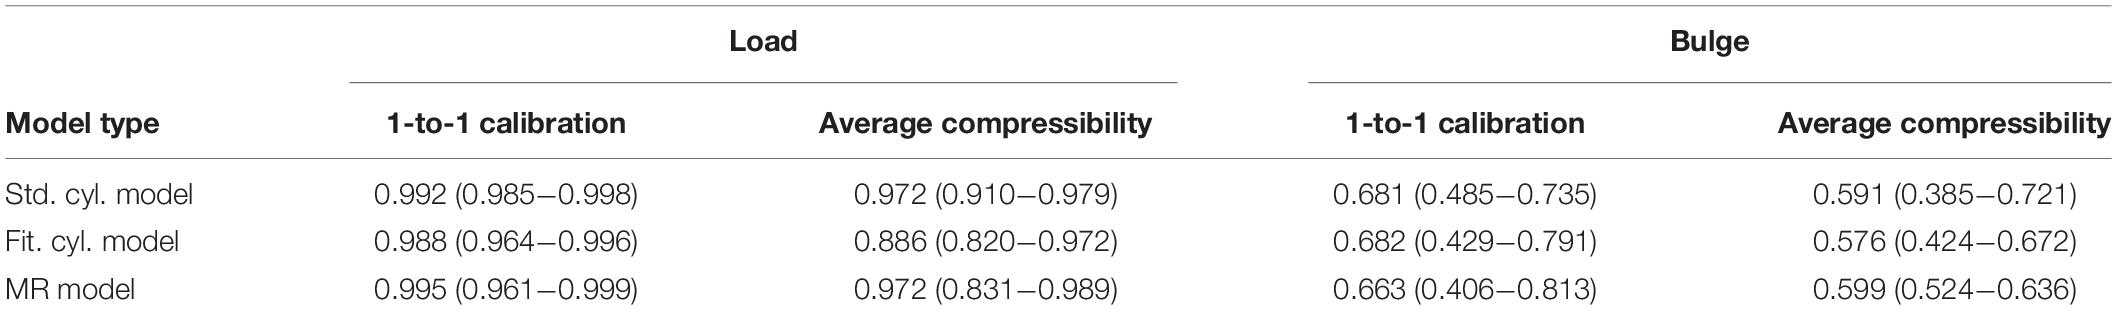
Table 3. Concordance coefficients (CCC with 95% confidence interval in brackets) across all specimens and all displacements steps of in silico load and markers bulge (disregarding markers within the lowest 10 percentile of experimental bulge).
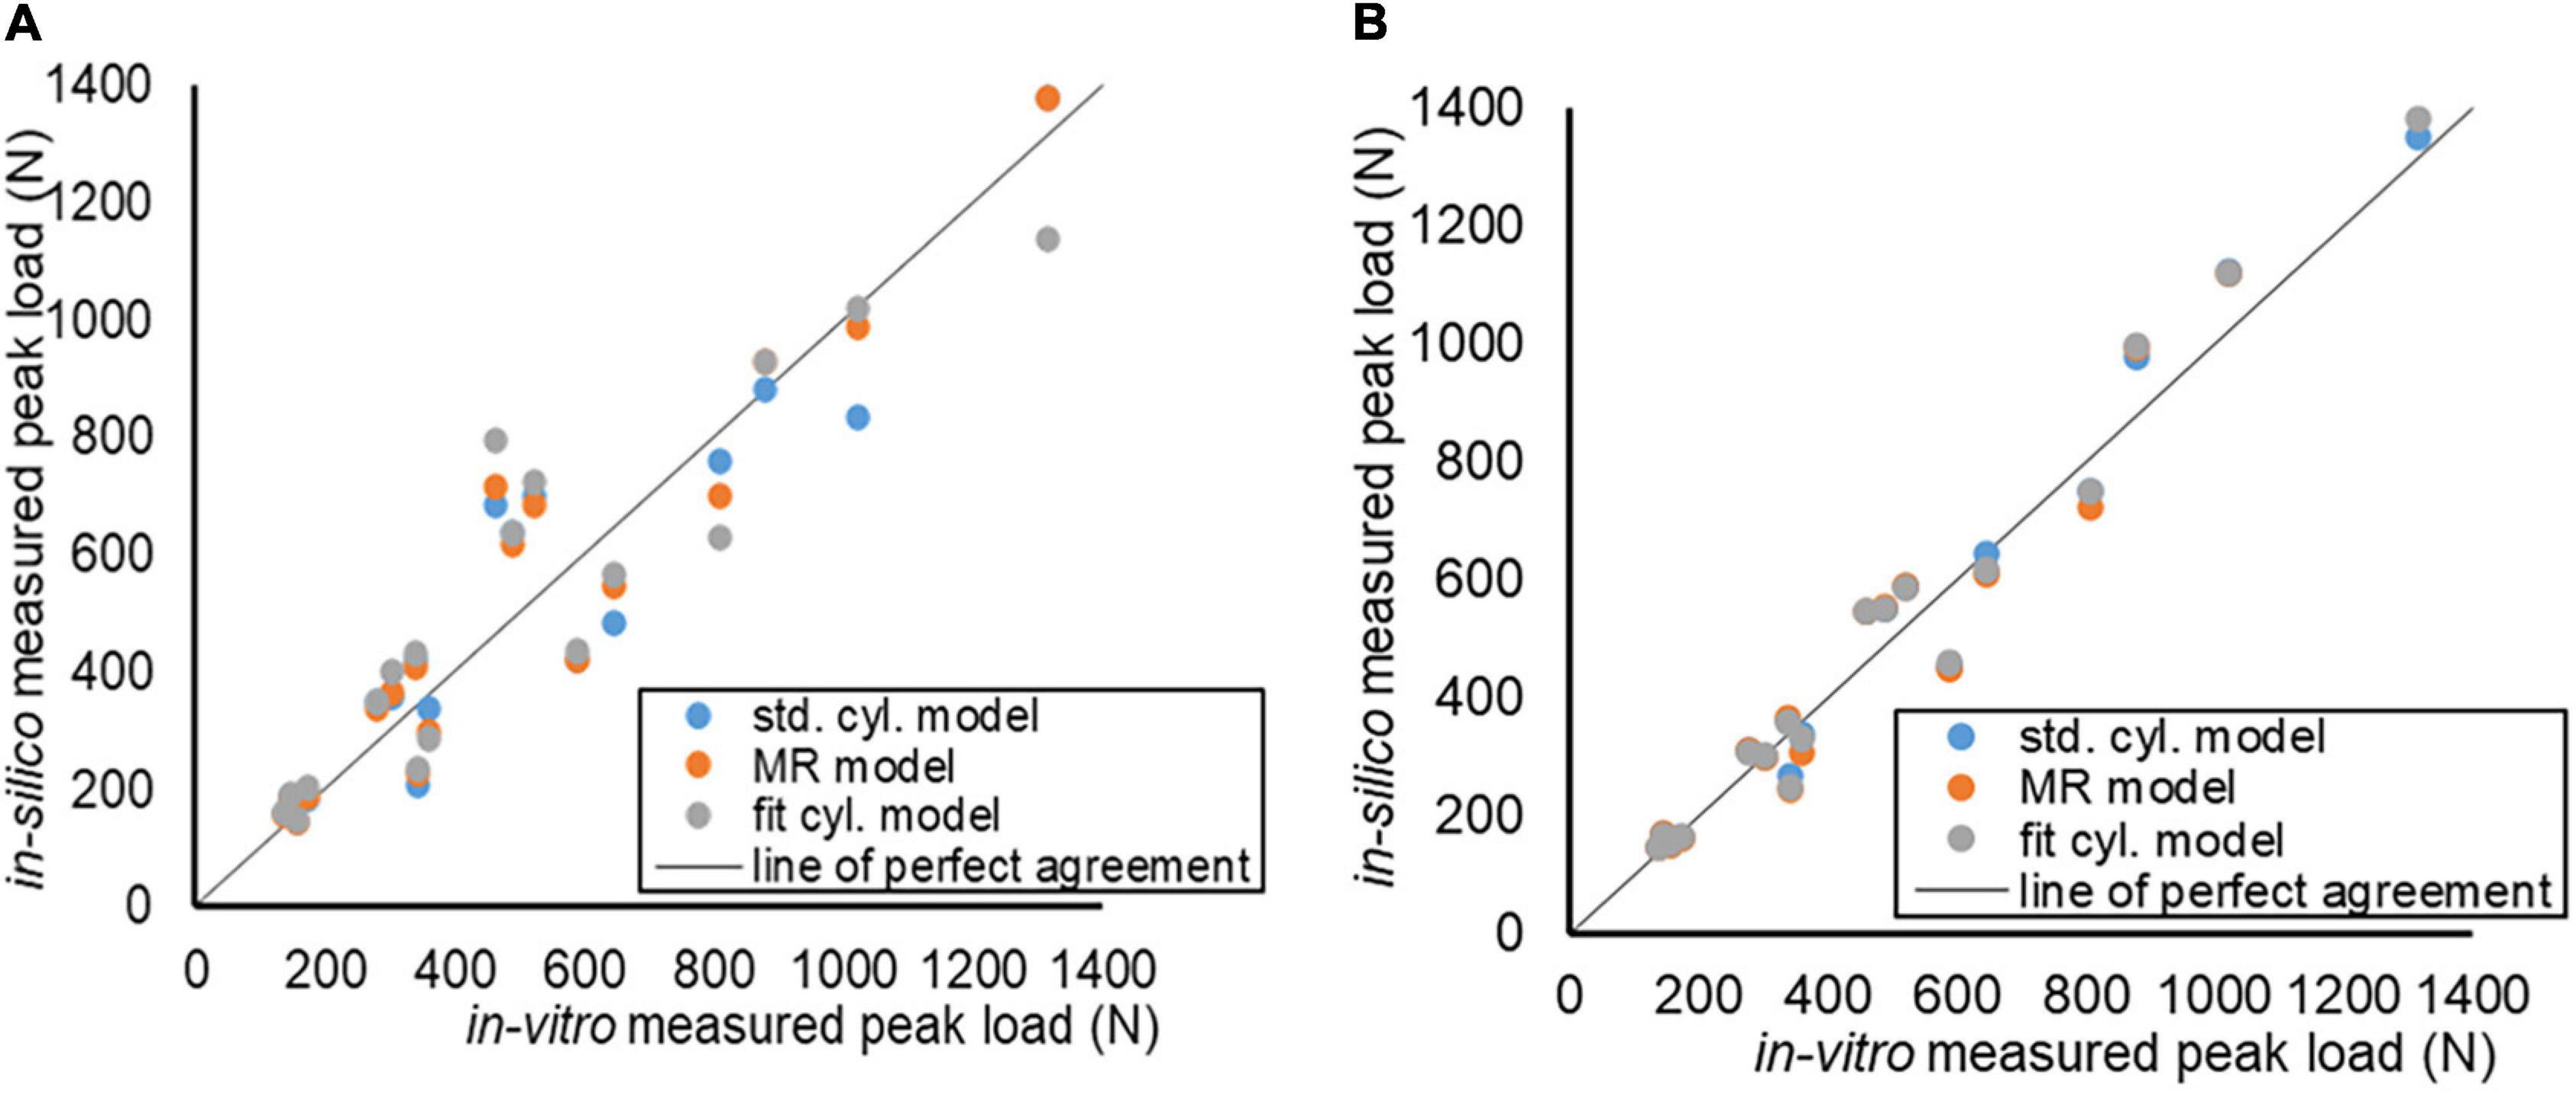
Figure 7. Agreement of the in vitro and in silico load measurements, for each specimen and each model type. (A) Models using 1-to-1 calibration of the compressibility value. (B) Models using the average compressibility value.
Comparison of in vitro and in silico Values of Disc Bulge
No differences were seen between nucleus model types in the ability to model bulge values (Table 3). Across all specimens, all model types and all marker locations, about 36% of bulge data had a difference between in vitro measurements and in silico measurements lower than the image resolution (82 μm). The remaining cases were evenly split between those where the in silico values were smaller than the in vitro values and those where they were higher, as shown in Figure 8 for the 1-to-1 calibration models (similar results are found for the average calibration model, data available at Mengoni and Wilcox, 2019). For all models, no significant differences were observed for the computational bulge values between marker locations, at any of the displacement steps.
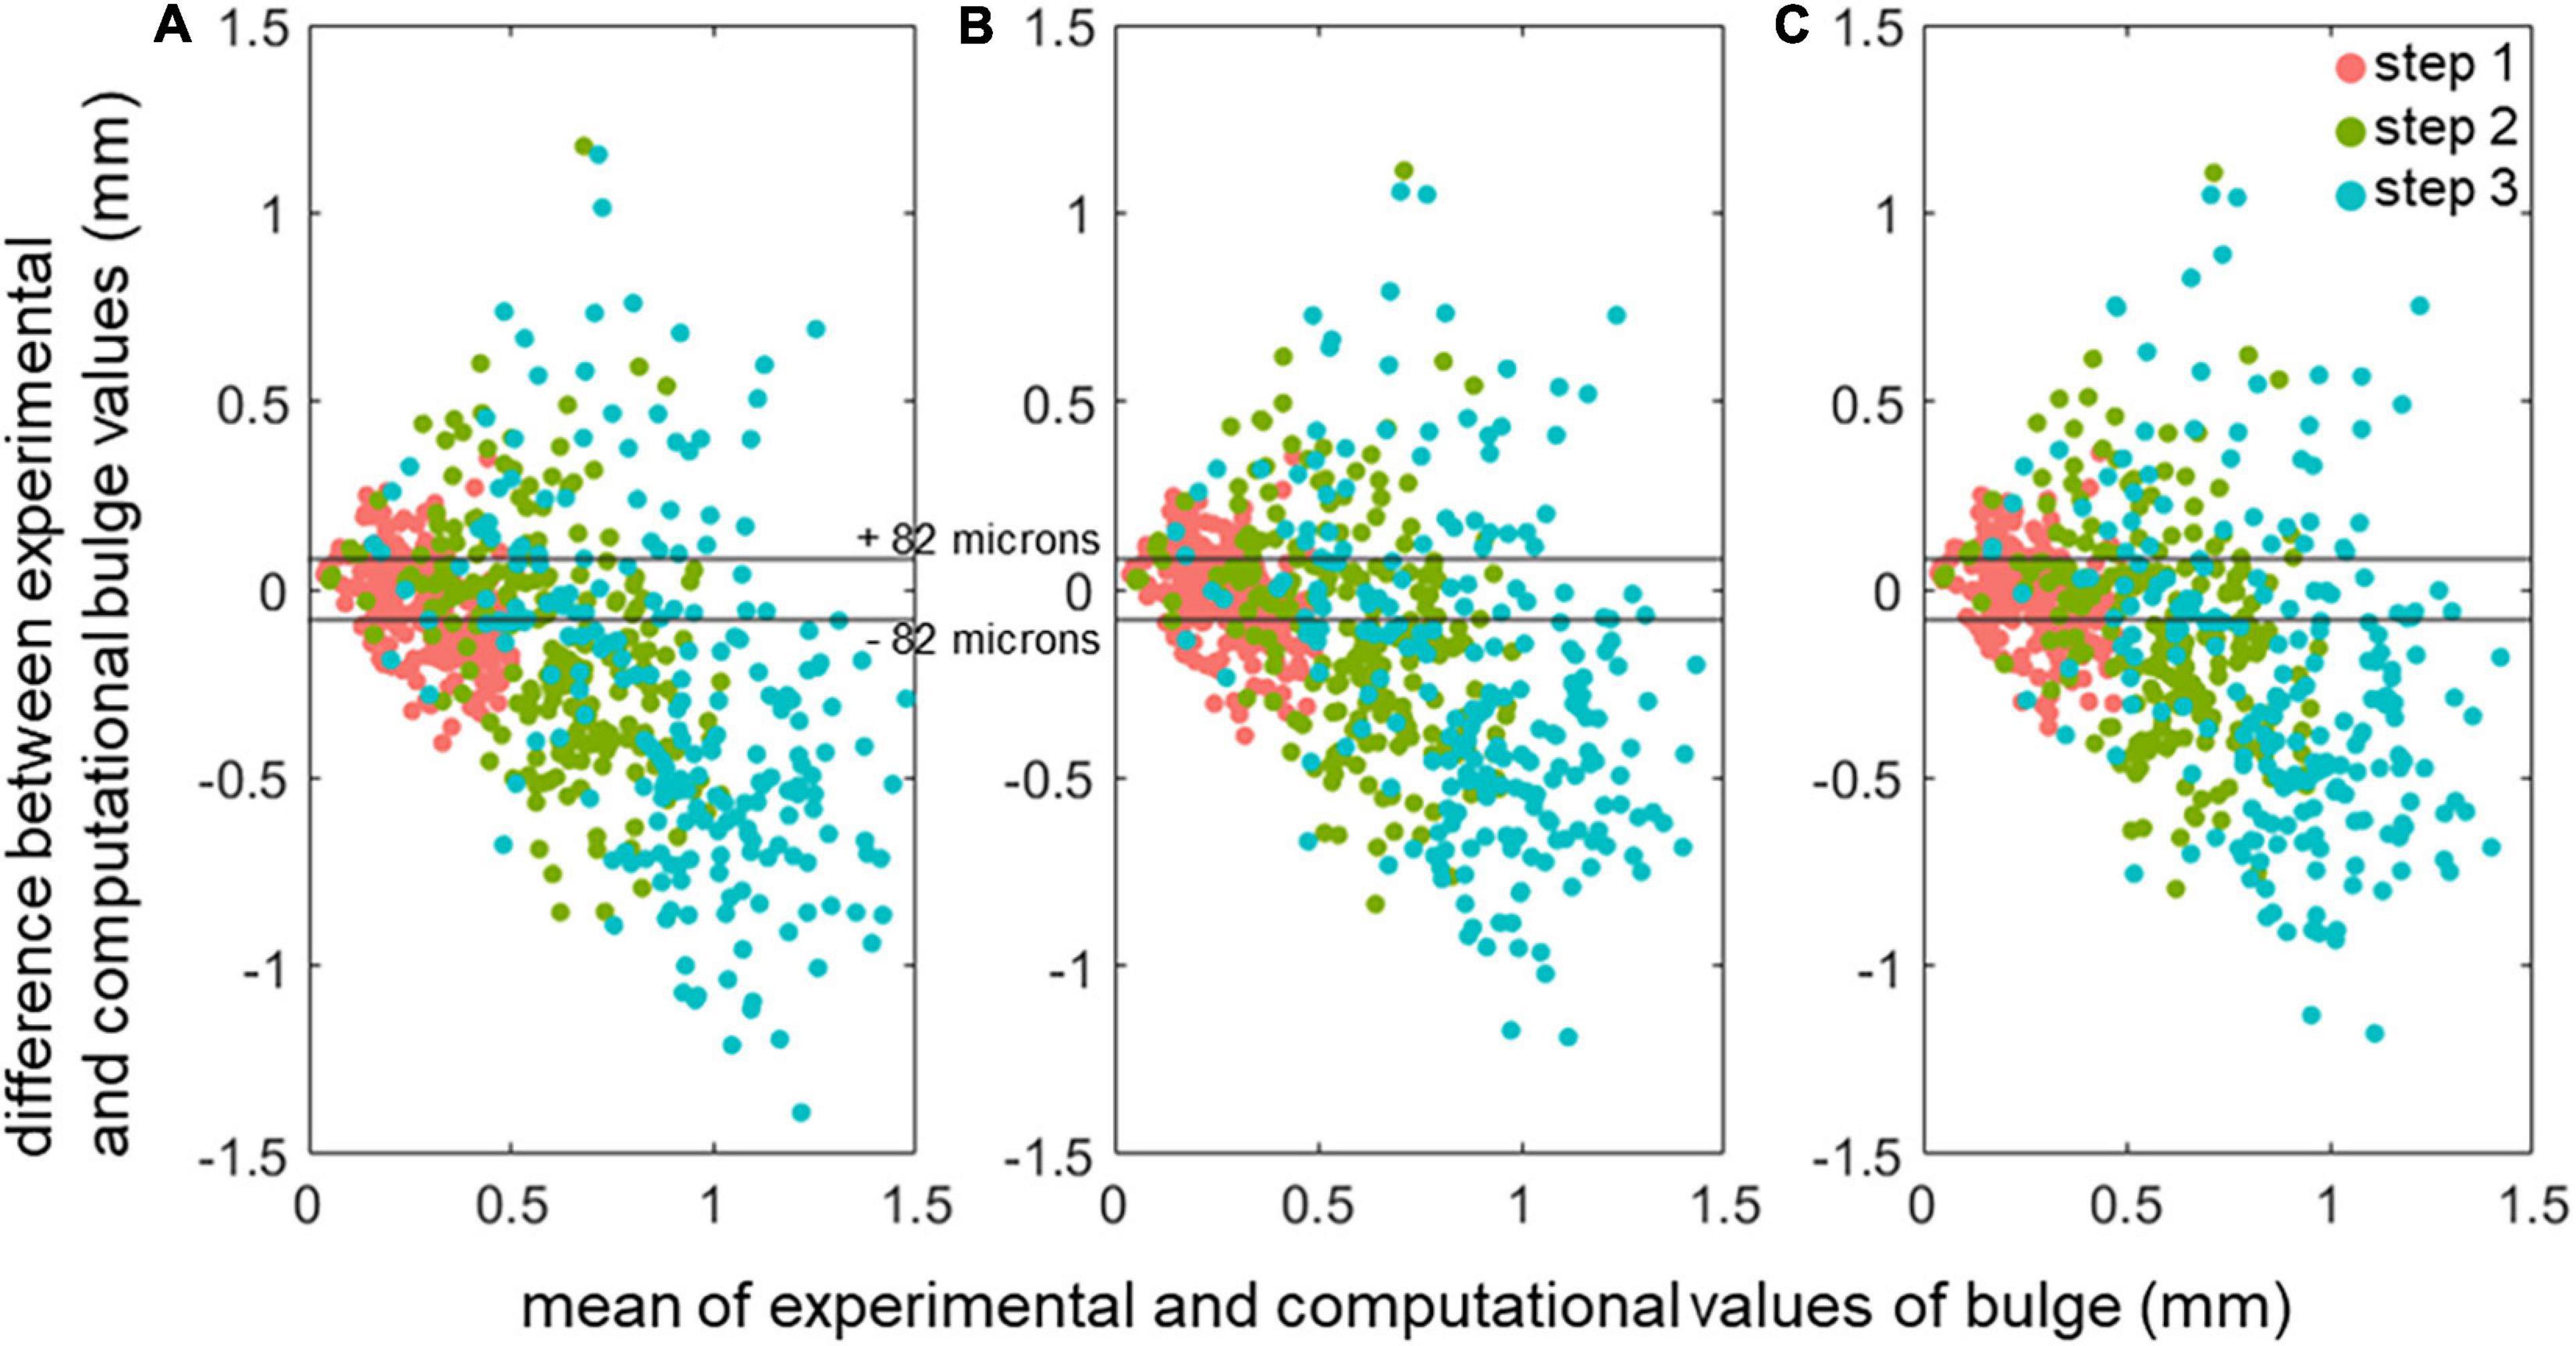
Figure 8. Comparison of the in silico predicted displacements of the disc marker points versus the measured in vitro values, shown as mean-difference plots for the three different model types with the 1-to-1 calibration. (A) std. cyl. models (B) fit. cyl. models (C) MR models. The image resolution band is shown with horizontal lines.
Discussion
The present work successfully developed a methodology to quantify the IVD bulge in vitro, enabling observation of lateral surface displacement of the IVD on CT images under axial load. The pre-loaded CT images and MRI data were used to create specimen-specific image-based FE models of the IVD, and then used to analyse the effect of different approaches to combining geometrical information from MR images with the CT data. While a systematic methodology was developed to replicate the behaviour of the discs just after loading, no clear advantage of using MR geometrical data was seen in this bovine tissue study. The FE models were designed to analyse the variability between samples tested in the lab, the direct-controlled approach used in this study (direct comparison of data measured in vitro with data computed in silico on the same specimen, and controlled loading scenario) provided confidence that the methodology can capture the variation between samples rather than a generic behaviour. However, it was not meant to model clinical scenarios, nor did it indicate validity in other loading scenarios or for different outputs of interest. Key discussion points presented are with respect to the intended context of use and should not be extrapolated to other contexts. In particular, the FE modelling framework presented is not able to replicate any information related to time-dependent behaviour, changing level of hydration, or local interaction between different tissue types.
Experimental Characterisation of IVD Bulge
A number of methods of measuring disc bulge in vitro have been developed previously but have not yet been employed to make direct comparisons with specimen-specific FE models. The use of a high-resolution qCT in this study facilitated the capture of precision 3D morphology and provided the advantage of enabling the assignment of greyscale-dependent material properties to the hard tissues in the FE models. It was shown previously that capturing the bone behaviour in static models of osteodiscs is important to replicate the apparent stiffness of the specimen (Sikora et al., 2018). Although MRI is able to provide more information on the internal structural deformations, the 3D resolution and spatial accuracy would not have been sufficient for this study. Instead, fiducial markers were used on the external disc surface, which enabled a one-to-one comparison with corresponding nodal displacements on the FE model. This approach had the advantage in requiring no additional processing steps or assumptions to be made, meaning that the measurement error was due to the image resolution alone. Combined with an initial CT for greyscale-dependent properties of the bone, similar outcomes could be obtained by using 3D surface imaging rather than CT to compute the displacement of the fiducial markers, reducing the exposure of the tissue to repeated radiation and likely enabling shorter scanning times. Using an imaging method with shorter scanning times would enable measuring the bulge at several time points during relaxation, similarly to Heuer et al., 2007.
Regardless of the measurement method used, there are some limitations to the approach employed because of the time-dependent behaviour of the IVD tissue. In this study, the relaxed tissue was imaged, requiring the specimen to be held for 90 min prior to imaging in each step. The change in bulge during relaxation could not be estimated with the method used. While it has been shown in the canine thoracolumbar spine (Cassidy et al., 1990) that the bulge recovers at low compression levels (5% compression), it is less the case at slightly higher compression (∼15% compression), and there are no experimental data available at the higher compression levels applied in this work.
From the measurements made, the anterior region of the disc was seen to bulge more than the posterior. Similar results were obtained for human tissue under neutral axial compression, with larger radial displacements in the anterior than in the posterior regions on sagittal MRI slices (O’Connell et al., 2011). While this study used healthy bovine discs, the methodology employed could be applied to human discs, for example to examine the effects of different pathologies or herniation risks. In particular, the experimental and imaging framework developed here allows to capture some of the asymmetry in bulge which can also be observed clinically (Fardon et al., 2014). The MR imaging protocol used was optimised for human (cadaveric) spine imaging (Wijayathunga et al., 2019) and as such the framework is directly translatable to cadaveric tissue.
In silico Agreement of in vitro Measurements – Load
In this work, compressibility values used for the finite element models were calibrated to minimise the force difference between the force recorded upon loading and the force required in a static FE model of the IVD. Previous work on similar in vitro and in silico models had shown that compressibility was a major factor influencing stiffness outputs (Mengoni et al., 2017). The converged equivalent Poisson’s ratios in this study were in the same range as found otherwise in the literature for IVD FE models that do not employ a multi-phasic representation of the disc (e.g., Marini and Ferguson, 2014; Adam et al., 2015; Casaroli et al., 2017), with almost incompressible materials. However, there was a significant difference in the outcome for the nucleus compressibility depending on how its volume was modelled: models with a large, standardised, nucleus required the use of a less compressible material model than a smaller sized nucleus, for which the size was based on MR image evaluation. Therefore, when using simple material models of the nucleus, the compressibility value should be chosen consistently with the manner in which the NP geometry is modelled.
The initial force was used for model calibration as it represents a more physiological value than the force recorded after a long relaxation without control of hydration level (on average 10 times lower). The reduction in the experimental force during relaxation is both due to the tissue relaxation itself and the change in hydration. The tissue compression leads to a reduction in water content, due to the fluid leaking out through the disc surface, which reduces the compressibility of the tissue. The exposure to air in itself has been observed to reduce the stiffness (Wilke et al., 1998). While not reported in this work, performing the same calibration for relaxed load values generated equivalent Poisson’s ratios which are not physically relevant (values average of 0.2 for the nucleus, and the annulus requiring an auxetic behaviour; data available at Mengoni and Wilcox, 2019). The bulge values were on the contrary measured experimentally only in a relaxed position. This discrepancy constitutes the main limitation of this study as the methodology does not allow to measure the instantaneous bulge or the change in bulge during relaxation. This method was based on the assumption that the disc bulge does not recover significantly during relaxation, with previous work on canine spine demonstrating reduced bulge recovery with compression levels of 15% and higher (Cassidy et al., 1990). For human tissue, the change in bulge during creep experiments has been observed as being negligeable with respect to most measurement resolution methods (Heuer et al., 2007).
With relatively simple material models for all tissues and testing conditions, the agreement between in silico and in vitro load magnitudes were better than previous studies (Maquer et al., 2015; Mengoni et al., 2017), irrespective of the way the NP geometry was represented and whether 1-to-1 calibration was performed, or average values were used. The main difference in the current work probably is due to the attention and effort taken with regard to the dissection of the soft tissues surrounding the IVD. In the present study, all soft tissues were carefully removed to leave a bare IVD surface only, enabling the outer surface of the disc to be easily and accurately segmented from CT images. Previous studies, where excess soft tissue had been retained, have had to use an artificial method to identify the outer disc surface (Sikora et al., 2018). This had a major effect on the ability to build FE models from micro-CT scans and indicated that being able to reconstruct the overall volume of the IVD is a major factor in being able to model accurately load data in compression. The tissue preparation effort here was well paid off by the improved agreement of the models.
While validation work would be required to know if the average compressibility values can be used on other specimens, the fact that the agreement was substantial both for 1-to-1 calibration and average values increased confidence on the validity of the average values for other specimens. Therefore, it may not be necessary to derive material properties through specimen-specific calibration, providing appropriate average values were already available.
It was found that, for bovine tissues models, using geometry information for the NP derived from MR images did not improve the ability of the models to predict load behaviour; this is likely due to the relatively arbitrary definition of tissue separation, even from MR data. Using MR sequences to define the outer AF boundary, or to give information about material properties, for example from T2 mapping, ρH-weighted or DTI sequences (Reutlinger et al., 2014; Stadelmann et al., 2018; Chetoui et al., 2019), would possibly be better ways to add value from MR data, especially for degenerated discs or when time-dependency behaviour is of interest, for which the level of tissue hydration is important.
In addition, for two of the model types, the agreement between the in silico and in vitro load data did not vary greatly between cases where the material compressibility values were derived for each specimen separately and cases where average values were used. There was only an improvement in using direct calibration of each specimen, as opposed to average values, in the case where the NP was represented as a cylinder centred in the disc and with volume derived from MR data (fit. cyl. models).
In silico Agreement of in vitro Measurements – Bulge
Including geometry information derived from MR images into the modelling methodology, whether only through evaluation of the nucleus volume or also by including its shape, did not produce significant differences in the accuracy of the in silico surface bulge of the IVD under compression. In particular, none of the nucleus model types were able to capture the differences between anterior and posterior bulge. It should be noted that the bovine disc is highly circular and thus that models in this study assumed a circular nucleus (except for the MR-models). This would not translate to the human intervertebral disc, and this conclusion may not apply in clinical scenarios. However, developing modelling methodologies valid for the bovine disc had interest in itself as the bovine spine is often used as a preclinical in vitro model for evaluating disc repairs. This work showed that simple in silico models of such preclinical evaluation are likely accurate enough to be used as complement to in vitro evaluation.
When evaluating the predicted disc bulge using the pointwise comparison of 40 locations on the disc surface, the level of agreement was only slightly improved when using models with a 1-to-1 calibration of compressibility properties versus those assigned an average value, and remained relatively poor for all nucleus geometry types. Accounting for the difference in lamellar strength and fibre orientation in the radial direction of the IVD (Elliott and Setton, 2000; Holzapfel et al., 2005) might enhance the ability to predict bulge. Differentiating the inner and outer annulus, with a core nucleus shape derived from MR and a more elliptical inner annulus, could also be used to the same aim. However, the large scatter seen in the mean-difference plot, without any clear locational trends, suggested these potential model improvements would not fully account for the current disparities. Errors in bulge may also be caused by the in vitro values being computed from images in a relaxed position while the in silico models were calibrated against peak force values.
Relatively simple constitutive models were used in this work and do not account for any fluid-flow effect of the tissues composing the IVD. This approach has shown to be valid when the purpose of the in silico models is to replicate global properties of osteodiscs or functional units, such as apparent stiffness (e.g., Mengoni et al., 2017; Sikora et al., 2018), facet joint contact (e.g., Ayturk and Puttlitz, 2011; Mengoni et al., 2016) or range of motions (e.g., Ayturk and Puttlitz, 2011; Sharabi et al., 2019). The present work showed that this modelling approach has some capacity to replicate more localised values such as disc bulge but the methodology was limited, including by the image acquisition time which required to measure bulge values after relaxation while the modelling interest was at peak load. It should be noted that changes in bulge under constant applied displacement are likely to be low, and only a single time-point was captured for each applied displacement. Therefore, the capacity to assess viscoelastic material models using the approach presented here is somewhat limited. Nevertheless, other material models could be partially assessed using the load relaxation data provided with this paper.
Despite the limitations of the current modelling method for predicting regional disc bulge, the combined in vitro and in silico methods presented in this study did provide an improved route for the evaluation of future modelling approaches, including those incorporating time-dependent material properties.
Conclusion
The experimental arm of this study presented a new methodology for examining 3D IVD bulge under axial load. The methodology allows direct 1-to-1 comparison of disc surface displacement with corresponding FE models and has the potential to be used to examine the effects of tissue degeneration or different modes of loading.
On the computational aspects, this study suggests that, in order to obtain substantial agreement on load magnitude, significant care should be taken on reconstructing the external geometry of the IVD. The results from the different approaches to modelling the NP indicate that the use of an MRI-derived NP boundary does not improve capacity to capture bulge in a bovine model calibrated for load.
Data Availability Statement
The datasets presented in this study can be found in online repositories. The names of the repository/repositories and accession number(s) can be found below: University of Leeds data repository: https://doi.org/10.5518/586.
Ethics Statement
Ethical review and approval was not required for the animal study because this study uses animal tissue obtained from the food chain.
Author Contributions
MM contributed to the design and conception of the work, data acquisition, analysis, and interpretation. FZ-C contributed to the design of the work, data acquisition, and analysis. VW contributed to the design of the work, data acquisition, and interpretation. RW contributed to the design and conception of the work, data analysis, and interpretation. All authors contributed to the drafting and critically reviewing the manuscript.
Funding
This work was funded by the European Research Council under Grant StG-2012-306615, Engineering and Physical Sciences Research Council under grant EP/K020757/1, and National Institute for Health Research (NIHR) Leeds Musculoskeletal Biomedical Research Centre.
Conflict of Interest
The authors declare that the research was conducted in the absence of any commercial or financial relationships that could be construed as a potential conflict of interest.
References
Adam, C., Rouch, P., and Skalli, W. (2015). Inter-lamellar shear resistance confers compressive stiffness in the intervertebral disc: an image-based modelling study on the bovine caudal disc. J. Biomech. 48, 4303–4308. doi: 10.1016/j.jbiomech.2015.10.041
Ayturk, U. M., and Puttlitz, C. M. (2011). Parametric convergence sensitivity and validation of a finite element model of the human lumbar spine. Comput. Methods Biomech. Biomed. Eng. 14, 695–705. doi: 10.1080/10255842.2010.493517
Beckstein, J. C., Sen, S., Schaer, T. P., Vresilovic, E. J., and Elliott, D. M. (2008). Comparison of animal discs used in disc research to human lumbar disc: axial compression mechanics and glycosaminoglycan content. Spine (Phila Pa 1976). 33, E166–E173.
Brinckmann, P., and Grootenboer, H. (1991). Change of disc height, radial disc bulge, and intradiscal pressure from discectomy. an in vitro investigation on human lumbar discs. Spine 16, 641–646. doi: 10.1097/00007632-199106000-00008
Brinckmann, P., and Horst, M. (1985). The influence of vertebral body fracture, intradiscal injection, and partial discectomy on the radial bulge and height of human lumbar discs. Spine 10, 138–145. doi: 10.1097/00007632-198503000-00005
Brinjikji, W., Diehn, F. E., Jarvik, J. G., Carr, C. M., Kallmes, D. F., Murad, M. H., et al. (2015). MRI findings of disc degeneration are more prevalent in adults with low back pain than in asymptomatic controls: a systematic review and meta-analysis. American J. Neuroradiol. 36, 2394–2399. doi: 10.3174/ajnr.a4498
Brummund, M., Brailovski, V., Petit, Y., Facchinello, Y., and Mac-Thiong, J. M. (2017). Impact of spinal rod stiffness on porcine lumbar biomechanics: finite element model validation and parametric study. Proc. Instit. Mech. Eng. Part H J. Eng. Med. 231, 1071–1080. doi: 10.1177/0954411917732596
Casaroli, G., Galbusera, F., Jonas, R., Schlager, B., Wilke, H.-J., and Villa, T. (2017). A novel finite element model of the ovine lumbar intervertebral disc with anisotropic hyperelastic material properties. PLoS One 12:e0177088. doi: 10.1371/journal.pone.0177088
Cassidy, J., Hiltner, A., and Baer, E. (1990). The response of the hierarchical structure of the intervertebral disc to uniaxial compression. J. Mater. Sci. Mater. Med. 1, 69–80. doi: 10.1007/bf00839071
Chan, S. C. W., Gantenbein-Ritter, B., Leung, V. Y. L., Chan, D., Cheung, K. M. C., and Ito, K. (2010). Cryopreserved intervertebral disc with injected bone marrow-derived stromal cells: a feasibility study using organ culture. Spine J. 10, 486–496. doi: 10.1016/j.spinee.2009.12.019
Chetoui, M. A., Boiron, O., Ghiss, M., Dogui, A., and Deplano, V. (2019). Assessment of intervertebral disc degeneration-related properties using finite element models based on ρH-weighted MRI data. Biomech. Model. Mechanobiol. 18, 17–28. doi: 10.1007/s10237-018-1064-1
de Schepper, E. I., Damen, J., van Meurs, J. B., Ginai, A. Z., Popham, M., Hofman, A., et al. (2010). The association between lumbar disc degeneration and low back pain: the influence of age, gender, and individual radiographic features. Spine (Phila Pa 1976) 35, 531–536. doi: 10.1097/brs.0b013e3181aa5b33
Elliott, D. M., and Setton, L. A. (2000). Anisotropic and inhomogeneous tensile behavior of the human anulus fibrosus: experimental measurement and material model predictions. J. Biomech. Eng. 123, 256–263. doi: 10.1115/1.1374202
Fardon, D. F., Williams, A. L., Dohring, E. J., Murtagh, F. R., Gabriel Rothman, S. L., and Sze, G. K. (2014). Lumbar disc nomenclature: version 2.0: Recommendations of the combined task forces of the North American Spine Society, the American Society of Spine Radiology and the American Society of Neuroradiology. Spine J. 14, 2525–2545.
Fewster, K. M., Haider, S., Gooyers, C. E., Callaghan, J., and Wong, A. (2020). A computerised system for measurement of the radial displacement of the intervertebral disc using a laser scanning device. Comput. Methods Biomech. Biomed. Eng. Imaging Vis. 8, 287–293. doi: 10.1080/21681163.2019.1674189
Gasser, T. C., Ogden, R. W., and Holzapfel, G. A. (2006). Hyperelastic modelling of arterial layers with distributed collagen fibre orientations. J. R. Soc. Interface 3, 15–35. doi: 10.1098/rsif.2005.0073
Heuer, F., Schmitt, H., Schmidt, H., Claes, L., and Wilke, H.-J. (2007). Creep associated changes in intervertebral disc bulging obtained with a laser scanning device. Clin. Biomech. 22, 737–744. doi: 10.1016/j.clinbiomech.2007.04.010
Holzapfel, G. A., Schulze-Bauer, C. A. J., Feigl, G., and Regitnig, P. (2005). Single lamellar mechanics of the human lumbar anulus fibrosus. Biomech. Model. Mechanobiol. 3, 125–140. doi: 10.1007/s10237-004-0053-8
Hom, W. W., Tschopp, M., Lin, H. A., Nasser, P., Laudier, D. M., Hecht, A. C., et al. (2019). Composite biomaterial repair strategy to restore biomechanical function and reduce herniation risk in an ex vivo large animal model of intervertebral disc herniation with varying injury severity. PLoS One 14:e0217357. doi: 10.1371/journal.pone.0217357
James, S. L., Abate, D., Abate, K. H., Abay, S. M., Abbafati, C., Abbastabar, H., et al. (2018). Global, regional, and national incidence, prevalence, and years lived with disability for 354 diseases and injuries for 195 countries and territories, 1990–2017: a systematic analysis for the Global Burden of Disease Study 2017. Lancet 392, 1789–1858.
Jones, A. C., and Wilcox, R. K. (2007). Assessment of factors influencing finite element vertebral model predictions. J. Biomech. Eng. 129, 898–903. doi: 10.1115/1.2800791
Jones, A. C., and Wilcox, R. K. (2008). Finite element analysis of the spine: towards a framework of verification, validation and sensitivity analysis. Med. Eng. Phys. 30, 1287–1304. doi: 10.1016/j.medengphy.2008.09.006
Lin, L. I.-K. (1989). A concordance correlation coefficient to evaluate reproducibility. Biometrics 45, 255–268. doi: 10.2307/2532051
Luxmoore, B. (2013). Computational Simulation of the Intervertebral Disc. PhD Thesis. Leeds: University of Leeds.
Maquer, G., Schwiedrzik, J., Huber, G., Morlock, M. M., and Zysset, P. K. (2015). Compressive strength of elderly vertebrae is reduced by disc degeneration and additional flexion. J. Mech. Behav. Biomed. Mater. 42, 54–66. doi: 10.1016/j.jmbbm.2014.10.016
Marini, G., and Ferguson, S. J. (2014). Modelling the influence of heterogeneous annulus material property distribution on intervertebral disk mechanics. Ann. Biomed. Eng. 42, 1760–1772. doi: 10.1007/s10439-014-1025-5
Mengoni, M. (2021). Using inverse finite element analysis to identify spinal tissue behaviour in situ. Elsevier Methods 185, 105–109. doi: 10.1016/j.ymeth.2020.02.004
Mengoni, M., Kayode, O., Sikora, S. N. F., Zapata-Cornelio, F. Y., Gregory, D. E., and Wilcox, R. K. (2017). Annulus fibrosus functional extrafibrillar and fibrous mechanical behaviour: experimental and computational characterisation. R. Soc. Open Sci. 4:170807. doi: 10.1098/rsos.170807
Mengoni, M., Vasiljeva, K., Jones, A. C., Tarsuslugil, S. M., and Wilcox, R. K. (2016). Subject-specific multi-validation of a Finite Element model of ovine cervical functional spinal units. J. Biomech. 49, 259–266. doi: 10.1016/j.jbiomech.2015.12.005
Mengoni, M., and Wilcox, R. K. (2019). Bovine Intervertebral Disc Bulge Characterisation [Dataset]. Leeds: University of Leeds. doi: 10.5518/586
Miles, D. E., Mitchell, E. A., Kapur, N., Beales, P. A., and Wilcox, R. K. (2016). Peptide:glycosaminoglycan hybrid hydrogels as an injectable intervention for spinal disc degeneration. J. Mater. Chem. B 4, 3225–3231. doi: 10.1039/c6tb00121a
O’Connell, G. D., Johannessen, W., Vresilovic, E. J., and Elliott, D. M. (2007). Human internal disc strains in axial compression measured noninvasively using magnetic resonance imaging. Spine (Phila Pa 1976) 32, 2860–2868. doi: 10.1097/brs.0b013e31815b75fb
O’Connell, G. D., Vresilovic, E. J., and Elliott, D. M. (2011). Human intervertebral disc internal strain in compression: the effect of disc region, loading position, and degeneration. J. Orthop. Res. 29, 547–555. doi: 10.1002/jor.21232
Reutlinger, C., Bürki, A., Brandejsky, V., Ebert, L., and Büchler, P. (2014). Specimen specific parameter identification of ovine lumbar intervertebral discs: on the influence of fibre-matrix and fibre-fibre shear interactions. J. Mech. Behav. Biomed. Mater. 30, 279–289. doi: 10.1016/j.jmbbm.2013.11.019
Schmidt, H., Heuer, F., Drumm, J., Klezl, Z., Claes, L., and Wilke, H.-J. (2007). Application of a calibration method provides more realistic results for a finite element model of a lumbar spinal segment. Clin. Biomech. 22, 377–384. doi: 10.1016/j.clinbiomech.2006.11.008
Schmidt, H., Heuer, F., Simon, U., Kettler, A., Rohlmann, A., Claes, L., et al. (2006). Application of a new calibration method for a three-dimensional finite element model of a human lumbar annulus fibrosus. Clin. Biomech. 21, 337–344. doi: 10.1016/j.clinbiomech.2005.12.001
Sharabi, M., Levi-Sasson, A., Wolfson, R., Wade, K. R., Galbusera, F., Benayahu, D., et al. (2019). The mechanical role of the radial fiber network within the annulus fibrosus of the lumbar intervertebral disc: a finite elements study. J. Biomech. Eng. 141:021006.
Showalter, B. L., De Lucca, J. F., Peloquin, J. M., Cortes, D. H., Yoder, J. H., Jacobs, N. T., et al. (2016). Novel human intervertebral disc strain template to quantify regional three-dimensional strains in a population and compare to internal strains predicted by a finite element model. J. Orthop. Res. 34, 1264−1273.
Sikora, S. N. F. (2013). Experimental and Computational Study of the Behaviour of Trabecular Bone-Cement Interfaces. Ph.D. Thesis. Leeds: University of Leeds.
Sikora, S. N. F., Miles, D. E., Tarsuslugil, S. M., Mengoni, M., and Wilcox, R. K. (2018). Examination of an in vitro methodology to evaluate the biomechanical performance of nucleus augmentation in axial compression. Proc. Instit. Mech. Eng. Part H J. Eng. Med. 232, 230–240. doi: 10.1177/0954411917752027
Spera, D., Genovese, K., and Voloshin, A. (2011). Application of stereo−digital image correlation to full−field 3−D deformation measurement of intervertebral disc. Strain 47, e572–e587.
Stadelmann, M. A., Maquer, G., Voumard, B., Grant, A., Hackney, D. B., Vermathen, P., et al. (2018). Integrating MRI-based geometry, composition and fiber architecture in a finite element model of the human intervertebral disc. J. Mech. Behav. Biomed. Mater. 85, 37–42. doi: 10.1016/j.jmbbm.2018.05.005
Tarsuslugil, S. M., O’Hara, R. M., Dunne, N. J., Buchanan, F. J., Orr, J. F., Barton, D. C., et al. (2014). Experimental and computational approach investigating burst fracture augmentation using PMMA and calcium phosphate cements. Ann. Biomed. Eng. 42, 751–762. doi: 10.1007/s10439-013-0959-3
Tavana, S., Clark, J. N., Prior, J., Baxan, N., Masouros, S. D., Newell, N., et al. (2020). Quantifying deformations and strains in human intervertebral discs using Digital Volume Correlation combined with MRI (DVC-MRI). J. Biomech. 102:109604. doi: 10.1016/j.jbiomech.2020.109604
Vadalà, G., Russo, F., Pattappa, G., Peroglio, M., Stadelmann, V. A., Roughley, P., et al. (2015). A nucleotomy model with intact annulus fibrosus to test intervertebral disc regeneration strategies. Tissue Eng. Part C Methods 21, 1117–1124. doi: 10.1089/ten.tec.2015.0086
Wijayathunga, V. N., Tanner, S., Ridgway, J., and Wilcox, R. K. (2019). An in vitro study of the intervertebral disc structure using 3T magnetic resonance imaging. Spine (Phila Pa 1976) 44, 793–800. doi: 10.1097/brs.0000000000002958
Wilke, H. J., Jungkunz, B., Wenger, K., and Claes, L. E. (1998). Spinal segment range of motion as a function of in vitro test conditions: effects of exposure period, accumulated cycles, angular-deformation rate, and moisture condition. Anat. Rec. 251, 15–19. doi: 10.1002/(SICI)1097-0185(199805)251:1<15::AID-AR4>3.0.CO;2-D
Keywords: intervertebral disc, bulge, modelling, reverse engineering, MRI
Citation: Mengoni M, Zapata-Cornelio FY, Wijayathunga VN and Wilcox RK (2021) Experimental and Computational Comparison of Intervertebral Disc Bulge for Specimen-Specific Model Evaluation Based on Imaging. Front. Bioeng. Biotechnol. 9:661469. doi: 10.3389/fbioe.2021.661469
Received: 30 January 2021; Accepted: 27 April 2021;
Published: 28 May 2021.
Edited by:
Hendrik Schmidt, Charité – Medical University of Berlin, GermanyReviewed by:
Alessandro Borghi, University College London, United KingdomAndré P. G. Castro, Universidade de Lisboa, Portugal
Copyright © 2021 Mengoni, Zapata-Cornelio, Wijayathunga and Wilcox. This is an open-access article distributed under the terms of the Creative Commons Attribution License (CC BY). The use, distribution or reproduction in other forums is permitted, provided the original author(s) and the copyright owner(s) are credited and that the original publication in this journal is cited, in accordance with accepted academic practice. No use, distribution or reproduction is permitted which does not comply with these terms.
*Correspondence: Marlène Mengoni, m.mengoni@leeds.ac.uk