Individual Brain Metabolic Connectome Indicator Based on Jensen-Shannon Divergence Similarity Estimation Predicts Seizure Outcomes of Temporal Lobe Epilepsy
 Zehua Zhu
 Zhimin Zhang
 Xin Gao
 Li Feng
 Dengming Chen
 Zhiquan Yang
 Shuo Hu
- 1Department of Nuclear Medicine, XiangYa Hospital, Changsha, China
- 2Department of Blood Transfusion, XiangYa Hospital, Changsha, China
- 3Shanghai Universal Medical Imaging Diagnostic Center, Shanghai, China
- 4Department of Neurology, Xiangya Hospital, Central South University, Changsha, China
- 5Department of Neurosurgery, Xiangya Hospital, Central South University, Changsha, China
- 6Key Laboratory of Biological Nanotechnology of National Health Commission, Xiangya Hospital, Central South University, Changsha, China
Objective: We aimed to use an individual metabolic connectome method, the Jensen-Shannon Divergence Similarity Estimation (JSSE), to characterize the aberrant connectivity patterns and topological alterations of the individual-level brain metabolic connectome and predict the long-term surgical outcomes in temporal lobe epilepsy (TLE).
Methods: A total of 128 patients with TLE (63 females, 65 males; 25.07 ± 12.01 years) who underwent Positron emission tomography (PET) with 18F-fluorodeoxyglucose (FDG) imaging were enrolled. Patients were classified either as experiencing seizure recurrence (SZR) or seizure free (SZF) at least 1 year after surgery. Each individual’s metabolic brain network was ascertained using the proposed JSSE method. We compared the similarity and difference in the JSSE network and its topological measurements between the two groups. The two groups were then classified by combining the information from connection and topological metrics, which was conducted by the multiple kernel support vector machine. The validation was performed using the nested leave-one-out cross-validation strategy to confirm the performance of the methods.
Results: With a median follow-up of 33 months, 50% of patients achieved SZF. No relevant differences in clinical features were found between the two groups except age at onset. The proposed JSSE method showed marked degree reductions in IFGoperc.R, ROL. R, IPL. R, and SMG. R; and betweenness reductions in ORBsup.R and IOG. R; meanwhile, it found increases in the degree analysis of CAL. L and PCL. L, and in the betweenness analysis of PreCG.R, IOG. R, PoCG.R, PCL. L and PCL.R. Exploring consensus significant metabolic connections, we observed that the most involved metabolic motor networks were the INS-TPOmid.L, MTG. R-SMG. R, and MTG. R-IPL.R pathways between the two groups, and yielded another detailed individual pathological connectivity in the PHG. R-CAU.L, PHG. R-HIP.L, TPOmid.L-LING.R, TPOmid.L-DCG.R, MOG. R-MTG.R, MOG. R-ANG.R, and IPL. R-IFGoperc.L pathways. These aberrant functional network measures exhibited ideal classification performance in predicting SZF individuals from SZR ones at a sensitivity of 75.00%, a specificity of 92.79%, and an accuracy of 83.59%.
Conclusion: The JSSE method indicator can identify abnormal brain networks in predicting an individual’s long-term surgical outcome of TLE, thus potentially constituting a clinically applicable imaging biomarker. The results highlight the biological meaning of the estimated individual brain metabolic connectome.
Introduction
In most patients with refractory temporal lobe epilepsy (TLE), surgery has proven to be an effective treatment (Tellez-Zenteno et al., 2005). The goal of epilepsy surgery is to render the patient seizure free. However, not every patient with TLE can achieve this outcome postoperatively, as shown by meta-analysis where the median proportion of long-term seizure-free patients was around 60% (Engel et al., 2003a; Tellez-Zenteno et al., 2005). Patients who continued to experience seizures after surgery were directly associated with an even lower quality of life (Schmidt et al., 2004). Given the state of existing research, it is difficult to find practicable markers that can effectively predict surgical outcomes. Therefore, determining the potential characteristics of the different outcomes of TLE and identifying biological indicators for prediction remain critical needs in the management of each patient (Harroud et al., 2012; Jehi et al., 2015b; Giulioni et al., 2016; West et al., 2019).
Research results from multiple fields (neurobiology, neuroimaging, electrophysiology) have collectively shown that epilepsy is a neural network disease, and its abnormal performance extends greatly outside the original location of the epileptogenic zone, which affects the prognosis of treatment (Gleichgerrcht et al., 2015). Notably, several brain network-based machine learning methods have been proposed for epilepsy analysis or other neurological diseases. These have achieved impressive results (Zhang et al., 2016; Li et al., 2019a; Li et al., 2020b), and are routinely used to aid decision making in epilepsy surgery and other specialties (Cahill et al., 2019; Wang et al., 2019; Shim et al., 2020). A magnetic resonance imaging (MRI) study which used deep learning applied to the whole-brain connectome to determine seizure control after epilepsy surgery attained a positive predictive value (PPV; seizure-freedom) of 88% (Gleichgerrcht et al., 2018). Taking advantage of newer in vivo neuroimaging techniques capable of revealing whole-brain metabolic abnormalities by means of positron emission tomography (PET) with 18F-fluorodeoxyglucose (FDG), our group demonstrated that extratemporal metabolic profiles could explain seizure failure after surgery for TLE patients (Tang et al., 2020). Some FDG-PET studies detected multi-scale community structure with different normalization techniques for exhibiting inter-subject FDG-PET brain networks (Sperry et al., 2018). Other studies implemented combined graph theory for measuring aberrant topological patterns in mesial TLE (Wang et al., 2019). Although successful in revealing network abnormalities in clinical groups, these group-level metabolic network analyses sacrifice critical individual-level information. In contrast to earlier work on group-based metabolic patterns, brain network analysis based on graph theory could offer an individualized assessment of metabolic patterns predictive of clinical prognosis (Stam, 2014). The challenge is that aberrant connectivity is variable across individuals, with different patients exhibiting different foci of abnormalities in limbic and extralimbic networks (Gleichgerrcht and Bonilha, 2017). Thus, mapping the brain network in the context of epilepsy could be improved by statistical approaches capable of isolating abnormal individualized patterns in complex data sets.
Inspired by MR-based structural studies using the Kullback-Leibler divergence similarity estimation (KLSE) and the Jensen-Shannon divergence similarity estimation (JSSE) (Tijms et al., 2012b; Kong et al., 2014; Wang et al., 2016b; Li et al., 2021), we analyzed patients with unilateral TLE who had undergone identical surgical resections, and long-term seizure outcomes were analyzed. We opted to apply the JSSE to develop a new analytic methodology for individual-level metabolic brain network construction in FDG-PET imaging and to further provide an ensemble method in predicting the seizure outcomes of TLE patients.
Materials and Methods
Participants
We retrospectively studied 128 consecutive patients with a diagnosis of refractory unilateral TLE based on the International League Against Epilepsy (ILAE) criteria (Berg et al., 2010). Comprehensive clinical assessment was performed, including neurological examination, prolonged video electroencephalography (EEG) monitoring, and 3T MRI to confirm either normal MRI or unilateral hippocampal atrophy concordant with the side of seizure onset. Each patient was surgically treated by identical anteromedial temporal resection (AMTR) without extratemporal resections as described by Spencer et al. (1984). All patients underwent FDG-PET brain imaging before surgery. Pathology was assessed from postoperative pathology reports. The determination of postsurgical outcome was based on in-person interviews and patient assessment during clinic follow-up. Patients without 1-year follow-up were excluded from analysis.
Outcome assessments were performed 3 and 12 months after surgery and at yearly intervals thereafter. All patients were interviewed in detail for seizure recurrence, if any, and date of recurrence. Surgical outcomes were classified based on the Engel surgical outcome scale as either seizure free (SZF; Engel class I) or seizure recurrence (SZR; Engel class II through IV) (Engel et al., 2003a; Engel et al., 2003b). Detailed clinical information of the participants can be found in Table 1.
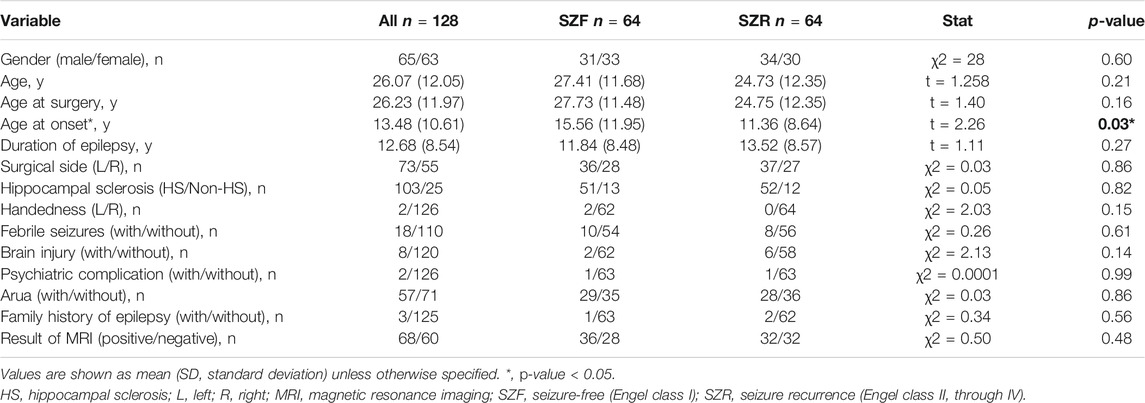
TABLE 1. Patient clinical characteristics and surgical outcomes.
All participants provided written informed consent following the Declaration of Helsinki. All aspects of the study were approved by the Studies Institutional Review Board Xiangya Hospital, Central South University.
FDG-PET Image Acquisition and Processing
FDG-PET was acquired using a Discovery Elite PET/CT scanner (GE Healthcare, Chicago, IL, United States) prior to surgical resection. Images were acquired in 3 dimensions over a 60-min time period, following the scanning protocol described by Tang et al. (2018). Images were reconstructed with an ordered subset expectation maximization algorithm with 6 iterations and 6 subset methods. Individual FDG-PET image volumes were spatially normalized into standard stereotactic Montreal Neurological Institute (MNI) space with linear and nonlinear 3D transformations using statistical parametric mapping software (SPM, Wellcome Department of Cognitive Neurology, London, United Kingdom) on MATLAB (MathWorks, Natick, MA, United States). To facilitate comparison across all participants, the intensity of images was globally normalized. After that, the automated anatomical labeling (AAL) (Tzourio-Mazoyer et al., 2002) atlas was applied to segment the cerebral cortex into 90 regions (45 for each hemisphere without the cerebellum).
Individual JSSE Metabolic Network Construction
The distribution-divergence–based method has been successfully implemented for individual morphological brain network construction (Tijms et al., 2012a; Kong et al., 2014; Wang et al., 2016a). However, thus far, only a few studies have constructed individual metabolic networks from FDG-PET imaging. We assumed that the FDG-PET signal across brain regions indicates metabolic connections subserving interregional information transfer (Wang et al., 2020). A relatively high resting signal-to-noise FDG-PET signal in a region of interest (ROI) reflects the relative glucose metabolism rate. Thus, this putative relationship offers a plausible approach to characterizing interneuronal information transfer. It is worth noting that most of the existing works have constructed the network using the Kullback-Leibler (KL) divergence (Van Erven and Harremos, 2014):
where
where
Computation of Graph Metrics
We aimed to investigate the altered reconfiguration pattern of the individual brain metabolic connectome for TLE. Based on binary undirected matrices, we systematically analyzed the functional brain network’s global and local properties with the Graph Theoretical Network Analysis Toolbox. Specifically, the global metrics included clustering coefficient (
Feature Combination and Predicting TLE Outcomes
To accurately differentiate SZF individuals from SZR ones and to develop predictions, we combined information from the connection weights, nodal graph metrics, and global graph metrics. More specifically, we attempted to adopt the kernel combination trick for information combination and used the multi-kernel support vector machine (MK-SVM) for predicting TLE surgical outcomes. The MK-SVM method in this study was conducted as follows. Suppose that there are
where
where
To illustrate the performance gain of the information combination from different perspectives, such as connection and metrics, we employed the most commonly used and simplest linear kernel, as
Feature Selection and Validation
To confirm the effectiveness of predicting an individual’s long-term surgical outcomes of TLE, we conducted the nested leave-one-out cross-validation (LOOCV) strategy to verify the performance of the methods due to the small sample size (Li et al., 2020a). in which LOOCV is almost the most strict validation protocol in the machine learning field (Arlot and Celisse, 2010). Specifically, in LOOCV, only one participant was left out for testing while the others were used to train the models and obtain the optimal parameters. For the choice of optimal parameters, an inner LOOCV was conducted on the training data using a grid-search strategy. The range of the hyperparameter
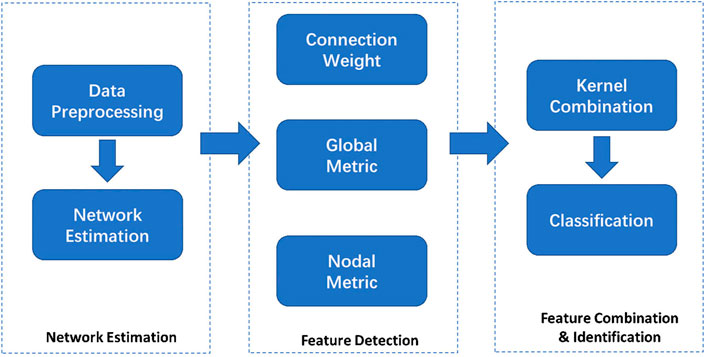
FIGURE 1. Data-processing and classification procedures employed in our study. Network Estimation: Positron emission tomography (PET) with 18F-fluorodeoxyglucose (FDG) imaging of patients were enrolled. Individual FDG-PET image volumes were spatially normalized into standard stereotactic Montreal Neurological Institute (MNI) space with linear and nonlinear 3D transformations using statistical parametric mapping software on MATLAB. Individual’s metabolic brain network was ascertained using the proposed Jensen-Shannon divergence similarity estimation (JSSE) method. Feature Detection: Based on binary undirected matrices, we systematically analyzed the functional brain network’s global and local properties with the Graph Theoretical Network Analysis Toolbox. Also, the nodal properties included degree centrality, nodal efficiency, betweenness centrality, shortest path length, and nodal clustering coefficient. We then took the sum of 49 values for each node as input for the attributes to train the classifier, so there was only one value corresponding to one graph metric. Feature Combination and Identification: We compared the similarity and difference in the JSSE network and its topological measurements between the seizure recurrence and seizure free groups. The two groups were then classified by combining the information from connection and topological metrics, which was conducted by the multiple kernel support vector machine. The validation was performed using the nested leave-one-out cross-validation strategy to confirm the performance of the methods.
Statistical Analysis
All data were analyzed using SPSS software version 18.0 (IBM Corporation, Armonk, NY, United States). Numerical data are presented as mean with SD. Student’s t test and Pearson’s χ2 test were used for between-group comparisons of continuous variables, as appropriate. To evaluate the classification performance of the information combination methods and the proposed JSSE, we conducted several quantitative measurements, including those determining the accuracy, sensitivity, and specificity. The receiver operating characteristic (ROC) curve and AUC of these methods were also provided. Differences between various AUCs were compared by using a Delong test (Delong et al., 1988). Statistical significance was defined as a p value <0.05.
Results
Clinical Data
A total of 128 refractory TLE patients (63 females, 65 males; 25.07 ± 12.01 years old; 73 left-TLE, 55 right-TLE) met the inclusion criteria of isolated AMTR with one or more years of follow-up. The median follow-up time was 33 months with a maximum follow-up time of 7 years. The clinical characteristics of the patients are shown in (Table 1). Briefly, 64 of the 128 patients (50%) obtained an Engel class I outcome. There was no significant difference between right TLE (49%) and left TLE (51%) (p > 0.05). Regardless of whether there was hippocampal sclerosis (HS) in the postoperative histopathology or MRI, there was no difference in the surgical outcomes (both p values > 0.05). According to our statistical estimates, patients with an early age of onset were found to be more likely to relapse (p = 0.03).
Global and Local Graph Metrics of the Metabolic Brain Connectome
The global graph metrics of patients are shown in (Table 2).
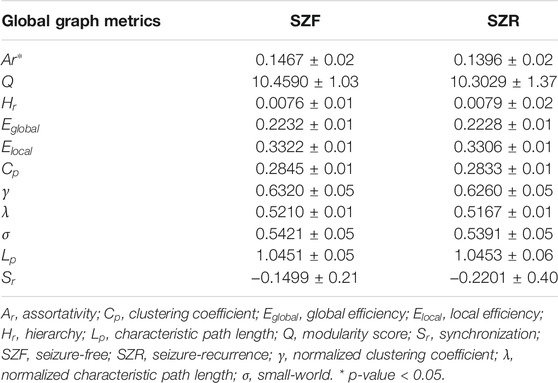
TABLE 2. Global and local graph metrics of the metabolic brain connectome.
Degree Analysis of the Metabolic Brain Connectome
To investigate the degree distribution of the estimated metabolic brain connectome, we analyzed each node’s mean degree in the SZF and SZR groups. The degree in the IFGoperc.R, ROL. R, IPL. R, and SMG. R tended to be decreased in the SZR group, while the degree in the CAL. L and PCL. L tended to be increased. The 6 significant nodes with the average degree in the SZR and SZF groups are listed in (Table 3).
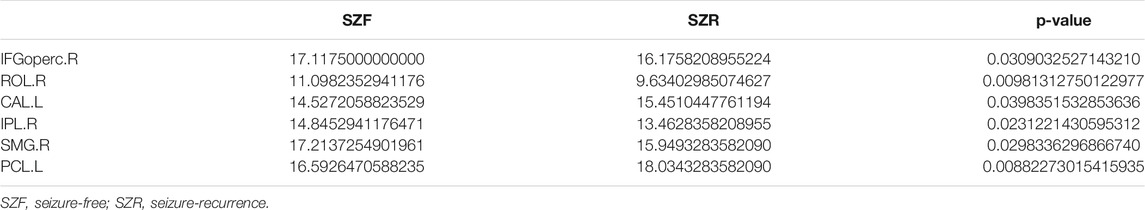
TABLE 3. The 6 significant nodes with the average degree in the SZR and SZF groups.
The nodes with a degree of SD higher than the mean of the degree of all nodes were identified as degree hub nodes (Rubinov and Sporns, 2010). Here, according to the definition of “hubs,” we identified hub nodes in the SZF and SZR groups separately (Table 4). Comparison of the hub nodes between the two groups in the same modal network clearly revealed that most of them overlapped. Also, it is worth noting that several specific hub nodes corresponded to different groups.
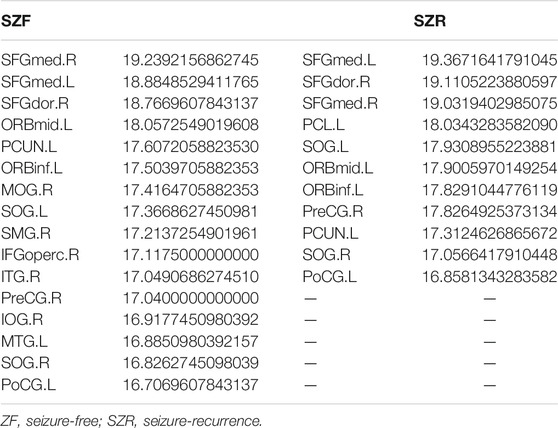
TABLE 4. Degree hubs in the SZR and SZF groups.
Betweenness Analysis of the Metabolic Brain Connectome
We also investigated the betweenness distribution of the estimated metabolic brain connectome of the SZR and SZF groups. The results showed that betweenness in ORBsup.R and IOG. R tended to be decreased in the SZR group, while betweenness in PreCG.R, IOG. R, PoCG.R, PCL. L, and PCL. R tended to be increased. The 6 significant nodes with the average betweenness in the SZR and SZF groups are listed in (Table 5). We also identified betweenness hub nodes of SZR patients and SZF patients (Table 6). Comparison of the betweenness hub nodes between the SZR group and SZF group in the same modal network revealed that several specific hub nodes corresponded to different groups.
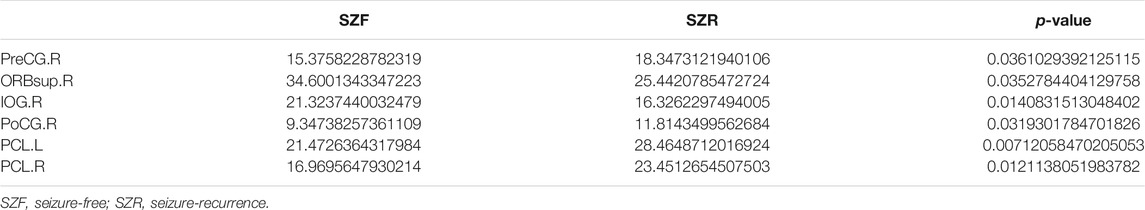
TABLE 5. The 6 significant nodes with the average betweenness in the SZR and SZF groups.
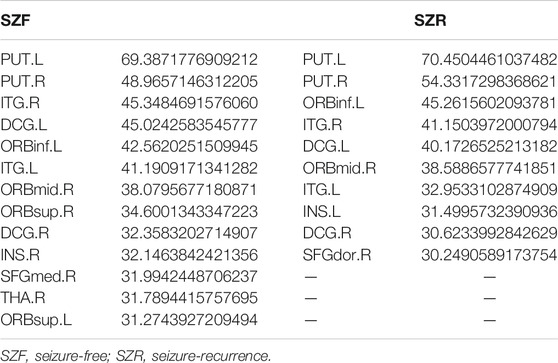
TABLE 6. Betweenness hubs in the SZR and SZF groups.
Classification Results
To evaluate the classification performance of the information combination methods and the proposed JSSE, we also reported the single kernel SVM classification result based on the connection weights (C), global metrics (G), and nodal metrics (N). The results are shown in (Table 7). The ROC curve result is shown in (Figure 2), indicating that the performances of information combination results are superior to those of single kernel methods, thus supporting the rationality of the proposed method. Additionally, the C + G + N method achieved the outperforming of results in all four measurements, demonstrating its effectiveness. Furthermore, according to DeLong’s nonparametric statistical significance test (Zhang et al., 2016), the proposed C + G + N methods were found to be significantly superior to Connection, Global, and Nodal under 95% confidence intervals with p values equal to 2
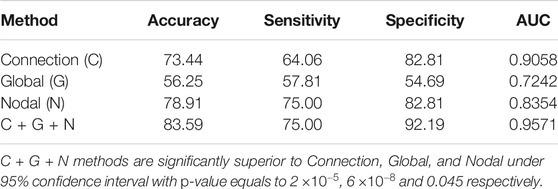
TABLE 7. Classification performance corresponding to different methods.
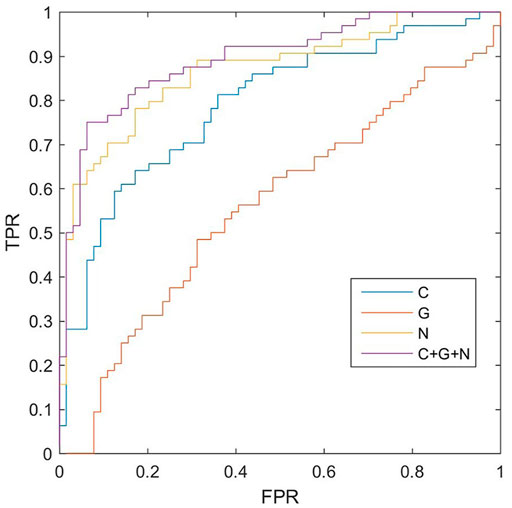
FIGURE 2. The receiver operating characteristic (ROC) curve results of different methods. The ROC curve result indicate that the performances of information combination results are superior to those of single kernel methods. Additionally, the connection weights (C) + global metrics (G) + nodal metrics (N) method achieved the outperforming of results in all four measurements, demonstrating its effectiveness. Furthermore, according to DeLong’s nonparametric statistical significance test, the proposed C + G + N method (purple line) was found to be significantly superior to C, G, and N under 95% confidence intervals with p values equal to 2 × 10⁻⁵, 6 × 10⁻⁸, and 0.045, respectively. These aberrant functional network measures exhibited ideal classification performance in predicting seizure free individuals from seizure recurrence ones at a sensitivity of 75.00%, a specificity of 92.79%, and an accuracy of 83.59%.
Consensus of Significant Metabolic Connections
As mentioned above, we selected the consensus connections with a p value <0.05 in each loop. A total of 45 consensus connections are shown in (Figure 3). In exploring the consensus significant metabolic connections, we observed that the most involved metabolic motor networks were the INS-TPOmid.L, MTG. R-SMG. R, and MTG. R-IPL.R pathways between the two groups, which was consistent with the results of the typical group-level method, and yielded further detailed individual pathological connectivity in the PHG. R-CAU.L, PHG. R-HIP.L, TPOmid.L-LING.R, TPOmid.L-DCG.R, MOG. R-MTG.R, MOG. R-ANG.R, and IPL. R-IFGoperc.L pathways.
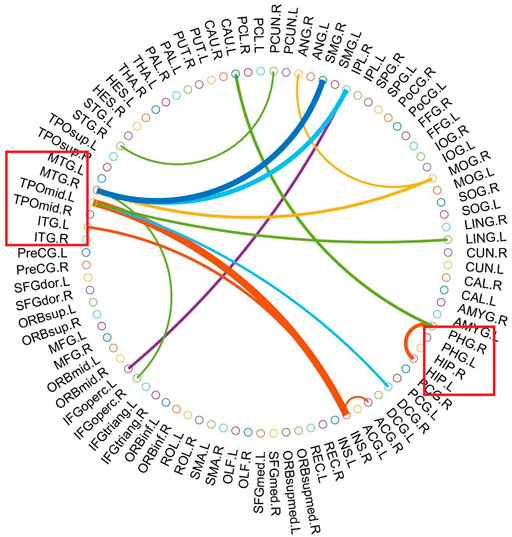
FIGURE 3. The most consensus connections. The most consensus connections mapped on the International Consortium for Brain Mapping (ICBM) 152 template using the BrainNet Viewer software package http://nitrc.org/projects/bnv/and circularGraph, shared by Paul Kassebaumb http://www.mathworks.com/matlabcentral/fileexchange/48576-circulargraph). The red box represents the temporal lobe containment area (HIP, hippocampus; ITG, inferior temporal gyrus; MTG, middle temporal gyrus; PHG, parahippocampal gyrus; TPOmid, middle temporal gyrus). We selected the consensus connections with a p value <0.05 in each loop. A total of 45 consensus connections are shown. In exploring the consensus significant metabolic connections, we observed that the most involved metabolic motor networks were the INS-TPOmid.L, MTG. R-SMG. R, and MTG. R-IPL.R pathways between the seizure recurrence and seizure free groups, and yielded further detailed individual pathological connectivity in the PHG. R-CAU.L, PHG. R-HIP.L, TPOmid.L-LING.R, TPOmid.L-DCG.R, MOG. R-MTG.R, MOG. R-ANG.R, and IPL. R-IFGoperc.L pathways.
Discussion
TLE is the most common drug-resistant epilepsy in adults and is traditionally associated with HS, a lesion affecting the hippocampus and adjacent mesial structures (Blumcke et al., 2013). Evidence from neuroimaging and neuroelectrophysiology has consistently demonstrated that epilepsy is a disease of abnormal networks, with changes occurring well beyond the focus of ictogenesis. These findings have been corroborated by mounting neuroimaging evidence suggesting the presence of diffuse grey and white matter abnormalities beyond the mesial temporal lobe that affect a distributed network of cortical and subcortical structures as well as their connections (Nikolin et al., 1984; Biller et al., 1986; Lin et al., 2007). Thus, the architecture of a patient’s brain network may have the answer to a critical question in the field of epilepsy: Why do some TLE patients, despite being deemed optimal surgical candidates, fail to achieve seizure control after epilepsy surgery? To address this issue, we investigated a larger group of patients with a homogeneous clinicopathological syndrome undergoing standard AMTR for TLE at a single center with a long postoperative follow-up.
We developed an individual-level metabolic network construction approach for presurgical FDG-PET imaging and applied it to the task of predicting individual seizure outcomes after epilepsy surgery. The classification accuracy of MK-SVM via combining the information from connection and topological metrics showed a sensitivity of 75.00%, a specificity of 92.79%, and an accuracy of 83.59%. Our approach may further the mechanistic understanding of seizure recurrence by identifying abnormal graph metrics of the metabolic brain connectome. If we can identify the specific degree and betweenness analysis of individual metabolic brain connectome abnormalities associated with seizure outcomes, we can potentially promote earlier referral to epilepsy surgery in patients deemed to be favorable candidates. This, in turn, would likely lead to a reduced psychosocial burden and improved quality of life.
Some studies have investigated surgical outcomes by considering the brain as a network of connected regions. Network measures that have been found to be altered in TLE include the clustering coefficient of a region, which captures the connectedness of neighbors of a region (Bernhardt et al., 2011). Furthermore, regression analysis and machine learning approaches have also been applied to brain networks of TLE to relate them to surgical outcomes (Bonilha et al., 2013; Bonilha et al., 2015; Ji et al., 2015; Munsell et al., 2015). Until now, most FDG-PET imaging studies of metabolic networks have used group-level analyses, which potentially sacrifice or obscure salient individual differences within a group; in contrast, our novel JSSE approach offers individual risk estimation. The JSSE or KLSE approach can perhaps be successfully applied in individual structural MR-based analyses (Tijms et al., 2012b; Kong et al., 2014; Wang et al., 2016b; Li et al., 2021), but have not yet been applied in metabolic maps in epilepsy. Based on the JSSE calculation of relative entropy, it can quantify the interregional metabolic interactions for the construction of an individual’s metabolic brain network. The putative association of FDG metabolism with afferent synaptic activity suggests that the various elements of the connectome are metabolically coupled (Raichle and Mintun, 2006). In the current state of FDG-PET, the intraregional similarity calculated according to the JSSE is a surrogate measure of the metabolic connectivity between brain regions.
Recapitulating previous studies on seizure outcome prediction after TLE epilepsy surgery, these works indeed have successfully differentiated seizure freedom vs. recurrence (Tellez-Zenteno et al., 2005; Bernhardt et al., 2011; Bonilha et al., 2013; Jehi et al., 2015b; Bonilha et al., 2015; Gleichgerrcht et al., 2015; Gleichgerrcht et al., 2018; Cahill et al., 2019; Wang et al., 2019; Shim et al., 2020). Nevertheless, such approaches may not depict individual pathophysiological details or downstream clinical therapeutic strategies, whereas our novel JSSE approach can provide individual risk estimation. The symptoms of many neurological and psychiatric diseases are mappable to specific functional networks of interconnected brain regions. Based on a novel in vivo approach that combined FDG-PET metabolic connectivity and physical distance between cortical areas, we were able to parameterize the balance between short- and long-range functional connections. Comparing SZR to SZF, we observed marked degree reductions in IFGoperc.R, ROL. R, IPL. R, and SMG. R; and betweenness reductions in ORBsup.R and IOG. R; meanwhile, CAL. L and PCL. L tended to be increased from degree analysis; and PreCG.R, IOG. R, PoCG.R, PCL. L, and PCL. R tended to be increased from betweenness analysis. Exploring consensus significant metabolic connections, we observed that the most involved metabolic motor networks were the INS-TPOmid.L, MTG. R-SMG. R, and MTG. R-IPL.R pathways between the two groups, which was similar to findings of the typical group-level method, and yielded further detailed individual pathological connectivity in the PHG. R-CAU.L, PHG. R-HIP.L, TPOmid.L-LING.R, TPOmid.L-DCG.R, MOG. R-MTG.R, MOG. R-ANG.R, and IPL. R-IFGoperc.L pathways. Collectively, our findings provide a new individualized metabolic JSSE network analysis capable of revealing subtle deviations in metabolic connectivity as a potential disease mechanism of TLE and which supports the promising clinical benefits of combining connectomic data with physically grounded information.
Most studies have focused on the identification of isolated outcome predictors, and a few studies have associated various combinations of outcome predictors with postoperative seizure control (Lee et al., 2005; Kumar et al., 2013). However, it is difficult to objectively combine a patient’s complex clinical characteristics and frequent multiple contradictory outcome predictors into a single comprehensive validated risk assessment measure (Jehi et al., 2015a; Jehi et al., 2015b; Keezer et al., 2015). This absence leads to uncertainty during presurgical counseling because most candidates for surgery do not fall into clear categories with all negative or all positive outcome predictors (Jehi et al., 2015b). Related studies have shown that some predictors work only for specific patient groups (Kumar et al., 2013). To compare the accuracy provided by our classification approach vs. clinical variables, we performed a discriminant function analysis that included 14 clinical variables (featured in Table 1). We also further explored the surgical outcomes in TLE with specific combinations of clinical characteristics. Only age at onset was found to correlate with surgical results, but the prognostic value of this indicator has been shown to be limited (Lee et al., 2005).
The decision to undergo surgery for epilepsy is complex and variable, and depends on multiple factors, including the patient’s baseline disease burden and overall clinical picture, not solely on the chance that seizures can be alleviated. Our approach was not meant to replace clinical judgment, but rather to enrich it by providing an objective and quantifiable estimate for a single key decision-driving factor (postoperative seizure outcome). In our previous study, in addition to discovering the number of metabolic abnormalities in the extratemporal area associated with surgical failure, we also described special patterns associated with the failure of TLE surgery (Tang et al., 2020), which spanned from the frontal and parietal regions to the occipital and contralateral regions, and some of which are consistent with electroclinical patterns corresponding to anterior and posterior spread (Chassoux et al., 2016). Our present brain connectome approach can measure local network properties and the entire network, and combined with MK-SVM, can provide powerful identification of the salient properties predictive of the surgical outcomes in SZF and SZR patients (accuracy of 83.59%). In metabolic brain connectome regard, our main finding was that SZR entails low of assortativity of the global and local graph metrics and a loss of connectivity between these modules. With the progression of TLE, these affected brain regions fail to metabolically compensate in TLE patients who inevitably undergo further disturbances. This latter result is consistent with previous studies showing the failure of network components early in the epilepsy process that lead to temporal lobe surgery failures (Ji et al., 2015; Giulioni et al., 2016; van den Heuvel and Sporns, 2019). Furthermore, we tested for a consensus of significant metabolic connections between SZR and SZF TLE patients, as summarized in Figure 3. The results accord with group-level studies showing analogous network changes in surgical failure (Barba et al., 2016; Bernhardt et al., 2016; Chassoux et al., 2017; Gleichgerrcht et al., 2018; Tang et al., 2020).
There are several limitations in this study. First, we did not include other important outcomes of interest after epilepsy surgery, such as quality of life, mood, and psychosocial functioning. Furthermore, this was a retrospective analysis and all patients underwent FDG-PET scanning, leading to a low proportion of class I Engel outcomes (50%) (Engel et al., 2003a; Tellez-Zenteno et al., 2005). Patients who had not undergone FDG-PET imaging were excluded, which might have led to some selection and ascertainment biases. Finally, preoperative video EEG data, structural MRI neuroimaging, and the results of more sophisticated diagnostic tests, such as single photon–emission computed tomography and invasive EEG were not analyzed in study patients who failed TLE surgery.
Conclusion
This study presents an advanced connectome analysis of FDG-PET images based on a novel application of JSSE entropy measures, which had not been previously applied to the task of metabolic connectome analysis. Our findings shed new light on the network abnormality underlying TLE and, importantly, provide novel understandings and additional evidence in furthering the mechanism research in TLE. Furthermore, our results demonstrate that information combinations from different views can achieve ideal performance in predicting an individual TLE patient’s long-term surgical outcome.
Data Availability Statement
The original contributions presented in the study are included in the article/Supplementary Material, further inquiries can be directed to the corresponding author.
Ethics Statement
The studies involving human participants were reviewed and approved by Ethical Commission of Medical Research Involving Human Subjects at Region of Xiangya Hospital, Central South University, China. Written informed consent to participate in this study was provided by the participants’ legal guardian/next of kin. Written informed consent was obtained from the individual(s) for the publication of any potentially identifiable images or data included in this article.
Author Contributions
All authors contributed to the study conception and design. Material preparation, data collection and analysis were performed by ZZ, ZMZ and XG. The first draft of the manuscript was written by ZMZ and ZZ and all authors commented on previous versions of the manuscript. All authors read and approved the final manuscript.
Funding
This study was supported by the National Natural Science Foundation of China, Grant No. 91859207; National Science Foundation of Hunan Province, Grant No. 2021JJ70075; the Natural Science Foundation of Changsha, Grant No. kq2014296; The Youth Science Foundation of Xiangya Hospital, Grant No. 2019Q18; Shanghai Municipal Commission of Health and Family Planning Science and Research Subjects (202140464) and Scientific Research Subjects of Shanghai Universal Medical Imaging Technology Limited Company (UV 2020Z02 and UV 2021Z01). The funder was not involved in the study design, collection, analysis, interpretation of data, the writing of this article or the decision to submit it for publication.
Conflict of Interest
This study received funding from Scientific Research Subjects of Shanghai Universal Medical Imaging Technology Limited Company (UV2020Z02, UV2021Z01).
The authors declare that the research was conducted in the absence of any commercial or financial relationships that could be construed as a potential conflict of interest.
Publisher’s Note
All claims expressed in this article are solely those of the authors and do not necessarily represent those of their affiliated organizations, or those of the publisher, the editors, and the reviewers. Any product that may be evaluated in this article, or claim that may be made by its manufacturer, is not guaranteed or endorsed by the publisher.
Acknowledgments
The authors extend their deepest appreciation to the participants and their families.
References
Arlot, S., and Celisse, A. (2010). A Survey of Cross-Validation Procedures for Model Selection. Stat. Surv. 4, 40–79. doi:10.1214/09-ss054
Barba, C., Rheims, S., Minotti, L., Guénot, M., Hoffmann, D., Chabardès, S., et al. (2016). Temporal Plus Epilepsy Is a Major Determinant of Temporal Lobe Surgery Failures. Brain 139 (Pt 2), 444–451. doi:10.1093/brain/awv372
Berg, A. T., Berkovic, S. F., Brodie, M. J., Buchhalter, J., Cross, J. H., van Emde Boas, W., et al. (2010). Revised Terminology and Concepts for Organization of Seizures and Epilepsies: Report of the ILAE Commission on Classification and Terminology, 2005-2009. Epilepsia 51 (4), 676–685. doi:10.1111/j.1528-1167.2010.02522.x
Bernhardt, B. C., Bernasconi, A., Liu, M., Hong, S.-J., Caldairou, B., Goubran, M., et al. (2016). The Spectrum of Structural and Functional Imaging Abnormalities in Temporal Lobe Epilepsy. Ann. Neurol. 80 (1), 142–153. doi:10.1002/ana.24691
Bernhardt, B. C., Chen, Z., He, Y., Evans, A. C., and Bernasconi, N. (2011). Graph-theoretical Analysis Reveals Disrupted Small-World Organization of Cortical Thickness Correlation Networks in Temporal Lobe Epilepsy. Cereb. Cortex 21 (9), 2147–2157. doi:10.1093/cercor/bhq291
Biller, J., Adams, H. P., Johnson, M. R., Kerber, R. E., and Toffol, G. J. (1986). Paradoxical Cerebral Embolism: Eight Cases. Neurology 36 (10), 1356. doi:10.1212/wnl.36.10.1356
Blümcke, I., Thom, M., Aronica, E., Armstrong, D. D., Bartolomei, F., Bernasconi, A., et al. (2013). International Consensus Classification of Hippocampal Sclerosis in Temporal Lobe Epilepsy: a Task Force Report from the ILAE Commission on Diagnostic Methods. Epilepsia 54 (7), 1315–1329. doi:10.1111/epi.12220
Bonilha, L., Helpern, J. A., Sainju, R., Nesland, T., Edwards, J. C., Glazier, S. S., et al. (2013). Presurgical Connectome and Postsurgical Seizure Control in Temporal Lobe Epilepsy. Neurology 81 (19), 1704–1710. doi:10.1212/01.wnl.0000435306.95271.5f
Bonilha, L., Jensen, J. H., Baker, N., Breedlove, J., Nesland, T., Lin, J. J., et al. (2015). The Brain Connectome as a Personalized Biomarker of Seizure Outcomes after Temporal Lobectomy. Neurology 84 (18), 1846–1853. doi:10.1212/WNL.0000000000001548
Cahill, V., Sinclair, B., Malpas, C. B., McIntosh, A. M., Chen, Z., Vivash, L. E., et al. (2019). Metabolic Patterns and Seizure Outcomes Following Anterior Temporal Lobectomy. Ann. Neurol. 85 (2), 241–250. doi:10.1002/ana.25405
Chassoux, F., Artiges, E., Semah, F., Desarnaud, S., Laurent, A., Landre, E., et al. (2016). Determinants of Brain Metabolism Changes in Mesial Temporal Lobe Epilepsy. Epilepsia 57 (6), 907–919. doi:10.1111/epi.13377
Chassoux, F., Artiges, E., Semah, F., Laurent, A., Landré, E., Turak, B., et al. (2017). 18F-FDG-PET Patterns of Surgical success and Failure in Mesial Temporal Lobe epilepsyF-FDG-PET Patterns of Surgical success and Failure in Mesial Temporal Lobe Epilepsy. Neurology 88 (11), 1045–1053. doi:10.1212/WNL.0000000000003714
Delong, E. R., Delong, D. M., and Clarke-Pearson, D. L. (1988). Comparing the Areas under Two or More Correlated Receiver Operating Characteristic Curves: A Nonparametric Approach. Biometrics 44 (3), 837–845. doi:10.2307/2531595
Duong, T. (2007). Ks: Kernel Density Estimation and Kernel Discriminant Analysis for Multivariate Data in R. J. Stat. Softw. 21 (7), 1–16. doi:10.18637/jss.v021.i07
Engel, J., Wiebe, S., French, J., Sperling, M., Williamson, P., Spencer, D., et al. (2003a). Practice Parameter: Temporal Lobe and Localized Neocortical Resections for Epilepsy. Epilepsia 44 (6), 741–751. doi:10.1046/j.1528-1157.2003.48202.x
Engel, J., Wiebe, S., French, J., Sperling, M., Williamson, P., Spencer, D., et al. (2003b). Practice Parameter: Temporal Lobe and Localized Neocortical Resections for Epilepsy. Neurology 60 (4), 538–547. doi:10.1212/01.wnl.0000055086.35806.2d
Giulioni, M., Martinoni, M., and Marucci, G. (2016). Temporal Plus Epilepsy Is a Major Determinant of Temporal Lobe Surgery Failures. Brain 139 (Pt 7), e35. doi:10.1093/brain/aww040
Gleichgerrcht, E., and Bonilha, L. (2017). Structural Brain Network Architecture and Personalized Medicine in Epilepsy. Expert Rev. Precision Med. Drug Dev. 2 (4), 229–237. doi:10.1080/23808993.2017.1364133
Gleichgerrcht, E., Kocher, M., and Bonilha, L. (2015). Connectomics and Graph Theory Analyses: Novel Insights into Network Abnormalities in Epilepsy. Epilepsia 56 (11), 1660–1668. doi:10.1111/epi.13133
Gleichgerrcht, E., Munsell, B., Bhatia, S., Vandergrift, W. A., Rorden, C., McDonald, C., et al. (2018). Deep Learning Applied to Whole-Brain Connectome to Determine Seizure Control after Epilepsy Surgery. Epilepsia 59 (9), 1643–1654. doi:10.1111/epi.14528
Harroud, A., Bouthillier, A., Weil, A. G., and Nguyen, D. K. (2012). Temporal Lobe Epilepsy Surgery Failures: a Review. Epilepsy Res. Treat. 2012, 1–10. doi:10.1155/2012/201651
Jehi, L., Chagin, K., Yardi, R., Tassi, L., Russo, G. L., Worrell, G., et al. (2015a). Promise and Pitfalls of Prognostic Models for Epilepsy Surgery-Authors' Reply. Lancet Neurol. 14 (7), 684. doi:10.1016/s1474-4422(15)00102-7
Jehi, L., Yardi, R., Chagin, K., Tassi, L., Russo, G. L., Worrell, G., et al. (2015b). Development and Validation of Nomograms to Provide Individualised Predictions of Seizure Outcomes after Epilepsy Surgery: a Retrospective Analysis. Lancet Neurol. 14 (3), 283–290. doi:10.1016/S1474-4422(14)70325-4
Ji, G.-J., Zhang, Z., Xu, Q., Wei, W., Wang, J., Wang, Z., et al. (2015). Connectome Reorganization Associated with Surgical Outcome in Temporal Lobe Epilepsy. Medicine (Baltimore) 94 (40), e1737. doi:10.1097/MD.0000000000001737
Jin, X., Wu, L., Li, X., Chen, S., Peng, S., Chi, J., et al. (2017). “Predicting Aesthetic Score Distribution through Cumulative Jensen-shannon Divergence,” in Proceedings of the AAAI Conference on Artificial Intelligence, New Orleans, LA, February 2–7, 2018.
Keezer, M. R., Bell, G. S., Duncan, J. S., and Sander, J. W. (2015). Promise and Pitfalls of Prognostic Models for Epilepsy Surgery. Lancet Neurol. 14 (7), 683–684. doi:10.1016/s1474-4422(15)00100-3
Kong, X.-z., Wang, X., Huang, L., Pu, Y., Yang, Z., Dang, X., et al. (2014). Measuring Individual Morphological Relationship of Cortical Regions. J. Neurosci. Methods 237, 103–107. doi:10.1016/j.jneumeth.2014.09.003
Kumar, A., Valentín, A., Humayon, D., Longbottom, A. L., Jimenez-Jimenez, D., Mullatti, N., et al. (2013). Preoperative Estimation of Seizure Control after Resective Surgery for the Treatment of Epilepsy. Seizure 22 (10), 818–826. doi:10.1016/j.seizure.2013.06.010
Lee, S. K., Lee, S. Y., Kim, K.-K., Hong, K.-S., Lee, D.-S., and Chung, C.-K. (2005). Surgical Outcome and Prognostic Factors of Cryptogenic Neocortical Epilepsy. Ann. Neurol. 58 (4), 525–532. doi:10.1002/ana.20569
Li, W., Xu, X., Jiang, W., Wang, P., and Gao, X. (2020b). Functional Connectivity Network Estimation with an Inter-similarity Prior for Mild Cognitive Impairment Classification. Aging (Albany NY) 12 (17), 17328–17342. doi:10.18632/aging.103719
Li, W., Geng, C., and Chen, S. (2020a). Leave Zero Out: Towards a No-Cross-Validation Approach for Model Selection. arXiv. arXiv:2012.13309.
Li, W., Qiao, L., Zhang, L., Wang, Z., and Shen, D. (2019a). Functional Brain Network Estimation with Time Series Self-Scrubbing. IEEE J. Biomed. Health Inform. 23 (6), 2494–2504. doi:10.1109/jbhi.2019.2893880
Li, W., Tang, Y., Wang, Z., Hu, S., and Gao, X. (2021). The Reconfiguration Pattern of Individual Brain Metabolic Connectome for Parkinson's Disease Identification. arXiv. arXiv:2105.02811.
Li, W., Zhang, L., Qiao, L., and Shen, D. (2019b). Towards a Better Estimation of Functional Brain Network for Mild Cognitive Impairmen Identification: A Transfer Learning View. IEEE J. Biomed. Health Inform. 24, 1160. doi:10.1109/JBHI.2019.2934230
Lin, J.-H., Chiu, S.-C., Shaw, M. W., Lin, Y.-C., Lee, C.-H., Chen, H.-Y., et al. (2007). Characterization of the Epidemic Influenza B Viruses Isolated during 2004-2005 Season in Taiwan. Virus. Res. 124 (1-2), 204–211. doi:10.1016/j.virusres.2006.11.005
Lu, G., Zhou, Z., Song, Y., Ren, K., and Yu, Y. (2018). “Guiding the One-To-One Mapping in Cyclegan via Optimal Transport,” in Proceedings of the AAAI Conference on Artificial Intelligence, Honolulu, HI, January 27–February 1, 2019, 4432–4439.
Munsell, B. C., Wee, C.-Y., Keller, S. S., Weber, B., Elger, C., da Silva, L. A. T., et al. (2015). Evaluation of Machine Learning Algorithms for Treatment Outcome Prediction in Patients with Epilepsy Based on Structural Connectome Data. Neuroimage 118, 219–230. doi:10.1016/j.neuroimage.2015.06.008
Newman, M. E. (2004). Fast Algorithm for Detecting Community Structure in Networks. Phys. Rev. E Stat. Nonlin Soft Matter Phys. 69 (6), 066133. doi:10.1103/PhysRevE.69.066133
Nikolin, V. P., Il'nitskaia, S. I., Gruntenko, E. V., and Tomsons, V. P. (1984). Appearance of New Transplantation Antigens in Tumor Cells Treated with RNA. Eksp Onkol 6 (1), 42–47.
Raichle, M. E., and Mintun, M. A. (2006). Brain Work and Brain Imaging. Annu. Rev. Neurosci. 29, 449–476. doi:10.1146/annurev.neuro.29.051605.112819
Rubinov, M., and Sporns, O. (2010). Complex Network Measures of Brain Connectivity: Uses and Interpretations. Neuroimage 52 (3), 1059–1069. doi:10.1016/j.neuroimage.2009.10.003
Schmidt, D., Baumgartner, C., and Löscher, W. (2004). The Chance of Cure Following Surgery for Drug-Resistant Temporal Lobe Epilepsy. Epilepsy Res. 60 (2-3), 187–201. doi:10.1016/j.eplepsyres.2004.07.004
Shim, H.-K., Lee, H.-J., Kim, S. E., Lee, B. I., Park, S., and Park, K. M. (2020). Alterations in the Metabolic Networks of Temporal Lobe Epilepsy Patients: A Graph Theoretical Analysis Using FDG-PET. NeuroImage: Clin. 27, 102349. doi:10.1016/j.nicl.2020.102349
Spencer, D. D., Spencer, S. S., Mattson, R. H., Williamson, P. D., and Novelly, R. A. (1984). Access to the Posterior Medial Temporal Lobe Structures in the Surgical Treatment of Temporal Lobe Epilepsy. Neurosurgery 15 (5), 667–671. doi:10.1227/00006123-198411000-00005
Sperry, M. M., Kartha, S., Granquist, E. J., and Winkelstein, B. A. (2018). Inter-subject FDG PET Brain Networks Exhibit Multi-Scale Community Structure with Different Normalization Techniques. Ann. Biomed. Eng. 46 (7), 1001–1012. doi:10.1007/s10439-018-2022-x
Stam, C. J. (2014). Modern Network Science of Neurological Disorders. Nat. Rev. Neurosci. 15 (10), 683–695. doi:10.1038/nrn3801
Tang, Y., Liao, G., Li, J., Long, T., Li, Y., Feng, L., et al. (2020). FDG-PET Profiles of Extratemporal Metabolism as a Predictor of Surgical Failure in Temporal Lobe Epilepsy. Front. Med. 7, 605002. doi:10.3389/fmed.2020.605002
Tang, Y., Liow, J.-S., Zhang, Z., Li, J., Long, T., Li, Y., et al. (2018). The Evaluation of Dynamic FDG-PET for Detecting Epileptic Foci and Analyzing Reduced Glucose Phosphorylation in Refractory Epilepsy. Front. Neurosci. 12, 993. doi:10.3389/fnins.2018.00993
Téllez-Zenteno, J. F., Dhar, R., and Wiebe, S. (2005). Long-term Seizure Outcomes Following Epilepsy Surgery: a Systematic Review and Meta-Analysis. Brain 128 (Pt 5), 1188–1198. doi:10.1093/brain/awh449
Tijms, B. M., Series, P., Willshaw, D. J., and Lawrie, S. M. (2012a). Similarity-based Extraction of Individual Networks from gray Matter MRI Scans. Cereb. Cortex 22 (7), 1530–1541. doi:10.1093/cercor/bhr221
Tijms, B. M., Seriès, P., Willshaw, D. J., and Lawrie, S. M. (2012b). Similarity-based Extraction of Individual Networks from gray Matter MRI Scans. Cereb. Cortex 22 (7), 1530–1541. doi:10.1093/cercor/bhr221
Tzourio-Mazoyer, N., Landeau, B., Papathanassiou, D., Crivello, F., Etard, O., Delcroix, N., et al. (2002). Automated Anatomical Labeling of Activations in SPM Using a Macroscopic Anatomical Parcellation of the MNI MRI Single-Subject Brain. Neuroimage 15 (1), 273–289. doi:10.1006/nimg.2001.0978
van den Heuvel, M. P., and Sporns, O. (2019). A Cross-Disorder Connectome Landscape of Brain Dysconnectivity. Nat. Rev. Neurosci. 20 (7), 435–446. doi:10.1038/s41583-019-0177-6
Van Erven, T., and Harremoes, P. (2014). Rényi Divergence and Kullback-Leibler Divergence. IEEE Trans. Inform. Theor. 60 (7), 3797–3820. doi:10.1109/tit.2014.2320500
Wang, H., Jin, X., Zhang, Y., and Wang, J. (2016b). Single-subject Morphological Brain Networks: Connectivity Mapping, Topological Characterization and Test-Retest Reliability. Brain Behav. 6 (4), e00448. doi:10.1002/brb3.448
Wang, H., Jin, X., Zhang, Y., and Wang, J. (2016a). Single‐subject Morphological Brain Networks: Connectivity Mapping, Topological Characterization and Test-Retest Reliability. Brain Behav. 6 (4), e00448. doi:10.1002/brb3.448
Wang, J., Wang, X., Xia, M., Liao, X., Evans, A., and He, Y. (2015). Corrigendum: GRETNA: a Graph Theoretical Network Analysis Toolbox for Imaging Connectomics. Front. Hum. Neurosci. 9, 458. doi:10.3389/fnhum.2015.00458
Wang, K.-L., Hu, W., Liu, T.-H., Zhao, X.-B., Han, C.-L., Xia, X.-T., et al. (2019). Metabolic Covariance Networks Combining Graph Theory Measuring Aberrant Topological Patterns in Mesial Temporal Lobe Epilepsy. CNS Neurosci. Ther. 25 (3), 396–408. doi:10.1111/cns.13073
Wang, M., Jiang, J., Yan, Z., Alberts, I., Ge, J., Zhang, H., et al. (2020). Individual Brain Metabolic Connectome Indicator Based on Kullback-Leibler Divergence Similarity Estimation Predicts Progression from Mild Cognitive Impairment to Alzheimer's Dementia. Eur. J. Nucl. Med. Mol. Imaging 47 (12), 2753–2764. doi:10.1007/s00259-020-04814-x
West, S., Nevitt, S. J., Cotton, J., Gandhi, S., Weston, J., Sudan, A., et al. (2019). Surgery for Epilepsy. Cochrane Database Syst. Rev. 6, CD010541. doi:10.1002/14651858.CD010541.pub3
Keywords: PET, FDG-PET, metabolic connectome, temporal lobe epilepsy, predicts seizure outcomes
Citation: Zhu Z, Zhang Z, Gao X, Feng L, Chen D, Yang Z and Hu S (2022) Individual Brain Metabolic Connectome Indicator Based on Jensen-Shannon Divergence Similarity Estimation Predicts Seizure Outcomes of Temporal Lobe Epilepsy. Front. Cell Dev. Biol. 9:803800. doi: 10.3389/fcell.2021.803800
Received: 28 October 2021; Accepted: 15 December 2021;
Published: 11 January 2022.
Edited by:
Chuang Wang, Ningbo University, ChinaReviewed by:
Kuangyu Shi, University of Bern, SwitzerlandXuedan Wu, University of North Carolina System, United States
Copyright © 2022 Zhu, Zhang, Gao, Feng, Chen, Yang and Hu. This is an open-access article distributed under the terms of the Creative Commons Attribution License (CC BY). The use, distribution or reproduction in other forums is permitted, provided the original author(s) and the copyright owner(s) are credited and that the original publication in this journal is cited, in accordance with accepted academic practice. No use, distribution or reproduction is permitted which does not comply with these terms.
*Correspondence: Shuo Hu, hushuo2018@163.com
†These authors have contributed equally to this work and share first authorship