Abundance and Expression of Shiga Toxin Genes in Escherichia coli at the Recto-Anal Junction Relates to Host Immune Genes
 Zhe Pan
 Yanhong Chen1
  Michael Gänzle
 Graham Plastow
 Le Luo Guan
- 1Department of Agricultural, Food and Nutritional Science, University of Alberta, Edmonton, AB, Canada
- 2Lethbridge Research Centre, Agriculture and Agri-Food Canada, Lethbridge, AB, Canada
Shiga toxin (Stx) is the main virulence factor of Shiga toxin-producing Escherichia coli (STEC), and ruminants are the main reservoir of STEC. This study assessed the abundance and expression of Stx genes and the expression of host immune genes, aiming to determine factors affecting these measures and potential gene markers to differentiate Stx gene expression in the recto-anal junction of feedlot beef cattle. Rectal tissue and content samples were collected from 143 feedlot steers of three breeds (Angus, Charolais, and Kinsella Composite) over 2 consecutive years 2014 (n=71) and 2015 (n=72). The abundance and expression of stx1 and stx2 were quantified using qPCR and reverse-transcription-qPCR (RT-qPCR), respectively. Four immune genes (MS4A1, CCL21, CD19, and LTB), previously reported to be down-regulated in super-shedder cattle (i.e., > 104 CFU g-1) were selected, and their expression was evaluated using RT-qPCR. The stx1 gene abundance was only detected in tissue samples collected in year 2 and did not differ among breeds. The stx2 gene was detected in STEC from all samples collected in both years and did not vary among breeds. The abundance of stx1 and stx2 differed (P < 0.001) in content samples collected across breeds (stx1:AN>CH>KC, stx2: AN=CH>KC) in year 1, but not in year 2. Expression of stx2 was detected in 13 RAJ tissue samples (2014: n=6, 2015: n=7), while expression of stx1 was not detected. Correlation analysis showed that the expression of stx2 was negatively correlated with the expression of MS4A1 (R=-0.56, P=0.05) and positively correlated with the expression of LTB (R=0.60, P=0.05). The random forest model and Boruta method revealed that expression of selected immune genes could be predictive indicators of stx2 expression with prediction accuracy of MS4A1 >LTB >CCL21 >CD19. Our results indicate that the abundance of Stx could be affected by cattle breed and sampling year, suggesting that host genetics and environment may influence STEC colonization of the recto-anal junction of feedlot cattle. Additionally, the identified relationship between expressions of host immune genes and stx2 suggests that the host animal may regulate stx2 expression in colonizing STEC through immune functions.
Introduction
Shiga toxin-producing Escherichia coli (STEC) cause foodborne disease that can lead to hemolytic uremic syndrome (HUS) and hemorrhagic colitis (HC) (Karmali et al., 1983). Approximately, 2.8 million acute illnesses around the world are attributed to STEC (Majowicz et al., 2014), with 60,000 of these occurring in the US annually (Scallan et al., 2011). Many infections in humans are attributed to direct or indirect contact with food or water contaminated with cattle feces (Mir et al., 2016). Ruminants, especially cattle are the main reservoir who are asymptomatic carriers of O157 and non-O157 STEC strains with the recto-anal junction (RAJ) as the main colonization site (Wang et al., 2016). Most E. coli strains are commensals within the gut of cattle (Mir et al., 2016; Wang et al., 2016), and are shed into the environment through feces. Cattle that shed more than 104 CFU STEC per gram of feces are defined as “super-shedders” (SS), which are considered the primary source of STEC transmission on farms (Matthews et al., 2006). Although the incidence of E. coli O157:H7 causing disease in cattle is low, the prevalence of STEC including both E. coli O157:H7 and non-O157:H7 serotypes is not low in cattle ranging from 38.5%–75.0% (Cho et al., 2009). Both E. coli O157:H7 and non-O157:H7 serotypes can cause human disease and among non-O157 infections, up to 70% of human infections are attributed to six non-O157 STEC serogroups (O26, O45, O103, O111, O121, and O145) (Bosilevac and Koohmaraie, 2012).
Shiga toxins are the main virulence factors in STEC and other pathogenic bacterial species with the prototype toxins being designated as Shiga toxin 1a (Stx1a) and Shiga toxin 2a (Stx2a) (Melton-Celsa, 2014). These toxins differ in their virulence and host specificity (Fuller et al., 2011; Lee and Tesh, 2019; Petro et al., 2019) with Stx2 being most commonly associated with severe illness (HUS, hospitalization, and bloody diarrhea) in humans (Karmali et al., 1983; Panel et al., 2020). For example, 40% HUS, 41% hospitalization, and 43% bloody diarrhea cases reported in human were attributed to the detectable Stx2 (Panel et al., 2020). Therefore, identifying the abundance of stx1 and stx2 genes in cattle is important as they could harbor and shed STEC. However, information on the abundance and expression of stx1 and stx2 genes in vivo (e.g. in RAJ) of feedlot cattle is lacking. We hypothesize that the expression and abundance of stx genes at the RAJ is influenced by cattle breed and expression of host immune genes. Genetic variation in the host was found to be linked to the level of expression of immune genes in SS (Wang et al., 2018), which also affected the attachment and the colonization of the mucosa by STEC (Wang et al., 2018). The understanding of abundance and expression of stx genes in STEC from the main colonization site and its linkage with host immune gene expression will gain insights into the host-STEC interactions at the RAJ of feedlot cattle.
Materials and Methods
Animal Populations and Sample Collection
The animal trial followed Canadian Council of Animal Care Guidelines and was approved by the Animal Care and Use Committee, University of Alberta (Animal Care Committee protocol number AUP00000882). In total, rectal tissue and contents were collected over 2 consecutive years (2014 and 2015) from 143 cattle representing Angus breed (AN, n=47), Charolais breed (CH, n=48), and a crossbreed named Kinsella Composite (KC, n=48) that were reared at the University of Alberta Roy Berg Kinsella Research Station. Sampling was performed when animals were slaughtered at a comparable age (Year 2014: 492 days ± 30 days; Year 2015: 496 days ± 22 days; P=0.11) in each year. Ten cm2 rectal tissue was collected from RAJ and 10 ml rectum contents were squeezed from each steer within 30 min after slaughter at a federally approved abattoir. The samples were deep-frozen immediately in liquid nitrogen and stored at -80°C until use.
DNA and RNA Extraction
Tissue and content samples of RAJ were ground into fine powder in liquid nitrogen and mixed homogeneously before DNA and RNA extraction. DNA was isolated from 0.1 g powdered tissue using repeated bead beating and a column (RBBC) method (Yu and Morrison, 2004) and purified using the QIAamp DNA Stool Mini Kit (Qiagen, Germany). The quantity and quality of DNA were assessed based on absorbance at 260 and 280 nm using the ND-1000 spectrophotometer (NanoDrop Technologies, Wilmington, USA). Trizol reagent (Invitrogen Corporation, Carlsbad, CA, USA) was used to isolate total RNA from 0.1 g powdered tissue following the manufacturer’s protocol. RNA was purified using the RNeasy MinElute Cleanup kit (Qiagen, Valencia, CA, USA). Quality and quantity of RNA were assessed using Agilent 2200 TapeStation (Agilent Technologies, Santa Clara, CA, USA) and Qubit 3.0 Fluorometer (Invitrogen, Carlsbad, CA, USA), respectively. DNA was extracted from 0.5 g of the RAJ contents from each steer using the same bead beating method described above. DNA was obtained from contents of 131 steers and were used for downstream analysis.
Assessment of Shiga Toxin Gene Abundance Using qPCR
The DNA extracted from contents and tissues was used to evaluate the abundance of Stx genes using quantitative PCR (qPCR) with primers for the detection of all subtypes of stx1 and stx2 (Table 1) and SYBR Green I reagent (Fast SYBR green master mix; Applied Biosystems, Foster City, CA, USA). The qPCR was conducted in triplicates for each sample on a StepOnePlus™ Real-Time PCR System (Applied Biosystems, Foster City, CA, USA) with the program of one cycle at 95°C for 20 s followed by 40 cycles of 3 s at 95°C, 30 s at 60°C. Melting curve analysis with a temperature gradient of 0.1°C/s from 60 to 95°C with fluorescence signal measurement at 0.1°C intervals was performed to make sure targeted products were amplified specifically. The standard curve method was used to quantify stx1 and stx2 copy numbers. The standard curve was constructed by genomic DNAs isolated from strain E. coli FUA 1403 and E. coli FUA 1400, which contain stx1 and stx2, respectively. The formula to calculate the absolute copy number of standard curves is described as follows (Li et al., 2009):
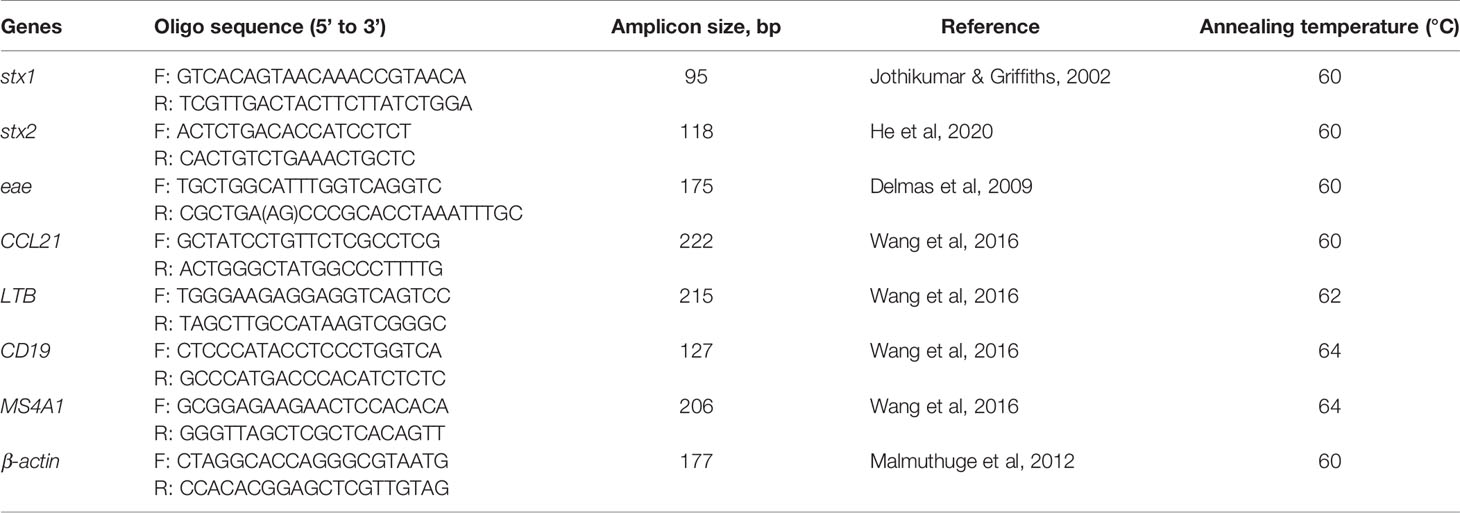
Table 1 Primer sequences, amplicon sizes, and annealing temperature for qPCR assays.
where 6.022 * 1023 represents the Avogadro’s constant (#/mol); Length (bp) is the length of template DNA; 660 represents the average mass of 1 bp double-strand DNA. The copy number of stx1 or stx2 was determined by relating threshold cycle (CT) values to standard curves based on the following regression formula (Li et al., 2009): Y = -3.193 * log X + 35.003 (Y, CT value; X, copy number of 16S rRNA gene) (r2 = 0.996). The qPCR amplification efficiency was 88%–98%.
Detection of Expression of Stx and Host Immune Genes Using qRT-PCR
Total RNA (0.1 µg) was further subjected to reverse transcription to synthesize cDNA using a cDNA Synthesis Kit (Bio-Rad, Hercules, CA, USA). Single-stranded cDNA was amplified using Oligo(dT)12-18 (Life Technologies, Carlsbad, CA, USA) and SuperScript™ II RT (Life Technologies, Carlsbad, CA, USA) was used to synthesize double-strand cDNA. Primers for the detection of eae expression are shown in Table 1. Quantitative RT-PCR of stx1, stx2, and eae was then performed using the double-strand cDNA and primers (Table 2) with the same thermal cycling program described above in triplicates for each sample. The expression of stx1, stx2, and eae was quantified by standard curve method described above.
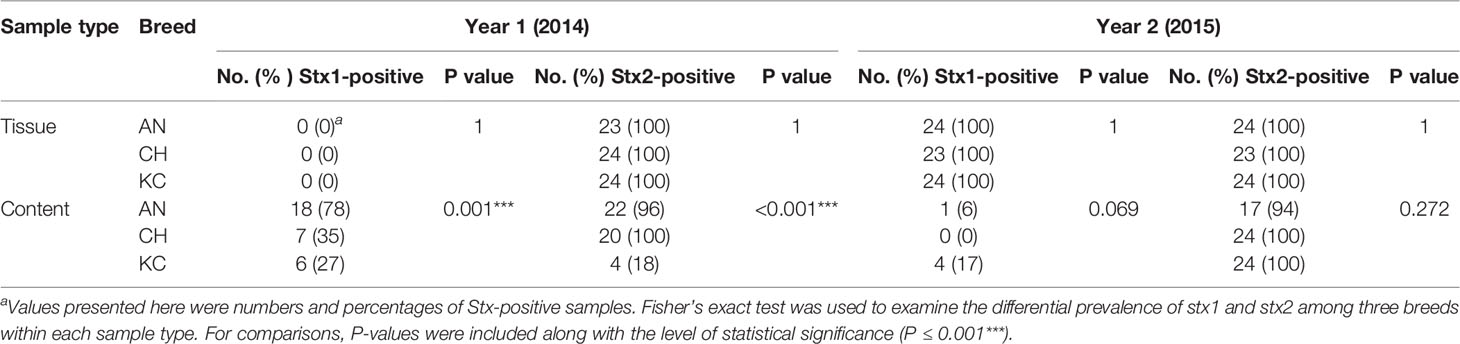
Table 2 The prevalence analysis of stx1 and stx2 for samples collected from the rectal tissue and content in 2014 and 2015.
In addition, four genes reported to be differentially expressed between SS and non-shedding (NS) cattle (Wang et al., 2016); chemokine (C-C motif) ligand 21 (CCL21), lymphotoxin beta (LTB), CD19 molecule (CD19), and 4-domains, subfamily A, member 1 (MS4A1) were selected to study their relationship with Stx gene abundance and expression. The same qPCR amplification conditions were used for the four genes with their respective primers (Table 1). Four commonly used housekeeping genes, including bovine GAPDH, 18S rRNA genes, RPLP0, and the β-actin gene, were also quantified by qPCR (Wang et al., 2016). As β-actin exhibited the most consistent Cq value it was used as the house-keeping gene for evaluating relative gene expression. The relative expression of each gene (stx1, stx2, and immune genes) was measured by ΔCq value, which was calculated as (Wang et al., 2016):
with a higher ΔCq representing the lower expression while a lower ΔCq indicating higher expression. The qPCR amplification efficiency was 88%–98%.
Statistical Analysis
The PROC MIXED model in SAS (ver. 9.13; SAS Institute Inc., Cary, NC, United States) was used to analyze the stx1 and stx2 abundance as well as host gene expressions together with all potential 2- and 3-way interactions among breeds, years, and sample types. In this statistical model, breed, sample type, and year were analyzed as fixed effects with steers as the random effect. Interactions were removed from the model if they were not significant (P > 0.05). Least square means were compared using the Bonferroni mean separation method after the removal of insignificant interactions and the significance was considered at P <0.05. The difference of prevalence of stx1 and stx2 was analyzed using Fisher’s exact tests. Non-parametric Mann-Whitney U test in R (Mangiafico, 2020) was used to assess differences in host gene expression between Stx2+ (expressed) and Stx2- (not expressed) groups, with differences considered significant at P<0.05. Correlation analysis was performed based on Spearman’s rank correlation coefficient (R) to identify relationships between expression of stx2 and host genes using the “ggcorrplot” package in R with significance at P<0.05.
Isomap, a novel method for nonlinear dimensional reduction (Tenenbaum et al., 2000), was applied to determine the effect of breed, and sampling year on the expression of immune genes and stx2 using the “RDRToolbox” package in R. In addition, Davis-Bouldin-Index (DBIndex) was used to compute Euclidean metrics to validate the clustering patterns of the expression of immune genes and stx2, with the value ≤ 1 indicating a well-separated cluster (Davies and Bouldin, 1979). Correspondence analysis (CA) was used to identify relationships among expression patterns using the “FactoMineR” package (Ringrose, 1992; Tekaia, 2016).
Identification of Potential Gene Markers for Stx Gene Expression Using Mathematic Models
The random forest model was used to identify predictive indicators for stx2 expression with the “RandomForest” package in R. The host gene expression data were divided into two groups: stx2+ (expressed) and stx2- (not expressed). Two-thirds of each group was used as training data, and the rest (one-third) was used for validation. The accuracy rate (number of samples recognized correctly/total number of samples) was calculated to determine the model classification performance. The mean decrease in accuracy was used to assess the importance of host genes as predictive indicators of stx2 expression. Variables with high mean decrease in accuracy indicate the higher contribution as compared to variables with low mean decrease accuracy (Han et al., 2016). The area under the ROC curve (AUC) was calculated to assess the robustness of the prediction model with the criteria being excellent (0.9–1.0), good (0.8–0.9), fair (0.7–0.8), weak (0.6–0.7), or fail (0.5–0.6) (Zhang et al., 2016). Moreover, the Boruta method, a random forest-based feature selection with the ability to remove less informative features, was used as a supportive approach to perform this prediction using the “Boruta” package in R (Kursa and Rudnicki, 2010).
Results
Factors Affecting the Abundance and Prevalence of stx1 and stx2
Sampling year significantly impacted the abundance and prevalence of stx genes identified in RAJ samples (P<0.01), therefore, the effect of breed on the prevalence and abundance of stx1 and stx2 was analyzed separately for each year. The prevalence of stx1 and stx2 in tissue samples was not affected by breed in either year (Table 2). In year 1, the prevalence of stx1 in contents was higher (P = 0.001, Table 2) in AN (n=18; 78%) compared to CH (n=7; 35%) and KC (n=6; 27%), and the prevalence of stx2 was higher (P < 0.001, Table 2) in AN (n=22; 96%) and CH (n=20; 100%) than in KC (n=4; 18%). However, the prevalence of stx1 and stx2 in content samples collected in year 2 was not affected by breed (Pstx1 = 0.069, Pstx2 = 0.272, Table 2) with a tendency for breed to affect the prevalence of stx1.
The abundance of stx1 and stx2 was affected (P < 0.001) by sample type (tissue vs. contents) for both years (Table 3). An interaction effect between breed and sample type for the abundance of stx1 and stx2 was detected in year 1 (Pstx1<0.001, Pstx2<0.001, Table 3), but not in year 2 (Pstx1 = 0.28, Pstx2 = 0.12, Table 3). In year 1, the abundance of stx1 in contents was affected by breed with its abundance higher in AN> CH> KC (P<0.001, Table 3), while its abundance in rectal tissue was under the detection limit (Table 3). For stx2, it was detected in both tissue and content samples in year 1 with no difference in the abundance of stx2 in tissue samples (Table 3), but with the higher abundance in rectal contents of AN and CH as compared to KC steers (P<0.0001, Table 3). For year 2, the abundance of stx1 or stx2 did not differ among breeds for either tissue or contents (Table 3), with the abundance of stx1 and stx2 in tissue being higher compared to that in contents (Pstx1<0.001, Pstx2<0.001, Table 3), respectively.
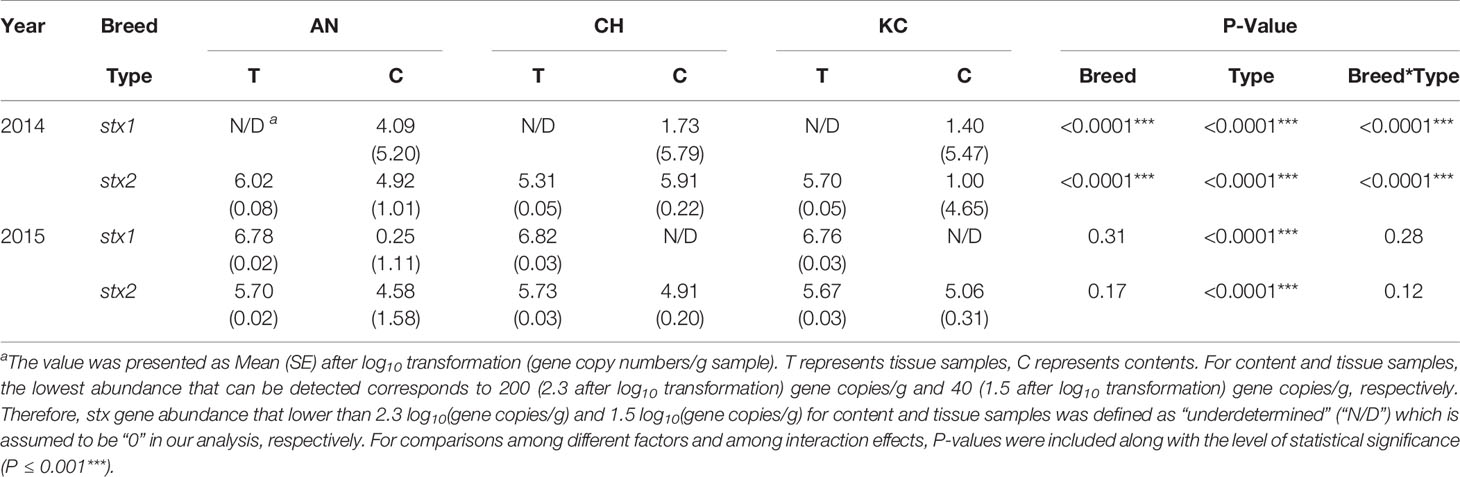
Table 3 Abundance of stx1 and stx2 using q-PCR for samples collected from the rectal tissue and content in 2014 and 2015.
Expression of stx1 and stx2 Associated With the Rectal Tissue of Beef Steers
Expression of bacterial stx1 was not detected, and bacterial stx2 (defined as stx2+) was only detected in mucosal tissue from 13 cattle (2014: n=6, 2015: n=7, Table S1). The expression of stx2 was more common in KC (n=9; 70%) than in AN (n=2; 15%) and CH (n=2; 15%). The non-parametric Kruskal-Wallis test showed that stx2 expression did not differ among breeds (ΔCq AN=5.04; ΔCq CH=5.11; ΔCq KC=5.04; P= 0.31), but there was a trend for difference between sampling years (ΔCq Year 2014 = 4.94; ΔCq Year 2015 = 5.15; P = 0.06).
Expression of Selected Immune Genes in RAJ Tissue From Beef Steers
In year 1, the expression of four selected immune genes was not affected by breed. In year 2, only expression of CD19 and CCL21 differed among breeds (PCD19 = 0.02, PCCL21 = 0.0035, Table 4). There was no difference (PMS4A1 = 0.36, PCD19 = 0.62, PCCL21 = 0.94, PLTB=0.54, Table 5) in the expression of the four genes between stx2+ and stx2- steers. Visually, host gene expression patterns from tissue samples were affected by year among all samples (ValueYear = 0.81, Figure 1A) as well as among stx2+ samples (ValueYear =0.75, Figure 1B). However, host gene expression patterns did not differ among breeds based on DBIndex clustering value among all samples (Valuebreed=9.30, Figure S1A) or among stx2+ samples (Valuebreed=1.64, Figure S1B).
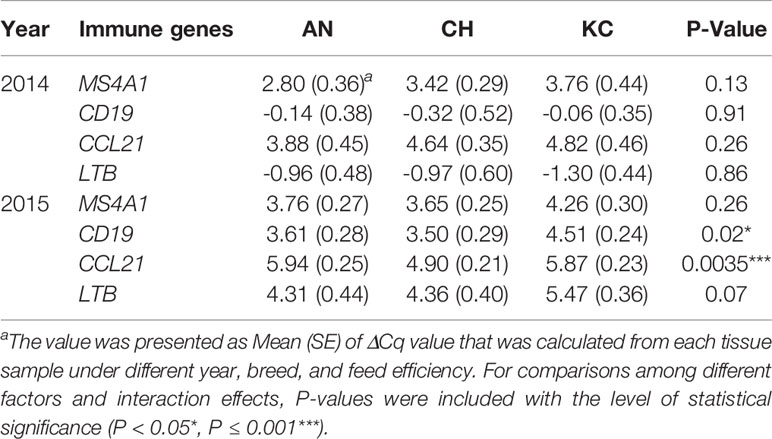
Table 4 Quantification for relative expressions of four host gene among breeds and differed RFI using qRT-PCR for rectal tissue samples collected in 2014 and 2015.
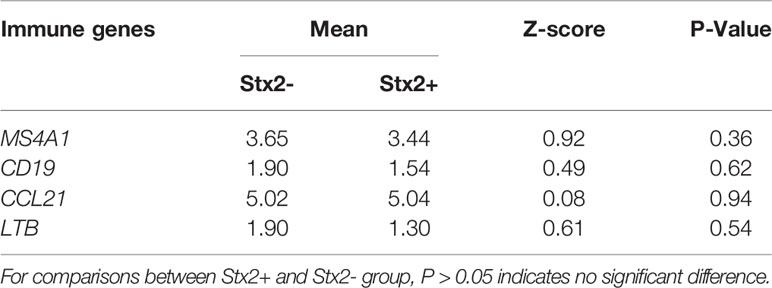
Table 5 Expression differences for four host genes between Stx2+ and Stx2- samples using non-parametric Mann-Whitney U test.
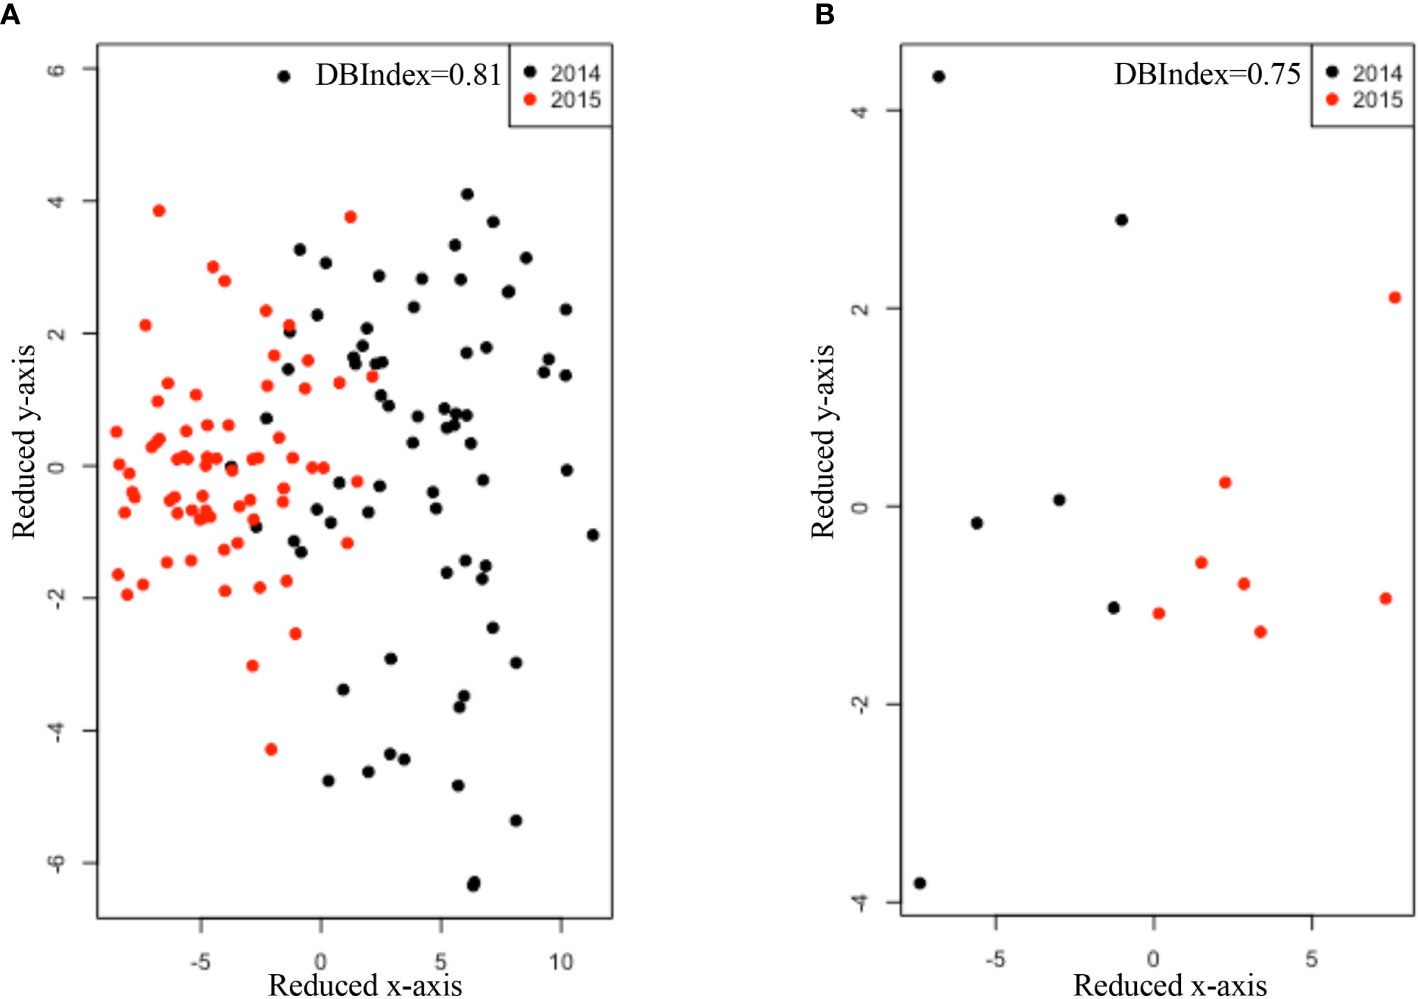
Figure 1 Comparisons of host gene expression patterns using non-parametric method Isomap and DBIndex value for sampling year effect (A) among all samples (B) as well as among Stx2+ samples. Black dots and red dots refer to samples collected in 2014 and 2015, respectively. DBIndex value was shown on the right corner of each figure. The lower DBIndex value, the well-separated cluster pattern.
Association Between Expressions of stx2 and Host Immune Genes
Expression of stx2 was negatively correlated with the expression of MS4A1 (R=-0.56, P=0.05, Table 6) and positively correlated with the expression of LTB (R=0.60, P=0.05, Table 6). Neither CD19 nor LTB clustered with Stx2+ samples but CD19 and LTB were positively correlated (R=0.98, P=0.00, Table 6). Correspondence analysis revealed that most of the samples (12 out of 13, outlier: KC14.105) grouped together in the CA plot with MS4A1 and CCL21 (Figure 2). In the correspondence analysis (CA), Dimension 1 (Dim1) represented up to 94% of the importance with CD19 and LTB contributing the most to Dim1, with Dim2 only representing 4.14% of the variation (Figure 2).
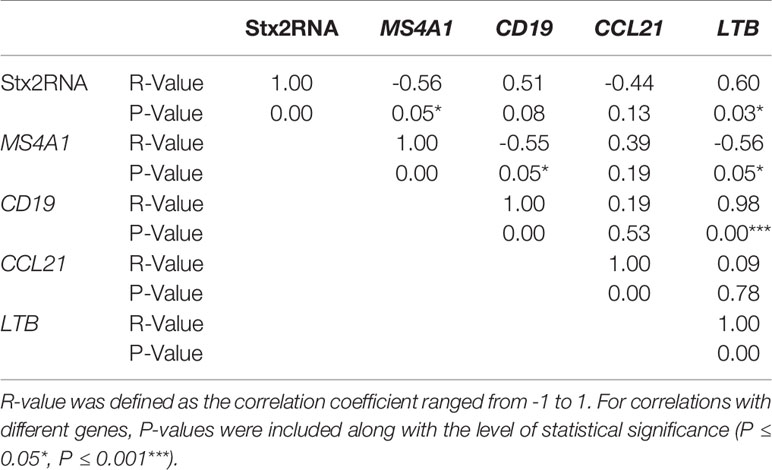
Table 6 Correlation analysis among relative expressions of host genes and stx2 expression among Stx2+ samples.
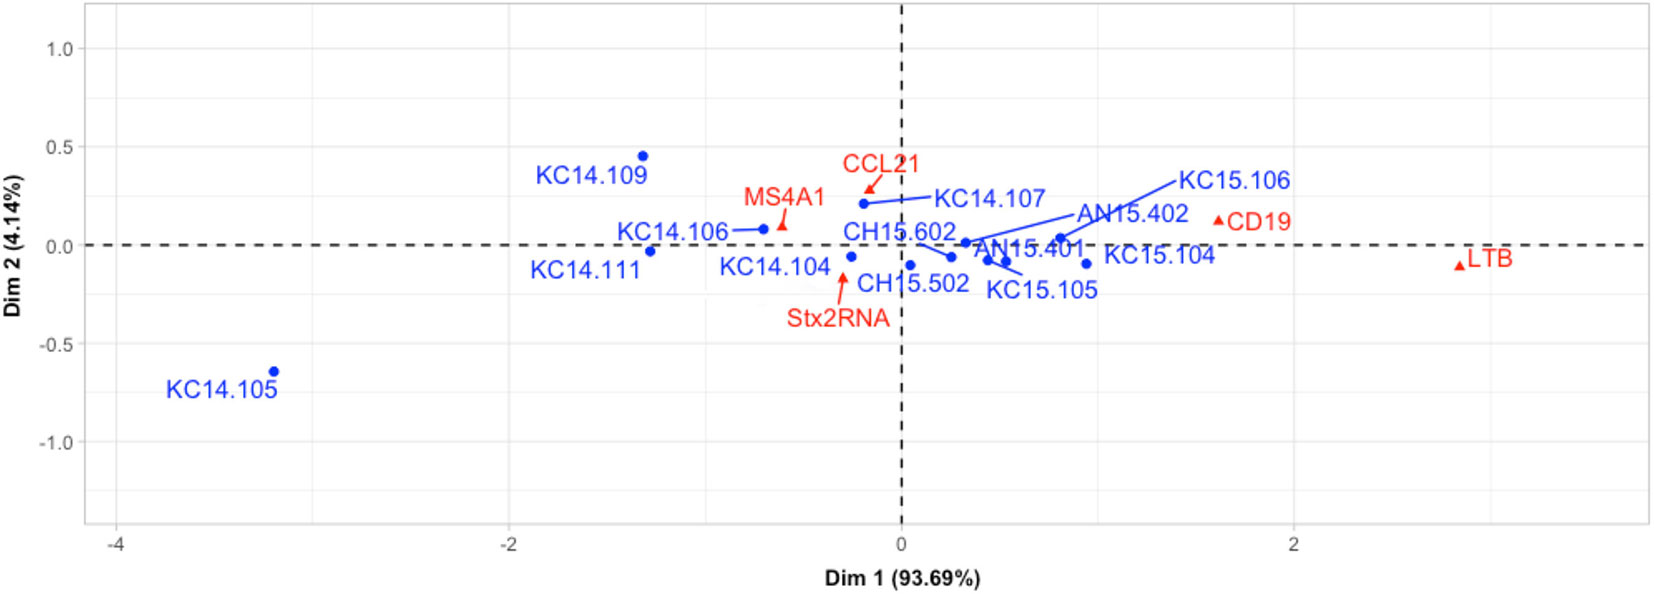
Figure 2 Assessment of associations between host immune gene expressions and Stx2+ samples using correspondence analysis. Red triangles and blue dots refer to host genes and Stx2+ samples, respectively. For example, “AN14.105” means the number of this sample is 105, breed is Angus, and was collected in 2014.
Prediction Model to Discover Potential Gene Markers for stx2 mRNA Abundance
Further analysis using a random forest model classifier based on expressions of four host immune genes MS4A1, LTB, CCL21, CD19 revealed the accuracy for predicting stx2 mRNA abundance was 96.5% for the training data and 93.6% for the validation data. The AUC value of 0.908 for the ROC curve also revealed a high accuracy and a robust prediction (Figure 3A). As an indicator of stx2 expression, the prediction accuracy of MS4A1, LTB, CCL21, CD19 was 47.55%, 45.35%, 41.44%, 36.80%, respectively. Further Boruta analysis also revealed that all four immune genes were attributes for stx2 expression, with the ranking MS4A1 > LTB = CD19 > CCL21 (Figure 3B).

Figure 3 Assessment of Random Forest model using ROC curve and Boruta method. (A) Assessment of classification performance of random forest model using area under ROC (AUC). Sensitivity (y-axis) represents the fraction of samples with positive Stx2 expression that the test correctly identifies as positive. Specificity (x-axis) represents the fraction of samples without Stx2 expression that the test correctly identifies as negative. (B) Rank of host immune genes as markers for Stx2 expression prediction using Boruta method. ○ represents the outliers in each Z-score.
Discussion
This study characterized the abundance, prevalence, and expression of the stx1 and stx2 at the recto-anal junction in feedlot steers of three breeds over 2 consecutive years. Several studies have quantified the copy number of stx1 and stx2 in cattle feces using qPCR, with estimates ranged from 0 to 5.6 log10(gene copies/g) (Imamovic and Muniesa, 2011; Verstraete et al., 2014). Our estimates of the copy number of stx1 and stx2 in contents are within these ranges, with 1.24 to 4.13 log10(gene copies/g) (year 1, stx1), 0 to 0.45 log10(gene copies/g) (year 2, stx1), 0.86 to 5.38 log10(gene copies/g) (year 1, stx2), and 4.51 to 5.09 log10(gene copies/g) (year 2, stx2). However, there was a markable difference in the copy number of stx in tissue samples when compared to RAJ contents. Stx genes associated with RAJ tissue samples ranged from 5.62 to 6.07 log10(gene copies/g) (year 1, stx2), 6.71 to 6.85 log10(gene copies/g) (year 2, stx1), and 5.61 to 5.76 log10(gene copies/g) (year 2, stx2). We speculate that the high stx copy numbers detected from tissues likely represents the higher possibility of the STEC colonization on RAJ mucosa. Indeed, a previous study has reported that the abundance of E. coli O157 strain was inconsistent between RAJ tissues and content samples (Keen et al., 2010), suggesting that Stx carrying bacteria were associated with the epithelium of RAJ in the steers in addition to their presence in digesta. Based on our results, digesta samples only present a proportion of the actual STEC that inhabit in the RAJ of cattle, with the higher population directly colonizing epithelial tissue. These suggest that it should include fecal samples together with rectal mucosa swabs or biopsies to have more accurate estimation of stx gene abundance in cattle.
Our study further revealed that the abundance and prevalence of the stx genes was affected by breed and sampling year, and such effects were stx type dependent. However, a previous study found no relationship between cattle breed and the presence of stx at the RAJ (Mir et al., 2016). The inconsistency between our and previous findings may be due to differences in breed, age [calf (Mir et al., 2016) vs. steer], and diets of the cattle. In this study, Angus, Charolais, and Kinsella Composite breeds were used to examine the abundance and prevalence of stx genes, while previous studies collected samples from hybrid Angus-Brahman beef calves (Mir et al., 2016). Steers in our study were fed a high gain diet and slaughtered at similar body weight, but still differed in stx1 and stx2 prevalence across breeds, suggesting the highly individualized response to STEC colonization. Therefore, host genetics may alter the gut environment through influences on immunity and the microbiome (Wang et al., 2018), which may influence the prevalence of STEC and the prevalence and abundance of stx genes in the samples. The observed differences between sampling years suggest that environmental factors together with host genetics impact the prevalence of the stx genes in the RAJ of steers. Higher ambient temperatures have been shown to be associated with increased prevalence of both stx1 and stx2 in the rectal mucosa of both dairy and beef cattle (Fernandez et al., 2009; Tahamtan et al., 2010). For our study, the average ambient temperatures were similar between the two years (3.25°C for 2014 vs. 5.63°C for 2015) and as a result it is unlikely to account for the difference in detection of stx1 and stx2 between years. Other ecological factors such as seasonality, water and soil sources, and factors associated with farm management may also contribute to varied STEC colonization. Future long term monitoring studies are needed to determine to what extent these environmental factors contribute to the prevalence of both stx1 and stx2 in the RAJ of cattle.
Although the presence of both stx1 and stx2 genes were detected, only expression of stx2 was found in the RAJ tissue of beef steers. Severe STEC infections that result in HUS are mostly associated with stx2 as its product is 400 times more toxic (as quantified by LD50 in mice) than the product of stx1 (Riley et al., 1983). Stx2-producing E. coli strains were reported to be in 71% (34 out of 48) of children with HUS, while only 40% (four out of 10) of patients were associated with stx1-producing E. coli strains (Ludwig et al., 2001). It is noticeable that the prevalence of stx2 gene expression in steers (8.5% for year 1, 9.7% for year 2) is similar to the reported super shedder rate [~10% (Matthews et al., 2006)], suggesting the expression of stx2 might be highly correlated with super shedding (SS) and cattle with stx2 expression might potentially be SS. Interestingly, all stx2+ samples were from KC steers in 2014,suggesting KC might be more prominent carriers of STEC and further highlighting the role of breed.
We further speculate that the stx2+ cattle may have higher colonization of STEC. As the adherence factor intimin encoded by eae gene enables STEC colonization (Farfan and Torres, 2012) and the presence of eae is correlated with the formation of attaching and effacing (A/E) lesions (Wieler et al., 1996) and E. coli O157:H7 colonization in bovine RAJ (Sheng et al., 2006), the expression of eae was also assessed in this study. The expression of eae was detected in nine out of 131 RAJ tissue samples (Data not shown). Of these, only two samples were stx2 positive. A previous study isolated 326 E. coli strains from 304 fecal samples of clinically healthy wild boars, and found that 10 samples were eae positive belonging to different E. coli strains (Alonso et al., 2017). Besides, only one stx2+ eae+ E. coli strain (E. coli O145:H28) was characterized to date and was reported to be associated with HUS in human (Alonso et al., 2017). Although the occurrence of eae, alone or in combination with stx2 is sporadic, diverse E. coli serotypes exist in beef cattle and among them certain serotypes could be potential human pathogens. Compared to previous studies only reported expressions of eae and stx from fecal samples, our study is the first to report expressions of these two genes on RAJ mucosa. The detection of stx+, eae+, and stx2+eae+ cattle suggests the importance to include all serotypes instead of only E. coli O157:H7 for future SS research in practice to the prevention of SS transmission and the mitigation of potential human infections. Future study is needed to isolate E. coli serotypes who carry stx+, eae+, and stx2+eae+ genes and evaluate their abundances in RAJ and feces of beef steers to verify whether they are SS. Although the abundance of O157 strains were not quantified in this study, our study highlights the importance to use marker genes to assess all STEC populations as opposed to only E. coli O157:H7. In addition to eae genes, Enterohemorrhagic E. coli autotransporters (Eha) A and B autotransporters that can colonize on bovine epithelia are vital adhesin factors in STEC and are higher prevalent among STEC strains (97% and 93%, respectively) (Wells et al., 2009; Easton et al., 2011). Particularly, EhaA promoted adhesion to primary epithelial cells of bovine RAJ and should be explored to identify relationships between EhaA and host immunity for fundamental understanding of host-STEC interactions and STEC colonization. Other adhesin factors that play a role in STEC colonization on bovine epithelia such as hemorrhagic coli pili (HCP), EspP rope-like fibers (Farfan and Torres, 2012) should also be explored to identify relationships between STEC adhesin factors and host immune gene expressions.
Previous studies have identified differences in the expression of MS4A1, CD19, CCL21, LTB genes at the RAJ of super-shedder vs. non-shedders (Corbishley et al., 2014; Wang et al., 2016). These genes are involved in B cell proliferation (Uchida et al., 2004), B cell receptor signaling pathway (Karnell et al., 2014), and the migration of B cells from bone narrow to lymphoid tissues (Bowman et al., 2000), as well as the induction of the inflammatory response system (Browning et al., 1995). The observed higher relative expression of CD19 (a membrane co-receptor found on all B cells) in KC steers and the higher relative expression of CCL21 in AN and KC than CH in 2015, suggests that expression of this gene in cattle is influenced by breed. Breed-driven gene expression against infections and biological processes have been explored in bovine tissues and cells. Examples include, the reduced expression of the ALDOA (Fructose-bisphosphate aldolase A) gene in the longissimus muscle of Wagyu- as compared to Piedmontese-sired offsprings (Lehnert et al., 2007), and the up-regulation of CD9 (CD9 antigen) and BoLA-DQB (BoLa Class II histocompatibility antigen, DQB*101 beta chain) in the macrophage of Sahiwal compared to Holstein cattle in response to Theileria annulate infection (Glass and Jensen, 2007). In our previous study, the variation in expression of immune genes between SS and NS, could be due to the genetic variation (Wang et al., 2016), suggesting future genome wide association studies (GWAS) are needed to identify the genotypes and/or SNPs responsible for expression of immune genes that could directly or indirectly affect STEC colonization and expression of their virulence genes.
Lymphotoxin beta (LTB) induces the immune response and is crucial for the initiation of Lymphoid follicle (ILF) development (McDonald et al., 2005). Lymphoid follicles (ILFs) in the bovine rectum are regarded as the reservoir of secretory antibodies in the gut, serving as a frontline defensive system in the gastrointestinal (GI) tract (Tsuji et al., 2008). The positive correlation between stx2 expression and relative expression of LTB suggests that cattle with higher stx2 expression have lower LTB expression, which may lead to decreased production of lymphotoxin, reduced ILF development in the RAJ. Impaired ILF has been associated with a 10 to 100-fold increase in the colonization of Enterobacteriaceae in ileum of mice (Bouskra et al., 2008), and 100-fold increase in anaerobic bacteria in the small intestine of mice (Fagarasan et al., 2002). Also, a previous study indicated that super-shedders harbor a distinct fecal microbiota compared to non-shedder (Xu et al., 2014). These suggest that changes in LTB expression could lead to impaired ILF function and altered microbiota, which could promote STEC colonization in cattle. Expression of MS4A1 was negatively correlated with stx2 expression and MS4A1 was in the dominant position of stx2+ samples from the correspondence analysis, suggesting the vital role of MS4A1 in regulating stx2 expression and partially reflecting a strengthened adaptive immunity in stx2+ cattle. MS4A1 encodes CD20 which is expressed from late pro-B cells through memory cells with its function to enable optimal B cell immune response and against T-independent antigens (Kuijpers et al., 2010). Hence, these indicate that MS4A1 is the key gene in connecting stx2 expression to host adaptive immunity, and their negative correlation suggest the establishment of host recognition mechanisms for stx2 expression.
To our knowledge, this study is the first to explore whether host gene markers were related to stx expression and potential STEC colonization using artificial intelligence-based approaches (Random Forest model and Boruta method). Based on results of mean decrease accuracy in the Random Forest Model and Boruta method and the biological functions of these four immune genes, our results highlight the relationship between host immune genes and stx2 expression. Of the genes studied, MS4A1 was the best predictor of stx2 expression and it was in the stx2+ sample cluster in the CA map. We used the non-parametric dimensionality reduction method, Isomap, to assess the relationship between the expression of host genes and stx2, and results supported the stx2 expression is closely associated with host gene expression patterns. Isomap was initially developed for computational visual perception (Tenenbaum et al., 2000) and then used to investigate ecosystem crosstalk (Mahecha et al., 2007), human disease phenotypes, and gene expression (Dawson et al., 2005). Compared to principal component analysis (PCA), this approach is less restricted since it does not require any specific distribution (i.e. normal distribution) of data (Shlens, 2014). The clustering patterns generated by PCA were similar to Isomap results, which could be due to the limited number of genes analyzed. But the Isomap approach is suitable for mammalian studies since interactions among genetics, environment, and microbes are in nature nonlinear (Nicholson et al., 2004). Regardless, our previous studies have reported 57 differential expressed genes between SS and NS (Wang et al., 2018) and many genes are interplay in cattle to affect their immunity and microbiota, the complexity of gene-gene interactions should be taken into account for future studies. Further explorations to investigate more DE genes and their interactions either at the individual or whole transcriptome level could identify and verify the predictiveness of host genes as markers of stx2 expression. In addition to the genetic background that alters the predictiveness of random forest model, mucosa attached microbes (bacteria and viruses) can also impact on host immune gene expressions which should also be considered for the future construction of the prediction model. Our previous study (Wang et al., 2018) identified relationships between RAJ mucosa-associated bacteria and expression of 19 out of 57 DE immune genes identified from SS compared to NS. Although four immune genes were not part of these 19 DE genes, future studies to include the expression of these genes are needed for the better understanding of STEC colonization and its relationship with host immune genes and model construction.
Conclusion
Taken together, our results revealed that cattle genetic background (breed) and sampling year could affect the abundance and prevalence of STEC stx1 and stx2 genes in the RAJ of feedlot cattle. We identified the relationships between stx2 expression and the expression of host immune genes, and found that stx2 expression could be driven by expression of particular host immune genes (e.g., MS4A1). Our study established a model to correlate host gene expression to stx2 expression, suggesting that its expression can be driven by the host. Although Stx detection from feces is a more direct method, the findings from this study revealed that it may not represent the true population of STEC colonized in RAJ which can be influenced by the tissue immune genes. Future studies are needed to elucidate mechanisms behind host-STEC interactions by applying methods including genome wide association studies (GWAS) that determines potential genetic variations related to host-STEC interactions and also explore digesta and mucosal attached microbiota variations to develop methods for the potential precise identification of STEC in cattle.
Data Availability Statement
The raw data supporting the conclusions of this article will be made available by the authors, without undue reservation.
Ethics Statement
The animal study was reviewed and approved by the Animal Care and Use Committee, University of Alberta.
Author Contributions
ZP and YC performed experiments. ZP, MG, and LG were involved in experimental design and methodology development. ZP, TM, MG, and LG were involved in data analysis. ZP wrote the draft manuscript. TM, MG, GP, and LG contributed to manuscript revisions. GP, TM, and LG were involved in securing the funding for the project. All authors contributed to the article and approved the submitted version.
Conflict of Interest
The authors declare that the research was conducted in the absence of any commercial or financial relationships that could be construed as a potential conflict of interest.
Acknowledgments
This study is supported by Beef Cattle Research Council (BCRC, FOS.07.17), and the authors thank Lacombe Research Centre, Drs, M. Zhou, H. Sun, F. Li as well as J. H. Liu, A. Bulumulla for their assistance in sample collection.
Supplementary Material
The Supplementary Material for this article can be found online at: https://www.frontiersin.org/articles/10.3389/fcimb.2021.633573/full#supplementary-material
References
Alonso C. A., Mora A., Díaz D., Blanco M., González-Barrio D., Ruiz-Fons F., et al. (2017). Occurrence and characterization of stx and/or eae-positive Escherichia coli isolated from wildlife, including a typical EPEC strain from a wild boar. Vet. Microbiol. 207, 69–73. doi: 10.1016/j.vetmic.2017.05.028
Bosilevac J. M., Koohmaraie M. (2012). Predicting the Presence of Non-O157 Shiga Toxin-Producing Escherichia coli in Ground Beef by Using Molecular Tests for Shiga Toxins, Intimin, and O Serogroups. Appl. Environ. Microbiol. 78 (19), 7152–7155. doi: 10.1128/aem.01508-12
Bouskra D., Brézillon C., Bérard M., Werts C., Varona R., Boneca I. G., et al. (2008). Lymphoid tissue genesis induced by commensals through NOD1 regulates intestinal homeostasis. Nature 456 (7221), 507–510. doi: 10.1038/nature07450
Bowman E. P., Campbell J. J., Soler D., Dong Z., Manlongat N., Picarella D., et al. (2000). Developmental switches in chemokine response profiles during B cell differentiation and maturation. J. Exp. Med. 191 (8), 1303–1318. doi: 10.1084/jem.191.8.1303
Browning J. L., Dougas I., Ngam-ek A., Bourdon P. R., Ehrenfels B. N., Miatkowski K., et al. (1995). Characterization of surface lymphotoxin forms. Use of specific monoclonal antibodies and soluble receptors. J. Immunol. 154 (1), 33–46. doi: 10.1074/jbc.271.15.8618
Chassagne L., Pradel N., Robin F., Livrelli V., Bonnet R., Delmas J. (2009). Detection of stx1, stx2, and eae genes of enterohemorrhagic Escherichia coli using SYBR Green in a real-time polymerase chain reaction. Diagn Microbiol Infect Dis. 64 (1), 98–101. doi: 10.1016/j.diagmicrobio.2009.01.031
Cho S., Fossler C. P., Diez-Gonzalez F., Wells S. J., Hedberg C. W., Kaneene J. B., et al. (2009). Cattle-level risk factors associated with fecal shedding of Shiga toxin-encoding bacteria on dairy farms, Minnesota, USA. Can. J. Vet. Res. = Rev. Can. Recherche Vet. 73 (2), 151–156.
Corbishley A., Ahmad N. I., Hughes K., Hutchings M. R., McAteer S. P., Connelley T. K., et al. (2014). Strain-dependent cellular immune responses in cattle following Escherichia coli O157:H7 colonization. Infect. Immun. 82 (12), 5117–5131. doi: 10.1128/IAI.02462-14
Davies D. L., Bouldin D. W. (1979). A cluster separation measure. IEEE Trans. Pattern Anal. Mach. Intell. 1 (2), 224–227. doi: 10.1109/TPAMI.1979.4766909
Dawson K., Rodriguez R. L., Malyj W. (2005). Sample phenotype clusters in high-density oligonucleotide microarray data sets are revealed using Isomap, a nonlinear algorithm. BMC Bioinf. 6 (1):195. doi: 10.1186/1471-2105-6-195
Easton D., Totsika M., Allsopp L., Phan M.-D., Idris A., Wurpel D., et al. (2011). Characterization of EhaJ, a New Autotransporter Protein from Enterohemorrhagic and Enteropathogenic Escherichia coli. Front. Microbiol. 2 (120), 1–9. doi: 10.3389/fmicb.2011.00120
Fagarasan S., Muramatsu M., Suzuki K., Nagaoka H., Hiai H., Honjo T. (2002). Critical Roles of Activation-Induced Cytidine Deaminase in the Homeostasis of Gut Flora. Science 298 (5597), 1260–1267. doi: 10.1126/science.1077336
Farfan M. J., Torres A. G. (2012). Molecular mechanisms that mediate colonization of Shiga toxin-producing Escherichia coli strains. Infect. Immun. 80 (3), 903–913. doi: 10.1128/iai.05907-11
Fernandez D., Rodriguez E. M., Arroyo G. H., Padola N. L., Parma A. E. (2009). Seasonal variation of Shiga toxin-encoding genes (stx) and detection of E. coli O157 in dairy cattle from Argentina. J. Appl. Microbiol. 106 (4), 1260–1267. doi: 10.1111/j.1365-2672.2008.04088.x
Fuller C. A., Pellino C. A., Flagler M. J., Strasser J. E., Weiss A. A. (2011). Shiga toxin subtypes display dramatic differences in potency. Infect. Immun. 79 (3), 1329–1337. doi: 10.1128/IAI.01182-10
Glass E. J., Jensen K. (2007). Resistance and susceptibility to a protozoan parasite of cattle–gene expression differences in macrophages from different breeds of cattle. Vet. Immunol. Immunopathol. 120 (1-2), 20–30. doi: 10.1016/j.vetimm.2007.07.013
Han H., Guo X., Yu H. (2016) Variable selection using Mean Decrease Accuracy and Mean Decrease Gini based on Random Forest. 2016 7th IEEE International Conference on Software Engineering and Service Science (ICSESS), 219–224. doi: 10.1109/ICSESS.2016.7883053
He L., Simpson D. J., Gänzle M. G. (2020). Detection of enterohaemorrhagic Escherichia coli in food by droplet digital PCR to detect simultaneous virulence factors in a single genome. Food Microbiol. 90, 103466. doi: 10.1016/j.fm.2020.103466
Imamovic L., Muniesa M. (2011). Quantification and evaluation of infectivity of shiga toxin-encoding bacteriophages in beef and salad. Appl. Environ. Microbiol. 77 (10), 3536–3540. doi: 10.1128/AEM.02703-10
Johikumar N., Griffiths M. W. (2002). Rapid detection of Escherichia coli O157:H7 with multiplex real-time PCR assays. Appl. Environ. Microbiol. 68 (6), 3169–3171. doi: 10.1128/aem.68.6.3169-3171.2002
Karmali M., Petric M., Steele B., Lim C. (1983). Sporadic cases of haemolytic-uraemic syndrome associated with faecal cytotoxin and cytotoxin-producing Escherichia coli in stools. Lancet 321 (8325), 619–620. doi: 10.1016/S0140-6736(83)91795-6
Karnell J. L., Dimasi N., Karnell F. G., Fleming R., Kuta E., Wilson M., et al. (2014). CD19 and CD32b differentially regulate human B cell responsiveness. J. Immunol. 192 (4), 1480–1490. doi: 10.4049/jimmunol.1301361
Keen J. E., Laegreid W. W., Chitko-McKown C. G., Durso L. M., Bono J. L. (2010). Distribution of Shiga-toxigenic Escherichia coli O157 in the gastrointestinal tract of naturally O157-shedding cattle at necropsy. Appl. Environ. Microbiol. 76 (15), 5278–5281. doi: 10.1128/AEM.00400-10
Kuijpers T. W., Bende R. J., Baars P. A., Grummels A., Derks I. A., Dolman K. M., et al. (2010). CD20 deficiency in humans results in impaired T cell-independent antibody responses. J. Clin. Invest. 120 (1), 214–222. doi: 10.1172/JCI40231
Kursa M. B., Rudnicki W. R. (2010). Feature Selection with the Boruta Package 36. J. Stat. Softw. 11, 13. doi: 10.18637/jss.v036.i11
Lee M. S., Tesh V. L. (2019). Roles of Shiga Toxins in Immunopathology. Toxins (Basel) 11 (4), 212. doi: 10.3390/toxins11040212
Lehnert S. A., Reverter A., Byrne K. A., Wang Y., Nattrass G. S., Hudson N. J., et al. (2007). Gene expression studies of developing bovine longissimus muscle from two different beef cattle breeds. BMC Dev. Biol. 7:95. doi: 10.1186/1471-213X-7-95
Li M., Penner G. B., Hernandez-Sanabria E., Oba M., Guan L. L. (2009). Effects of sampling location and time, and host animal on assessment of bacterial diversity and fermentation parameters in the bovine rumen. J. Appl. Microbiol. 107 (6), 1924–1934. doi: 10.1111/j.1365-2672.2009.04376.x
Ludwig K., Karmali M. A., Sarkim V., Bobrowski C., Petric M., Karch H., et al. (2001). Antibody response to Shiga toxins Stx2 and Stx1 in children with enteropathic hemolytic-uremic syndrome. J. Clin. Microbiol. 39 (6), 2272–2279. doi: 10.1128/JCM.39.6.2272-2279.2001
Mahecha M. D., Martínez A., Lischeid G., Beck E. (2007). Nonlinear dimensionality reduction: Alternative ordination approaches for extracting and visualizing biodiversity patterns in tropical montane forest vegetation data. Ecol. Inf. 2 (2), 138–149. doi: 10.1016/j.ecoinf.2007.05.002
Majowicz S. E., Scallan E., Jones-Bitton A., Sargeant J. M., Stapleton J., Angulo F. J., et al. (2014). Global incidence of human Shiga toxin-producing Escherichia coli infections and deaths: a systematic review and knowledge synthesis. Foodborne Pathog. Dis. 11 (6), 447–455. doi: 10.1089/fpd.2013.1704
Malmuthuge N., Li M., Goonewardene L. A., Oba M., Guan L. L. (2013). Effect of calf starter feeding on gut microbial diversity and expression of genes involved in host immune responses and tight junctions in dairy calves during weaning transition. Journal of dairy science 96 (5), 3189–3200. doi: 10.3168/jds.2012-6200
Mangiafico S. (2020). Summary and analysis of extension program evaluation. New Brunswick, NJ, USA: Rutgers Cooperative Extension. 125, 16–22.
Matthews L., McKendrick I. J., Ternent H., Gunn G. J., Synge B., Woolhouse M. E. (2006). Super-shedding cattle and the transmission dynamics of Escherichia coli O157. Epidemiol. Infect. 134 (1), 131–142. doi: 10.1017/S0950268805004590
McDonald K. G., McDonough J. S., Newberry R. D. (2005). Adaptive immune responses are dispensable for isolated lymphoid follicle formation: antigen-naive, lymphotoxin-sufficient B lymphocytes drive the formation of mature isolated lymphoid follicles. J. Immunol. 174 (9), 5720–5728. doi: 10.4049/jimmunol.174.9.5720
Melton-Celsa A. R. (2014). Shiga Toxin (Stx) Classification, Structure, and Function. Microbiol. Spectr. 2 (4), 1–13. doi: 10.1128/microbiolspec.EHEC-0024-2013
Mir R. A., Weppelmann T. A., Elzo M., Ahn S., Driver J. D., Jeong K. C. (2016). Colonization of Beef Cattle by Shiga Toxin-Producing Escherichia coli during the First Year of Life: A Cohort Study. PloS One 11 (2), e0148518. doi: 10.1371/journal.pone.0148518
Nicholson J. K., Holmes E., Lindon J. C., Wilson I. D. (2004). The challenges of modeling mammalian biocomplexity. Nat. Biotechnol. 22 (10), 1268–1274. doi: 10.1038/nbt1015
Panel E. B., Koutsoumanis K., Allende A., Alvarez‐Ordóñez A., Bover‐Cid S., Chemaly M., et al. (2020). Pathogenicity assessment of Shiga toxin-producing Escherichia coli (STEC) and the public health risk posed by contamination of food with STEC. EFSA J. 18 (1), e05967. doi: 10.2903/j.efsa.2020.5967
Petro C. D., Trojnar E., Sinclair J., Liu Z. M., Smith M., O’Brien A. D., et al. (2019). Shiga Toxin Type 1a (Stx1a) Reduces the Toxicity of the More Potent Stx2a In Vivo and In Vitro. Infect. Immun. 87 (4), e00787–18. doi: 10.1128/IAI.00787-18
Riley L. W., Remis R. S., Helgerson S. D., McGee H. B., Wells J. G., Davis B. R., et al. (1983). Hemorrhagic colitis associated with a rare Escherichia coli serotype. N. Engl. J. Med. 308 (12), 681–685. doi: 10.1056/NEJM198303243081203
Ringrose T. J. (1992). Bootstrapping and correspondence analysis in archaeology. J. Archaeological Sci. 19 (6), 615–629. doi: 10.1016/0305-4403(92)90032-X
Scallan E., Hoekstra R. M., Angulo F. J., Tauxe R. V., Widdowson M. A., Roy S. L., et al. (2011). Foodborne illness acquired in the United States–major pathogens. Emerg. Infect. Dis. 17 (1), 7–15. doi: 10.3201/eid1701.P11101
Sheng H., Lim J. Y., Knecht H. J., Li J., Hovde C. J. (2006). Role of Escherichia coli O157: H7 virulence factors in colonization at the bovine terminal rectal mucosa. Infect. Immun. 74 (8), 4685–4693. doi: 10.1128/IAI.00406-06
Shlens J. (2014). A tutorial on principal component analysis. Preprint at https://arxiv.org/abs/1404.1100 (2014)
Tahamtan Y., Hayati M., Namavari M. (2010). Prevalence and distribution of the stx, stx genes in Shiga toxin producing E. coli (STEC) isolates from cattle. Iran J. Microbiol. 2 (1), 8–13.
Tekaia F. (2016). Genome Data Exploration Using Correspondence Analysis. Bioinf. Biol. Insights 10, 59–72. doi: 10.4137/BBi.s39614
Tenenbaum J. B., de Silva V., Langford J. C. (2000). A global geometric framework for nonlinear dimensionality reduction. Science 290 (5500), 2319–2323. doi: 10.1126/science.290.5500.2319
Tsuji M., Suzuki K., Kitamura H., Maruya M., Kinoshita K., Ivanov I. I., et al. (2008). Requirement for lymphoid tissue-inducer cells in isolated follicle formation and T cell-independent immunoglobulin A generation in the gut. Immunity 29 (2), 261–271. doi: 10.1016/j.immuni.2008.05.014
Uchida J., Lee Y., Hasegawa M., Liang Y., Bradney A., Oliver J. A., et al. (2004). Mouse CD20 expression and function. Int. Immunol. 16 (1), 119–129. doi: 10.1093/intimm/dxh009
Verstraete K., Van Coillie E., Werbrouck H., Van Weyenberg S., Herman L., Del-Favero J., et al. (2014). A qPCR assay to detect and quantify Shiga toxin-producing E. coli (STEC) in cattle and on farms: a potential predictive tool for STEC culture-positive farms. Toxins (Basel) 6 (4), 1201–1221. doi: 10.3390/toxins6041201
Wang O., Liang G., McAllister T. A., Plastow G., Stanford K., Selinger B., et al. (2016) Comparative Transcriptomic Analysis of Rectal Tissue from Beef Steers Revealed Reduced Host Immunity in Escherichia coli O157:H7 Super-Shedders. PLOS ONE 11 (3), e0151284. doi: 10.1371/journal.pone.0151284
Wang O., McAllister T. A., Plastow G., Stanford K., Selinger B., Guan L. L. (2018). Interactions of the Hindgut Mucosa-Associated Microbiome with Its Host Regulate Shedding of Escherichia coli O157:H7 by Cattle. Appl. Environ. Microbiol. 84 (1), e01738–17. doi: 10.1128/AEM.01738-17
Wells T. J., McNeilly T. N., Totsika M., Mahajan A., Gally D. L., Schembri M. A. (2009). The Escherichia coli O157:H7 EhaB autotransporter protein binds to laminin and collagen I and induces a serum IgA response in O157:H7 challenged cattle. Environ. Microbiol. 11 (7), 1803–1814. doi: 10.1111/j.1462-2920.2009.01905.x
Wieler L. H., Vieler E., Erpenstein C., Schlapp T., Steinrück H., Bauerfeind R., et al. (1996). Shiga toxin-producing Escherichia coli strains from bovines: association of adhesion with carriage of eae and other genes. J. Clin. Microbiol. 34 (12), 2980–2984. doi: 10.1128/JCM.34.12.2980-2984.1996
Xu Y., Dugat-Bony E., Zaheer R., Selinger L., Barbieri R., Munns K., et al. (2014). Escherichia coli O157:H7 super-shedder and non-shedder feedlot steers harbour distinct fecal bacterial communities. PloS One 9 (5), e98115. doi: 10.1371/journal.pone.0098115
Yu Z., Morrison M. (2004). Improved extraction of PCR-quality community DNA from digesta and fecal samples. Biotechniques 36 (5), 808–812. doi: 10.2144/04365ST04
Keywords: Stx gene, cattle breed, host immune genes, random forest model, Boruta algorithm
Citation: Pan Z, Chen Y, McAllister TA, Gänzle M, Plastow G and Guan LL (2021) Abundance and Expression of Shiga Toxin Genes in Escherichia coli at the Recto-Anal Junction Relates to Host Immune Genes. Front. Cell. Infect. Microbiol. 11:633573. doi: 10.3389/fcimb.2021.633573
Received: 25 November 2020; Accepted: 15 February 2021;
Published: 17 March 2021.
Edited by:
Fangkun Wang, Shandong Agricultural University, ChinaReviewed by:
Nora Lía Padola, National University of Central Buenos Aires, ArgentinaYanwen Xiong, National Institute for Communicable Disease Control and Prevention (China CDC), China
Chitrita Debroy, Pennsylvania State University (PSU), United States
Analía Inés Etcheverría, National University of Central Buenos Aires, Argentina
Copyright © 2021 Pan, Chen, McAllister, Gänzle, Plastow and Guan. This is an open-access article distributed under the terms of the Creative Commons Attribution License (CC BY). The use, distribution or reproduction in other forums is permitted, provided the original author(s) and the copyright owner(s) are credited and that the original publication in this journal is cited, in accordance with accepted academic practice. No use, distribution or reproduction is permitted which does not comply with these terms.
*Correspondence: Le Luo Guan, lguan@ualberta.ca