On the Robustness of Annual Daily Precipitation Maxima Estimates Over Monsoon Asia
 Phuong-Loan Nguyen
 Margot Bador
 Lisa V. Alexander
 Todd P. Lane
 Chris C. Funk
- 1Climate Change Research Centre and Australian Research Council Centre of Excellence for Climate Extremes, UNSW Sydney, Sydney, NSW, Australia
- 2Australian Research Council Centre of Excellence for Climate Extremes, School of Earth Science, The University of Melbourne, Melbourne, VIC, Australia
- 3US Geological Survey, Centre for Earth Resources Observation and Science, Sioux Falls, SD, United States
- 4Santa Barbara Climate Hazard Centre, University of California, Santa Barbara, Santa Barbara, CA, United States
Understanding precipitation extremes over Monsoon Asia is vital for water resource management and hazard mitigation, but there are many gaps and uncertainties in observations in this region. To better understand observational uncertainties, this study uses a high-resolution validation dataset to assess the consistency of the representation of annual daily precipitation maxima (Rx1day) over land in 13 observational datasets from the Frequent Rainfall Observations on Grids (FROGS) database. The FROGS datasets are grouped into three categories: in situ-based and satellite-based with and without corrections to rain gauges. We also look at three sub-regions: Japan, India, and the Maritime Continent based on their different station density, orography, and coastal complexity. We find broad similarities in spatial and temporal distributions among in situ-based products over Monsoon Asia. Satellite products with correction to rain gauges show better general agreement and less inter-product spread than their uncorrected counterparts. However, this comparison also reveals strong sub-regional differences that can be explained by the quantity and quality of rain gauges. High consistency in spatial and temporal patterns are observed over Japan, which has a dense station network, while large inter-product spread is found over the Maritime Continent and India, which have sparser station density. We also highlight that while corrected satellite products show improvement compared to uncorrected products in regions of high station density (e.g., Japan) they have mixed success over other regions (e.g., India and the Maritime Continent). In addition, the length of record available at each station can also affect the satellite correction over these poorly sampled regions. Results of the additional comparison between all considered datasets and the sub-regional high resolution dataset remain the same, indicating that the overall quality of the station network has implications for the reliability of the in situ-based products derived and also the satellite products that use a correction to in situ data. Given these uncertainties in observations, there is no single best dataset for assessment of Rx1day in Monsoon Asia. In all cases we recommend users understand how each dataset is produced in order to select the most appropriate product to estimate precipitation extremes to fit their purpose.
Introduction
Asia is home to about 60% of the world's population and is the largest and most populous continent in the world (Hijioka et al., 2014). The extensive Asian monsoon system which spans South Asia, Southeast Asia, and East Asia plays an important role in large scale climate variability over much of the globe. This region is vulnerable to extreme weather, notably extreme precipitation (Fujibe et al., 2006; Jung et al., 2011; Zhao et al., 2014; Ren et al., 2015; Roxy et al., 2017). To monitor and understand the change and risk from precipitation extremes in Asian countries, accurate and reliable precipitation observations are required.
Numerous observational products are now available in a consistent format from the Frequent Rainfall Observations on GridS (FROGS) database (Roca et al., 2019), enabling easier intercomparisons. The FROGS database contains a variety of observational daily gridded precipitation datasets that have all been interpolated onto a common 1°x1° grid. These products differ in their data sources (e.g., in situ, satellite and blended sources) and the methods by which they are produced, and they have different spatial coverage (regional to global). In situ precipitation products have been developed solely from station (gauge) observations, which are typically used to measure precipitation at a point. Many stations have very long records, and this is an advantage for detecting climate trends. However, in situ data have disadvantages, including incomplete spatial coverage, deficiencies over most oceanic regions and sparsely populated areas (Kidd et al., 2017) and they are not normally representative of rainfall (especially convective rainfall) over a broader area. As discussed in the data section, there are also complexities associated with gauge undercatch correction (Legates and Willmott, 1990). Satellite observations, on the other hand, offer advances in terms of spatial coverage and temporal completeness for vast areas of the globe, but have records that are much shorter and inhomogeneous due to different instruments used through time and potential algorithm changes in how estimates are calculated. In addition, precipitation from satellite-based products are instantaneous and indirect measures inferred from infrared (IR) or passive microwave (PMW). IR observations can see clouds but not precipitation, and IR estimates must link cloud-top temperature or reflectivity to rain rates through empirical relationships. PMW observations, on the other hand, can detect the radiation from hydrometeors, but PMW observations are sparse and intermittent. Both IR and PMW data streams rely on changing constellations of satellites that require additional data processing and calibration. These factors are major sources of uncertainty and error (Iguchi et al., 2009; Tapiador et al., 2012). Many attempts have been made to merge different sources of information to utilize the advantages of individual types of products. For example, multiple satellite fields are merged and/or scaled with rain gauge analyses over land, which helps improve the accuracy of precipitation measurements (Sun et al., 2018). Popular products used in climate studies, such as the Global Precipitation Climatology Project (GPCP) precipitation analysis, merge gauge observations with satellite microwave data and infrared radar (IR). The launch of precipitation radars in some satellite measurements, for example over the Tropical Rainfall Measuring Mission (TRMM) (Huffman et al., 2007) helps capture the three-dimensional structure of rain. In particular, the long-term TRMM on-board radar had obvious advantages for detecting the heavy precipitation that is associated with distinct orographic features and coastal effects (Shige et al., 2013, 2015, 2017). Other products such as CMORPH (Xie et al., 2017) and version 6 of the Global Precipitation Mission (GPM) Integrated Multi-Satellite Retrievals for GPM (IMERG) (Huffman et al., 2019, 2020) use a “morphing” based approach to estimate precipitation. Sparse and intermittent PMW observations are used to derive instantaneous rain rates, which are then combined with motion vectors to derive a detailed two-dimensional rain rate structure that covers every location.
Precipitation extremes estimated from these numerous datasets present a heterogeneous picture at both regional [e.g., Australia (Contractor et al., 2015), Europe (Prein and Gobiet, 2017), the United States (Beck et al., 2019), South-East Asia (Kim et al., 2018), and global (Herold et al., 2016a,b; Alexander et al., 2020; Bador et al., 2020)] scales owing to their different data sources, quality control schemes, and procedures in how precipitation estimates are calculated. At the global scale, in situ products are most similar to each other in their representation of extreme precipitation compared to other product types (Herold et al., 2016b; Sun et al., 2018). In addition, and as expected, satellite products that use rain gauge corrections show a better agreement with in situ-based observations than uncorrected satellite products (Alexander et al., 2020; Bador et al., 2020). The specific details of the gauge-satellite blending process, however, can have important ramifications for product performance. Satellite estimates having relatively low mean bias are less likely to experience non-stationary systematic errors and spurious trends associated with shifts in gauge network (Maidment et al., 2015).
Very few studies, however, have examined the consistency in how different observational products represent precipitation extremes over the Asian domain. One exception is Kim et al. (2018) who conducted an intercomparison of precipitation across different observational products (and in an ensemble of models) with only a minor focus on extremes. They examined the spatial-temporal characteristics of rainfall exceeding the 95th percentile threshold across 7 gridded in situ, satellite and reanalysis daily precipitation products. Their results revealed small differences among the datasets over India, Korea and Japan but large differences over Southeast Asian countries and the Maritime Continent. In addition, they found that decadal trends in extreme precipitation are consistent over some parts of South Asia (e.g., India) and East Asia (e.g., South Korea, Japan) while no trend in precipitation extremes was found over Southeast Asia (e.g., the Maritime Continent). However, the study focused on only a small subset of available products and on a limited aspect of “moderate extremes” of precipitation. Therefore, there are still many gaps in our understanding of the representation and analysis of observed precipitation extremes over Monsoon Asia. These better understanding will help to better inform data development and others research activities like model evaluation, monitoring, and projections etc.
For this study, we conduct an intercomparison of various existing observational products to evaluate their consistency in terms of representing the annual maxima of daily precipitation (Rx1day) over Monsoon Asia, in terms of their climatology and trends. We chose to focus on Rx1day because this metric represents an annual extreme value that is often used to infer potential flooding events (Lestari et al., 2019). Supplemental results examine the annual wettest 5-days period (Rx5day), the annual sum of precipitation on wet days (PRCPTOT), the simple daily intensity index (SDII) and the annual total count of days when daily precipitation exceeds 10 mm (R10mm). Our objective is to better understand observational uncertainties from different data sources and over different sub-regions of Monsoon Asia. We do this by investigating the influence of the underlying station density and correction methods that satellites use to estimate precipitation on the consistency of annual maxima of daily precipitation. Finally, we make recommendations for the regional assessment of precipitation extremes over Monsoon Asia and its sub-regions.
The remainder of the paper is organized as follows. Section data and methods describes the observational datasets used in this study along with the definition of precipitation extremes and the description of the methods used. Results on the comparison of precipitation extremes from different datasets is presented in section results, followed by our discussion of results in section discussion and our conclusions in section 5.
Data and Methods
Observational Datasets and Domain
At present, there are many precipitation datasets available, including those from the FROGS database (Roca et al., 2019). This database has been developed recently to provide a variety of gridded observational precipitation datasets from in situ, satellite, blended and reanalyses sources on a common daily 1°x1° latitude/longitude grid format mostly covering global land and/or ocean. Here we utilize 13 products from FROGS (Table 1) which have sufficient coverage over our chosen Asian domain (600E-1500E; 150S-500N) and a suitable length of record for this analysis (see below). We do not include reanalyses, which generally have uncertainties that are too large to support the analysis of precipitation extremes (Alexander et al., 2020; Bador et al., 2020). Besides, they are not purely observations, but observation data assimilated into numerical models. Therefore, precipitation information in reanalysis is of questionable quality since it relies, almost entirely, on the parameterization of convection and simulation of rainfall in numerical models and is not constrained by precipitation observations (Bosilovich et al., 2011; Dee et al., 2011). In addition, some product “families” include more than one dataset, but we select only one dataset from each product family where we believe that either the best quality control has been applied or where one dataset is deemed preferable for the purposes of this study.
Table 1. List of observational datasets of daily precipitation used in this study.
To intercompare datasets with respect to product types, we cluster the 13 products into three groups organized by data type: in situ-based (three datasets); satellite with (six datasets) and without (four datasets) a correction to rain gauges. The products range in the time period covered, from 13 years (GSMAP-RNL) to 67 years (REGEN_ALL). All products share the common overlapping period of 2001–2013, which is therefore used to intercompare climatologies between the different datasets.
Additionally, we include the 0.50 × 0.50 gridded precipitation dataset: Asian Precipitation—Highly Resolved Observational Data Integration Towards Evaluation of Water Resources (APHRODITE) (Yatagai et al., 2012). This continental-scale daily product contains a dense network of daily rain gauge data for Asia obtained from different sources: Global Telecommunication System (GTS) based data, data precompiled by other projects or regional organizations and APHRODITE's own collection. Various versions of the product have been developed including: V1101, V1101_EXR1, V1801, and V1901. Note that the newest version of APHRODITE, V1901, that applies updated algorithms has been released, but it only covers the period 1998–2017. Therefore, for this study we merged version V1101 (covering 1950-2007) and V1101_EXR1 (covering 2008–2015) to get as long a record as possible. Two versions of this dataset were merged to get the longest covered period (1950–2005). We acknowledge that this regional dataset is not necessarily “the truth,” but with the extensive exchange of real time data from these national hydrological and meteorological services, APHRODITE has a substantially improved station precipitation network in many parts of Asia, notably around the Himalayas, Southeast Asia, and mountainous regions compared to other available global precipitation datasets (see Figure 2 and further discussion on this in section climatology of the mean daily precipitation). Therefore, in this study we use APHRODITE as a reference dataset with which to compare the 13 precipitation products we have accessed from FROGS. In order to enable a fair comparison, the daily precipitation data from APHRODITE were interpolated using a first-order area-conservative remapping method (Jones, 1999) to the same 1°x1° resolution as the other datasets. This interpolation method conserves the integral of precipitation that does not necessarily hold for other remapping methods. Then extreme precipitation indices outlined in the next section were then calculated.
Wind and evaporation effects on gauge measurements, typically resulting in gauge undercatch is one of the dominant errors in precipitation estimates over high-latitude and mountainous areas (Prein and Gobiet, 2017). Several observational datasets are corrected for gauge-precipitation undercatch (see Table 1). The applied correction method, however, varies from one product to another. For example, a bulk correction factor (Legates and Willmott, 1990) usually was applied to monthly climatological means in GPCP_CDR (Huffman et al., 2001) and IMERG_FC (Huffman et al., 2019). Note that APHRODITE does not apply a gauge-undercatch correction, but rather uses an improved quality-control method and orographic correction of precipitation.
Our domain covers a large area with a heterogeneous distribution in the number of gauges per 1°x1° grid, as extracted from APHRODITE (Figure 2e and also Supplementary Figure 1 for a zoom in). We also defined different station density (s) following categories: rare (0 <s <1); low (1 ≤ s < 5), medium (5≤ s <10), and high (s ≥ 10) to try to better quantify this heterogeneity. To account for spatial-temporal variations in the characteristics of precipitation extremes, we investigate several sub-regions in more detail, namely: Japan (1290E-1460E; 300N-460N); the Maritime Continent (950E-1500E;100S-100N); and India (700E-900E; 50N-250N) (Supplementary Figure 1) for further analyses. These three sub-regions cover a large area of land with very different station density and spatial characteristics such as orography and coastal complexity. We chose these regions because they provide a good representation of different extreme rainfall estimation challenges. Japan has a very dense in situ gauge network. Indian and the Maritime Continent are poorly instrumented.
APHRODITE lacks good station coverage over India and the Maritime Continent (Supplementary Figure 1). At more local scales, the Southeast Asian Climate Assessment and Dataset (SACA&D) (Van Den Besselaar et al., 2017) and the high resolution long-term India Meteorological Department (IMD) (Pai et al., 2014) dataset might provide better precipitation estimates in these regions since they have much more station information than the products we have assessed over the wider region. Therefore, we conduct additional comparison between all the products from Table 1 and these local datasets (Supplementary Part). Note that the local datasets are at 0.25° × 0.25° resolution and contain only precipitation information for Indonesia and India. To enable a fair comparison with the other products analyzed here, SACA&D and IMD were interpolated into a common 1° × 1° grid using a conservative remapping method.
Precipitation Extremes
Note that most regional precipitation extremes of monsoon Asia are associated with Asian summer monsoon circulation features. However, to characterize extreme precipitation, we select the annual maximum 1-day precipitation (Rx1day) as recommended by the Expert Team on Climate Change and Detection Indices (ETCCDI) (Zhang et al., 2011) from each 10x10 grid box. This index represents the type of extreme event that might lead to flooding for example (You et al., 2011; Liu et al., 2014). In addition, most the annual daily precipitation maxima do actually mostly reflect the summer precipitation maxima [whether that is Northern Hemisphere summer (June, July, August, and September for the “mainland” of monsoon Asia) or Southern Hemisphere summer (December, January, and February for Southeast Asia)] (Figure not shown). We also extract other precipitation indices [i.e., the maximum 5-days precipitation (Rx5day), the simple daily intensity (SDII), the total annual wet-day precipitation (PRCPTOT) and the annual counts of day when precipitation exceeds 10 mm (R10mm)]. Analysis of these are found in the Supplementary Material.
We use some basic statistics including an assessment of the climatology over the longest overlapping period of data (i.e., 2001–2013); and time series of regional averages for the whole period of available data (which varies by observational product—see Table 1). Note that time series of regional averages are calculated relative to the Rx1day annual average over the 1961–1990 baseline period in APHRODITE. Only areas that have common data between all datasets are used to calculate area-averaged time series. In order to draw conclusions about inter-product spread, the coefficient of variation (cov) (i.e., standard deviation normalized by the multiproduct mean of climatology for each cluster is calculated over the common period of 2001–2013).
Finally, we compare trends and temporal correlations over 1988–2013 for each product that covers this (longer) period and has a sufficient amount of non-missing data (i.e., 70% of data has to be present for an annual value to be calculated). Therefore, all satellite products are excluded except the CHIRP2 family, which have temporal coverage from 1981 to 2016 (see Table 1). Since some annual extremes do not follow a Gaussian distribution, we use a non-parametric linear trend estimator, Sen's slope (Sen, 1968). Trend significance is estimated using a Mann-Kendall test at the 5% level of significance (Kendall, 1975).
Results
Climatology of the Mean Daily Precipitation
Figure 1 illustrates the spatial distribution of the 13-years mean (2001–2013) of daily precipitation in the APHRODITE dataset over different regions of monsoon Asia. Clearly, the precipitation pattern is strongly dependent on orography. In particular, large amounts of precipitation are located in the western Ghats of India, central and northeast of India (South Asia), the coastline of Myanmar (Southeast Asia), and parts of Japan. This heavy orographic rainfall is on the windward side of high-elevation regions and the rapid decrease of rainfall is observed on the leeward side of these regions. This feature has been mentioned in previous literature (Krishnan et al., 2012; Pai et al., 2014; Priya et al., 2016; Kim et al., 2018). In addition, there is heavy rainfall over Eastern China, Korea while lower intensities of daily precipitation are observed over the Tibetan Plateau and higher latitudes of Asia.
Figure 1. Climatology of the annual daily precipitation (mm/day) extracted from APHRODITE. Black boxes show the regions used in this document: Japan (129°E-146°E, 30°N-46°N), India (70°E-92°E, 5°N-25°N), and the Maritime Continent (95°E-150°E, 10°S-10°N).
Climatology, Inter-Product Spread, and Trends in Rx1day
Precipitation in in situ-based products are directly estimated from surface stations and therefore different datasets often share similar underlying data (Sun et al., 2018). For this reason, we start with a comparison among in situ-based products to see whether there is consistency in their representation of precipitation extremes. Figure 2a shows a 13-years climatology (2001–2013) for Rx1day (mm) in the APHRODITE dataset (taken as reference; see section observational datasets and domain) and the relative difference (%) for three of the available in situ-based products from the FROGS database compared with APHRODITE (Figures 2b–d). Intense extreme rainfall (i.e., Rx1day > 150 mm) is found in Japan, South Korea, and the western coastal part of India while lower intensities of extreme precipitation are observed over the Tibetan Plateau and higher latitudes of Asia (Figure 2a). Overall, in situ-based products tend to show spatially coherent patterns of extreme precipitation difference compared to APHRODITE, that is, they are consistently wetter almost everywhere. This feature can not only be seen in other intensity-based indices such as Rx5day, PRCPTOT, and SDII but also in frequency-based indices like R10mm (Supplementary Figures 3–6).
Figure 2. Upper panel: Climatological values (over the period of 2001–2013) of the annual wettest-day (Rx1day; in mm) for (a) APHRODITE and the relative difference to APHRODITE (in %) of climatological Rx1day for the in situ-based products (blue labels): (b) REGEN_ALL (c) GPCC_FDD, (d) CPC. The number inserted on each panel indicates the regional average of these relative differences. Middle panel: Climatological station density in each in situ-based dataset: averaged number of rain gauges per 1°x1° grid cell over the 2001–2013 period in (e) APHRODITE, (f) REGEN_ALL, (g) GPCC_FDD, (h) CPC. Note that the light gray color indicates no station and the dark color indicates very sparse-station regions (i.e., have station density <1 station per grid cell). Bottom panel: (i) Time evolution of station density: daily total number of rain gauges over the Asian Monsoon area in (black) APHRODITE, (orange) REGEN_ALL, (red) GPCC_FDD, and (blue) CPC.
Some exceptions are found over Japan, Korea and Pakistan where all global in situ datasets are drier than APHRODITE in their extremes (see Supplementary Figures 2A–D for a zoom in over Japan). It is worth noting that over Japan, APHRODITE has at least an order of magnitude more stations than any of the other in situ-based datasets so it could be picking up more severe local storms contributing to the wetter Rx1day. This extremely dense gauge network may also be capturing events in remote mountainous regions with orographic enhancement. Precipitation gauges tend to be preferentially located in valleys and low-lying areas. REGEN_ALL and GPCC_FDD have very similar spatial patterns with regional means wetter than APHRODITE (27.67 and 29.96%, respectively). This is expected as these two products utilize the rain gauges from GPCC_FDD (Schamm et al., 2014; Contractor et al., 2020) although REGEN_ALL also includes other sources. Meanwhile, CPC has higher estimates of Rx1day on the whole than APHRODITE (39.96%) (and the other two products) but regions clearly stand out as having drier extremes. It is easy for example to see the borders of Myanmar, Pakistan, and Laos highlighting that there are data availability issues over these particular countries in CPC. The considered period of 2001–2013 exhibits a strong decrease in the number of total ground-based measurements globally due to migration and abandonment of sites and operational costs, particularly for CPC and GPCC_FDD as mentioned in Sun et al. (2018). A common feature among the three in situ-based datasets is that the Himalayas stand out as having consistently wetter Rx1day than APHRODITE.
The newest version of APHRODITE, V1901, applied some improvements to quality control and used an updated interpolation algorithm to represent “extreme” values. To test the sensitivity of the above results to the choice of version of APHRODITE, we conduct the same analyses with APHRODITE_MA version V1901 (Supplementary Figure 7). Our main conclusions remain the same whatever version of APHRODITE is used.
The differences among gauge-based products may come largely from the different gauge networks used to derive each dataset, as well as differences in the background climatologies used to interpolate these gauge observations. Figures 2e–h also highlight the heterogeneous distribution of rain gauges in the overlapping period of 2001–2013. Note that the light gray color indicates no stations present in a grid box while the gray color indicates a very sparse station network (i.e., with averaged station density less than one station per grid cell). APHRODITE has the highest number of stations overall (Figure 2e) although this might not always hold regionally [e.g., REGEN_ALL has more stations over China (Figure 2f)]. GPCC_FDD and CPC have fewer stations than REGEN_ALL and APHRODITE (Figures 2g–h). Some regions are well-covered by stations in all the in situ products such as Japan, South Korea and Thailand while Myanmar is a data-sparse region for all products. As a result, estimates of precipitation extremes over the dense-station regions usually show a consistent spatial pattern e.g., over Japan with slightly drier extremes compared to APHRODITE (see also– Supplementary Figure 2). On the contrary, the representation of the annual maxima precipitation over the data-sparse regions (i.e., station density <1) e.g., Myanmar is largely different among in situ products. Interestingly, the Himalayas has lots of stations (station density is >5, some locations are >10) in APHRODITE (Figure 2e) but no stations in the other in situ-based products (Figures 2f–h). In addition, APHRODITE applied the orographic precipitation correction over high-elevation regions like the Himalayas which other in situ-based products do not apply. These features might help to explain the consistently wetter pattern compared with APHRODITE in all in situ-based products over the Himalayas.
Focusing on the time evolution of station density across the in situ-based products (Figure 2i), it is interesting to note that there is a large decrease in the total number of stations used in APHRODITE and REGEN_ALL around 1970, which relates to a substantial reduction of rain gauges over India in each product (Supplementary Figure 7). APHRODITE station numbers recover over subsequent decades, which is explained by the significant increase in gauges over Japan (Supplementary Figure 9), though this increase does not occur for REGEN_ALL (Supplementary Figure 9). These changes in the total number of available rain gauges are expected to impact inter-product differences, which is further investigated hereafter.
Satellite products could potentially reduce issues associated with the lack of in situ precipitation observations. For this reason, we next evaluate the consistency of extreme precipitation among satellite products. Figure 3 compares the representation of Rx1day among all of the satellite products as the relative difference to APHRODITE over the common 2001–2013 period. Interestingly, the annual wettest day estimated from satellites tends to be more spatially inhomogeneous, with regions of underestimation and overestimation compared to APHRODITE for each dataset. This is different to the in situ datasets that mostly show wetter estimates of climatological Rx1day (Figures 2b–d). We find different estimates across satellite products both with and without correction to rain gauges over Pakistan, the Tibetan Plateau, and Western China. Meanwhile, satellite products with corrections are more consistent with in situ-based products over regions that have a higher number of stations (e.g., Eastern China).
Figure 3. The relative difference to APHRODITE (in %) of the climatological (over the period of 2001–2013) annual wettest day (Rx1day) for corrected satellite products (black labels, two upper panels) (a) GSMAP_RNL, (b) GPCP_CDR, (c) CMORPH_CRT, (d) IMERG_FC, (e) 3B42, (f) CHIRPS2, and uncorrected satellite products (green label, lower panel) (g) CMORPH_RAW, (h) IMERG_FU, (i) 3B42_IR, (j) CHIRP2. The number inserted on each panel indicates the regional average of these relative differences. The in situ products that satellite products used for their correction to rain gauges are also mentioned at the top of the figure.
We now focus on the overall differences between the corrected and uncorrected satellite products. Generally, the differences from APHRODITE are amplified among the uncorrected satellite products (Figures 3g–j) in comparison to the corrected products (Figures 3a–f). The diversity of Rx1day estimates among the uncorrected satellite products is clear with relative differences in regional means ranging from 92.59% in 3B42_IR (Figure 2i) to −0.05% in CHIRP2 (Figure 3f). CHIRP2 is the closest to APHRODITE (Figure 3f) in terms of regional average but this hides some regional contrasts (e.g., the Tibetan Plateau and parts of the Maritime Continent are wetter while Pakistan and eastern China are drier than APHRODITE). In a global study of extreme precipitation, Alexander et al. (2020) also showed CHIRP2 to be the driest dataset in terms of extremes over global land areas while 3B42_IR belongs to a group of products with wetter estimates. Ongoing analysis by the Climate Hazards Center suggests that the systematic dry bias of CHIRP2 is related to the fixed intercept terms used to translate thermal infrared satellite observations into estimates of rainfall rates. While CHIRP2 consistently tends to capture well mean precipitation rates, the fixed intercepts used to translate IR data into rainfall rates suppresses the variance of the CHIRP2 product. On the other hand, corrected satellite estimates tend to be consistently wetter than APHRODITE, ranging from the lowest relative difference of 29.95% in GPCP_CDR (Figure 3b) to the highest of 57.7% in 3B42 (Figure 3e). In addition, by comparing pairs of corrected and uncorrected products for each satellite dataset (which is further explored in section climatology, inter-product spread and trends in Rx1day), we cannot be confident whether the corrections using in situ data makes the corrected product overall better over Monsoon Asia (i.e., closer to APHRODITE). For example, both the CMORPH and CHIRP2 family of products are drier (and closer to) APHRODITE in their uncorrected versions compared with their corrected versions, while the opposite is true for products from the 3B42 and IMERG families.
The difference among satellite products can probably partly be explained by the differences in how algorithms are used to estimate precipitation and the techniques used to apply rain gauge corrections, and we now explore this. In particular, among uncorrected satellite products, 3B42_IR and CHIRP2 utilize information from infrared radar (IR) measurements while others integrate information from passive microwave (PMW) measurements (e.g., CMORPH_RAW, IMERG_FU; see Table 1 for details). These uncorrected satellite products are blended with information derived from rain gauges, forming the rain gauge-enhanced satellite products. It is interesting to note that the choice of the underlying stations used for the rain gauge-enhanced satellite estimates impacts the final product. For instance, the imprint of the underlying CPC in situ data that is used to correct them can be clearly seen in some of the spatial patterns of the GSMAP-RNL and CMORPH family of products (e.g., dry bias over Myanmar, Pakistan and Laos; see panels in the left column of Figure 3). This is not systematic and indeed other products sharing the same underlying stations (e.g., GPCP_CDR, 3B42, and IMERG product families) show limited similarity in their spatial distribution of differences to APHRODITE although they all utilize GPCC_FDD (Figure 3; middle panels).
Monsoon Asia is a vast area and we highlight above that although we can extract some conclusions (e.g., in situ and satellite products are generally wetter than APHRODITE), important differences remain at the regional scale. Therefore, we also consider three sub-regions that have been selected because they are characterized by different station density, orography and coastal complexity (see section observational datasets and domain). The consistency among precipitation products over Monsoon Asia and the three sub-regions (namely Japan, India, and the Maritime Continent) are examined through time series of regionally averaged relative differences in Rx1day (Figure 3), the coefficient of variation (cov; i.e., Rx1day standard deviation divided by mean) taken as a measure of the inter-product spread within each cluster (Table 2) and the temporal correlation with APHRODITE taken as a measure of inter-annual variability (Table 3).
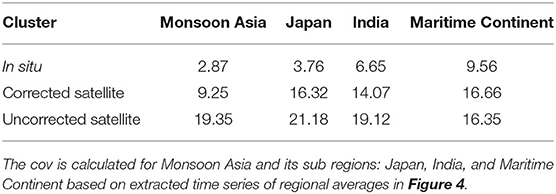
Table 2. Coefficient of variation (cov) (in percentage (%); see section precipitation extremes) calculated over the 2001–2013 period for each product cluster: in situ, corrected satellite, and uncorrected satellite.
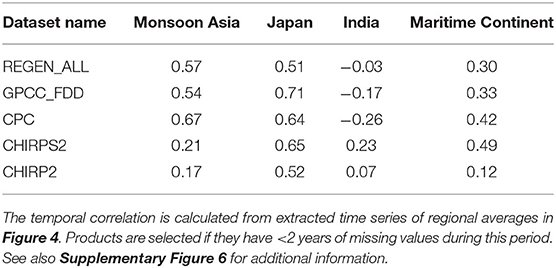
Table 3. Temporal correlation of regionally averaged relative differences (in %) for the annual wettest day (Rx1day) for each considered products with APHRODITE, calculated for each product covering the period of 1988–2013.
We first focus on the Monsoon Asia region as a whole. In situ-based products (Figure 4A) show some robustness with less inter-product spread compared to the other two classes of product (Figures 4B,C), as further shown by smaller cov values for the in situ-based products compared to the corrected and uncorrected satellite products (2.87% compared to 9.25 and 19.35%, respectively; Table 2). Note that three particular years of CPC (i.e., 1983–1985) contain a lot of missing grid cells over whole Monsoon Asia and its sub-regions, therefore these three years were excluded in the calculation of Rx1day. Corrected satellite products are more closely aligned with in situ-based products (Figure 4B) compared with uncorrected versions. Focusing on inter-annual variability, we find relatively high temporal correlations with APHRODITE for in situ-based products (from 0.54 to 0.67; Table 3) compared to CHIRPS2 (0.21; Table 3) and its uncorrected counterpart CHIRP2 (0.17; Table 3). While we cannot extract general conclusions based on these temporal correlations for the corrected and uncorrected satellite clusters due to their limited time coverage, this further tends to show that in situ-based products are generally more reliable than satellite data over the whole region studied.
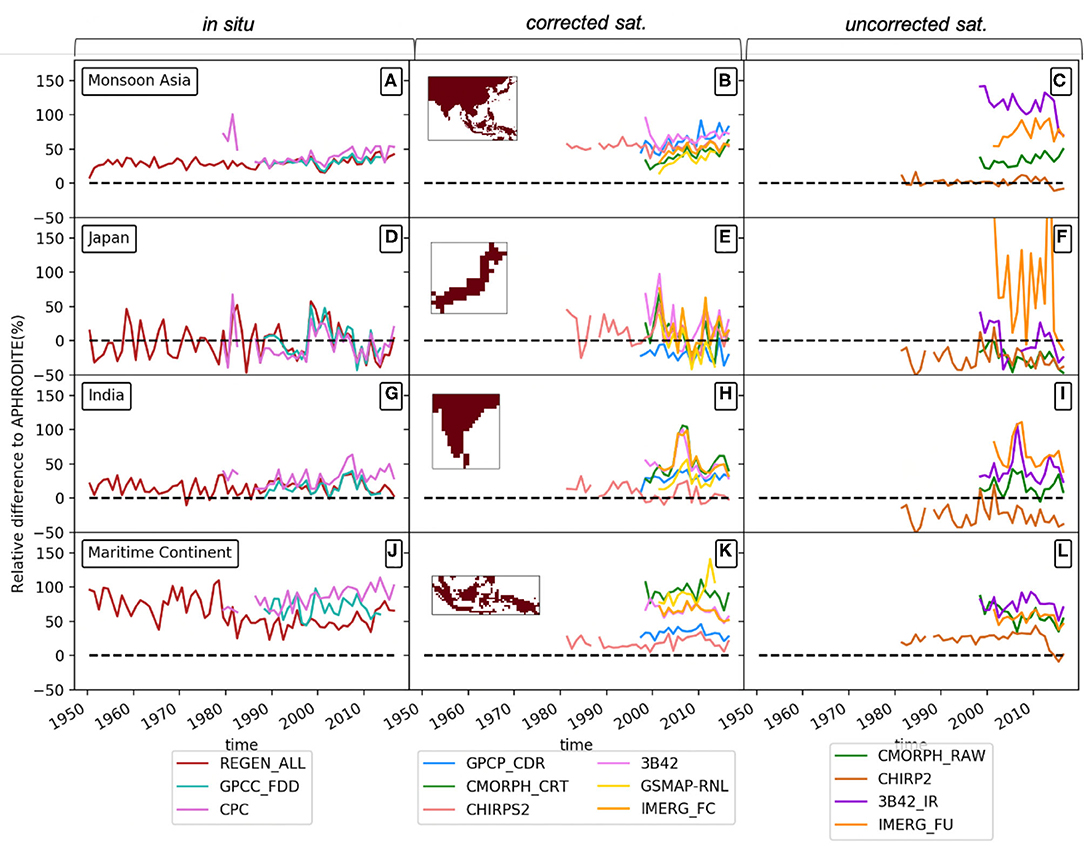
Figure 4. Time series of regionally averaged relative differences (in %) for the annual wettest day (Rx1day) for each considered product compared to the baseline period (1961–1990) of APHRODITE. Products are clustered into three groups: in situ (the left column), corrected satellite (the middle column), and uncorrected satellite (the right column). Four regions are considered: (A–C) Monsoon Asia (60°E-150°E, 15°S-50°N), (D–F) Japan (129°E-146°E, 30°N-46°N), (G–I) India (70°E-92°E, 5°N-25°N), and (J–L) the Maritime Continent (95°E-150°E, 10°S-10°N). Regionally averaged Rx1day is calculated over the common area across all datasets (as shown by the inserted maps in the middle panel of each row).
We then further investigate the consistency in the representation of Rx1day over the three sub-regions (Japan, India, and the Maritime Continent; second, third and last rows of Figure 4 respectively). First, we focus on the in situ cluster. As over Monsoon Asia, we find relatively strong consistency among in situ-based datasets over the high-station density region of Japan (cov value of 3.76 %, Table 2). We also find high consistency in terms of inter-annual variability for in situ-based products in estimating Rx1day over Japan (ranging from 0.51 to 0.71; Table 3). It is also worth noting that in situ data are generally closer to each other and temporally more consistent to APHRODITE over Japan compared to the whole Monsoon Asia region (Figures 4A,D). On the other hand, we find reduced consistency over the Maritime Continent where only a few gauges are available (temporal correlations among in situ products vary from 0.30 to 0.42), as well as larger differences to APHRODITE compared to that in other regions (Figure 4J). Interestingly, India, which is also a region of poor station density like the Maritime Continent, shows better agreement among in situ products with smaller inter-product spread (0.14 %, Table 2) compared with the Maritime Continent (0.25%, Table 2). Therefore, the station network alone does not account for all uncertainties in each dataset. Other factors like geography and climate can lead to these observational uncertainties. Surprisingly, all considered in situ-products show negative temporal correlations with APHRODITE over India (ranging from −0.26 to −0.03), revealing some important issues in the data that will be further discussed later.
Next, we focus on the representation of Rx1day among the satellite products, with and without a correction to rain gauges (middle and right columns of Figure 4). Compared to the in situ inter-product spread described above, the inter-product spread for satellite data is generally higher. This is particularly true for uncorrected products and applies to all four regions investigated here. In addition, we generally find a similar bias to APHRODITE for satellite data compared to in situ data, with an overestimation of Rx1day over Monsoon Asia, the Maritime Continent and India (to a lesser extent) and estimates closer to APHRODITE over Japan. The inter-product spread in the uncorrected satellite cluster is the largest and relatively similar across all four regions (last column of Figure 3), with cov values between 16.35 and 21.18% (Table 2). The inter-product spread is reduced in the corrected satellite cluster compared to uncorrected products cluster and in particular over Monsoon Asia and Japan, with a reduction in cov values from 19.35 to 9.25% and from 21.18 to 16.32%, respectively (Table 2), whereas little difference is seen over the Maritime Continent. Interestingly, higher temporal correlation is found for the regional average of Rx1day between APHRODITE and CHIRPS2 compared to its uncorrected counterpart CHIRP2 for all four regions and in particular for the Maritime Continent and India (Table 3). However, we find low temporal correlations (ranging from 0.12 to 0.49, Table 3) over the Maritime Continent, which highlights inconsistencies in inter-annual variability across different precipitation products and strongly limits the confidence that can be associated with these observational datasets over this region when assessing the annual daily precipitation maxima. It is also striking to see that temporal correlations over India are not only very low but also negative for satellite products. This is a major problem and again demonstrates that observations over India should be considered with care, in particular for studies focusing on inter-annual variations. This can partly be explained by the instability of the total number of observational stations in all considered in situ-based products (APHRODITE, REGEN_ALL, GPCC_FDD, and CPC) over India (Supplementary Figure 10B). For example, India experienced a major variation in available station coverage using in APHRODITE with a sudden increase during 1998–1999 and decrease during 2004–2006 (Supplementary Figures 11B–D).
The time series (Figure 4) also indicate there might be trends over the observational record in some products. We further quantify whether temporal trends are present in the regionally averaged Rx1day values and how robust these trends are across the different observational products for Monsoon Asia and its sub-regions. We consider here only products having at least 25 years of data available between 1988 and 2013 (Table 4), which covers the same time period as for the temporal correlations in Table 3 and gives us a sufficient record length for analysis. We find coherent (positive) trends across all products over the entire Monsoon Asia although only GPCC_FDD and CPC show a significant intensification, but with quite different magnitudes (0.71 mm/decade and 2.93 mm/decade, i.e., 1.8%/decade and 7.3%/decade, respectively). Focusing on the three selected sub-regions of Monsoon Asia, we find that four products out of six agree on a significant increase in the annual wettest day over the Maritime Continent, but the magnitude of their trend varies quite substantially (from 1.31 to 6.20 mm/decade, i.e., 2.6%/decade to 12.4%/decade). There is no consensus between observational products over India, with only APHRODITE and CPC showing significant trends yet of opposite signs (−3.10 and 6.07 mm/decade, i.e., −5.0%/decade and 9.6%/decade, respectively). Japan has non-significant trends in all products.
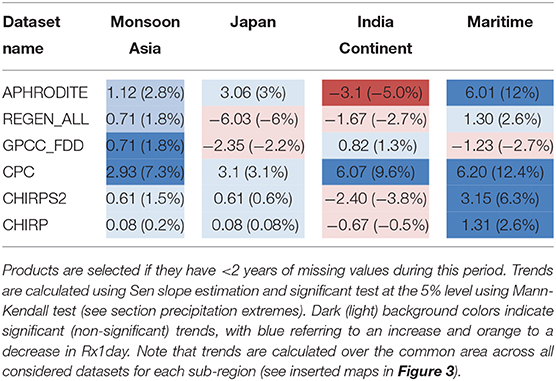
Table 4. Trends per decade in the annual Rx1day (mm/decades and %/decade) for each product that has data covering the period of 1988–2013.
Corrected Satellite and Uncorrected Satellite Comparison
Our results show substantial differences in how observational datasets represent Rx1day. It is clear that how well products agree depends on the region of interest, and in particular the agreement between the corrected and uncorrected satellite product estimates. Therefore, we further focus on how the satellite data with and without correction to rain gauges compare to each other for the representation of climatological Rx1day (over the 2001–2013 period) over the three sub-regions of Monsoon Asia (Figures 5–7).
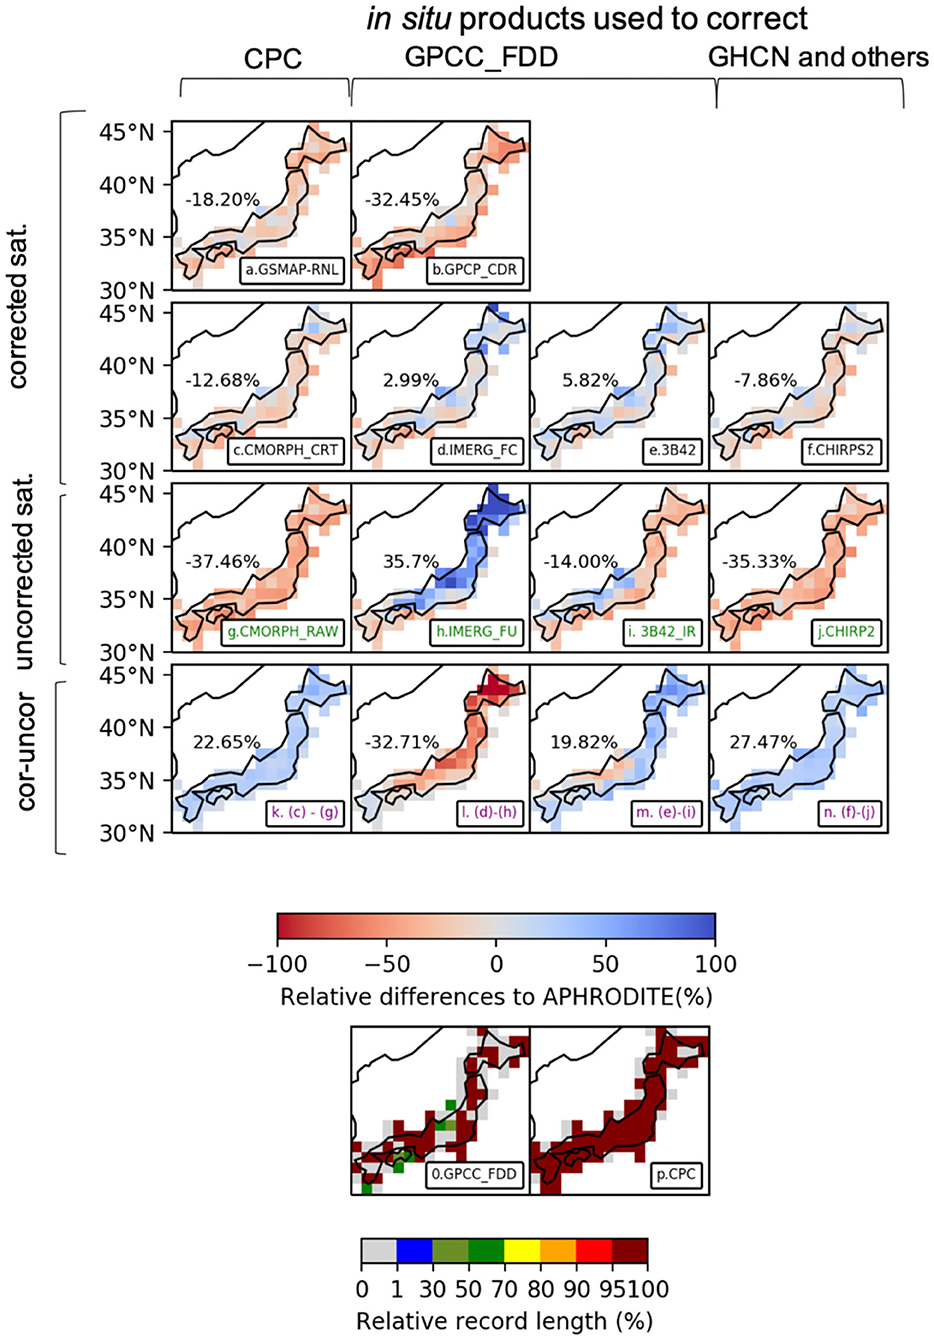
Figure 5. Upper panel: relative difference to APHRODITE (in %) of the climatological (over the period of 2001–2013) annual wettest day (Rx1day) for corrected satellite products (black labels, two upper rows): (a) GSMAP_RNL, (b) GPCP_CDR, (c) CMORPH_CRT, (d) IMERG_FC, (e) 3B42, (f) CHIRPS2; uncorrected satellite products (green label, the third row): (g) CMORPH_RAW, (h) IMERG_FU, (i) 3B42_IR, (j) CHIRP2; and the differences between the corrected and uncorrected products (k–n). The number inserted on each panel indicates the regional average of these relative differences. The in situ products that satellite products used to correct are also mentioned at the top of the figure. The last two panels also show the percentage of data available for each grid cell during the 2001–2013 period in these in situ-based datasets [(o) GPCC_FDD, (p) CPC] used for correction of satellite products.
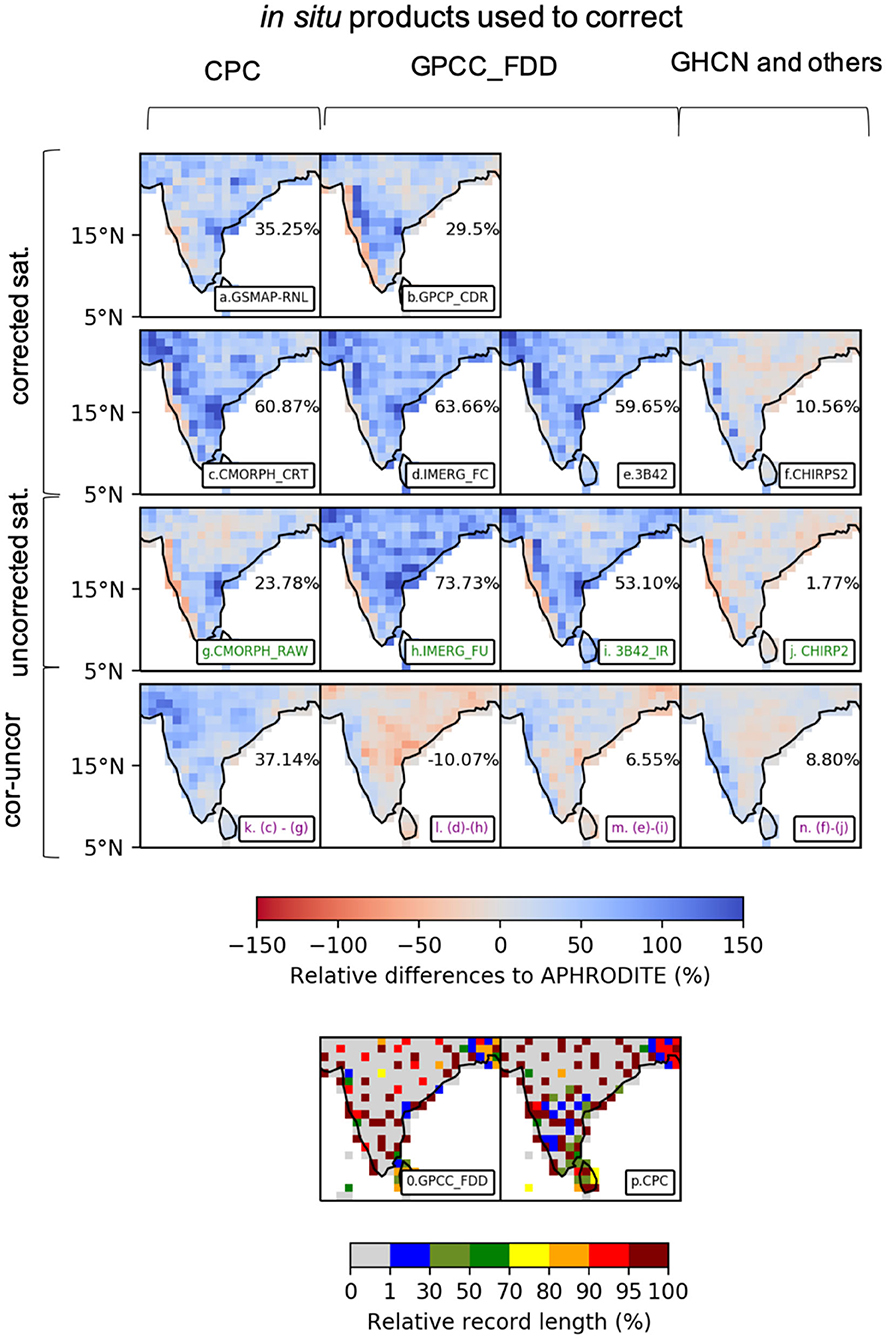
Figure 6. Same as Figure 5 for India. Upper panel: relative difference to APHRODITE (in %) of the climatological (over the period of 2001–2013) annual wettest day (Rx1day) for corrected satellite products (black labels, two upper rows): (a) GSMAP_RNL, (b) GPCP_CDR, (c) CMORPH_CRT, (d) IMERG_FC, (e) 3B42, (f) CHIRPS2; uncorrected satellite products (green label, the third row): (g) CMORPH_RAW, (h) IMERG_FU, (i) 3B42_IR, (j) CHIRP2; and the differences between the corrected and uncorrected products (k–n). The number inserted on each panel indicates the regional average of these relative differences. The in situ products that satellite products used to correct are also mentioned at the top of the figure. The last two panels also show the percentage of data available for each grid cell during the 2001–2013 period in these in situ-based datasets [(o) GPCC_FDD, (p) CPC] used for correction of satellite products.
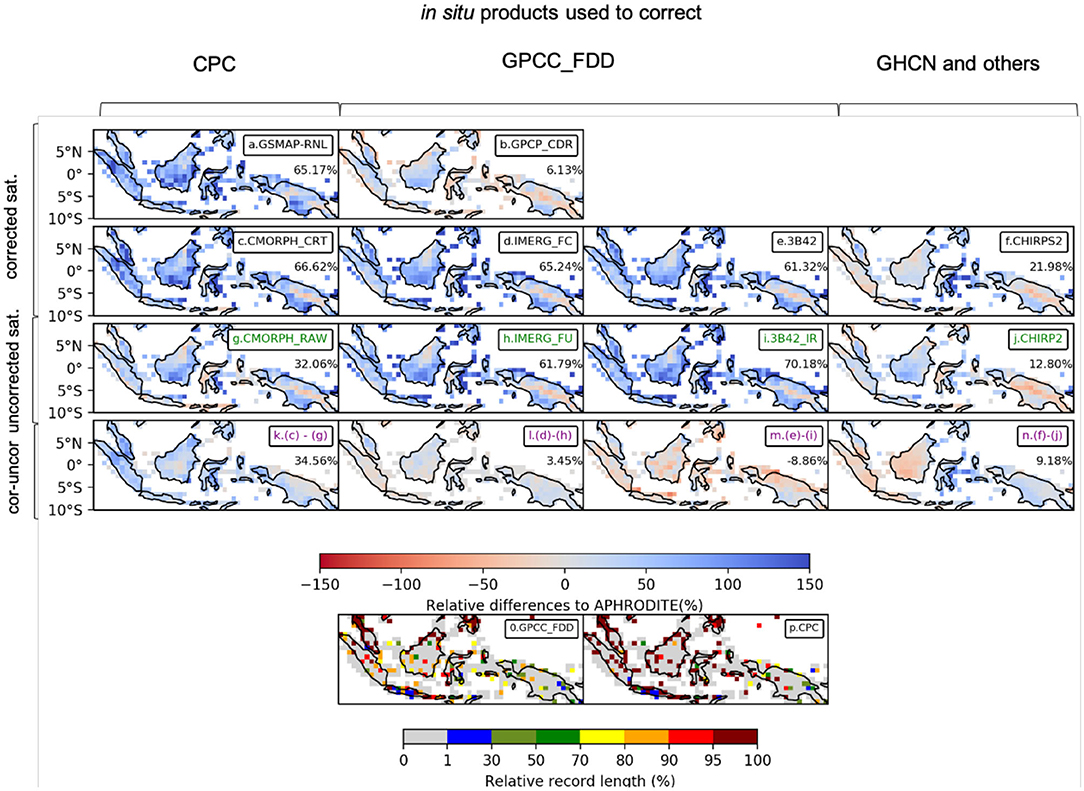
Figure 7. Same as Figure 5 for the Maritime Continent. Upper panel: relative difference to APHRODITE (in %) of the climatological (over the period of 2001–2013) annual wettest day (Rx1day) for corrected satellite products (black labels, two upper rows): (a) GSMAP_RNL, (b) GPCP_CDR, (c) CMORPH_CRT, (d) IMERG_FC, (e) 3B42, (f) CHIRPS2; uncorrected satellite products (green label, the third row): (g) CMORPH_RAW, (h) IMERG_FU, (i) 3B42_IR, (j) CHIRP2; and the differences between the corrected and uncorrected products (k–n). The number inserted on each panel indicates the regional average of these relative differences. The in situ products that satellite products used to correct are also mentioned at the top of the figure. The last two panels also show the percentage of data available for each grid cell during the 2001–2013 period in these in situ-based datasets [(o) GPCC_FDD, (p) CPC] used for correction of satellite products.
Figures 5a–j show the spatial map of relative differences (to APHRODITE) in the climatology of Rx1day for corrected satellite products (Figures 5a–f) and uncorrected versions (Figures 5g–j) over Japan. The difference between pairs of datasets from the same family are also presented (Figures 5k–n). Three uncorrected satellite products (CMORPH_RAW, 3B42_IR, and CHIRP2; Figures 5g,i,j) tend to be drier than APHRODITE whereas IMERG_FU is generally wetter (Figure 5h). The corrected satellite versions of these four family products usually show reduced bias spatially (Figures 5c–f), in particular for IMERG products (as seen in Figures 5e,f). Note that the direction of correction among product families is different (Figures 5k–n). Hence, a strong correction is applied over Japan that shifts the satellite products closer to APHRODITE (and therefore to each other). This highlights that the dense rain gauge network presents other benefits than simply a better estimation of precipitation extremes in in situ-based datasets as it also leads to improvement (i.e., closer to APHRODITE) in Rx1day estimates in satellite products when a correction to in situ data is applied. Figures 5o,p indicates the percentage of station data available during the 2001–2013 period for each grid box in the in situ datasets used to correct these satellite products. Stations from CPC cover the whole of Japan with almost all station information being fully available (nearly 100%) during the considered period. On the other hand, station networks from GPCC_FDD only partly cover Japan and in which the length of available data for some grid boxes is <50%, However, it is interesting that the imprint of underlying station networks among corrected satellite-products (as mentioned in section climatology of the mean daily precipitation) does not appear to have a strong impact over Japan. This is likely because there are enough stations in the underlying rain gauge networks over Japan to produce corrections that shift the satellite products closer to APHRODITE.
Figure 6 focuses on India which covers a large area of land only partially covered by in situ stations. Overall, both satellite products with and without rain gauge correction tend to overestimate climatological Rx1day compared to APHRODITE, over most areas of India except a thin band on the west coast. This excludes CHIRPS2 and CHIRP2 that are closer to APHRODITE (Figures 6f,j). Contrary to the results for Japan, the correction to rain gauges has smaller impacts (Figures 6k–n) and each pair of corrected and uncorrected products presents a relatively similar distribution of climatological Rx1day, except over the western coast of India where the correction to in situ data makes precipitation extremes slightly closer to APHRODITE. This interesting feature can be probably explained by the fact that over the west coast of India in situ stations used for the correction generally have a nearly complete temporal coverage (i.e., greater than 95%) during 2001–2013 period (Figures 6o–p). Meanwhile, in other parts of India, the percentage of data available through time in each grid box varies (from 1 to 70%). Another possible explanation might be related to lower station density over India compared with that over Japan. This seems to limit the improvement in the representation of Rx1day from the correction of satellite products to in situ data.
Finally, we focus on the Maritime Continent in Figure 7. Conclusions similar to those drawn for India can be made for the Maritime Continent. Generally, both satellite products with and without correction to rain gauges are much wetter compared with APHRODITE. In addition, almost all products are fairly similar to each other (both spatially and in their regional averages; Figures 7a–j) in terms of representing Rx1day. Some notable exceptions include the highest elevation regions of New Guinea and the island of Sulawesi, which both have positive differences in some datasets (GSMAP-RNL and CMORPH_CRT; Figures 7a,c) and negative in others. Comparing both corrected and uncorrected satellite clusters reveals some potential issues related to the rain gauge networks that satellite products use to correct their precipitation estimation. The issues might be related to the lack of stations across different rain gauge networks and also emphasize the dubious quality of available stations over the Maritime Continent.
Generally, the gauge-based correction applied to satellite estimates acts differently from region to region and product to product, and we show here that this also depends on the station network utilized in addition to the method itself (for instance some products have stronger corrections than others even when using the same underlying network). We find a clear distinction in the impact of the correction between regions of high and sparse station density, for instance over Japan where there are a lot of stations with good temporal coverage, it brings satellite estimates closer to APHRODITE and reduces inter-product spread. Over regions poorly sampled by stations, how well the correction to in situ acts depends on the length of record available and this can lead to regional contrasts but generally we find minor improvements in the representation of climatological Rx1day between the corrected and uncorrected version of the satellite products over such regions, which implies that not only does poor station coverage affect the representation of precipitation extremes in in situ-based datasets but it also has clear impact in most satellite products that rely on ground networks.
Discussion
We find that the estimation of Rx1day is generally wetter in in situ-based products compared to APHRODITE. This wet “bias” is also apparent in other precipitation indices [e.g., Rx5day (Supplementary Figure 3), SDII (Supplementary Figure 4), PRCPTOT (Supplementary Figure 5), and R10mm (Supplementary Figure 6)]. One source of these differences is that APHRODITE contains substantially more rain gauges than any other in situ-based product (Figure 2i). This could be related to the “central limit theorem,” which explains that averaging more observations in each grid cell can lead to lower variance weighted averages of original station values. For instance, three considered in situ-based products have a wetter bias compared with APHRODITE over Thailand which (Figure 2a compared with Figures 2b–d). However, this “central limit theorem” cannot be applied over Japan, Korea, and Pakistan with being slightly drier in other products compared to APHRODITE (Supplementary Figure 2). The potential reason might be related to a very high-density station network over Japan and Korea in all in situ dataset. Other possible sources of difference could be related to the quality control procedures and interpolation method applied in APHRODITE [see Yatagai et al. (2012) for details]. Particularly, Yatagai et al. (2012) recognized that there are some features in APHRODITE that don't exist in other products such as narrower rainbands. The authors show that this is a result of the Mountain Mapping technique [see Schaake et al. (2004) for more details] they employed and which allows better estimates of precipitation averages in the merging algorithm over data-sparse areas. This technique avoids the false penetration of precipitation from wet areas into adjacent and relatively drier areas, which can hence induce narrower rainbands in APHRODITE than in other datasets. The Maritime continent combining both dry and wet regions illustrates this nicely with generally much wetter estimates in all other datasets compared to APHRODITE, and in particular over the mountainous regions of Indonesia and Malaysia (Supplementary Figures 2F–H).
We note that CPC has a drier bias compared with APHRODITE in regions with little or no stations and that such regions coincide well with country borders (e.g., Myanmar, Pakistan) (Figure 2d). According to Xie (2008) and Chen et al. (2008) the dry bias can also potentially be explained by the fact that GTS values are used everywhere outside of China and missing values can sometimes be reported incorrectly as zero precipitation.
Our results indicate the limitations in estimating precipitation extremes in gridded precipitation products, especially in in situ-based products over poorly sampled regions with few (e.g., the Maritime Continent, Myanmar) or no stations (e.g., the Tibetan Plateau). These in situ products have been used in many model evaluations studies as the observational reference (“ground truth”). Therefore, our recommendation is to carefully apply these datasets, notably over data-sparse regions like the Maritime Continent. We find better agreement among sole gauge-based products over high station density (i.e., >10 station per grid) regions like Japan. These results are perhaps not surprising and are consistent with the findings of Kim et al. (2018), although we observe large differences in the quantity of observational stations over Japan (Supplementary Figure 8A) in APHRODITE compared to other considered in situ-based products. That makes us question whether there is a minimum number of stations required to obtain good agreement in the representation of rainfall extremes.
The regional high-resolution datasets (e.g., IMD for India and SACA&D for the Maritime Continent) might provide a better precipitation information than APHRODITTE as they have higher resolution and include many more stations compared to APHRODITE. Therefore, additional comparison between all the products from Table 1 and local datasets are conducted to get better views in terms of the uncertainties among different observational products regrading to various references datasets. Supplementary Figures 12, 13 show the differences between IMD and SACA&D and other observation products respectively. All products are drier than IMD in their estimates of Rx1day. This “drier bias” is consistent with the spatial pattern found over Japan and Korea, which can be explained by a very dense station density in IMD compared with other products. The pattern over the Maritime Continent for SACA&D is similar to APHRODITE, with all products generally wetter than SACA&D. Although different bias patterns are observed when adding these two local high-resolution datasets, our main conclusions remain the same in that there is high consistency among in situ-based products irrespective of the station density. Satellite products with gauge-corrections show better agreement with each other in estimating Rx1day than those that are uncorrected.
Due to insufficient observational evidence and/or spatially varying trends, the Fifth Assessment Report (AR5) of IPCC (2013) stated only low to medium confidence in the trends in extreme precipitation over various regions of Asia (see IPCC AR5 Table 2.13). Since AR5, more attempts have been made to examine changes in different aspects of precipitation extremes over Asian countries. To date, significant decadal trends in precipitation extremes have been identified over India (Prakash et al., 2015; Rana et al., 2015), Japan (Fujibe et al., 2006; Duan et al., 2015), but not over Southeast Asia [including the Maritime Continent e.g., Kim et al. (2018)]. However, all these studies have been limited either in the number of observational products they used and/or the time period they covered [e.g., seven datasets used and 10 years considered in Kim et al. (2018)], or the different definitions of extreme precipitation used. Here, we have considered 13 observational datasets that cover 25 years (1988–2013) for the estimation of observed trends in the annual 1-day precipitation maxima across the different considered sub-regions. There is low confidence in the presence of a trend in Rx1day over India during 1988–2013 because of a lack of agreement between products, which is likely linked to a lack of in situ data. This inconsistency still exists when considering the IMD dataset (Supplementary Table 5). Note that there have been significant increasing trends in frequency and intensity of extreme heavy rainfall over central and southern India since 1950 where regional climates are controlled by the Asian monsoon system (Krishnan et al., 2015; Roxy et al., 2017; Venkata Rao et al., 2020) (i.e., the core monsoon zones). Interestingly, despite a poor station coverage over the Maritime Continent, we find significant positive trends in four out of six datasets. On the other hand, Japan is a region of very high station density and yet we do not find significant trends in any of the considered datasets. Other studies found a significant increasing trend in Rx1day over Japan (Fujibe et al., 2006; Duan et al., 2015) but in these cases a much longer period was studied (1901–2004 and 1901–2012, respectively) which might explain these differences. Further results based on different extreme indices [e.g., Rx5day (Supplementary Table 1), SDII (Supplementary Table 2), PRCPTOT (Supplementary Table 3), and R10mm (Supplementary Table 4)] show little differences in terms of trends depending on regions and indices over 1988–2013. In particular, we find significant trends in SDII over Japan with three datasets including: REGEN_ALL, GPCC_FDD and CHIRPS but opposite signs (−0.82 mm/decade, 0.67 mm/decade, and −0.57 mm/decade respectively; Supplementary Table 2). On the other hand, coherent positive significant trends in Rx5day, SDII, PRCPTOT, and R10mm are found over India in at least two out of five considered products (the third column; Supplementary Tables 1–4). Similar results on decadal trends are obtained for different extreme indices over the Maritime Continent.
Comparing inter-annual variability in different products, we highlighted the reliability of in situ products over Monsoon Asia. In addition, we also found high consistency over dense-station areas like Japan, whereas very low temporal correlation was found over India in all considered products. This is likely due to the instabilities in time-varying station networks in APHRODITE, for example over India during 1988–2013 (Supplementary Figures 8B, 9). Note that a substantial international “reporting crisis” has been recorded in many regions of the world, referring to either a substantial decrease in observations or major variations in station networks over time (Funk et al., 2015; Alexander et al., 2019). These temporal changes in network distribution can lead to very different climatologies from year to year and hence inconsistencies in inter-annual variability, simply because of differences in spatial coverage from year to year.
Further issues in how satellite products ingest data, use algorithms to bias adjust or merge input data together to produce final products (see Table 1) also add to the uncertainties in our results. This could lead to the uncertainties we see in the representation of extremes, especially among the corrected and uncorrected satellite datasets over sub regions, where we found the performance of satellite correction is different between data-sparse (e.g., Indonesia and India) and high station density regions (e.g., Japan). Understanding the method behind the creation of a rainfall product is the best way to know how robust it is and to which extent one can trust it. Some diagrams from Le Coz and Van De Giesen (2020)-the review on how products are developed can facilitate such understanding. It also acknowledged that the “reporting crisis” mentioned above might also affect products differently. For example, satellite estimates that start with lower bias are more resilient to changes in the gauge networks.
We do not have all of the required information to be able to better quantify the reasons behind the uncertainties among precipitation products and to reduce these uncertainties because of the inhomogeneities in precipitation records and the lack of station information from regional products like IMD and SACA&D. Efforts still need to be pursued on how to reduce the uncertainties in observed precipitation extremes. However, this study does indicate some inherent types of uncertainties in datasets through the employed station network and applied satellite correction over Monsoon Asia. The idea of this research is not to recommend any single observational dataset but rather to highlight the commonalities and differences among different products and product clusters when they are compared within a common framework. This can be used to better inform research activities like model evaluation, monitoring, and projections etc. Previous studies suggested that there is no single best observational dataset for global assessment of annual wettest day precipitation (Alexander et al., 2020; Bador et al., 2020). However, as we focus on a whole of Monsoon Asia regional scale study, APHRODITE could be considered as being better than any other existing global datasets because this regional data product often has access to much more data than any of its global dataset counterparts. However, if we consider smaller sub-regions, most develop their own high-resolution datasets which should generally be considered as the first choice for evaluation purposes since they employ the most rain gauges and the most effort has gone into their development for applications in the specific region.
Conclusions
This study focused on the robustness of 1-day precipitation annual maxima (Rx1day) over Monsoon Asia by comparing the climatological value of Rx1day across multiple observational precipitation products and exploring the influence of the underlying station density and the correction methods that satellites use to estimate precipitation. To explore how different data sources represented observed precipitation extremes, all considered products were clustered into three groups based on their data sources: in situ, corrected satellite and uncorrected satellite. We investigated their consistency in the representation of precipitation extremes across the multiple products principally through their spatial and temporal distribution of Rx1day, the inter-product spread, temporal correlation and trends over the 1988–2013 period. We further investigated three sub-regions of particular interest: Japan (a region of high station density and strong spatial contrast), India (a large region covered by a sparse station network with orographic contrasts), and the Maritime Continent (a poorly sampled region with strong coastal complexity).
We find that there are broad similarities in the spatial and temporal distributions among in situ-based products compared to satellite products (with or without a correction to in situ). Better general agreement in climatology and less inter-product spread and higher temporal correlation is found for satellite estimates with correction to rain gauges than for the uncorrected versions of the satellite products. These findings are generally true over Monsoon Asia and are consistent with results from quasi-global studies [e.g., Bador et al. (2020)].
These general results also contain strong sub-regional differences, and we show in this study that these differences can partly be explained by the quantity and quality of the rain gauges over the considered region. First, focusing on in situ datasets only, we find a better agreement among in situ-based products over dense data regions like Japan. Conversely, regions with no stations (e.g., Myanmar, Tibetan Plateau) or sparse station networks (e.g., the Maritime Continent) stood out over other regions as having the largest differences in precipitation extreme estimates. Secondly, over the data dense region of Japan, corrected satellite products show similar spatial and temporal patterns between themselves and compared to the in situ-based products that are used to correct them. In addition, the inter-product spread among corrected satellite estimates is closer to the spread for in situ-based products than for their uncorrected counterparts despite the larger number of satellite products. On the contrary, over poorly sampled regions (e.g., India and the Maritime Continent), both uncorrected and corrected satellite clusters are similar to each other and have much larger spread compared with in situ-based products. In addition, we also showed that the length of record available at each station can also affect the satellite correction over these poorly sampled regions.
Clearly, the quantity and quality of the station network have implications for the reliability of the in situ-based products derived and also the satellite products that use a correction to in situ data over Monsoon Asia. We showed that satellite products can have the spatial imprints of the underlying in situ data. Therefore, they cannot be considered as the “perfect solution” to replace the lack of in situ data over data-sparse regions.
Finally, and based on our results, we would like to make some recommendations for data selection for the study of the annual wettest day over the three sub-regions studied here. First, we found large observational uncertainties among uncorrected satellite products over all considered regions, so preference should be given to the corrected version over the uncorrected version of each product family. There might potentially be areas where the uncorrected products could be better than their corrected counterparts e.g., where stations are not representative of the region and therefore the correction to in situ does not lead to an improvement for precipitation extreme estimates. However, such conclusions did not arise from our analyses and therefore we only consider the satellite products from the corrected cluster in addition to in situ-based products for some recommendations that we detail for each region individually:
Japan has a dense network of stations with good completeness in terms of length of record in APHRODITE. We recommend the selection of in situ-based observations as they tend to have very similar spatial and temporal patterns. Furthermore, satellite products can also be recommended as they show good agreement with in situ-based products and slightly larger inter-product spread than in situ-based products. However, it should be noted that there is some inconsistency in long-term extreme precipitation trends among in situ-based products.
Over India, we recommend using in situ-based datasets with great care. Indeed, this large region suffers from a substantial reduction in the station density and some inconsistencies in its station network over the last few decades. This leads to differences among in situ products for both spatial and temporal patterns of precipitation extremes, and also affects trend estimates that cannot be extracted with confidence. This might also have a negative impact on satellite datasets that also show large inter-product spread over India. Therefore, we suggest a careful selection of both in situ and satellite products over this region. Note that India does have its own high-resolution gridded datasets which might provide better local precipitation extremes estimates.
The Maritime Continent, which features highly complex terrain, is sampled by only a few rain gauges for which data quality is also questionable. This causes substantial differences in climatology and inconsistency in inter-annual variability among in situ products. There is also a little satellite correction applied over the Maritime Continent due to data spare networks. We recommend users are knowledgeable of data issues when choosing in situ products.
Our research focuses on uncertainties among different observational products in estimating precipitation extremes by understanding the impact of the underlying station networks and satellite corrections. It is important to acknowledge that these factors do not account for the full range of uncertainties in each dataset. Other factors like geography and climate might also contribute. Therefore, we recommend understanding how each dataset is produced in order to make the best decision about what products are fit for purpose in estimating precipitation extremes for individual regions.
Data Availability Statement
All datasets generated for this study are included in the article/Supplementary Material.
Author Contributions
All authors listed have made a substantial, direct and intellectual contribution to the work, and approved it for publication.
Funding
P-LN, LA, and MB are supported by the Australian Research Council (ARC) grant DP160103439. P-LN and TL are supported by the ARC grant CE170100023. CF has been supported by the US Geological Survey Drivers of Drought project and NASA GPM grant 80NSSC19K0686. Information about the datasets provided by FROGS are given here https://data.ipsl.fr/ and the data are freely available from ftp://ftp.climserv.ipsl.polytechnique.fr/FROGs/. Indices were calculated using ClimPACTv2 software (https://climpact-sci.org/get-started/). All analyses and graphics have been performed using Climate Data Operator (CDO) and Python.
Conflict of Interest
The authors declare that the research was conducted in the absence of any commercial or financial relationships that could be construed as a potential conflict of interest.
The handling editor is currently organizing a Research Topic with one of the authors, CF, and confirms the absence of any other collaboration.
Supplementary Material
The Supplementary Material for this article can be found online at: https://www.frontiersin.org/articles/10.3389/fclim.2020.578785/full#supplementary-material
References
Alexander, L. V., Bador, M., Roca, R., Contractor, S., Donat, M., and Nguyen, P. L. (2020). Intercomparison of annual precipitation indices and extremes over global land areas from in situ, space-based and reanalysis products. Environ. Res. Lett. 15:055002. doi: 10.1088/1748-9326/ab79e2
Alexander, L. V., Fowler, H. J., Bador, M., Behrangi, A., Donat, M. G., Dunn, R., et al. (2019). On the use of indices to study extreme precipitation on sub-daily and daily timescales. Environ. Res. Lett. 14:125008. doi: 10.1088/1748-9326/ab51b6
Bador, M., Alexander, L. V., Contractor, S., and Roca, R. (2020). Diverse estimates of annual maxima daily precipitation in 22 state-of-the-art quasi-global land observation datasets. Environ. Res. Lett. 15, 1–10. doi: 10.1088/1748-9326/ab6a22
Beck, H. E., Pan, M., Roy, T., Weedon, G. P., Pappenberger, F., Van Dijk, A. I. J. M., et al. (2019). Daily evaluation of 26 precipitation datasets using Stage-IV gauge-radar data for the CONUS. Hydrol. Earth Syst. Sci. 23, 207–224. doi: 10.5194/hess-23-207-2019
Bosilovich, M., Robertson, F., and Chen, J. (2011). Global energy and water budgets in MERRA. J. Clim. 24, 5721–5739. doi: 10.1175/2011JCLI4175.1
Chen, M., Shi, W., Xie, P., Silva, V. B. S., Kousky, V. E., Wayne Higgins, R., et al. (2008). Assessing objective techniques for gauge-based analyses of global daily precipitation. J. Geophys. Res. Atmospheres 113:9132. doi: 10.1029/2007JD009132
Contractor, S., Alexander, L. V., Donat, M. G., and Herold, N. (2015). How well do gridded datasets of observed daily precipitation compare over Australia? Adv. Meteorol. 2015, 1–15. doi: 10.1155/2015/325718
Contractor, S., Donat, M. G., Alexander, L. V., Ziese, M., Meyer-Christoffer, A., Schneider, U., et al. (2020). Rainfall Estimates on a Gridded Network (REGEN)—a global land-based gridded dataset of daily precipitation from 1950 to 2016. Hydrol. Earth Syst. Sci. 24, 919–943. doi: 10.5194/hess-24-919-2020
Dee, D. P., Uppala, S. M., Simmons, A. J., Berrisford, P., Poli, P., Kobayashi, S., et al. (2011). The ERA-Interim reanalysis: configuration and performance of the data assimilation system. Quart. J. Roy. Meteorol. Soc. 137, 553–597. doi: 10.1002/qj.828
Duan, W., He, B., Takara, K., Luo, P., Hu, M., Alias, N. E., et al. (2015). Changes of precipitation amounts and extremes over Japan between 1901 and 2012 and their connection to climate indices. Clim. Dyn. 45, 2273–2292. doi: 10.1007/s00382-015-2778-8
Fujibe, F., Yamazaki, N., and Kobayashi, K. (2006). Long-term changes of heavy precipitation and dry weather in Japan (1901–2004). J. Meteorol. Soc. Japan 84, 1033–1046. doi: 10.2151/jmsj.84.1033
Funk, C., Peterson, P., Landsfeld, M., Pedreros, D., Verdin, J., Shukla, S., et al. (2015). The climate hazards infrared precipitation with stations—a new environmental record for monitoring extremes. Sci. Data 2:150066. doi: 10.1038/sdata.2015.66
Herold, N., Alexander, L. V., Donat, M. G., Contractor, S., and Becker, A. (2016a). How much does it rain over land? Geophys. Res. Lett. 43, 341–348. doi: 10.1002/2015GL066615
Herold, N., Behrangi, A., and Alexander, L. (2016b). Large uncertainties in observed daily precipitation extremes over land: uncertainties in precipitation extremes. J. Geophys. Res. Atmospheres 122, 668–681. doi: 10.1002/2016JD025842
Hijioka, Y., Lin, E., Pereira, J. J., Corlett, R. T., Cui, X., Insarov, G. E., et al. (2014). “Asia,” in Climate Change 2014: Impacts, Adaptation, and Vulnerability. Part B: Regional Aspects. Contribution of Working Group II to the Fifth Assessment Report of the Intergovernmental Panel on Climate Change, eds V.R. Barros, C.B. Field, D.J. Dokken, M.D. Mastrandrea, K.J. Mach, T.E. Bilir, et al. (United Kingdom and New York, NY: Cambridge University Press, Cambridge), 1327–1370.
Huffman, G., Bolvin, D., Braithwaite, D., Hsu, K.-L., Joyce, R., Kidd, C., et al. (2020). “Integrated multi-satellite retrievals for the global precipitation measurement (gpm) mission (IMERG)”. in Satellite Precipitation Measurement. Advances in Global Change Research, Vol 67. eds V. Levizzani, C. Kidd, D. Kirschbaum, C. Kummerow, K. Nakamura, F. Turk (Cham: Springer) 343–353. doi: 10.1007/978-3-030-24568-9_19
Huffman, G. J., Adler, R. F., Morrissey, M. M., Bolvin, D. T., Curtis, S., Joyce, R., et al. (2001). Global precipitation at one-degree daily resolution from multisatellite observations. J. Hydrometeorol. 2, 36–50. doi: 10.1175/1525-7541(2001)002<0036:GPAODD>2.0.CO;2
Huffman, G. J., Bolvin, D. T., Braithwaite, D., Hsu, K., Joyce, R., Kidd, C., et al. (2019). NASA Global Precipitation Measurement (GPM) Integrated Multi-Satellite Retrievals for GPM (IMERG). (Greenbelt, MD: NASA Algorithm Theoretical Basis Doc), 1–34.
Huffman, G. J., Bolvin, D. T., Nelkin, E. J., Wolff, D. B., Adler, R. F., Gu, G., et al. (2007). The TRMM multisatellite precipitation analysis (TMPA): quasi-global, multiyear, combined-sensor precipitation estimates at fine scales. J. Hydrometeorol. 8, 38–55. doi: 10.1175/JHM560.1
Iguchi, T., Kozu, T., Kwiatkowski, J., Meneghini, R., Awaka, J., and Okamoto, K. I. (2009). Uncertainties in the rain profiling algorithm for the TRMM precipitation radar. J. Meteorol. Soc. Japan 87A, 1–30. doi: 10.2151/jmsj.87A.1
Jones, P. W. (1999). First- and second-order conservative remapping schemes for grids in spherical coordinates. Mon. Wea. Rev. 127, 2204–2210. doi: 10.1175/1520-0493(1999)127<2204:FASOCR>2.0.CO;2
Jung, I. W., Bae, D.-H., and Kim, G. (2011). Recent trends of mean and extreme precipitation in Korea. Int. J. Clim. 31, 359–370. doi: 10.1002/joc.2068
Kidd, C., Becker, A., Huffman, G. J., Muller, C. L., Joe, P., Skofronick-Jackson, G., et al. (2017). So, how much of the Earth's surface is covered by rain gauges? Bull. Am. Meteorol. Soc. 98, 69–78. doi: 10.1175/BAMS-D-14-00283.1
Kim, I.-W., Oh, J., Woo, S., and Kripalani, R. (2018). Evaluation of precipitation extremes over the Asian domain: observation and modelling studies. Clim. Dyn. 52, 1–26. doi: 10.1007/s00382-018-4193-4
Krishnan, R., Sabin, T. P., Vellore, R., Mujumdar, M., Sanjay, J., Goswami, B. N., et al. (2015). Deciphering the desiccation trend of the South Asian monsoon hydroclimate in a warming world. Clim. Dyn. 47, 1007–1027. doi: 10.1007/s00382-015-2886-5
Krishnan, R., T P, S., D. C, A., A, K., Sugi, M., Murakami, H., et al. (2012). Will the South Asian monsoon overturning circulation stabilize any further? Clim. Dyn. 40, 187–211. doi: 10.1007/s00382-012-1317-0
Le Coz, C., and Van De Giesen, N. (2020). Comparison of rainfall products over sub-Saharan Africa. J. Hydrometeorol. 21, 553–596. doi: 10.1175/JHM-D-18-0256.1
Legates, D. R., and Willmott, C. J. (1990). Mean seasonal and spatial variability in global surface air temperature. Theor. Appl. Climatol. 41, 11–21. doi: 10.1007/BF00866198
Lestari, S., King, A., Vincent, C., Karoly, D., and Protat, A. (2019). Seasonal dependence of rainfall extremes in and around Jakarta, Indonesia. Weather Clim. Extremes 24:100202. doi: 10.1016/j.wace.2019.100202
Liu, M., Xu, X., Sun, A., Wang, K.-L., Liu, W., and Zhang, X. (2014). Is southwestern China experiencing more frequent precipitation extremes? Environ. Res. Lett. 9:064002. doi: 10.1088/1748-9326/9/6/064002
Maidment, R. I., Allan, R. P., and Black, E. (2015). Recent observed and simulated changes in precipitation over Africa. Geophys. Res. Lett. 42, 8155–8164. doi: 10.1002/2015GL065765
Okamoto, K. I., Ushio, T., Iguchi, T., Takahashi, N., and Iwanami, K. (2005). “The global satellite mapping of precipitation (GSMaP) project,” in Proceedings. 2005 IEEE International Geoscience and Remote Sensing Symposium, IGARSS '05 (Seoul: IEEE), 3414–3416. doi: 10.1109/IGARSS.2005.1526575
Pai, D., Sridhar, L., Rajeevan, M., Sreejith, O.P., Satbhai, N.S., and Mukhopadhyay, B. (2014). Development of a new high spatial resolution (0.25° × 0.25°) long period (1901-2010) daily gridded rainfall data set over India and its comparison with existing data sets over the region. Mausam 65, 1–18.
Prakash, S., Mitra, A. K., Momin, I. M., Rajagopal, E. N., Basu, S., Collins, M., et al. (2015). Seasonal intercomparison of observational rainfall datasets over India during the southwest monsoon season. Int. J. Climatol. 35, 2326–2338. doi: 10.1002/joc.4129
Prein, A. F., and Gobiet, A. (2017). Impacts of uncertainties in European gridded precipitation observations on regional climate analysis. Int. J. Climatol. 37, 305–327. doi: 10.1002/joc.4706
Priya, P., Krishnan, R., Mujumdar, M., and Houze, R. A. (2016). Changing monsoon and midlatitude circulation interactions over the Western Himalayas and possible links to occurrences of extreme precipitation. Clim. Dyn. 49, 2351–2364. doi: 10.1007/s00382-016-3458-z
Rana, S., Mcgregor, J., and Renwick, J. (2015). Precipitation seasonality over the Indian subcontinent: an evaluation of gauge, reanalyses, and satellite retrievals. J. Hydrometeorol. 16, 631–651. doi: 10.1175/JHM-D-14-0106.1
Ren, Z., Zhang, M., Wang, S., Qiang, F., Zhu, X., and Dong, L. (2015). Changes in daily extreme precipitation events in South China from 1961 to 2011. J. Geogr. Sci. 25, 58–68. doi: 10.1007/s11442-015-1153-3
Roca, R., Alexander, L. V., Potter, G., Bador, M., Jucá, R., Contractor, S., et al. (2019). FROGs: a daily 1°x1° gridded precipitation database of rain gauge, satellite and reanalysis products. Earth Syst. Sci. Data. 11, 1017–1035. doi: 10.5194/essd-11-1017-2019
Roxy, M. K., Ghosh, S., Pathak, A., Athulya, R., Mujumdar, M., Murtugudde, R., et al. (2017). A threefold rise in widespread extreme rain events over central India. Nat. Commun. 8:708. doi: 10.1038/s41467-017-00744-9
Schaake, J., Spring, S., Henkel, A., and Cong, S. (2004). “Application of PRISM climatologies for hydrologic modeling and forecasting in the western U.S,” in 18th conference on hydrology. (Seattle, WA: American Meteorology Society).
Schamm, K., Ziese, M., Becker, A., Finger, P., Meyer-Christoffer, A., Schneider, U., et al. (2014). Global gridded precipitation over land: a description of the new GPCC First Guess Daily product. Earth Syst. Sci. Data 6, 49–60. doi: 10.5194/essd-6-49-2014
Sen, P. K. (1968). Estimates of the regression coefficient based on kendall's Tau. J. Am. Stat. Assoc. 63, 1379–1389. doi: 10.1080/01621459.1968.10480934
Shige, S., Kida, S., Ashiwake, H., Kubota, T., and Aonashi, K. (2013). Improvement of TMI rain retrievals in mountainous areas. J. Appl. Meteorol. Climatol. 52, 242–254. doi: 10.1175/JAMC-D-12-074.1
Shige, S. M. K., Yamamoto, and Taniguchi, A. (2015). Improvement of TMI rain retrieval over the Indian subcontinent. Remote Sensing Terrestrial Water Cycle, Geophys. Monogr. 206, 27–42. doi: 10.1002/9781118872086.ch2
Shige, S., Nakano, Y., and Yamamoto, M. K. (2017). Role of orography, diurnal cycle, and intraseasonal oscillation in summer monsoon rainfall over the western ghats and Myanmar coast. J. Clim. 30, 9365–9381. doi: 10.1175/JCLI-D-16-0858.1
Sun, Q., Miao, C., Duan, Q., Ashouri, H., Sorooshian, S., and Hsu, K.-L. (2018). A review of global precipitation data sets: data sources, estimation, and intercomparisons. Rev. Geophys. 56, 79–107. doi: 10.1002/2017RG000574
Tapiador, F., Turk, J., Petersen, W., Hou, A., García-Ortega, E., Machado, L., et al. (2012). Global precipitation measurement: methods, datasets and applications. Atmos. Res. 104–105, 70–97. doi: 10.1016/j.atmosres.2011.10.021
Van Den Besselaar, E. J. M., Van Der Schrier, G., Cornes, R. C., Iqbal, A. S., and Klein Tank, A. M. G. (2017). SA-OBS: a daily gridded surface temperature and precipitation dataset for Southeast Asia. J. Clim. 30, 5151–5165. doi: 10.1175/JCLI-D-16-0575.1
Venkata Rao, G., Venkata Reddy, K., Srinivasan, R., Sridhar, V., Umamahesh, N. V., and Pratap, D. (2020). Spatio-temporal analysis of rainfall extremes in the flood-prone Nagavali and Vamsadhara Basins in eastern India. Weather Clim. Extremes 29:100265. doi: 10.1016/j.wace.2020.100265
Xie, P. (2008). “CPC unified gauge-based analysis of global daily precipitation,” in: Western Pacific Geophysics Meeting. (Cairns, Australia).
Xie, P., Joyce, R., Wu, S., Yoo, S.-H., Yarosh, Y., Sun, F., et al. (2017). Reprocessed, bias-corrected CMORPH global high-resolution precipitation estimates from 1998. J. Hydrometeorol. 18, 1617–1641. doi: 10.1175/JHM-D-16-0168.1
Yatagai, A., Kamiguchi, K., Arakawa, O., Hamada, A., Yasutomi, N., and Kitoh, A. (2012). APHRODITE: constructing a long-term daily gridded precipitation dataset for asia based on a dense network of rain gauges. Bull. Am. Meteorol. Soc. 93, 1401–1415. doi: 10.1175/BAMS-D-11-00122.1
You, Q., Kang, S., Aguilar, E., Pepin, N., Flügel, W.-A., Yan, Y., et al. (2011). Changes in daily climate extremes in China and their connection to the large scale atmospheric circulation during 1961–2003. Clim. Dyn. 36, 2399–2417. doi: 10.1007/s00382-009-0735-0
Zhang, X., Alexander, L., Hegerl, G., Jones, P., Tank, A., Peterson, T., et al. (2011). Indices for monitoring changes in extremes based on daily temperature and precipitation data. Wiley interdisciplinary reviews. Clim. Change 2, 851–870. doi: 10.1002/wcc.147
Keywords: precipitation extremes, observational uncertainties, in situ, satellite observation, satellite correction
Citation: Nguyen P-L, Bador M, Alexander LV, Lane TP and Funk CC (2020) On the Robustness of Annual Daily Precipitation Maxima Estimates Over Monsoon Asia. Front. Clim. 2:578785. doi: 10.3389/fclim.2020.578785
Received: 01 July 2020; Accepted: 30 September 2020;
Published: 30 October 2020.
Edited by:
Dann Mitchell, University of Bristol, United KingdomReviewed by:
Milind Mujumdar, Indian Institute of Tropical Meteorology (IITM), IndiaJun Matsumoto, Tokyo Metropolitan University, Japan
Copyright © 2020 Nguyen, Bador, Alexander, Lane and Funk. This is an open-access article distributed under the terms of the Creative Commons Attribution License (CC BY). The use, distribution or reproduction in other forums is permitted, provided the original author(s) and the copyright owner(s) are credited and that the original publication in this journal is cited, in accordance with accepted academic practice. No use, distribution or reproduction is permitted which does not comply with these terms.
*Correspondence: Phuong-Loan Nguyen, phuongloan.nguyen@student.unsw.edu.au