AMOC Recent and Future Trends: A Crucial Role for Oceanic Resolution and Greenland Melting?
 Didier Swingedouw1*
  Marie-Noëlle Houssais2 Christophe Herbaut2 Anne-Cecile Blaizot2
  Marion Devilliers3 Julie Deshayes2
- 1Environnements et Paléoenvironnements Océaniques et Continentaux (EPOC), UMR CNRS 5805, EPOC-OASU Université de Bordeaux, Pessac, France
- 2LOCEAN/IPSL (Sorbonne universités, SU–CNRS–IRD–MNHN), Paris, France
- 3Danish Meteorological Institute, Copenhagen, Denmark
The Atlantic Meridional Overturning Circulation (AMOC) is a crucial element of the Earth climate. It is a complex circulation system difficult to monitor and to model. There is considerable debate regarding its evolution over the last century as well as large uncertainty about its fate at the end of this century. We depict here the progress since the IPCC SROCC report, offering an update of its chapter 6.7. We also show new results from a high-resolution ocean model and a CMIP6 model to investigate the impact of Greenland Ice Sheet (GrIS) melting, a key uncertainty for past and future AMOC changes. The ocean-only simulation at 1/24° resolution in the Arctic-North Atlantic Ocean performed over the period 2004–2016 indicates that the spread of the Greenland freshwater runoff toward the center of the Labrador Sea, where oceanic convection occurs, seems larger in this model than in a CMIP6 model. Potential explanations are related to the model spatial resolution and the representation of mesoscale processes, which more realistically transport the freshwater released around the shelves and, through eddies, provides strong lateral exchanges between the fine-scale boundary current and the convective basin in the Labrador Sea. The larger freshening of the Labrador Sea in the high-resolution model then strongly affects deep convection activity. In the simulation including GrIS melting, the AMOC weakens by about 2 Sv after only 13 years, far more strongly than what is found in the CMIP6 model. This difference raises serious concerns on the ability of CMIP6 models to correctly assess the potential impact of GrIS melting on the AMOC changes over the last few decades as well as on its future fate. To gain confidence in the GrIS freshwater impacts on climate simulations and therefore in AMOC projections, urgent progress should be made on the parameterization of mesoscale processes in ocean models.
Introduction
The AMOC is a large-scale oceanic circulation that brings warm and salty water in the North Atlantic high latitudes, where it cools, releases heat to the atmosphere, and eventually sinks to the deeper ocean after a number of complex oceanographic processes. Its impacts on climate and biogeochemistry is worldwide and complex as well, driven notably by large-scale atmospheric teleconnection patterns.
The classical view of the AMOC as a global conveyor belt from Broecker (1987) has been deconstructed by physical oceanography literature (Lozier, 2010). Indeed, by construction, the AMOC is aggregating a mosaic of currents with different dynamics and drivers and therefore multiple processes that can affect them. A classical belief remains that the AMOC is fed by the North Atlantic convection sites, where deep water is formed. Those sites, mainly located in the Nordic Seas and in the subpolar gyre (SPG), are sensitive to a lot of forcing, including stochastic atmospheric variations and interactions with sea ice, thus their exact location can move in a changing climate (cf. Lique and Thomas, 2018). The paradigm of the importance of deep convection on the AMOC has been recently questioned, using less than 5 years of oceanic observations (Li et al., 2021a). Water mass transformation in the deeper ocean, through eddies (Lozier et al., 2019), internal tides (de Lavergne et al., 2017), as well as the wind forcing, clearly also plays an important role in the AMOC behavior. Thus, there are still a number of issues regarding the drivers of its energetics, its dynamics, and its latitudinal coherence. In all those aspects, observational data at different locations in the Atlantic Ocean and on a long-enough time frame remain the key for our progress in understanding.
What Do the Latest Observations Tell Us? The Key Role of Time Scales
The IPCC SROCC report (Collins et al., 2019) was assessing with medium confidence that the AMOC might have weakened over the last few decades. Since then, the RAPID array has shown a slight increase in the AMOC, and the weakening trend over 2004–2020 is not significant at the 95% level anymore (Moat et al., 2020). The issue of detectability of AMOC changes from short term series is indeed a serious one, and a detection analysis revealed that a median of 24–43 years (depending on the choices for internal variability) might be necessary to extract any significant trend in the RAPID dataset, which brings us to 2028 at least if we use the RAPID array (Lobelle et al., 2020).
On a longer time frame, the first AMOC proxy records that were suggesting a weakening (Caesar et al., 2018; Thibodeau et al., 2018; Thornalley et al., 2018) have been complemented by additional paleo proxy records of the AMOC that also show such a weakening over the historical period (Caesar et al., 2021). Nevertheless, the latter study did not include all the available paleo proxy records of the AMOC over the recent period, and some of them disagree with such a conclusion (Moffa-Sánchez et al., 2019). The use of Sea Surface Temperature (SST) as a fingerprint of the AMOC in Caesar et al. (2018) reconstruction is debatable because of large uncertainties on the causes of the warming hole in the North Atlantic. Indeed, other processes than the heat convergence related to the AMOC could have played a considerable role, like the anthropogenic aerosols (Menary et al., 2020b), the changes in cloud coverage (Keil et al., 2020) or the changes in wind stress and associated heat fluxes (Li et al., 2021b), possibly related to the warming of the Indian Ocean and associated teleconnection patterns (Hu and Fedorov, 2020).
Thus, other indications based on instrumental observations of the evolution of the AMOC strength seem crucial to gain confidence in the supposed weakening over the twentieth century. The centennial freshening trend of the upper layers of the subpolar gyre presented in the study of Friedman et al. (2017) and the recent extreme freshening over at least a century (Holliday et al., 2020) are providing insights in that direction. Indeed, Sea Surface Salinity (SSS) is known to be a prominent variable in driving the meridional density gradient and the AMOC (Sgubin et al., 2015), so that a decrease in SSS might be strongly linked to a weakening of the AMOC. Nevertheless, there are still large uncertainties regarding that trend, as highlighted in Stammer et al. (2021), since it is positive on a shorter time frame (from 1960) as also highlighted in Friedman et al. (2017), while on a longer time frame, uncertainty in the SSS data increases.
Another evidence of a changing ocean circulation on a centennial time scale has been provided by a reconstruction of the Florida current, the precursor of the Gulf Stream. By using tide gauges, Piecuch (2020) indicated a weakening of its strength over the last century, which might also be coherent with an AMOC weakening, although numerous other processes could also be incriminated for explaining such a trend (Diabaté et al., 2021). Thus, some different lines of evidence are supporting a decline of the AMOC over the last century, but the confidence in such a decline remains moderate since those evidences are indirect measurements of the AMOC, while century-long measurements are needed to assess the significance of the trends.
On top of this possible AMOC weakening over the last century, a recent paper (Boers, 2021) even suggested that the AMOC might be approaching a tipping point. To reach such a conclusion, Boers (2021) used a new early warning indicator based on a few oceanic variables like SST and SSS, that are only available for less than two centuries. This early warning indicator is however poorly assessed and further studies might be needed to confirm its validity. In particular, Boulton et al. (2014), using a more classical early warning metric, was highlighting that knowledge of at least five centuries might be necessary in order to properly assess any robust early warning signal of any AMOC tipping point out of internal variability.
On a shorter time frame, but using more direct ocean observations, Worthington et al. (2021) showed that the AMOC may have not exhibited any weakening trend over the last 30 years. This is also what can be inferred from Caesar et al. (2018) reconstruction, and is therefore not a direct contradiction with the possibility of a long-term weakening of the AMOC, starting in the 1950s, with a clear rebound in the late 1990s and early 2000s. The question of time scale is indeed a crucial issue when discussing the possibility of a weakening of the AMOC since this ocean circulation is well-known for exhibiting strong internal variability at multi-decadal time scales (e.g., Ortega et al., 2015). Its latitudinal coherence for instance is strongly dependent on the time scale considered (Gu et al., 2020) and the same might be true concerning its drivers (Biastoch et al., 2021).
The next question that remains about this possible AMOC weakening is its origin. While a number of studies assumed that it has been anthropogenically forced, very few attribution studies have been led up to now.
Insights From CMIP6 Model Simulations
A first try of such an attribution has been performed by Bonnet et al. (2021). According to their results, based on a limited number of CMIP6 models, it might be possible to explain the weakening of the AMOC index from Caesar et al. (2018) over the last century to a large extent by internal variability at the multi-centennial time scale. This result was mainly based on one model who exhibited large centennial variability, in agreement with other CMIP6 models. The assessment of such a multi-centennial variability remains to be validated in paleodata, as well as the underlying mechanisms (first hints are provided in, e.g., Jiang et al., 2021). If true, this would imply a substantial underestimation of climate sensitivity—the level of warming for a doubling of CO2–when estimated over the historical period. Therefore, this result does not support the hypothesis formulated by Yang et al. (2016) or Caesar et al. (2018) stating that Greenland ice sheet (GrIS) melting might explain a large part of the reconstructed AMOC weakening. Nevertheless, CMIP6 models do not account for such an observed melting (Devilliers et al., 2021).
Using in situ observations since 1990, Majumder et al. (2021) found a freshening near the coast around Greenland, with potential transport toward the central Labrador Sea at synoptic scale. This questions the potential role meltwater from Greenland might have played over the historical period and might play in the future. To evaluate the potential impact of the on-going GrIS melting, Devilliers et al. (2021) have integrated a 10-member ensemble of historical simulations including observed freshwater input from Greenland since 1920. The meltwater estimate they used is based on an update of Bamber et al. (2018) showing that former estimates (e.g., Bamber et al., 2012) might have underestimated the melting, and therefore studies that use these former estimates (e.g., Böning et al., 2016) might have underestimated its impacts. However, the results from Devilliers et al. (2021), using the IPSL-CM6A-LR model, with about 1° resolution in the ocean, showed very little impact (hardly detectable) of this updated flux on the convection in the Labrador Sea and on the AMOC.
There is still considerable uncertainty in the fate of the AMOC for the coming century in the CMIP6 database as shown in Weijer et al. (2020), who stated that the “AMOC decline in CMIP6 is surprisingly insensitive to the scenario at least up to 2060.” This study uses the RAPID observations of the AMOC to select only the models close to the observed AMOC strength at 26°N when averaged from 2004 until 2017. From there, they found that the AMOC might decline by between 6 and 8 Sv (34–45%) by 2100, which is a bit larger than the total ensemble mean of CMIP6 projections.
Bellomo et al. (2021) have shown that the spread in the amplitude of the AMOC weakening explains a large proportion of the uncertainty in future climate projections in the North Atlantic sector, in particular for the temperature changes, the shift in mid-latitude jet and of the Inter-Tropical Convergence Zone (ITCZ). Monerie et al. (2021) also further confirmed the considerable role the North Atlantic changes could play for East Asian climate. Another new impact of the AMOC (since SROCC report) was highlighted in Yin and Zhao (2021) showing how an active AMOC is strongly limiting the number of extreme cold spells over the United States. It has also now been shown that an AMOC collapse in climate projections might strongly affect the survival of a number of amphibians, which is usually considered as a key indicator of environmental health (Velasco et al., 2021).
Last but not least, the SPG is still suspected to be potentially unstable in the coming century in a number of CMIP6 models, especially among the best in terms of representation of its mean stratification (Swingedouw et al., 2021). This increases the possibility of decadal cooling events of more than 2°C in the SPG, i.e., at least the double of the 2015 cold blob, whose impact on the occurrence of the summer heat waves over Europe the same year have been further confirmed in new model simulations (Mecking et al., 2019). This counter-intuitive relationship between cold blob in the SPG and heat waves over Europe is due to the teleconnection between the North Atlantic and bordering and remote regions, as also described in Ruprich-Robert et al. (2021).
New Knowledge Regarding the Processes That Modulate the AMOC
Thus, while GrIS melting is suspected to have played a role in the possible weakening of the AMOC (Rahmstorf et al., 2015; Yang et al., 2016; Caesar et al., 2021), studies by Bonnet et al. (2021) and Devilliers et al. (2021), using CMIP6-type models, indicate that including this melting might be not necessary to explain such a trend in CMIP6 models. However, a number of limitations and biases in the representations of key processes for the AMOC are well-known in CMIP6 models (IPCC, 2021).
Recent studies have further highlighted the very strong complexity of the North Atlantic Ocean circulation, where mesoscale processes impact the larger scale. In particular, the differences in terms of contribution to the AMOC between subpolar convection sites as compared to Nordic Seas' ones have been investigated in a new array in the subpolar gyre named OSNAP (Lozier et al., 2019). Results from this array seriously question the role of the Labrador Sea as a key driver of the AMOC. While some models are often suspected of forming too much deep water in the Labrador Sea, the OSNAP array actually suggests over the period of its first published measurement (2017–2019) that the Labrador Sea plays a very small role in the deep water formation contributing to the AMOC: This brings out doubts on the validity of the models suspected of having a strong bias in deep water production in the SPG (Li et al., 2019; Koenigk et al., 2021).
While this sensitive question has been further tackled in a few models, the bias in deep water formation in the Labrador Sea is not “intrinsic” to all models; some models even perform quite well as compared to OSNAP observations (Menary et al., 2020a). Therefore, there is not necessarily a paradigm shift from OSNAP observations: the western SPG can still play a crucial role in the AMOC through transformation of deep water in the Irminger Sea for instance. Furthermore, some climate models, whose mean states are in agreement with OSNAP observations, can still show that their AMOC variability remains controlled to a large extent by the Labrador Sea (Yeager et al., 2021). Indeed, even though there is a weak mean surface diapycnal transformation in the Labrador Sea, multidecadal AMOC variability can be traced to anomalous production of dense Labrador Sea Water formed in the western subpolar gyre. Upper waters of the Atlantic originating from the tropical area are transformed into denser water mainly through winter convection driven by surface cooling (Swingedouw et al., 2007a). This transformation is a key precursor of overturning changes, since intermediate and deep waters thus formed eventually feed the lower limb of the AMOC (Desbruyères et al., 2019).
In the Nordic Seas, the dense waters formed in winter eventually spill over the Greenland-Iceland-Scotland ridge and flow southwards in complex deep canyons and channels. There, entrainment of ambient waters contributes to increasing the volume of deep water that ultimately enters the lower limb of the AMOC (Quadfasel and Käse, 2007). The overflow waters remained stable over the last two decades (Østerhus et al., 2019), while new routes have been recently discovered (Chafik et al., 2020). The MOC in the Nordic Seas, when reconstructed on the centennial time scale (Rossby et al., 2020) also exhibits quite stable properties. In this respect, the AMOC weakening over the last century, if true, might be dominated by a change in water mass transformation in the SPG, which feeds the upper part of the North Atlantic deep water masses (Robson et al., 2016).
Thus, if the GrIS melting modulates the changes in the deep-water mass formation, it should be occurring in the SPG, but former analyses do not detect any clear signatures of this melting on convection and deep-water formation in the Labrador Sea before the 2010s (Böning et al., 2016). Nevertheless, a recent study has updated the amount of GrIS melting (Bamber et al., 2018) and found a larger meltwater amount as compared to former estimates (Bamber et al., 2012) used in previous ocean modeling studies. The impact of these updates on ocean modeling results remains unknown in high-resolution models, while the effect is very moderate in a CMIP6 climate model according to Devilliers et al. (2021).
Fresh News From High Resolution Model Simulations
The question of the importance of resolution in climate models is raging at the moment. While it seems reasonable to believe that higher resolution models better resolve some key processes in the climate system, and notably in the ocean, it remains to be properly proven that these processes are really essential for the fate of the AMOC. For instance, one might argue that the transformation of water masses would be the most crucial process. Then, even though coarse resolution models do not simulate all the processes leading to this transformation, they might be able to capture the first order drivers, related to atmosphere heat fluxes and mean ocean stratification. On this topic, the recent Nobel Prize Klaus Hasselmann stated in 2006 (von Storch and Olbers, 2007) that he was not “convinced that the eddy-resolving models were really worth the effort. They burnt up a lot of computing time. Essentially, they showed that there were eddies, which we knew anyway.” He continued stating that he “was not convinced that the interaction between the eddies and the mean flow could not be parameterized sufficiently well for climate modeling purposes with a standard eddy transfer approach. Or, at least, the eddy-resolving simulations had not come up with a better parametrization. I am not convinced that we were discovering something basically new.” This very controversial, and possibly outdated quote is still raising an interesting opinion, namely that improved resolution per se is not necessarily resolving all key processes, and that care should be observed when increased resolution is proposed as a way to solve most model biases. Indeed, the main drawback of high resolution remains in its very high computing cost, while large ensembles of climate models clearly underline the considerable role of internal variability on large spectra of climate variability (Deser et al., 2020). Bonnet et al. (2021) also showed that it can strongly affect the AMOC fate and the attribution of any on-going changes. In this respect, the use of high-resolution climate models clearly limits the ability to analyze the physics behind this internal variability properly. Thus, there are clearly pros and cons regarding the resolution of ocean models, so that both approaches (HR ocean modeling and production of large ensemble of climate model simulations) should be taken hand in hand and interact more strongly to feed each other.
Since the provocative quote from Hasselmann, there have been interesting advances on what high resolution modeling can bring in our understanding of the AMOC, and the way to improve its representation in modeling tools. In that respect, the paper of Hirschi et al. (2020) provides key insights on the role of resolution in ocean models for the AMOC means state, dynamics and variability. By using a wide range of ocean-only models, they do show that eddy-rich models (about 2–3 km resolution) do have a stronger AMOC than lower resolution models (about 100 km horizontal resolution) and eddy resolving models (about 10–25 km resolution) by around 3–4 Sv, or 20–25% of the mean AMOC, which is far from negligible. According to these authors, this can be attributed to the improvements in the position and strength of the different currents and notably the SPG strength that is underestimated in low resolution models. This underestimation is associated with misrepresentation of complex processes related to eddies but also bathymetry representation that strongly impacts the vorticity budget (Le Corre et al., 2020). In this respect, the impact of resolution seems crucial in the integral value of large-scale features, and their present-day parameterization does not succeed to solve this at the moment.
As a possible consequence of this bias in the mean state (e.g., Weijer et al., 2020), Roberts et al. (2020) do find a stronger weakening in the projections in higher resolution models from HighResMIP, in comparison to the results of coarser resolution models. These authors also do find a stronger AMOC in these higher resolution models (although they are not at eddy-rich resolution). The reasons for these differences are still unclear. It might be related to the stronger SPG in those higher resolution models, which might induce a stronger positive salinity feedback for the AMOC (Born et al., 2016; Jackson et al., 2020). It could be also due to stronger convection in western SPG as found in the models analyzed in Roberts et al. (2020), which is not necessarily realistic (Lozier et al., 2019). Indeed, although there is some improvement in the higher resolution models (eddy permitting) they still have strong biases (Jackson et al., 2020). In this respect, analysis from Hirschi et al. (2020) and Hewitt et al. (2020) indicate that eddy-rich resolution models might be necessary, which might be over-costly in terms of computing time at the moment when coupled to the atmosphere.
Eddy-rich oceanic model simulations from the study of Rühs et al. (2021) reveals an eastwards shift of the convection activity from the Labrador to the Irminger Sea in the mid-2010s. The authors argued that this could be related to the freshening trend in the Labrador Sea possibly due to the increase of GrIS melting. A possible impact of ocean eddies is linked to their role in spreading of the surface freshwater input from the GrIS into the interior Labrador Sea as was suggested by, e.g., Yang et al. (2016) and more recently from glider observations by Hendry et al. (2021).
Given those improvements found in higher resolution models in the ocean, it is a possibility that the role of past GrIS melting might have been underestimated in coarse resolution models, as it was argued in Rahmstorf et al. (2015). To gain knowledge on this topic, the present study presents new high-resolution ocean-only simulations (eddy rich) with and without the inclusion of the updated estimate of the melting of GrIS (Bamber et al., 2018) over the last few decades. We compare the results of a CMIP6 model with 20 members, in order to correctly account for intrinsic variability in coupled climate models.
As compared to former studies, the updates are two-fold: the high-resolution ocean model does not include any salinity restoring, which is crucial for not damping the impact of GrIS melting, although this can strongly affect its mean state (e.g., Biastoch et al., 2021). Secondly, we compare this ocean-only model with CMIP6-like simulations as in Devilliers et al. (2021), with a larger number of members in order to further gain in robustness.
Materials and Methods
1/24° High-Resolution Simulation in the Atlantic
To analyze the response of the ocean to the Greenland freshwater release, we use a 1/24° sea ice-ocean model configuration of the Arctic Ocean and the North Atlantic based on NEMO 3.6 (Madec, 2015). The simulations from this model will be named HR for high resolution in the following. The model surface forcing is based on 6-h surface atmospheric fields from the ERA-I reanalysis (Dee et al., 2011). Turbulent heat fluxes are computed using the Large and Yeager (2004) bulk formulae with daily dew point temperature, surface air temperature, wind speed and sea level pressure as the main atmospheric inputs. Other forcing fields from the reanalysis include the 10-m wind and the downward radiative fluxes. Surface albedos and temperatures simulated by the model are used to calculate the upward components of the radiative fluxes. The domain encompasses the Arctic Ocean and the North Atlantic Ocean, with open boundaries at 28°N in the Atlantic and at Bering Strait, along which the velocity and tracer distributions are prescribed from the 5-day outputs of a global ¼° resolution hindcast simulation. The resolution of the model in the North Atlantic is shown in Figure 1. It is around 2–3 km in the Labrador Sea and subpolar gyre.
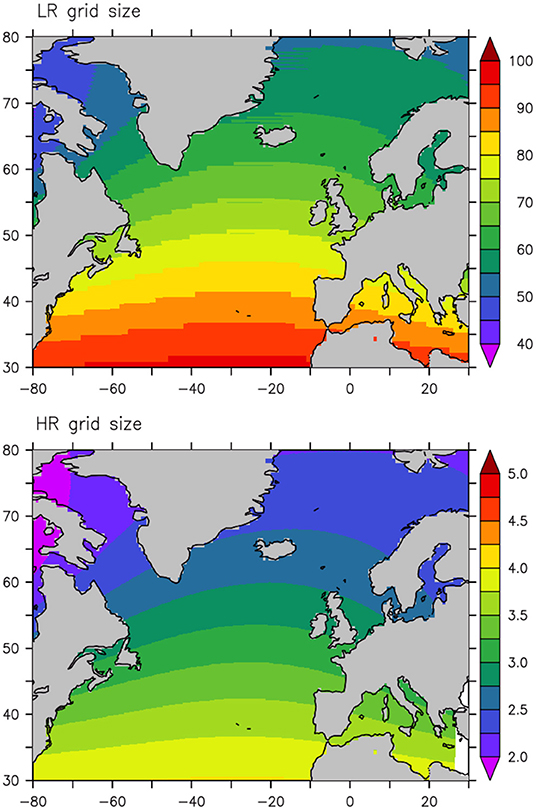
Figure 1. Resolution of the grid (in meters) represented as the square root of the length scale of the latitudinal grid size multiplied by the longitudinal grid size. On top is represented the resolution in the ocean of the low resolution (LR) coupled model, while on the bottom is shown the resolution of the high resolution (HR) regional ocean model.
The study compares two simulations differing by their freshwater input. In the control experiment, a monthly climatological runoff is applied, whereas in the sensitivity experiment (named melting hereafter), the runoff fluxes are replaced by reconstruction of GrIS and surrounding glaciers and ice caps melting from Bamber et al. (2018) while additional Arctic coastal runoff (the part which does not flow through the main river outlets) extracted from Dai and Trenberth (2002) dataset is also included. The GrIS and surrounding glaciers and ice caps melting sources are interpolated on the model grid following the same algorithm as that used for the IPSL-CM6A-LR model (Devilliers et al., 2021, cf. their Figure 1). However, in contrast to the IPSL-CM6A-LR model, the meltwater resulting from solid ice discharge (icebergs), although fully included, is not spread offshore using the Altiberg distribution. The control simulation extends from 2004 to 2017 while the sensitivity experiment is only available from 2004 to 2016 since Bamber et al. (2018) estimates stop in 2016. There is no restoring of the surface salinity to observations. Still, the ocean fields which are prescribed at the southern boundaries of the model domain, are kept unchanged between the two experiments.
IPSL-CM6A-LR Large Ensemble
To compare those HR simulations to the results at lower resolution, we use a large ensemble of coupled ocean-atmosphere simulations from the IPSL-CM6A-LR model (Boucher et al., 2020) with 1° resolution in the ocean (eORCA1.2 grid). The simulations from this model will be named LR for low resolution in the following. This ocean-atmosphere general circulation model (OAGCM) has the same NEMO3.6 oceanic component as the one for the HR simulations but on a different grid. The resolution of the model in the North Atlantic is shown in Figure 1. It is around 50–60 km in the Labrador Sea and subpolar gyre, or around 20 times coarser than in the eddy rich HR simulations.
The experimental design of those simulations is described in Devilliers et al. (2021). It is different from the one of the HR model in the sense that runoff changes in the Arctic are not accounted for in those simulations. Those two sets of simulations have not been entirely designed to be comparable, and we take advantage here of their existence, as experiments of opportunities, to try to analyze their similarities and differences. Nevertheless, no proper attribution of the differences will be possible due to the differences in the set up. This is why we present their responses in the independent figures and do not try to formally compare them, but mainly search for the most striking differences reaching an order of magnitude.
As compared to Devilliers et al. (2021) 10 more members were added, which brings the ensemble to a total of 20 members both for the melting and control simulations. This should help to gain further confidence in the GrIS melting freshwater impacts on those simulations, given the large internal variability in this coupled model (e.g., Bonnet et al., 2021). The 20-member simulations are using observed historical external forcing (greenhouse gases, natural and anthropogenic aerosols, solar variations, stratospheric ozone, land use…). The control simulations start in 1850 from different years of the pre-industrial 1,000-year simulation. The melting experiments include GrIS melting reconstruction (which for the period 2004–2017 are identical to HR) and start in 1920 from the initial conditions of the different control simulations. They also include estimates of iceberg meltwater distribution (cf. Devilliers et al., 2021).
Freshwater Perturbation
In the LR experiments, 12,466 km3 of additional freshwater are released in the melting simulations as compared to the control simulations over the period 1920–2014. Over the last 10 years of the simulations (2005–2014), the additional freshwater forcing in the Greenland vicinity (cf. Figure 1 from Devilliers et al., 2021) is about 20 mSv including both runoff and iceberg forcing from Bamber et al. (2018). In the HR, the freshwater anomalies in the Greenland vicinity is about 35 mSv (Supplementary Figure 1). This is because the initial climatology of Greenland runoff is very weak as compared to the updated values from Bamber et al. (2018). More than 90% of the additional meltwater is coming from GrIS in both ensembles of simulations. In the HR simulations, there are other adjustments of freshwater to better account for coastal runoff in the Arctic (not coming from the main rivers but disseminated along the coast). This brings about 15 mSv additional freshwater along the Siberian coast toward the Arctic, 11 mSv on the Arctic Canadian coast and 7 mSv on the Scandinavian coast. This adjustment of freshwater runoff was done to improve the realism of the HR perturbation simulation and their sensitivity to changes in the Arctic. Nevertheless, this brings a clear issue in the sense that this HR simulation is not only a simulation of sensitivity to GrIS melting, but also accounts for other Arctic freshwater sources, which limits the comparison with LR simulations. Nevertheless, we argue here that Greenland freshwater input represents the largest amount of perturbation in the Labrador Sea vicinity over the length of the melting simulation (cf. Supplementary Video 1), which should allow to qualitatively evaluate the differences in the impact of GrIS melting depending on the resolution, which is 20 times finer in the HR simulations as compared to the LR.
The two sets of simulations at LR and HR including or not Bamber et al. (2018) estimate of meltwater are therefore not fully comparable. Their length is different, and the anomaly of freshwater forcing is also almost twice larger in the HR simulation over the common period. In this respect, the two sets of simulations are here mainly shown for illustrative purposes, to exhibit the potential impact of GrIS melting on the Labrador Sea convection depending on the oceanic resolution, but suffers from large differences in their experimental design to allow a proper comparison. Also, the surface forcing and the background ocean circulation differs.
Results From the New Simulations
As it is clear from the experimental design, the ocean-only HR and coupled LR twin simulations (melting vs. control) are different and cannot be rigorously directly compared. The AOGCM LR simulations comprise a large set of members and are integrated over a long time-frame, while the OGCM HR simulations are forced simulations integrated over a shorter period and include both runoff and solid ice discharge at coastal locations (no iceberg transport), both considered as freshwater input. We here explore and illustrate the main responses of the ocean to the additional freshwater in the North Atlantic in both pairs of simulations. Figures 2, 3 show the changes in SSS in the HR OGCM and LR AOGCM, respectively, estimated by comparing control and sensitivity simulations. The two sets of simulations have several features in common in terms of SSS anomalies. The strongest SSS anomalies averaged over the respective simulation duration can be found in the Baffin Bay where they reach more than 1 PSU in HR. Large anomalies are also found around the Labrador basin, along the West Greenland Current and Labrador Current pathways. The fresh anomalies then mix across the North Atlantic Current (NAC) and spread eastward across the North Atlantic Ocean along the southern edge of the subpolar gyre (Supplementary Video 1).
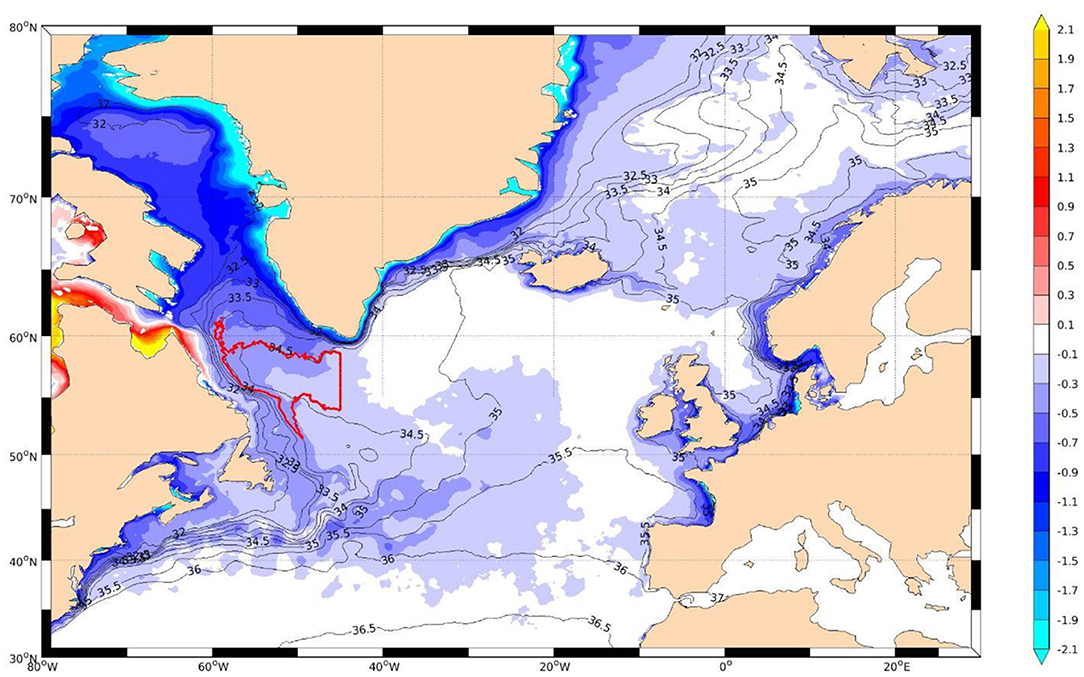
Figure 2. SSS anomalies (melting minus control experiments) averaged over years 2004–2016 in HR expressed in PSU. The mean state of the control simulation averaged over the same period is shown in contour. The red line stands for the definition of the Labrador Sea convection site (defined as the region where the MLD is larger than 600 m at least during 1 month in the control simulation).
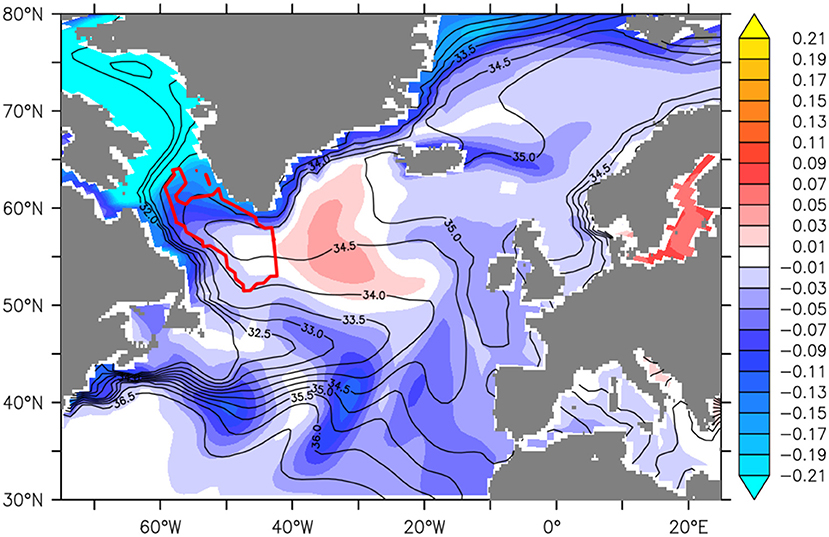
Figure 3. SSS anomalies (averaged over the 20 members and over the 95 years of simulation in January–February–March) in LR simulations expressed in PSU. The mean state of the control simulations averaged over the same period is shown in contour. The red contour is representing the convection site definition of the Labrador Sea in the LR historical simulations (defined as the region where the MLD is larger than 600 m at least during 1 month in the control simulations).
There are however significant differences between the two sets of simulation. In HR, the largest anomalies remain along the Greenland coast, near the freshwater source while, in LR, the shelf-basin contrasts around Greenland are much less preserved. The year-to-year development of those SSS anomalies in HR (Supplementary Video 1) actually shows that the anomalies are first found at their injection points around Greenland. After about 2 years (in 2006), we see a clear accumulation in the Baffin Bay and to a lesser extent along the Labrador Current. After around 4 years (in 2008), the SSS anomalies already invade the Labrador Sea interior and start to develop along the NAC as well. At the end of the simulation (from about 2015) those SSS anomalies reach the eastern North Atlantic and start to go northward or southward. A positive SSS anomaly also starts to develop in the Irminger Sea, most notably at the end of the simulation. The surface freshwater pathways are different in LR with the freshwater continuing along the Canary Current, forming the so-called “freshwater leakage” highlighted in Swingedouw et al. (2013) as an escape pathway for freshwater to leave the SPG. This signature is less clear in the HR simulations and might be related to the longer temporal size of the LR simulations, allowing for the freshwater leakage to develop more.
In the center of the SPG, there is a slight positive anomaly, which might reflect a dynamical adjustment from the ocean in the LR simulations (Figure 3). We hypothesize that this anomaly could be due to strengthening of the SPG due to the increase in center to shelf-basin density gradient (e.g., Born and Stocker, 2014), related to the freshening of the SPG border. This strengthening can increase the entrainment of NAC water masses in the SPG, and might explain the slight increase of SSS found in the Irminger Sea in the LR simulations. This positive SSS anomaly is also clearly reminiscent of the positive anomaly found in the Irminger Sea in the HR simulation (in all years, although with varying amplitude, Supplementary Video 1).
A crucial difference between the two sets of simulations can be found in the central Labrador Sea, where the anomaly is larger in the HR. It is 0.31 PSU when averaged over the period 2004–2016 and over the convection site defined in Figure 2. It represents almost 1.5 interannual standard deviation in the HR control simulation. It even reaches more than 0.5 PSU in 2016. In the LR runs, the difference is 0.06 PSU when averaged over the whole period in the Labrador Sea convection site defined in Figure 3, or about 20% of the interannual standard deviation of the control runs. The penetration of the freshwater into the Labrador Sea interior, where convection occurs in the control runs, seems therefore more efficient in the HR runs (about 5 times more at least). Although the differences in freshwater input between HR and LR prevent any strong conclusions on this difference, we argue that part of it might be related to the differences in resolution as will be further discussed in the conclusions of this paper.
Figure 4 shows the mixed layer depth (MLD) averaged over the 2004–2016 period in the North Atlantic Ocean in the HR simulations. The MLD distribution in the control simulation (Figure 4, upper panel) captures the convection sites in the Labrador Sea, southeast and west of Iceland, in the Irminger Current, and in the Nordic Seas. The site with deepest MLD over the period considered is the Labrador Sea. This picture is in qualitative agreement with observations (e.g., Yeager et al., 2021), but we notice that convective activity in the Nordic Seas is underestimated, probably as a result of too fresh upper waters, and consequently too strong background stratification, which arises in absence of any surface salinity restoring in these simulations. The convection in the Irminger Sea seems also a bit smaller than the one estimated from Argo floats in Rühs et al. (2021). The distribution of MLD anomalies in the lower panel of Figure 4 shows that the Labrador Sea is the primary impacted region by additional freshwater input, while the other convections sites show limited changes in MLD. In the Labrador Sea, the anomalies over the whole period exceed 300 m, which is about half of the mean state value.
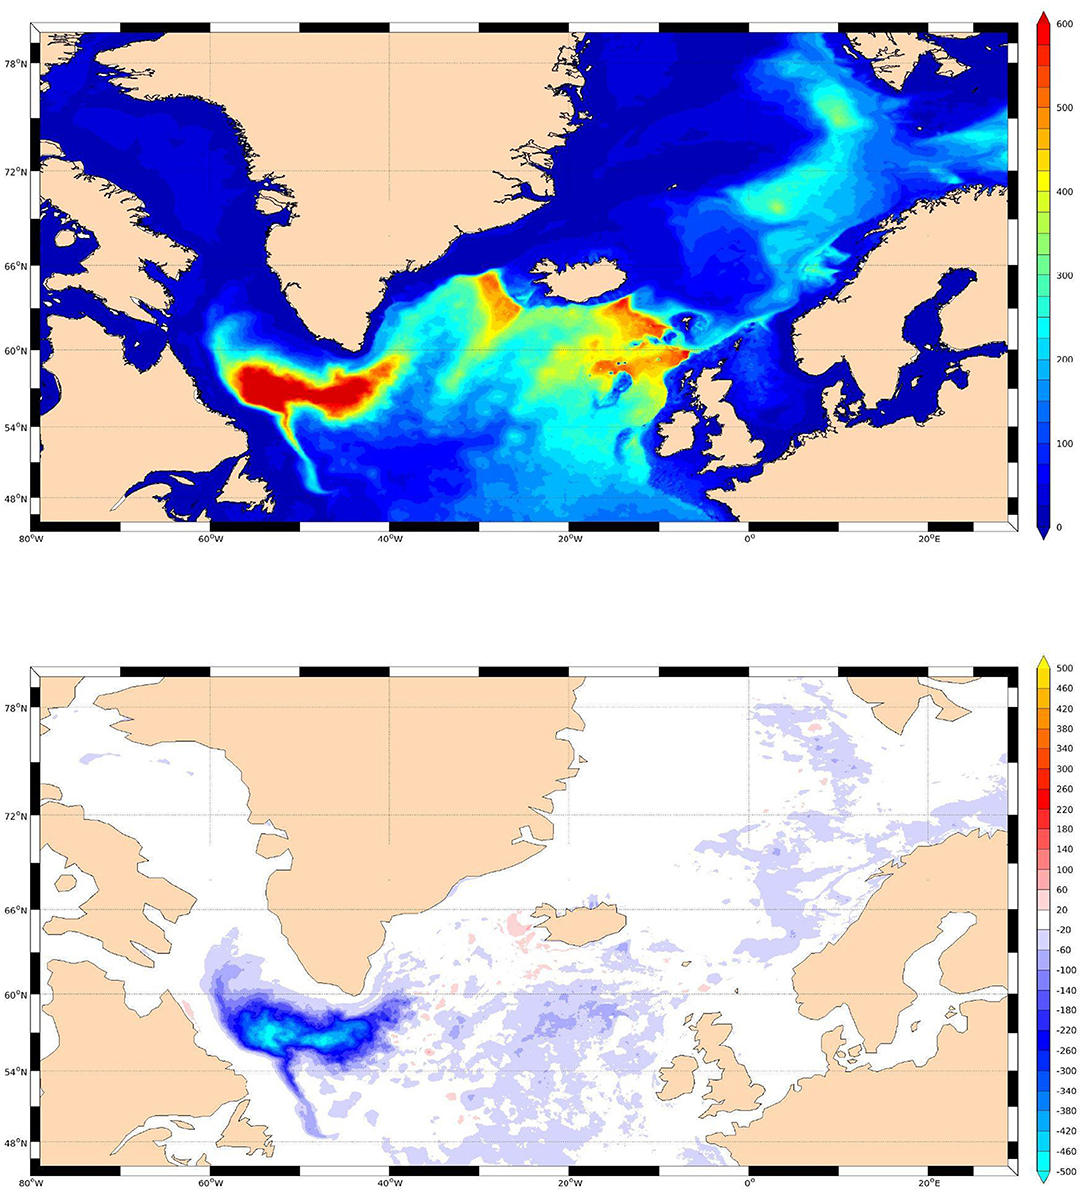
Figure 4. Winter (January–February–March) mixed layer depth (in meters): (upper panel) in the control experiment and (lower panel) anomaly between the control and sensitivity experiments, both shown as multiyear (2004–2016) averages.
The time evolution of the MLD in the Labrador Sea, shown in Figure 5, allows to see that the convection in the Labrador Sea has a strong interannual variability and can be compared with 2004–2014 observation-based estimate of convective activity from Figure 3 of Kieke and Yashayaev (2015), with some years with almost no convection activity (e.g., 2010) while others exhibit strong convective events (e.g., 2008). The strong convective event found in 2015 is also in agreement with observations (Yashayaev and Loder, 2017). A first impact of the GrIS melting on the mean MLD in the Labrador Sea can be found after about 2 years, from which the sensitivity experiment persistently shows smaller MLD than the control one. Nevertheless, it is after 10 years that the impact becomes really large, with clear differences higher than 3 standard deviations of interannual variability, notably in 2015 and 2016, where the high convective activity simulated in the control run is strongly reduced in the sensitivity experiment. Nevertheless, when standardized with the mean MLD from the control simulation, the changes seem to develop more monotonically as soon as after 1 year of freshwater release. Thus, we can conclude that the GrIS melting and Arctic runoff have a considerable impact on the Labrador Sea convective activity after less than a decade of additional freshwater input in those HR OGCM simulations. We argue, in agreement with Supplementary Video 1, that most of the freshening and therefore of the impact on MLD is coming from the Greenland vicinity, since the forcing in the Arctic has lower amplitude and slowly spreads in the subpolar region. A dedicated experiment with only GrIS melting from Bamber et al. (2018) might be necessary to fully prove this.
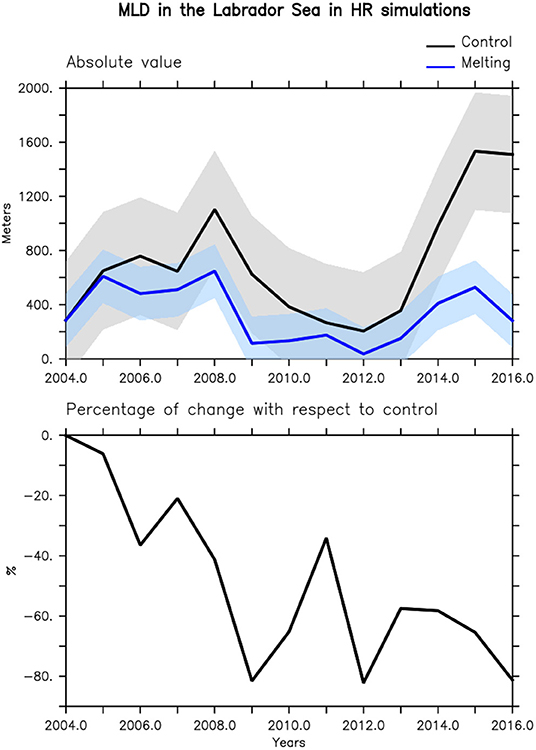
Figure 5. Winter mixed layer depth in the Labrador Sea as defined by the red contour in Figure 1, in the HR simulations, in black for the control and in blue for the melting simulations. The interannual standard deviations over the whole period is represented by the colored overlap of each curve. The annual mean values (in meters) are shown in top, while the changes in melting simulation with respect to control ones are shown in the bottom panel (in percent).
We now compare these results of MLD in the HR with the simulations from the LR. Figure 6 shows the differences in MLD over the 95 years of simulations averaged on the two 20-member ensembles available. Similarly to the results from Devilliers et al. (2021), we see a slight reduction of MLD in the Labrador Sea, while it is enhanced in the Irminger Sea. The changes remain however limited, about an order of magnitude smaller than the mean state MLD. The largest differences in MLD can be found in the Nordic Seas, although they also remain almost one order of magnitude lower than the mean state.
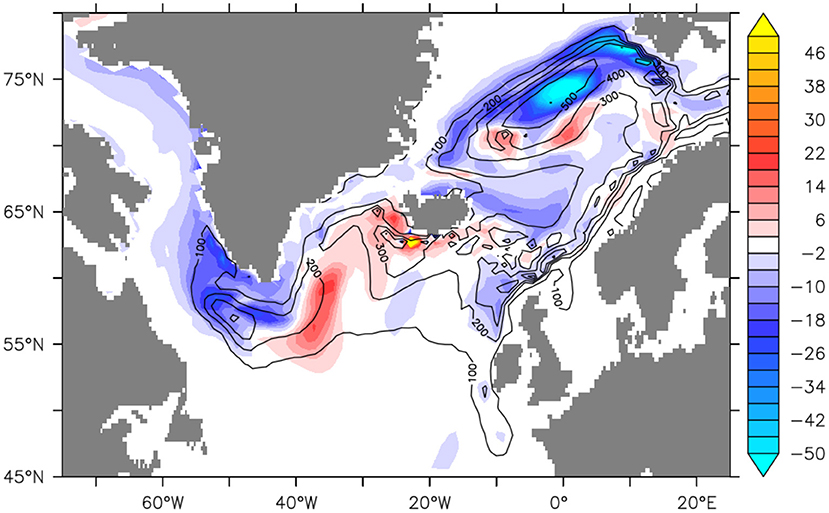
Figure 6. MLD anomalies in LR simulations (in meters) averaged over the 20 members and over the 95 years of simulation and in January–February–March. The mean state of the control simulation averaged over the same period is shown in contour.
The fact that the amplitude of the MLD changes remains limited in the LR simulations is further supported by Figure 7, which shows the time evolution of the MLD in the Labrador Sea (defined in Figure 3). From this figure, it is clear that the differences are very small and not significant in view of the ensemble spread. We thus conclude, as in Devilliers et al. (2021), that in this CMIP6 OAGCM, the inclusion of observed GrIS melting has a very limited impact on deep convection activity over the last century.
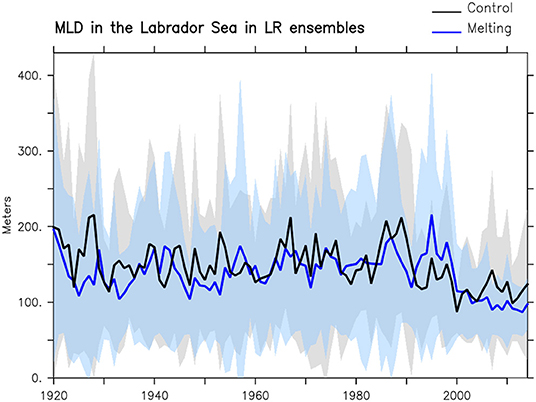
Figure 7. Evolution of the MLD (in meters) in the Labrador Sea convection site (defined in Figure 3) from the two 20-member LR ensembles averaged in January–February–March. In black is the ensemble of the control simulations and in blue, the ensemble of the melting simulations. The overlaps represent two standard deviations computed from the 20 members.
We now look at the impact of freshwater input most notably from GrIS melting on the AMOC. In the LR model, as shown in Devilliers et al. (2021), the impact of GrIS melting is very limited. Here, with our larger ensemble of 20 members, we do find at 45°N a slight decrease of the AMOC of 0.20 ± 0.39 Sv (0.18 ± 0.33 Sv at 26°N) over the whole period. It is 0.13 ± 1.0 Sv (0.1 ± 0.8 Sv at 26°N) over the period 2004–2014. We also compute the AMOC changes in density space (Supplementary Table 1). For the latter period, we also find a slight weakening of 0.24 ± 1.31 Sv at 45°N. When computed in sigma0-coordinate over the OSNAP section (Lozier et al., 2017) for the period 2004–2014, we find a MOC weakening of 0.57 ± 1.68 Sv along OSNAP east and a slight enhancement of 0.22 ± 0.84 Sv along OSNAP west, none of which being significant at the 95% level.
In the HR control simulation, the AMOC over the OSNAP array (Figure 8) shows similar vertical distribution and maxima as in the observations in their overlapping period (Lozier et al., 2019). Over the OSNAP array, the mean AMOC state (Figure 8) is in broad agreement with observational estimates. The AMOC weakening in the HR simulations (Figure 9) notably due to GrIS melting is about one order of magnitude higher than in the LR, a result in agreement with the larger changes in SSS and MLD in the Labrador Sea. The differences between melting and control simulations are always negative after 3 years of integration (2007). It becomes larger than 1 Sv after 10 years of integration (2014) both at OSNAP and at 45°N. It reaches a value larger than 1.5 Sv at the end of the simulation at 45°N and above 2 Sv at OSNAP array. The response of the AMOC at 45°N exhibits a negative difference emerging clearly from around 2012–2014, or after 8–10 years of integration of the meltwater anomalies. Such a time scale is short, but remains consistent with the 5–6 years estimated in Desbruyères et al. (2019) between changes in water mass transformation and the AMOC at 45°N from observation-based indices. We also notice a slight change in the distribution of the MOC transport in density space, with a shift toward lighter density range (Figure 8), which is also in agreement with what is found in the LR simulations (Supplementary Figure 3).
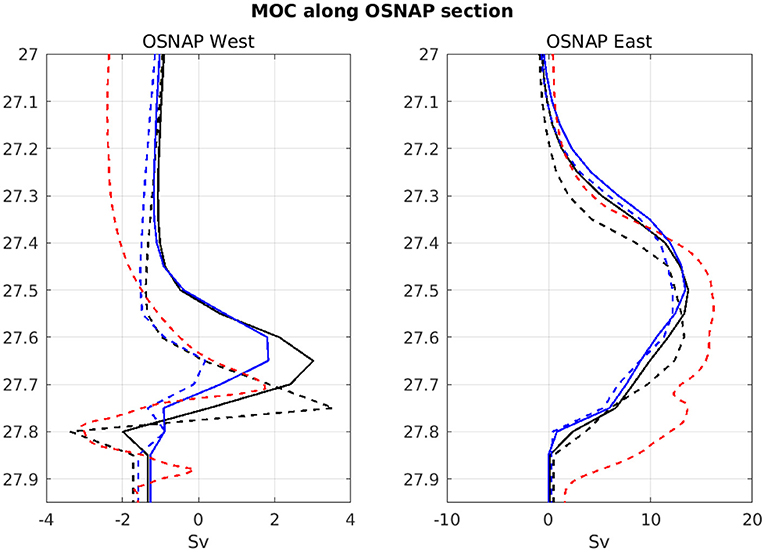
Figure 8. MOC (in Sv) along the OSNAP array, west on the left and east on the right, computed in density (sigma 0, expressed in kg/m3) space in the HR simulations. The thick black line stands for the average over the period 2004–2016 in control simulation, the thick blue line for the same average in the melting simulation. The dotted lines are showing the year 2015 in control (black), melting (blue), and observations (red) from Lozier et al. (2019).
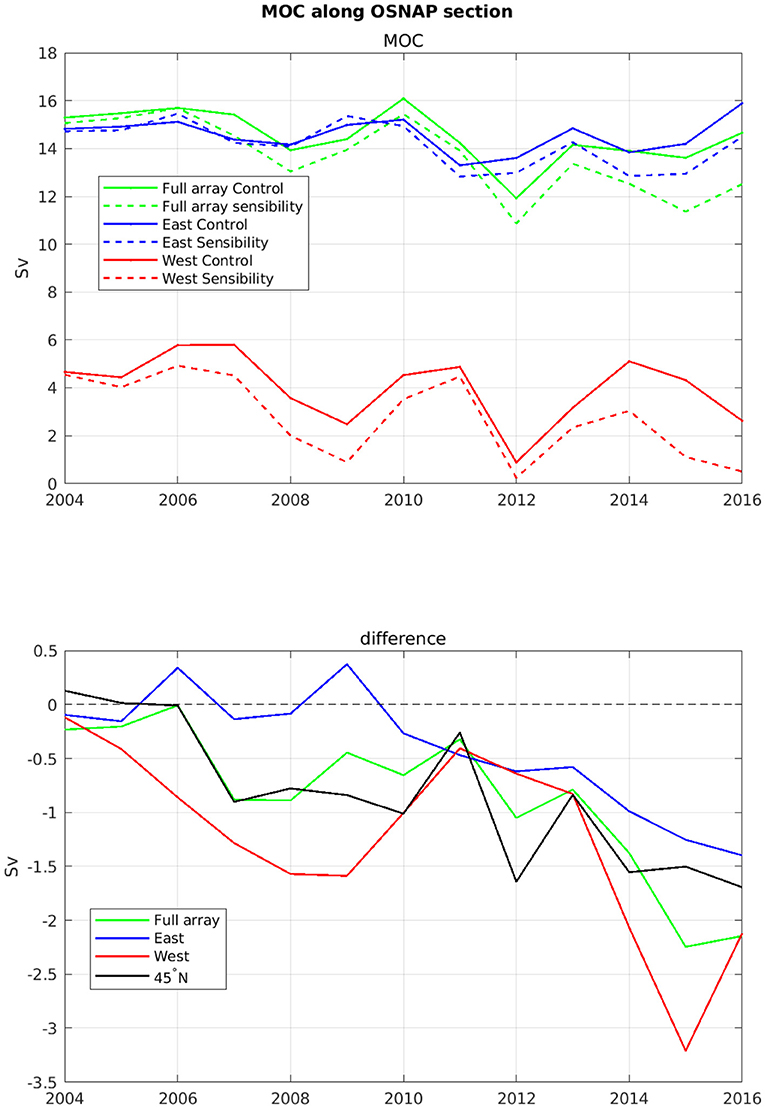
Figure 9. Time evolution of AMOC indices (in Sv) computed in density space in the HR simulations (maximum of the annual mean stream function). Top is showing the annual mean values in the different experiments (continuous line for control, dashed line for melting simulations) in red for OSNAP west, in blue for OSNAP east and in green for the full OSNAP array. The bottom panel is showing the differences between the two (melting minus control) simulations with the same color code, also with in black, the MOC index in density space computed at 45°N.
Discussions and Conclusions
In this paper, we have assessed the recent literature since the IPCC-SROCC report (Collins et al., 2019) regarding changes in the AMOC over the last few decades and the future ones. Furthermore, we have presented results from a few new simulations that focus on a key element of AMOC changes, still poorly evaluated, namely the impact of Greenland Ice Sheet (GrIS) melting, by using new estimates from Bamber et al. (2018) that have been hardly introduced in model simulations up to now.
While the uncertainty in past and future AMOC changes remains very large, as discussed in the new IPCC AR6 report in 2021 (IPCC, 2021), we highlight here that sub-grid scale processes might considerably affect attribution of possible on-going AMOC weakening in the IPCC models. Indeed, HR models (<1/10°), which are not available in CMIP6-type models, do show considerable differences with the latter. First, the mean state is strongly improved with resolution, and the AMOC is usually far more vigorous in eddy rich models (Hirschi et al., 2020), which makes it more difficult to evaluate the amplitude of potential AMOC weakening and associated heat transport in the future. Secondly, the GrIS melting is still poorly accounted for in CMIP6 models. Our new results from HR simulations suggest that this melting might already have had a strong impact in the recent past on the Labrador Sea convection (as also found in Böning et al., 2016) and the AMOC, contrary to what is simulated in one CMIP6-type model. This further questions our ability to estimate future AMOC changes and therefore leads to considerable uncertainty worldwide in the future climate projections (Bellomo et al., 2021).
A number of limitations remain concerning the new results presented here and will need to be solved in future studies. The principal issue is the difficulty to compare LR and HR simulations. Here this difficulty is amplified by the fact that freshwater input differs between the two models. The anomaly of freshwater release from Greenland is about 35 mSv in the HR runs and 20 mSv in the LR over the overlapping period (2005–2014), but the HR has additional coastal runoff in the Arctic that clearly blurs the attribution possibilities. Still, we argue here based on Supplementary Video 1 that those additional fluxes elsewhere than in Greenland vicinity play a limited role in the results presented. A simulation accounting only for Greenland ice sheet perturbation from Bamber et al. (2018) would be also welcome to entirely prove that Arctic runoff plays a limited role in the results shown.
Furthermore, the fact that the response in the interior Labrador Sea seems stronger in the HR simulations than in the LR can also be limited by the fact that we compare a single OGCM realization with an ensemble mean of AOGM simulations, which might better identify the signal out of any potential noise effect. This could be justified by the fact that OGCM might exhibit lower intrinsic variability, since the atmospheric forcing is fixed. Nevertheless, the oceanic intrinsic variability is far from being negligible at HR resolution (Leroux et al., 2018) so that an ensemble might also be needed to properly assess the impact of additional freshwater input. We argue that the amplitude of the anomalies found for the MLD in the Labrador Sea is large enough to be beyond this uncertainty. Nevertheless, this remains to be fully assessed and proven.
Another candidate (on top of differences in the experimental design between LR and HR simulations) to explain the enhanced response in the Labrador Sea in HR is most probably related to the greater ability of the HR model to spread freshwater from the coast of Greenland, where the melting is injected, toward the interior basin, where most of the convection occurs. This is done through instability of the mean flow, here the West Greenland boundary current, and subsequent formation of eddies transporting shelf water into the ocean interior. The eddy kinetic energy, a measure of the eddy activity, is indeed very high off the southwestern coast of Greenland (Figure 10). Such a process has also been recently nicely illustrated in observational data, by following GrIS meltwater with gliders using fluorescing dissolved organic matter, a proxy of those meltwaters (Hendry et al., 2021). The nature of eddies in the Labrador Sea is however complex as illustrated in Rieck et al. (2019), with different types of eddies, generated either by baroclinic or barotropic instabilities and strongly dependent on bathymetry characteristics.
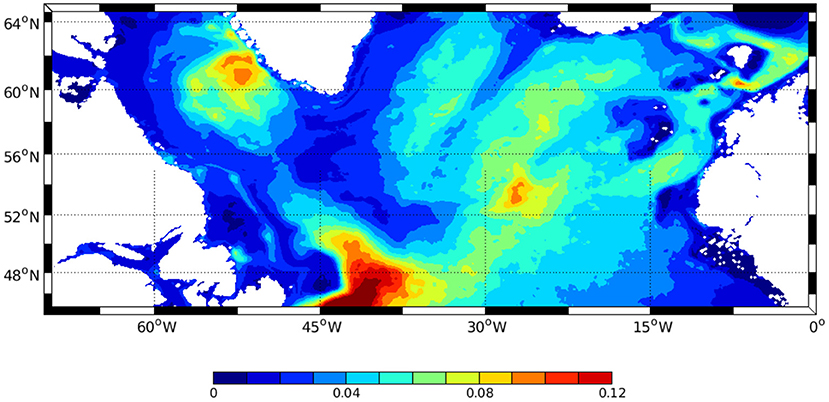
Figure 10. Eddy Kinetic Energy (EKE, in m2/s2) in the HR control simulation averaged over the period 2004–2016.
Furthermore, eddies might not be the only processes that are playing a role in high-resolution models. Indeed, Schulze Chretien and Frajka-Williams (2018) recently suggested that the freshwater transport from the shelves into the central Labrador Sea in the first top 30 meters might be largely due to wind-driven Ekman transport in the West Greenland Current, a process that is strongly dependent on the representation of the regional-scale energetic winds in the atmosphere (e.g., Spall et al., 2021), and is therefore poorly represented in LR models. Also, the finer scales resolved in the HR model allow to better represent the boundary currents, which are channeling most of the freshwater transport over the shelf around Greenland. In the LR model these currents are wider so that the freshwater release from the GrIS is far more diluted in the offshore direction. As a consequence, the fine scales resolved in the HR simulation increase the coastal freshwater input from eastern Greenland to the Labrador Sea shelves, which might also contribute to enhancing the freshwater transport toward the Labrador Sea center.
An important aspect of the HR simulations presented here is the fact that no SSS restoring at all is considered. Indeed, such a restoring in an ocean-only model might partially offset the impact of the meltwater in the sensitivity experiments. Thus, even though the absence of restoring strongly impacts the mean state (Biastoch et al., 2021) and might explain the loss of vigorous convective activity in the Nordic Seas in the HR control simulation, it is something necessary to correctly assess in an ocean-only model the impact of additional surface freshwater sources. In this respect, this constitutes an improvement as compared to the work of Böning et al. (2016), in addition to the update of GrIS meltwater reconstruction used in our study. Nevertheless, it is also clear that inclusion of Arctic freshwater sources in addition to the one of Bamber strongly limits the interpretation of our results in terms of attribution of GrIS freshwater impact.
The use of a regional ocean model in the North Atlantic also means that all ocean fields are prescribed at the boundaries from the parent global simulation, thus constraining the AMOC variability to that of the parent simulation. Since the prescribed fields are kept unchanged between the control and sensitivity simulations, the AMOC at the southern boundary at 28°N is the same in both runs in HR. This therefore limits the degrees of freedom of the AMOC in this model and its sensitivity close to this boundary. The differences we have computed are located further to the north, but the impact of the GrIS might be partly damped by the southern boundary conditions, meaning that the impact of GrIS melting on the AMOC could even be larger if those boundaries conditions were relaxed.
One aspect that might minor the implications of our results is the effective role of the Labrador Sea on the AMOC, a highly debated topic in the literature. Recent work from Lozier et al. (2019) based on the new OSNAP array clearly questioned its influence on AMOC variability and mean state. The key limit of those observations is their short time frame, which might strongly limit the robustness of the findings, as highlighted in Yeager et al. (2021) using 0.1° resolution coupled model simulations of 500 years duration. Nevertheless, it remains true that the Labrador Sea is contributing to a limited extent to the mean AMOC. It was estimated to be around 1/3 of AMOC strength in the synthesis of Quadfasel and Käse (2007), a number disputed by the paper of Lozier et al. (2019) that found only a few Sverdrups of overturning due to the Labrador Sea, i.e., only slightly more than 10% of the whole AMOC strength.
Another implication of our results concerns the risk of an SPG collapse, as discussed in recent literature (e.g., Born et al., 2013; Sgubin et al., 2017) and confirmed in some CMIP6 projections (Swingedouw et al., 2021). Those models do show a rapid cooling of the SPG of up to 2–3°C in less than a decade, associated with the cessation of convective activity in the whole gyre. The exact dynamics behind this non-linear behavior in some models and not in others remain unclear, but could be related to the misrepresentation of the advective salinity positive feedback, which is crucial for the SPG instability (Born et al., 2016). It has been argued that coarse resolution models might misrepresent processes related to this feedback (Born and Stocker, 2014), notably related to eddies. The results presented here clearly support this view, but the short time frame of the simulations and the fact that it is an ocean-only simulation prevent the possibility to estimate longer-term impacts on the SPG, and the possibility of a decadal-scale abrupt change, which might have crucial implications over Europe (Sgubin et al., 2019). To gain knowledge on this issue, HR climate models correctly initialized to present-day oceanic states might be necessary. However, we are still far from such tools, given the large computing cost of HR climate models as well as the issues related to initial shock in the decadal prediction system (Bilbao et al., 2021). In this respect new avenues should be explored, not only waiting for eddy rich climate models, which might necessitate a considerable amount of computing time, and will not be able to solve uncertainty related to low frequency internal dynamics (e.g., Bonnet et al., 2021) due to the low number of members that could be produced given the computing constraints.
While, at the moment, no parameterization in CMIP climate models represents the transfer of kinetic energy from small scale to large scale, the so-called energy backscatter, some work is being developed in ocean models to solve these limitations (Hewitt et al., 2020). Two main approaches are explored. The first one is introducing stochastic eddy parameterization (Grooms and Majda, 2013; Porta Mana and Zanna, 2014) in the models to account for the impact of those eddies. The other one is building on Gent and McWilliams (1990) parameterization and injects the potential energy extracted from GM directly into the momentum equation. Sub-mesoscale processes (below a few kilometers) can also be very important notably for air-sea fluxes (e.g., mesoscale and sub mesoscale winds, oceanic fronts). The parameterization of the closure of turbulent kinetic energy can also be explored using machine learning techniques, as recently done in Bolton and Zanna (2019) and Zanna and Bolton (2020). These promising approaches might help fill the gap of energy cascades in coarse resolution models and better represent some processes that appear to be essential given the results of our study.
To conclude, we can say that we are still far from a robust estimate of the fate of future AMOC weakening. There is already a very large uncertainty in coarse ocean models like CMIP6 ones (Bellomo et al., 2021). The present study further highlights the considerable role of missing processes in CMIP6 models for the response of the AMOC. The AMOC is a very complex feature that is still not well-understood both in its time scales, large-scale energetics and drivers and consequently its response to global warming is largely unknown. The results from HR model presented here seem to further amplify the potential uncertainty, which is already large in lower resolution models, by adding new sources from poorly represented processes.
Beyond the uncertainty on greenhouse gas emission scenarios, we would like here to emphasize that the causes of AMOC uncertainty are numerous. The first one is related to uncertainty in the atmospheric changes in climate projections, which are very model dependent. A second source of uncertainty is related to large-scale internal AMOC feedbacks (Swingedouw et al., 2007b), which are also not well-quantified nor constrained. The ocean-atmosphere coupling should not be forgotten in terms of uncertainty and processes, and further complexifies the picture (Bellucci et al., 2021). Last but not least, processes driving GrIS meltwater spread, deep convection or overflow processes are not correctly resolved at coarse resolution, and even at higher resolution, they remain difficult to be correctly represented (Colombo et al., 2020). We argue here that work on parameterization of those processes, based on their understanding in HR models, observations, as well as the use of new objective approaches from machine learning, is also highly necessary and will help the reduction of missing processes uncertainty.
On a shorter time frame of development, we argue here that emergent constraint approach (Hegerl et al., 2021) as used in, e.g., Weijer et al. (2020) should be further explored concerning the AMOC fate, by considering multiple driving factors of the AMOC spread that are effectively observed, in order to reduce the range of uncertainty from CMIP6 models. Finally, we support the development of several models worldwide and not only a limited number of a HR digital twin of the Earth as recently suggested (Bauer et al., 2021). Indeed, given the large number of uncertainty sources, the increase of resolution might not be enough to cover all of them, and might lead to serious underestimation of uncertainty in the case of a reduction of the number of models developed worldwide. The improvements of parametrization using HR models seem more promising and effective in that respect. A clear move toward this difficult task is therefore required.
Data Availability Statement
The raw data supporting the conclusions of this article will be made available by the authors, without undue reservation.
Author Contributions
DS wrote most of the first draft, while all authors improved it. DS produced Figures 1, 3, 5–7. MD provided the GrIS melting forcing on the HR grid. CH, M-NH, and A-CB designed, performed, and analyzed the HR simulations. MD and DS performed the LR simulations. JD performed the OSNAP analysis from LR simulations. All authors contributed to the design and content of the article. All authors contributed to the article and approved the submitted version.
Funding
This work received support from the Blue-Action (European Union's Horizon 2020 research and innovation program, Grant No. 727852), EUCP (European Union's Horizon 2020 research and innovation programme under Grant Agreement No. 776613) projects, and also benefited from funding from LEFE-IMAGO DECORATING project.
Conflict of Interest
The authors declare that the research was conducted in the absence of any commercial or financial relationships that could be construed as a potential conflict of interest.
Publisher's Note
All claims expressed in this article are solely those of the authors and do not necessarily represent those of their affiliated organizations, or those of the publisher, the editors and the reviewers. Any product that may be evaluated in this article, or claim that may be made by its manufacturer, is not guaranteed or endorsed by the publisher.
Acknowledgments
The authors thank Jean-Marc Molines for providing the global-scale resolution model that serve as boundary conditions of the HR simulations. They also thank two reviewers for useful and constructive comments and suggestions.
Supplementary Material
The Supplementary Material for this article can be found online at: https://www.frontiersin.org/articles/10.3389/fclim.2022.838310/full#supplementary-material
References
Bamber, J., van den Broeke, M., Ettema, J., Lenaerts, J., and Rignot, E. (2012). Recent large increases in freshwater fluxes from Greenland into the North Atlantic: freshwater into the North Atlantic. Geophys. Res. Lett. 39, L19501. doi: 10.1029/2012GL052552
Bamber, J. L., Tedstone, A. J., King, M. D., Howat, I. M., Enderlin, E. M., van den Broeke, M. R., et al. (2018). Land ice freshwater budget of the Arctic and North Atlantic oceans: 1. Data, methods, and results. J. Geophys. Res. Oceans 123, 1827–1837. doi: 10.1002/2017JC013605
Bauer, P., Stevens, B., and Hazeleger, W. (2021). A digital twin of Earth for the green transition. Nat. Clim. Change 11, 80–83. doi: 10.1038/s41558-021-00986-y
Bellomo, K., Angeloni, M., Corti, S., and von Hardenberg, J. (2021). Future climate change shaped by inter-model differences in Atlantic meridional overturning circulation response. Nat. Commun. 12, 3659. doi: 10.1038/s41467-021-24015-w
Bellucci, A., Athanasiadis, P. J., Scoccimarro, E., Ruggieri, P., Gualdi, S., Fedele, G., et al. (2021). Air-Sea interaction over the Gulf Stream in an ensemble of HighResMIP present climate simulations. Clim. Dyn. 56, 2093–2111. doi: 10.1007/s00382-020-05573-z
Biastoch, A., Schwarzkopf, F. U., Getzlaff, K., Rühs, S., Martin, T., Scheinert, M., et al. (2021). Regional imprints of changes in the Atlantic Meridional Overturning Circulation in the eddy-rich ocean model VIKING20X. Ocean Sci. 17, 1177–1211. doi: 10.5194/os-17-1177-2021
Bilbao, R., Wild, S., Ortega, P., Acosta-Navarro, J., Arsouze, T., Bretonnière, P.-A., et al. (2021). Assessment of a full-field initialized decadal climate prediction system with the CMIP6 version of EC-Earth. Earth Syst. Dyn. 12, 173–196. doi: 10.5194/esd-12-173-2021
Boers, N. (2021). Observation-based early-warning signals for a collapse of the Atlantic meridional overturning circulation. Nat. Clim. Change 11, 680–688. doi: 10.1038/s41558-021-01097-4
Bolton, T., and Zanna, L. (2019). Applications of deep learning to ocean data inference and subgrid parameterization. J. Adv. Model. Earth Syst. 11, 376–399. doi: 10.1029/2018MS001472
Böning, C. W., Behrens, E., Biastoch, A., Getzlaff, K., and Bamber, J. L. (2016). Emerging impact of Greenland meltwater on deepwater formation in the North Atlantic Ocean. Nat. Geosci. 9, 523. doi: 10.1038/ngeo2740
Bonnet, R., Swingedouw, D., Gastineau, G., Boucher, O., Deshayes, J., Hourdin, F., et al. (2021). Increased risk of near term global warming due to a recent AMOC weakening. Nat. Commun. 12, 6108. doi: 10.1038/s41467-021-26370-0
Born, A., and Stocker, T. F. (2014). Two stable equilibria of the Atlantic subpolar gyre. J. Phys. Oceanogr. 44, 246–264. doi: 10.1175/JPO-D-13-073.1
Born, A., Stocker, T. F., Raible, C. C., and Levermann, A. (2013). Is the Atlantic subpolar gyre bistable in comprehensive coupled climate models? Clim. Dyn. 40, 2993–3007. doi: 10.1007/s00382-012-1525-7
Born, A., Stocker, T. F., and Sando, A. B. (2016). Transport of salt and freshwater in the Atlantic Subpolar Gyre. Ocean Dyn. 66, 1051–1064. doi: 10.1007/s10236-016-0970-y
Boucher, O., Servonnat, J., Albright, A. L., Aumont, O., Balkanski, Y., Bastrikov, V., et al. (2020). Presentation and evaluation of the IPSL-CM6A-LR climate model. J. Adv. Model. Earth Syst. 12, e2019MS002010. doi: 10.1029/2019MS002010
Boulton, C. A., Allison, L. C., and Lenton, T. M. (2014). Early warning signals of Atlantic meridional overturning circulation collapse in a fully coupled climate model. Nat. Commun. 5, 5752. doi: 10.1038/ncomms6752
Caesar, L., McCarthy, G. D., Thornalley, D. J. R., Cahill, N., and Rahmstorf, S. (2021). Current atlantic meridional overturning circulation weakest in last millennium. Nat. Geosci. 14, 118–120. doi: 10.1038/s41561-021-00699-z
Caesar, L., Rahmstorf, S., Robinson, A., Feulner, G., and Saba, V. (2018). Observed fingerprint of a weakening Atlantic Ocean overturning circulation. Nature 556, 191–196. doi: 10.1038/s41586-018-0006-5
Chafik, L., Hátún, H., Kjellsson, J., Larsen, K. M. H., Rossby, T., and Berx, B. (2020). Discovery of an unrecognized pathway carrying overflow waters toward the Faroe Bank Channel. Nat. Commun. 11, 3721. doi: 10.1038/s41467-020-17426-8
Collins, M., Sutherland, M., Bouwer, L., Cheong, S.-M., Frolicher, T., Jacot Des Combes, H., et al. (2019). IPCC Special Report on The Ocean and Cryosphere in a Changing Climate. Chapter 6: Extremes, Abrupt Changes and Managing Risks. Cambridge, NY: Cambridge University Press.
Colombo, P., Barnier, B., Penduff, T., Chanut, J., Deshayes, J., Molines, J.-M., et al. (2020). Representation of the Denmark Strait overflow in a z-coordinate eddying configuration of the NEMO (v3.6) ocean model: resolution and parameter impacts. Geosci. Model Dev. 13, 3347–3371. doi: 10.5194/gmd-13-3347-2020
Dai, A., and Trenberth, K. E. (2002). Estimates of freshwater discharge from continents: Latitudinal and seasonal variations. J. Hydrometeorol. 3, 660–87.
de Lavergne, C., Madec, G., Roquet, F., Holmes, R. M., and McDougall, T. J. (2017). Abyssal ocean overturning shaped by seafloor distribution. Nature 551, 181–186. doi: 10.1038/nature24472
Dee, D. P., Uppala, S. M., Simmons, A. J., Berrisford, P., Poli, P., Kobayashi, S., et al. (2011). The ERA-Interim reanalysis: configuration and performance of the data assimilation system. Q. J. R. Meteorol. Soc. 137, 553–597. doi: 10.1002/qj.828
Desbruyères, D. G., Mercier, H., Maze, G., and Daniault, N. (2019). Surface predictor of overturning circulation and heat content change in the subpolar North Atlantic. Ocean Sci. 15, 809–817. doi: 10.5194/os-15-809-2019
Deser, C., Lehner, F., Rodgers, K. B., Ault, T., Delworth, T. L., DiNezio, P. N., et al. (2020). Insights from Earth system model initial-condition large ensembles and future prospects. Nat. Clim. Change 10, 277–286. doi: 10.1038/s41558-020-0731-2
Devilliers, M., Swingedouw, D., Mignot, J., Deshayes, J., Garric, G., and Ayache, M. (2021). A realistic Greenland ice sheet and surrounding glaciers and ice caps melting in a coupled climate model. Clim. Dyn. 57, 2467–2489. doi: 10.1007/s00382-021-05816-7
Diabaté, S. T., Swingedouw, D., Hirschi, J. J.-M., Duchez, A., Leadbitter, P. J., Haigh, I. D., et al. (2021). Western boundary circulation and coastal sea-level variability in northern hemisphere oceans (preprint). Ocean Sci. 17, 1449–1471. doi: 10.5194/os-2021-24
Friedman, A. R., Reverdin, G., Khodri, M., and Gastineau, G. (2017). A new record of Atlantic sea surface salinity from 1896 to 2013 reveals the signatures of climate variability and long-term trends: new Atlantic Sea Surface Salinity Record. Geophys. Res. Lett. 44, 1866–1876. doi: 10.1002/2017GL072582
Gent, P. R., and McWilliams, J. C. (1990). Isopycnal mixing in ocean general circulation models. J. Phys. Oceanogr. 20, 150–155. doi: 10.1175/1520-0485(1990)020<0150:IMIOCM>2.0.CO;2
Grooms, I., and Majda, A. J. (2013). Efficient stochastic superparameterization for geophysical turbulence. Proc. Natl. Acad. Sci. U.S.A. 110, 4464–4469. doi: 10.1073/pnas.1302548110
Gu, S., Liu, Z., and Wu, L. (2020). Time scale dependence of the meridional coherence of the atlantic meridional overturning circulation. J. Geophys. Res. Oceans 125, e2019JC015838. doi: 10.1029/2019JC015838
Hegerl, G. C., Ballinger, A. P., Booth, B. B. B., Borchert, L. F., Brunner, L., Donat, M. G., et al. (2021). Toward consistent observational constraints in climate predictions and projections. Front. Clim. 3, 678109. doi: 10.3389/fclim.2021.678109
Hendry, K. R., Briggs, N., Henson, S., Opher, J., Brearley, J. A., Meredith, M. P., et al. (2021). Tracing glacial meltwater from the Greenland ice sheet to the ocean using gliders. J. Geophys. Res. Oceans 126, e2021JC017274. doi: 10.1029/2021JC017274
Hewitt, H. T., Roberts, M., Mathiot, P., Biastoch, A., Blockley, E., Chassignet, E. P., et al. (2020). Resolving and parameterising the ocean mesoscale in earth system models. Curr. Clim. Change Rep. 6, 137–152. doi: 10.1007/s40641-020-00164-w
Hirschi, J. J. -M., Barnier, B., Böning, C., Biastoch, A., Blaker, A. T., Coward, A., et al. (2020). The Atlantic meridional overturning circulation in high-resolution models. J. Geophys. Res. Oceans 125, e2019JC015522. doi: 10.1029/2019JC015522
Holliday, N. P., Bersch, M., Berx, B., Chafik, L., Cunningham, S., Florindo-López, C., et al. (2020). Ocean circulation causes the largest freshening event for 120 years in eastern subpolar North Atlantic. Nat. Commun. 11, 585. doi: 10.1038/s41467-020-14474-y
Hu, S., and Fedorov, A. V. (2020). Indian Ocean warming as a driver of the North Atlantic warming hole. Nat. Commun. 11, 4785. doi: 10.1038/s41467-020-18522-5
IPCC (2021). “Summary for policymakers,” in Climate Change 2021: The Physical Science Basis. Contribution of Working Group I to the Sixth Assessment Report of the Intergovernmental Panel on Climate Change (Cambridge University Press).
Jackson, L. C., Roberts, M. J., Hewitt, H. T., Iovino, D., Koenigk, T., Meccia, V. L., et al. (2020). Impact of ocean resolution and mean state on the rate of AMOC weakening. Clim. Dyn. 55, 1711–1732. doi: 10.1007/s00382-020-05345-9
Jiang, W., Gastineau, G., and Codron, F. (2021). Multicentennial variability driven by salinity exchanges between the Atlantic and the Arctic ocean in a coupled climate model. J. Adv. Model. Earth Syst. 13, e2020MS002366. doi: 10.1029/2020MS002366
Keil, P., Mauritsen, T., Jungclaus, J., Hedemann, C., Olonscheck, D., and Ghosh, R. (2020). Multiple drivers of the North Atlantic warming hole. Nat. Clim. Change 10, 667–671. doi: 10.1038/s41558-020-0819-8
Kieke, D., and Yashayaev, I. (2015). Studies of Labrador Sea Water formation and variability in the subpolar North Atlantic in the light of international partnership and collaboration. Prog. Oceanogr. 132, 220–232. doi: 10.1016/j.pocean.2014.12.010
Koenigk, T., Fuentes-Franco, R., Meccia, V. L., Gutjahr, O., Jackson, L. C., New, A. L., et al. (2021). Deep mixed ocean volume in the Labrador Sea in HighResMIP models. Clim. Dyn. 57, 1895–1918. doi: 10.1007/s00382-021-05785-x
Large, W. G., and Yeager, S. G. (2004). Diurnal to decadal global forcing for ocean and sea-ice models: The data sets and flux. Climatologies. doi: 10.5065/D6KK98Q6
Le Corre, M., Gula, J., and Tréguier, A.-M. (2020). Barotropic vorticity balance of the North Atlantic subpolar gyre in an eddy-resolving model. Ocean Sci. 16, 451–468. doi: 10.5194/os-16-451-2020
Leroux, S., Penduff, T., Bessières, L., Molines, J.-M., Brankart, J.-M., Sérazin, G., et al. (2018). Intrinsic and atmospherically forced variability of the AMOC: insights from a large-ensemble ocean hindcast. J. Clim. 31, 1183–1203. doi: 10.1175/JCLI-D-17-0168.1
Li, F., Lozier, M. S., Bacon, S., Bower, A. S., Cunningham, S. A., de Jong, M. F., et al. (2021a). Subpolar North Atlantic western boundary density anomalies and the Meridional Overturning Circulation. Nat. Commun. 12, 3002. doi: 10.1038/s41467-021-23350-2
Li, F., Lozier, M. S., Danabasoglu, G., Holliday, N. P., Kwon, Y.-O., Romanou, A., et al. (2019). Local and downstream relationships between labrador sea water volume and North Atlantic meridional overturning circulation variability. J. Clim. 32, 3883–3898. doi: 10.1175/JCLI-D-18-0735.1
Li, F., Lozier, M. S., Holliday, N. P., Johns, W. E., Le Bras, I. A., Moat, B. I., et al. (2021b). Observation-based estimates of heat and freshwater exchanges from the subtropical North Atlantic to the Arctic. Prog. Oceanogr. 197, 102640. doi: 10.1016/j.pocean.2021.102640
Lique, C., and Thomas, M. D. (2018). Latitudinal shift of the Atlantic meridional overturning circulation source regions under a warming climate. Nat. Clim. Change 8, 1013–1020. doi: 10.1038/s41558-018-0316-5
Lobelle, D., Beaulieu, C., Livina, V., Sévellec, F., and Frajka-Williams, E. (2020). Detectability of an AMOC decline in current and projected climate changes. Geophys. Res. Lett. 47, e2020GL089974. doi: 10.1029/2020GL089974
Lozier, M. S. (2010). Deconstructing the conveyor belt. Science 328, 1507–1511. doi: 10.1126/science.1189250
Lozier, M. S., Bacon, S., Bower, A. S., Cunningham, S. A., de Jong, M. F., de Steur, L., et al. (2017). Overturning in the subpolar north atlantic program a new international ocean observing system. Bull. Am. Meteorol. Soc. 98, 737–52. Available online at: https://par.nsf.gov/servlets/purl/10087405
Lozier, M. S., Li, F., Bacon, S., Bahr, F., Bower, A. S., Cunningham, S. A., et al. (2019). A sea change in our view of overturning in the subpolar North Atlantic. Science 363, 516–521. doi: 10.1126/science.aau6592
Madec, G. (2015). NEMO ocean engine -version 3.6 stable-, Note du Pôle de modélisation de l'Institut Pierre-Simon Laplace No 27. Paris.
Majumder, S., Castelao, R. M., and Amos, C. M. (2021). Freshwater variability and transport in the labrador sea from in situ and satellite observations. J. Geophys. Res. Oceans 126, e2020JC016751. doi: 10.1029/2020JC016751
Mecking, J. V., Drijfhout, S. S., Hirschi, J. J.-M., and Blaker, A. T. (2019). Ocean and atmosphere influence on the 2015 European heatwave. Environ. Res. Lett. 14, 114035. doi: 10.1088/1748-9326/ab4d33
Menary, M. B., Jackson, L. C., and Lozier, M. S. (2020a). Reconciling the relationship between the AMOC and Labrador sea in OSNAP observations and climate models. Geophys. Res. Lett. 47, e2020GL089793. doi: 10.1029/2020GL089793
Menary, M. B., Robson, J., Allan, R. P., Booth, B. B. B., Cassou, C., Gastineau, G., et al. (2020b). Aerosol-forced AMOC Changes in CMIP6 historical simulations. Geophys. Res. Lett. 47, e2020GL088166. doi: 10.1029/2020GL088166
Moat, B. I., Smeed, D. A., Frajka-Williams, E., Desbruyères, D. G., Beaulieu, C., Johns, W. E., et al. (2020). Pending recovery in the strength of the meridional overturning circulation at 26? N. Ocean Sci 12, 863–874. doi: 10.5194/os-16-863-2020
Moffa-Sánchez, P., Moreno-Chamarro, E., Reynolds, D. J., Ortega, P., Cunningham, L., Swingedouw, D., et al. (2019). Variability in the Northern North Atlantic and Arctic oceans across the last two millennia: a review. Paleoceanogr. Paleoclimatol. 34, 1399–1436. doi: 10.1029/2018PA003508
Monerie, P.-A., Robson, J., Dong, B., and Hodson, D. (2021). Role of the Atlantic multidecadal variability in modulating East Asian climate. Clim. Dyn. 56, 381–398. doi: 10.1007/s00382-020-05477-y
Ortega, P., Mignot, J., Swingedouw, D., Sevellec, F., and Guilyardi, E. (2015). Reconciling two alternative mechanisms behind bi-decadal variability in the North Atlantic. Prog. Oceanogr. 137, 237–249. doi: 10.1016/j.pocean.2015.06.009
Østerhus, S., Woodgate, R., Valdimarsson, H., Turrell, B., de Steur, L., Quadfasel, D., et al. (2019). Arctic Mediterranean exchanges: a consistent volume budget and trends in transports from two decades of observations. Ocean Sci. 15, 379–399. doi: 10.5194/os-15-379-2019
Piecuch, C. G. (2020). Likely weakening of the Florida current during the past century revealed by sea-level observations. Nat. Commun. 11, 3973. doi: 10.1038/s41467-020-17761-w
Porta Mana, P., and Zanna, L. (2014). Toward a stochastic parameterization of ocean mesoscale eddies. Ocean Model. 79, 1–20. doi: 10.1016/j.ocemod.2014.04.002
Quadfasel, D., and Käse, R. (2007). “Present-day manifestation of the Nordic Seas Overflows,” in Geophysical Monograph Series, eds A. Schmittner, J. C. H. Chiang, and S. R. Hemming (Washington, DC: American Geophysical Union), 75–89.
Rahmstorf, S., Box, J. E., Feulner, G., Mann, M. E., Robinson, A., Rutherford, S., et al. (2015). Exceptional twentieth-century slowdown in Atlantic Ocean overturning circulation. Nat. Clim. Change 5, 475–480. doi: 10.1038/nclimate2554
Rieck, J. K., Böning, C. W., and Getzlaff, K. (2019). The nature of eddy kinetic energy in the Labrador sea: different types of mesoscale eddies, their temporal variability, and impact on deep convection. J. Phys. Oceanogr. 49, 2075–2094. doi: 10.1175/JPO-D-18-0243.1
Roberts, M. J., Jackson, L. C., Roberts, C. D., Meccia, V., Docquier, D., Koenigk, T., et al. (2020). Sensitivity of the Atlantic meridional overturning circulation to model resolution in CMIP6 HighResMIP simulations and implications for future changes. J. Adv. Model. Earth Syst. 12, e2019MS002014. doi: 10.1029/2019MS002014
Robson, J., Ortega, P., and Sutton, R. (2016). A reversal of climatic trends in the North Atlantic since 9 9, 513–517. doi: 10.1038/ngeo2727
Rossby, T., Chafik, L., and Houpert, L. (2020). What can hydrography tell us about the strength of the nordic seas MOC over the last 70 to 100 years? Geophys. Res. Lett. 47, e2020GL087456. doi: 10.1029/2020GL087456
Rühs, S., Oliver, E. C. J., Biastoch, A., Böning, C. W., Dowd, M., Getzlaff, K., et al. (2021). Changing spatial patterns of deep convection in the subpolar North Atlantic. J. Geophys. Res. Oceans 126, e2021JC017245. doi: 10.1029/2021JC017245
Ruprich-Robert, Y., Moreno-Chamarro, E., Levine, X., Bellucci, A., Cassou, C., Castruccio, F., et al. (2021). Impacts of Atlantic multidecadal variability on the tropical Pacific: a multi-model study. NPJ Clim. Atmospheric Sci. 4, 33. doi: 10.1038/s41612-021-00188-5
Schulze Chretien, L. M., and Frajka-Williams, E. (2018). Wind-driven transport of fresh shelf water into the upper 30 m of the Labrador Sea. Ocean Sci. 14, 1247–1264. doi: 10.5194/os-14-1247-2018
Sgubin, G., Swingedouw, D., Drijfhout, S., Hagemann, S., and Robertson, E. (2015). Multimodel analysis on the response of the AMOC under an increase of radiative forcing and its symmetrical reversal. Clim. Dyn. 45, 1429–1450. doi: 10.1007/s00382-014-2391-2
Sgubin, G., Swingedouw, D., Drijfhout, S., Mary, Y., and Bennabi, A. (2017). Abrupt cooling over the North Atlantic in modern climate models. Nat. Commun. 8, 14375. doi: 10.1038/ncomms14375
Sgubin, G., Swingedouw, D., García de Cortázar-Atauri, I., Ollat, N., and van Leeuwen, C. (2019). The impact of possible decadal-scale cold waves on viticulture over Europe in a context of global warming. Agronomy 9, 397. doi: 10.3390/agronomy9070397
Spall, M. A., Almansi, M., Huang, J., Haine, T. W. N., and Pickart, R. S. (2021). Lateral redistribution of heat and salt in the Nordic seas. Prog. Oceanogr. 196, 102609. doi: 10.1016/j.pocean.2021.102609
Stammer, D., Martins, M. S., Köhler, J., and Köhl, A. (2021). How well do we know ocean salinity and its changes? Prog. Oceanogr. 190, 102478. doi: 10.1016/j.pocean.2020.102478
Swingedouw, D., Bily, A., Esquerdo, C., Borchert, L. F., Sgubin, G., Mignot, J., et al. (2021). On the risk of abrupt changes in the North Atlantic subpolar gyre in CMIP6 models. Ann. N. Y. Acad. Sci. 1504, 187–201. doi: 10.1111/nyas.14659
Swingedouw, D., Braconnot, P., Delecluse, P., Guilyardi, E., and Marti, O. (2007a). The impact of global freshwater forcing on the thermohaline circulation: adjustment of North Atlantic convection sites in a CGCM. Clim. Dyn. 28, 291–305. doi: 10.1007/s00382-006-0171-3
Swingedouw, D., Braconnot, P., Delecluse, P., Guilyardi, E., and Marti, O. (2007b). Quantifying the AMOC feedbacks during a 2×CO2 stabilization experiment with land-ice melting. Clim. Dyn. 29, 521–534. doi: 10.1007/s00382-007-0250-0
Swingedouw, D., Rodehacke, C. B., Behrens, E., Menary, M., Olsen, S. M., Gao, Y. Q., et al. (2013). Decadal fingerprints of freshwater discharge around Greenland in a multi-model ensemble. Clim. Dyn. 41, 695–720. doi: 10.1007/s00382-012-1479-9
Thibodeau, B., Not, C., Hu, J., Schmittner, A., Noone, D., Tabor, C., et al. (2018). Last century warming over the Canadian Atlantic shelves linked to weak atlantic meridional overturning circulation. Geophys. Res. Lett. 45, 12376–12385. doi: 10.1029/2018GL080083
Thornalley, D. J. R., Oppo, D. W., Ortega, P., Robson, J. I., Brierley, C. M., Davis, R., et al. (2018). Anomalously weak Labrador sea convection and Atlantic overturning during the past 150 years. Nature 556, 227–230. doi: 10.1038/s41586-018-0007-4
Velasco, J. A., Estrada, F., Calderón-Bustamante, O., Swingedouw, D., Ureta, C., Gay, C., et al. (2021). Synergistic impacts of global warming and thermohaline circulation collapse on amphibians. Commun. Biol. 4, 141. doi: 10.1038/s42003-021-01665-6
von Storch, H., and Olbers, D. (2007). Interview mit Klaus Hasselmann am 15. GKSS-Forschungszentrum Geesthacht GmbH; Geesthacht No. GKSS 2007/5. Bonn.
Weijer, W., Cheng, W., Garuba, O. A., Hu, A., and Nadiga, B. T. (2020). CMIP6 models predict significant 21st century decline of the atlantic meridional overturning circulation. Geophys. Res. Lett. 14, e2019GL086075. doi: 10.1029/2019GL086075
Worthington, E. L., Moat, B. I., Smeed, D. A., Mecking, J. V., Marsh, R., and McCarthy, G. D. (2021). A 30-year reconstruction of the Atlantic meridional overturning circulation shows no decline. Ocean Sci. 17, 285–299. doi: 10.5194/os-17-285-2021
Yang, Q., Dixon, T. H., Myers, P. G., Bonin, J., Chambers, D., van den Broeke, M. R., et al. (2016). Recent increases in Arctic freshwater flux affects Labrador Sea convection and Atlantic overturning circulation. Nat. Commun. 7, 10525. doi: 10.1038/ncomms10525
Yashayaev, I., and Loder, J. W. (2017). Further intensification of deep convection in the Labrador sea in 2016. Geophys. Res. Lett. 44, 1429–1438. doi: 10.1002/2016GL071668
Yeager, S., Castruccio, F., Chang, P., Danabasoglu, G., Maroon, E., Small, J., et al. (2021). An Outsized role for the labrador sea in the multidecadal variability of the Atlantic overturning circulation. Sci. Adv. 7, eabh3592. doi: 10.1126/sciadv.abh3592
Yin, J., and Zhao, M. (2021). Influence of the Atlantic meridional overturning circulation on the U.S. extreme cold weather. Commun. Earth Environ. 2, 218. doi: 10.1038/s43247-021-00290-9
Keywords: North Atlantic, AMOC, Greenland melting, numerical modeling, high resolution
Citation: Swingedouw D, Houssais M-N, Herbaut C, Blaizot A-C, Devilliers M and Deshayes J (2022) AMOC Recent and Future Trends: A Crucial Role for Oceanic Resolution and Greenland Melting? Front. Clim. 4:838310. doi: 10.3389/fclim.2022.838310
Received: 17 December 2021; Accepted: 14 February 2022;
Published: 04 April 2022.
Edited by:
Matthew Collins, University of Exeter, United KingdomReviewed by:
Jiang Zhu, National Center for Atmospheric Research (UCAR), United StatesShantong Sun, California Institute of Technology, United States
Copyright © 2022 Swingedouw, Houssais, Herbaut, Blaizot, Devilliers and Deshayes. This is an open-access article distributed under the terms of the Creative Commons Attribution License (CC BY). The use, distribution or reproduction in other forums is permitted, provided the original author(s) and the copyright owner(s) are credited and that the original publication in this journal is cited, in accordance with accepted academic practice. No use, distribution or reproduction is permitted which does not comply with these terms.
*Correspondence: Didier Swingedouw, didier.swingedouw@u-bordeaux.fr