RefRec+: Six Degree-of-Freedom Estimation for Smartphone Using Floor Reflecting Light
 Masanori Sugimoto
 Shota Shimada1
 - 1Graduate School of Information Science and Technology, Hokkaido University, Sapporo, Japan
- 2Information Systems Architecture Science Research Division, National Institute of Informatics, Tokyo, Japan
This paper describes a novel visible light positioning (VLP) system called RefRec+ allowing to estimate the six degree-of-freedom (6DoF) of a smartphone. In most existing VLP systems, their front camera faces multiple light sources installed at different places on a ceiling to detect their direct signals. To overcome the problem of the limited field of views that causes failure to capture required numbers of light sources for positioning and that of the high computational complexity because of image processing to a large-sized pixel data, RefRec+ captures indirect lights from the light sources reflected via a floor. RefRec+ estimates the 2-D position of a point of interest (POI) by calculating the received signal strength of individual light sources using the floor image captured by the camera. Using 2-D positions of multiple POIs and the angle of arrival method, RefRec+ obtains the 6DoF of the smartphone. Several experiments to confirm the performance of RefRec+ were conducted. Experimental results in a room measuring 4.0 m × 4.0 m using nine POIs each of which consists of 32 × 32 pixels in a captured image showed that the absolute errors at the 90th percentile for the 3-D coordinates were 0.2073 m, 0.1713 m, and 0.002464 m along the X, Y, and Z axes, respectively, and for the pitch, roll, and yaw angles were 5.78, 5.69 and 3.96 degrees, respectively.
1. Introduction
Indoor positioning is one of the key technologies for indoor navigation, with particular attention paid to methods that can be used with smartphones, which have become popular recently. Indoor navigation is expected to have different applications compared with outdoor navigation: for example, assistance in a high-rise office building or purchase recommendation in a large-scale shopping mall. Furthermore, seamless navigation between indoor and outdoor environments is critical not only for visually impaired persons visiting unfamiliar places (Duh et al., 2021) but also for people in emergency evacuation situations (Meneguzzi et al., 2013). The indoor positioning and navigation market is expected to grow 23.6 billion US dollars in 2023 (IndustryArc, 2017). The Japanese Ministry of Land, Infrastructure, Transport and Tourism launched the “Indoor High-precise Positioning Project” for the success of the Tokyo Olympic Games (Ministry of Land and Tourism, 2018). These applications require sufficiently accurate estimations of position and orientation. In our work, we focus on systems that satisfy a position estimation error of less than 1 m and an orientation estimation error of less than 10° as our initial target, and this seems acceptable in many indoor positioning and navigation situations.
From this background, many methods for determining the indoor positioning of mobile and wearable devices have been proposed. These include radio waves using Wi-Fi (Chen et al., 2021), Bluetooth low energy (BLE) (Faragher and Harle, 2015) or radio-frequency identification (RFID) (Cillis et al., 2020), infrared (IR) using IR LEDs (Hauschildt and Kirchhof, 2010), sound using speakers (Murakami et al., 2021), computer vision using a camera (Mautz and Tilch, 2011; Bai et al., 2019), visible lights (Zhuang et al., 2018), and other methods (Davidson and Piché, 2016). Among them, visible light positioning (VLP), using a transmitter and receiver that function via LED and camera, has shown some promise for indoor positioning (Lausnay et al., 2016). The receiver recognizes the light of the transmitters and then calculates its relative position to the transmitters. Compared with other methods, VLP has four major advantages.
1. It has sufficiently high accuracy compared with Wi-Fi and BLE-based methods
2. It is easier to protect other people's privacy than methods using computer vision because the camera usually faces only the light source and the floors in the proposed method).
3. Unlike RFID, ultra-wideband (UWB) (Grosswindhager et al., 2018), and VLP with photodiode (PD) methods, users are less burdened because they can use built-in cameras.
4. Acoustic-based methods need to capture signals from at least two and three speakers for 2-D and 3-D localization, respectively, which is often not practical in real indoor environments. By contrast, the proposed method capturing reflected lights via the floor, not direct light from light sources, can increase the possibility to implement using only existing illumination fixtures, described as follows.
In most of the existing camera-based VLP methods, the front camera directly faces multiple light sources installed at different places on a ceiling to detect the signals. Such methods have two major bottlenecks.
First, it is often difficult to capture multiple LEDs in the image [an issue termed non-line-of-sight (NLOS)]. In Japanese architectural plans, commercial facilities have floor-to-ceiling heights of approximately 3 m. In addition, the field of view (FoV) of a typical smartphone front camera is around 80°. If we assume that the height of a person's hand holding a smartphone is 1 m and the LED installation interval is 2.5 m, NLOS occurs frequently.
Second, these methods require a high-resolution or large-sized image for positioning because it is necessary to detect signals of light sources from the image. This is computationally demanding, and thus in existing methods, cloud servers are used (Kuo et al., 2014) or offline evaluation is conducted (Rajagopal et al., 2014).
Some prior work requires a rolling shutter distortion (Liang et al., 2008). This feature enables multiple samplings in one image, but customers usually do not like the distortion of the image caused by the rolling shutter. Hence, there are developments to overcome this problem, and the rolling shutter distortion may disappear from smartphone cameras in the future (Sony Group Corporation, 2021).
To address these problems, we propose the VLP system RefRec+ allowing us to estimate the six degree-of-freedom (6DoF) of a smartphone. This article is the extended version of our previous papers (Shimada et al., 2018, 2020) and includes revised text and figures and augmented discussion (Section 6.1) following the additional performance evaluations (Sections 5.2.2–5.2.4). In RefRec+, a camera captures light from the ceiling that is reflected by the floor and estimates the distance from the LED. No matter where the camera captures the floor reflection, the ceiling light will be reflected everywhere on the floor. Because the entire floor can be used as a light source, ideally, one pixel of point of interest (POI) in the image is sufficient to estimate the 2-D coordinates of the floor. Then, using 2-D coordinates of multiple POIs on the floor obtained, 6DoF of the smartphone are estimated by angle of arrival (AoA) estimation. Reflections of multiple lights will be overlapped on the floor. To separate them, the frequencies of individual LED lights are determined by DC-biased optical orthogonal frequency division multiplexing (DCO-OFDM) (Armstrong and Lowery, 2006). Experiments in a room measuring 4.0 m × 4.0 m show that the proposed method uses nine measurement points, each of which consists of 32 × 32 pixels (9,216 pixels in total) in a captured image. The results showed that the absolute errors at the 90th percentile for the 3-D coordinates are 0.2073, 0.1713, and 0.002464 m along the X, Y, and Z axes, respectively, and for the pitch, roll, and yaw angles were 5.78°, 5.69°, and 3.96°, respectively.
Our contributions are summarized as follows.
• The VLP method using floor reflections solves NLOS and the implementation problem, as described.
• The 6DoF estimation algorithm uses only modulated LEDs and a camera.
• Performance evaluation of RefRec+ was carried out by real-time positioning experiments.
We describe the challenges of prior works in Section 2, the proposed method for 6DoF estimation in Section 3, the implementation details of RefRec+ in Section 4, the experiments to demonstrate the advantages of the proposed method in Section 6, and the limitations of RefRec+ in Section 5. Our conclusion and future work are summarized in Section 7.
2. Related Work
To explain the advantage of VLP methods using a camera, some similar works that address indoor positioning are selected and their problems are mentioned. Then, existing methods of VLP using cameras and their challenges are discussed.
2.1. Indoor Positioning Using vSLAM
vSLAM (visual Simultaneous Localization and Mapping) is a self-positioning method that uses a camera to capture the inside of a building. vSLAM is a technology that simultaneously localizes a target and builds a map, but if the application is indoor navigation, it needs to be matched with a known map database.
iTracker is a system that can estimate the 6DoF of a smartphone in real time (Sun et al., 2019). It is based on the monocular vSLAM technique (Engel et al., 2014) and utilizes short-term inertial measurement unit (IMU) tracking and IMU camera local information for rapid recovery even if tracking is lost. Through experiments, the proposed real-time step-length adaption algorithm proved that the iTracker error and delay increased slightly over time and was stable at 7° and 15 ms.
Compared with VLP using a camera, vSLAM is advantageous because it does not require a transmitter such as a modulated LED. By contrast, there are some disadvantages: privacy issues must be considered in some existing systems, creating a database is difficult, and vulnerability to changes in object placement must be addressed.
2.2. Visible Light Positioning Using PDs
A PD is a device that can receive LED signals with lower power consumption than a camera. Simulation-based methods using PDs, such as time of arrival (ToA) (Wang et al., 2013) and time difference of arrival (TDoA) (Jung et al., 2011), have been proposed. However, accurately measuring the arrival time of a signal arriving at the speed of light using an off-the-shelf PD is difficult; hence, AoA (Yang et al., 2014) and received signal strength (RSS) (Steendam et al., 2017) have been proposed for use in real devices.
Epsilon was the first real working VLP system designed in the academic community (Li et al., 2014). It detects the binary shift keying of the LED using the prototype device with the PD and derives the position by triangulation. Accuracies of 0.4, 0.7, and 0.8 m at the 90th percentile were achieved in three different office spaces. NALoc uses the same type of device as the ambient light sensor that is implemented in a smartphone. The results gave 90th percentile errors of less than 0.35 m for the 2-D position, but the device was evaluated separately from the smartphone and not in a built-in setting (Yang et al., 2018).
These methods have not been evaluated using sensors embedded in smartphones. In our study, we describe an application that can run using only a smartphone.
2.3. Visible Light Positioning Using Cameras
We focus on VLP using smartphone cameras. Camera-based methods allow geometrical separation of the light sources, allowing for more accurate positioning (Yoshino et al., 2008; Rahman et al., 2011; Zhu and Zhang, 2017).
Luxapose can compute the position and posture of the smartphone by capturing ceiling lights directly with a camera (Kuo et al., 2014). The error is less than 10 cm and 3°. It uses 7712 × 5360 pixels in a WindowsPhone 8 smartphone camera as the receiver. The calculation requires a cloud server for high-quality image processing.
PIXEL is a polarization-based localization method (Yang et al., 2015) that requires only 120 × 160 pixels. It can measure indoor positioning in several seconds with an accuracy of 0.4 m. However, a polarizing filter must be attached to the camera, so there is a risk of impairing the original image.
The approach by Rajagopal et al. uses light reflected by the floor (Rajagopal et al., 2014). It is similar to our idea, but the authors focus on using the rolling shutter distortion to receive an identifier (ID) from the reflected light. Carriers up to 8 kHz can be received with a channel separation of 200 Hz. Tag information is transmitted by assigning ON and OFF bits to different frequencies. The data rate is 10 bps, and up to 29 light sources can be uniquely separated. Positioning accuracy was not discussed in the paper because the research aimed to obtain semantic positioning from differences in packet reception rates (PRR). Furthermore, because MATLAB was used for calculation, processing was not in real time.
STARLIT (Yang et al., 2019) also uses a rolling shutter camera and obtains short and long exposure images of reflected floor lights to filter noises. STARLIT can achieve 3-D localization of a smartphone but cannot conduct its 6DoF estimation.
The approach by Nakazawa et al. uses a dual-facing camera and calculates its position by the relationship between the ceiling light and the reflected light on the floor. Large coverage and high accuracy are achieved using only two LEDs. This method also requires a large image, so the average processing time is 1.2 s (Nakazawa et al., 2017).
In iLAMP, the radiation pattern of each LED in the building is recorded by the camera at first, and the position of the camera is estimated by matching with a database that has been created (Zhu and Zhang, 2017). Because a single LED can be used to estimate the 6DoF of a smartphone, there are fewer restrictions on the formation of the LEDs and the height of a ceiling. However, a computing server is required for large image processing.
RainbowLight is a method for calculating 3-D positioning based on the properties of birefringence and polarization (Li et al., 2018). In the authors' system, a birefringent material such as cellophane tape and a polarizing film are attached to the LED or window as landmarks, which are photographed by a camera equipped with the polarizing film to enable positioning without modulating the light. In a 3-D positioning experiment where the distance between the light source and the camera was between 2 and 3 m, the average errors were 3.19 cm on the x-axis, 2.74 cm on the y-axis, and 23.65 cm on the z-axis.
These systems still have the problems described in Section 1: constraints of LED formation and the height of the ceiling because of the FoV of the camera, calculation overheads for real-time processing within the smartphone, and the lack of care regarding overcoming rolling shutter distortion.
3. System Description
3.1. Overview
Our goal is to estimate the 6DoF of a smartphone in indoor environments. The definitions of 6DoF and image plane in RefRec+ are shown in Figure 1. The mobile 3-D position is shown by (x, y, z) in the world X, Y, and Z coordinates, and the pose is shown by (θx, θy, θz), which means pitch, roll, and yaw angle along the XC, YC, and ZC axis of the smartphone coordinate system. The head of the smartphone points in the Yc direction, and the camera faces the floor at its initial status (θx, θy, θz) = (0, 0, 0). 3-D space is transformed by the camera into a U-V image plane, as shown in Figure 1. An overview of our system is shown in Figure 2A. Our method is based on observations that the RSS from the LED decreases with the distance from the LED to the floor.

Figure 1. Definitions of smartphone's 6DoF and 2-D coordinates.
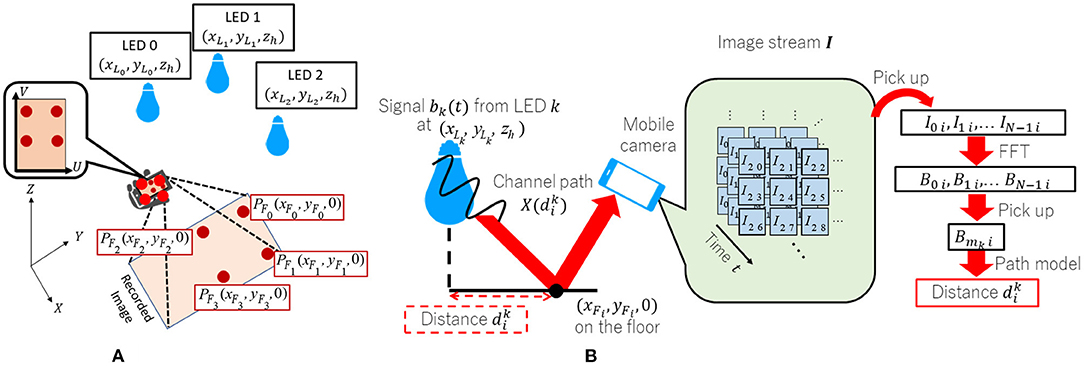
Figure 2. Overview of RefRec+. (A) System overview and (B) distance estimation workflow.
More than two LEDs are mounted on the ceiling, which is parallel to the X-Y plane. The kth LED's known 3-D coordinate is PLk = (xLk, yLk, zLk). Each LED broadcasts a sinusoidal wave with its own unique frequency. The receiver is given the assignment table of these frequencies in advance. Modulated light from the LEDs is reflected by the floor, which is parallel to the X-Y plane where Z = 0. The camera of the mobile device captures any part of the floor area and then obtains a light intensity value at the center of ith POI PFi = (xFi, yFi, 0)(i = 0, 1, ⋯ ) composed of multiple pixels by averaging their intensity values. The total number of LEDs should be more than two. The ith POI corresponds to the pixel (u, v) on the U-V plane shown in Figure 1.
The positioning algorithm is briefly described as follows (Figure 2B). represents the distance between the intersection point on the floor with a perpendicular line passing through the kth light source installed at the ceiling at PLk and PFi on the floor captured by the camera. First, the distance is estimated. Second, the coordinate of PFi corresponding to (u, v) on the U−V plane is estimated using (k = 0, 1, 2, ...) and the known position of the LEDs.
The 6DoF of the camera is estimated by optical AoA using more than two PFi. The following sections provide details of the process.
3.2. Estimation of
To find the distance , the camera detects the intensity of the received signal from the photographed image and substitutes it into the diffusion model of the LED's reflected light. To reduce the influence of other light sources, the LED blinks a sinusoidal wave orthogonal in frequency to those of other light sources. We define bk(t), which includes a signal from the kth LED at time t, as follows:
where fs is the fundamental signal frequency and Ak is a natural number so that the signal reaches a frequency that is sufficiently high to avoid causing flickering; α is the direct current component, which makes bk(t) always a positive value; and mk is a natural number that uniquely identifies the frequency for each LED.
Let us assume that the camera frame rate is fc = fs, the shutter cycle is Tc = 1/fc, the exposure time ratio is η, and the exposure time is ηTc. By taking N images with the camera and separating the received light in the frequency domain, it is possible to extract the signal intensities of the unique frequencies. Therefore, the number of detectable LEDs is N/2−1, and mk < N/2 should be satisfied as per the sampling theorem. By capturing bk(t) from the kth LED with a camera, the resulting brightness Ini of the PFi on the nth image is an integral:
where δ is the delay of the shutter timing with respect to the signal, and is the attenuation function that is determined by the distance and transfer efficiency from the kth LED as a transmitter to the receiver. Hence, our purpose is to calculate from the inverse function of using Ini.
Now, Bqi is obtained by the Fourier transform of the video stream Ii = (I0i, I1i, ..., IN−1i):
By assuming βmk obtained by Fourier transform of bk(t), Bmki is shown as follows (Shimada et al., 2017; Sugimoto et al., 2017):
where fk = Akfs + mk and sincx = sinx/x hold. Thus, the unique frequency mk can be extracted. Note that the amplitude spectrum |βmk| is affected by η and the sinc function. The attenuation of magnitude affects the accuracy of positioning, so η must be set properly. Note that is the product of attenuation of the LED's signal and transfer efficiency. We assume the attenuation of the LED's signal is inversely proportional to the square of the distance and attenuates by the cosine of the radiation angle θ. However, it is difficult to model the attenuations theoretically because reflecting properties are very complicated in the real environment (Zhang and Yang, 2020). Our previous work (Shimada et al., 2018, 2020) comparing different mathematical models showed attenuation on the floor can be approximated by a hyperbolic secant distribution as shown in Figure 3. Therefore, the following equation
is used, where σ is the radiation characteristic of the LED, and Ck is the transmission efficiency determined by the receiver sensitivity. Hence, the amplitude spectrum |Bmki| is shown as follows:
Thus, can be calculated as
where .
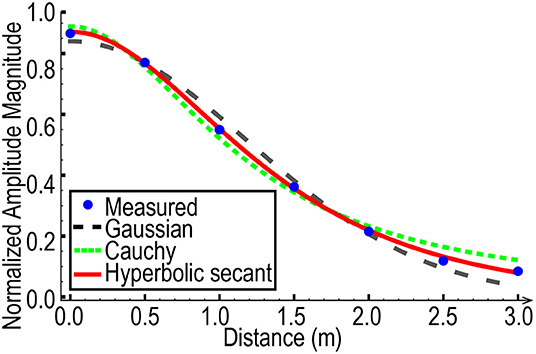
Figure 3. Comparison between different diffusion models.
From Equation (7), the distance cannot be estimated unless and σ are obtained in advance by calibration. However, if all materials from each LED used for positioning are the same, calibration-free ranging can be achieved by determining and σ that minimize the following summation:
3.3. Position on the Floor Recorded by a Camera
The second step is to obtain PFi-captured positions on the floor using three or more estimated by the previous step. Note that PFi has a one-to-one correspondence with (u, v) on the U−V plane. Now, we assume that three perpendiculars from the light sources pass through the floor at the points (xL0, yL0), (xL1, yL1), and (xL2, yL2) (see Figure 2). Suppose that the estimated distances from these intersection points to the point (xFi, yFi) are as explained in Section 3.1. (xFi, yFi) is given by solving the following equation as an optimization problem:
3.4. Estimating 6DoF of the Camera
The last step is to estimate the 3-D position and pose of the camera. These are calculated using the optical AoA method with the camera matrix:
where s is the scale coefficient, M denotes the intrinsic properties, and [R t] represents the extrinsic properties (Bradski and Kaehler, 2008). p is the 2-D image coordinates, and P defines the 3-D world coordinates as follows:
where the 3-D world coordinates (xFi, yFi) are captured by a camera as 2-D image coordinates (uIi, vIi) on the image. The camera position and rotation matrix [R t] are obtained by minimization of ||M[R| t]P−sp||2.
4. Implementation Details
The prototype of RefRec+ using four LEDs and a smartphone was implemented in our laboratory, as shown in Figure 4.
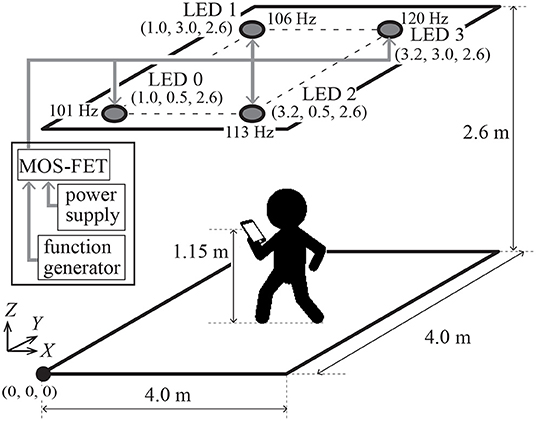
Figure 4. Positioning of the LEDs in the room and the camera settings.
4.1. LED Transmitter
BXRE-50C4001-B-74-type LEDs from Bridgelux were used as the LED transmitter. RefRec+ assumes that the light source is not an area or a line source, e.g., a flat panel or a bar light. Extending the experiments to include these sources remains to be addressed in future work. Four LEDs above the room were set as shown in Figure 4. The height of the ceiling is 2.6 m, coverage is a square surface of 4.0 m × 4.0 m, and LEDs 0, 1, 2, and 3 were set at (1.0, 0.5, 2.6), (1.0, 3.0, 2.6), (3.2, 0.5, 2.6), and (3.2, 3.0, 2.6) m, respectively. This setting was the same as the original built-in formation of fluorescent lights in this room. No other objects were placed in the room to evaluate the performance properly in an ideal environment. The signal parameters were set at fs = 50, α = 1, Ak = 2 (at any k), and mk = (1, 6, 13, 20). Hence, the LEDs were modulated at 101, 106, 113, and 120 Hz. These frequencies are higher than the 100 Hz modulation frequency for fluorescent lights in east Japan to ensure people do not experience any flickering. The transmitter represented any signal by pulse density modulation (PDM). A 5-V pulse signal from a function generator (NF Corporation WF-1948) was amplified to 34 V using a metal-oxide-semiconductor field-effect transistor (MOS-FET) and a power supply. The frequency of the pulse signal was about 8 MHz. This was a prototype, and the transmitter can be made cheaper and smaller using a circuit similar to a dimmable off-the-shelf LED in our future experiments.
4.2. Camera Receiver
An iPhone 7 was used as a receiver. Smartphones in recent years have generally higher-performance chipsets and cameras than the iPhone 7. Therefore, we believe that the experiments in this paper can be reproduced on more current smartphones. The frame rate of fc = N = 50 was set to avoid effects from other fluorescent lights. In east Japan, fluorescent lights are modulated by AC 100 Hz, so 50 fps is the orthogonal frequency, which will treat other fluorescent lights just as DC sources (the same as sunshine). The F value is fixed on f/1.8 in the case of the iPhone 7. The focus was fixed on the floor. The distortion of the image was calibrated using Zhang's method (Zhang, 2000). A tripod was used to fix the smartphone.
5. Evaluation
5.1. Overview
Several experiments for clarifying the advantages and limitations of RefRec+ and how the performance of RefRec+ was determined are described in the following sections. The accuracy of the proposed system is most affected by its ranging performance. To reveal the ranging error, each distance was estimated by the following equation:
Note that (xF0, yF0) is the floor 2-D coordinates PF0, calculated using the corresponding pixel captured by the camera. Unless otherwise noted, all the experiments regarding the ranging performance evaluations were conducted as follows: only LED 0 (k = 0) was used and each measurement point was set at 0.5 m intervals from just below the LED (d0 = 0) to d0 = 3.5 m, and 100 measurements were taken at each point. Based on each amplitude spectrum obtained, the distance d0 was estimated by the parameter estimation using equation (7). In experiments except those in Section 5.2.3, the floor was illuminated only by the four LEDs. Existing fluorescent lights were turned off and direct sunlight was blocked using window shades.
The experiments described in Section 5.2.2 showed that floor material might affect the performance of RefRec+ seriously. Thus, a floor made from a non-patterned, non-gloss mat was chosen in experiments other than those in Section 5.2.2.
5.2. Estimation of Distance d0
5.2.1. Different ISO and Shutter Speed Settings
The relationship between the camera parameter and positioning accuracy for each ISO and shutter speed (SS) setting by the iOS API was evaluated. The ISO was set at 22, 100, 300, and 704, and the SS was set at 1/1,000, 1/500, 1/300, 1/150, and 1/60 s. As noted in Section 5.1, 100 measurements with each d0 were conducted in each IOS and SS setting. Experimental results regarding absolute mean errors and standard deviations including all measured distances (d0= 0.0, 0.5, 1.0, 1.5, 2.0, 3.0, and 3.5 m) are shown in Figure 5. Note that the result at the ISO 22 and SS 1/1,000 setting was not available because missing values were observed in the measurement. When the ISO value was set too low, the distance d0 could not be estimated correctly. When the ISO value was set over 300, estimations at the centimeter level were achieved. We also found that SSs should be shortened. However, SSs that are too short make estimation difficult because the images become too dark. Hence, the settings of the camera suggest that the ISO value be set over 300 and the SS larger than 1/1,000 s. We subsequently set the SS at 1/500 s and the ISO value at 500.
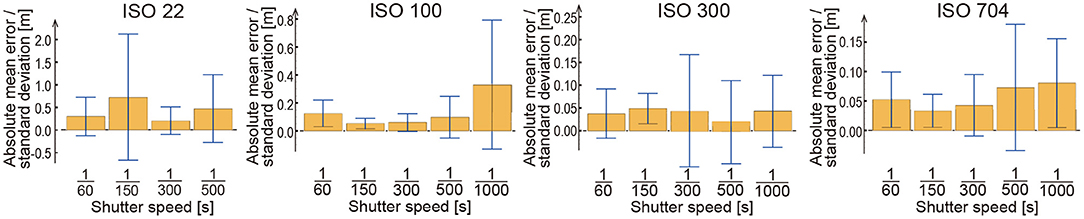
Figure 5. Absolute mean errors (rectangular bars) and standard deviations (error bars) of the estimated distance for each ISO and shutter speed setting.
5.2.2. Different Floor Materials
The effect of the floor material that reflects the modulated light was investigated. Seven types of flooring materials were used. Each material on the floor surface used in the experiment is shown in Figure 6. Each material shown from Figures 6A–C is a mat made from synthetic fibers, and each color is different. Both Figures 6D,E are made from wood, but the surface gloss is different.
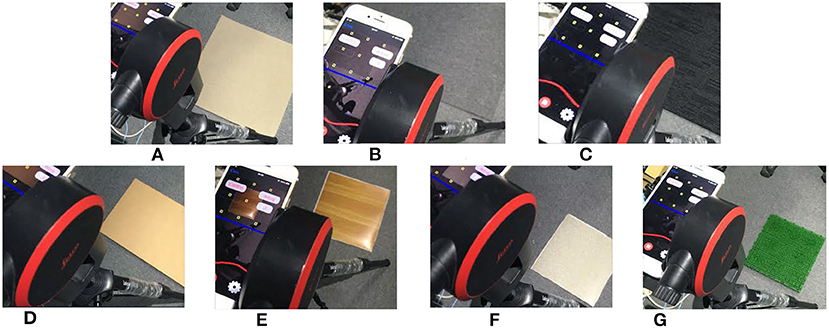
Figure 6. Materials on the floor surface used in the experiment. (A) White mat, (B) gray mat, (C) black mat, (D) non-glow wood, (E) glow wood, (F) marble, and (G) artificial grass.
The cumulative distribution function (CDF) of absolute errors relating to each estimated distance at each floor material is shown in Figure 7. The white mat, gray mat, non-glow wood, and marble show better results. Their 90th percentile errors except the distance d0 = 3.5 m are within 0.15 m. By contrast, the black mat, glow wood, and artificial grass show worse results. The black mat reflects lights to a lesser extent, so the signal-to-noise ratio (SNR) becomes worse. Wood with a mirror-like gloss surface reflects light extremely strongly in some places, causing a worse error. Artificial grass shows the worst result. The surface of the artificial grass diffusely reflects light, and as a result, the signal is not received correctly.
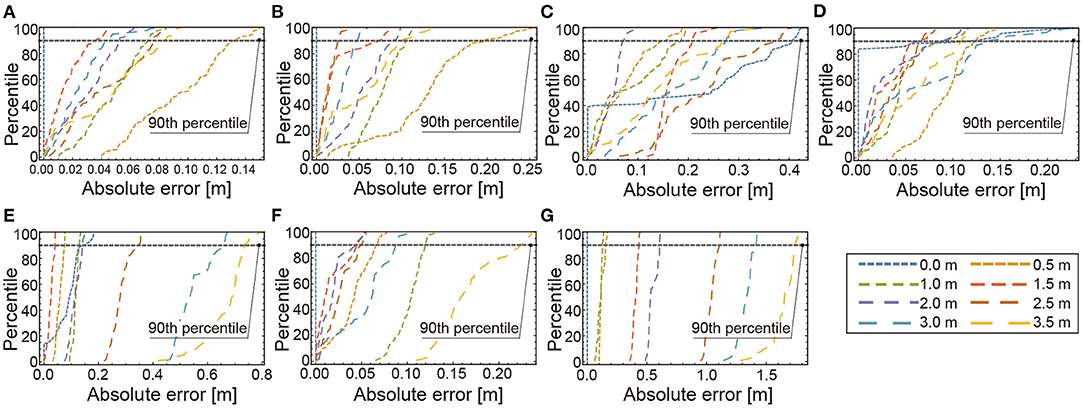
Figure 7. CDF of absolute errors of estimated distance using each material. (A) White mat, (B) gray mat, (C) black mat, (D) non-gow wood, (E) glow wood, (F) marble and (G) artificial grass.
5.2.3. Influence of Ambient Light
Influences of ambient lights were investigated in the following settings: (a) without direct sunlight using window shades in the daytime, (b) with direct sunlight in the daytime, and (c) with fluorescent lights in nighttime. CDFs of absolute errors of the estimated distance in each setting using 100 measurements are shown in Figure 8. The results at d0 = 2.0 in Figure 8B depicting large systematic errors (more than 0.4 m) might be caused by manual camera placements. It is confirmed from Figure 8A that the 90th percentile errors are less than 0.3 m in the setting without direct sunlight, meaning that RefRec+ can achieve acceptable performance for indoor applications when direct sunlight is blocked. The experimental results in all settings show the tendency that the longer the distance to be estimated, the larger the absolute mean errors. Especially, the performance degradation was confirmed under fluorescent lights as shown in Figure 8C.
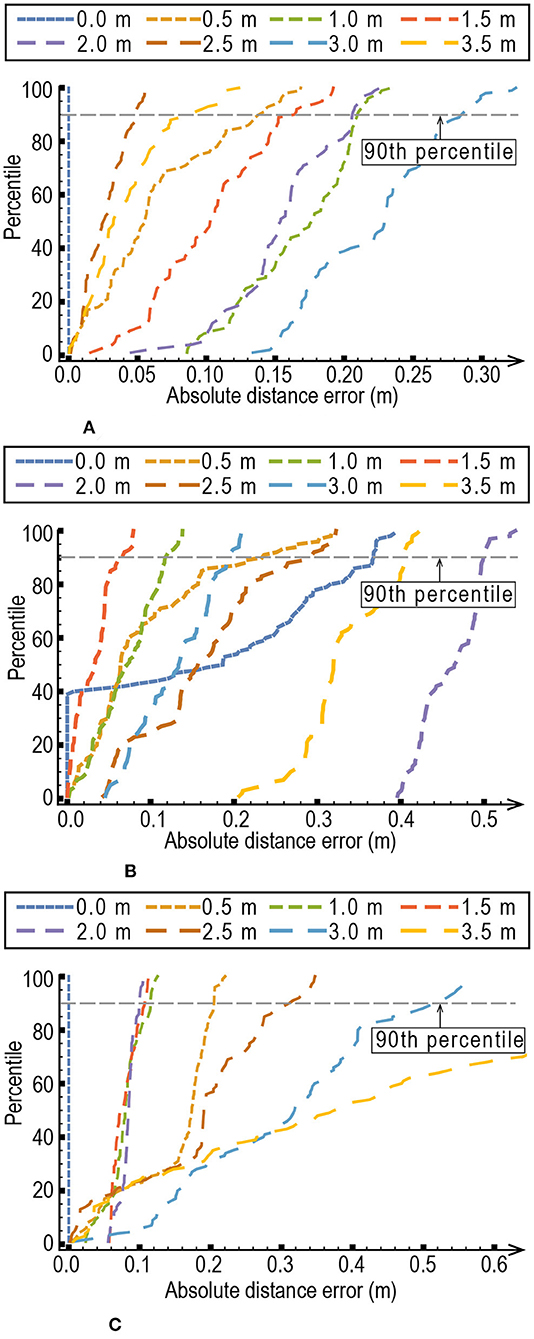
Figure 8. CDF of absolute errors of estimated distance in different ambient light settings. (A) Without direct sunlight in daytime. (B) Direct sunlight in daytime. (C) Fluorescent light in nighttime.
5.2.4. Multipath via Wall
The experimental setting for investigating the influence of multipath lights coming to the floor is shown in Figure 9. By changing the distance between the smartphone and a movable white wall that reflects the direct light from LED 0, the intensities at the measurement point were obtained. One hundred measurements were conducted at d0=0.5, 1.0, 1.5, and 2.0 m. If the influence of the light coming via the white wall was small, the intensities at different distances became almost the same values because the geometric relation between LED 0 and the measurement point was fixed. The results in Figure 10, however, showed that the longer the distance, the smaller the amplitude magnitude (normalized by the value at d0 = 0.5). Therefore, the closer the reflective objects such as a wall exist, the more the performance of the distance estimation is affected.
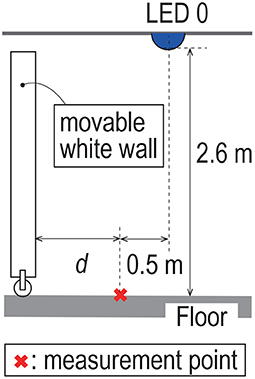
Figure 9. Multipath experiment setting.
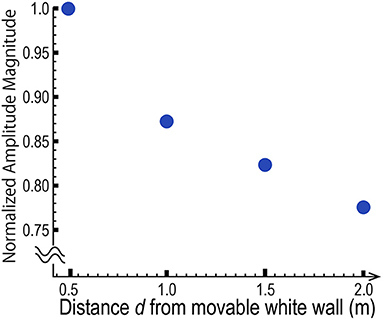
Figure 10. Influence of reflected light via wall at different distances.
5.2.5. Number of Pixels
The distance estimation performance regarding computational complexity was evaluated by changing the number of pixels consisting of one POI (2n× 2n, 0 ≤ n ≤ 8). Figure 11 shows standard deviations of the estimated distance to the center of the POI at d0 = 1.0 m. One hundred measurements were conducted at each value of n. Although the estimated mean error remained almost the same (within 0.05 m), the standard deviations became smaller as the number of pixels became larger. It was confirmed from the experimental results that if we set the number of pixels of a POI to 32 × 32 (n = 5), standard deviations within 0.05 m could be achieved.
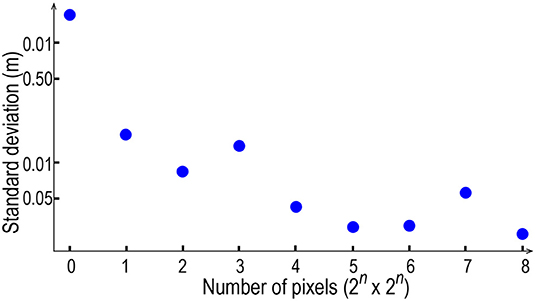
Figure 11. Standard deviations of estimated distance using different numbers of pixels.
5.3. 6DoF Estimation Using Positions of Multiple PFis
For estimating the 6DoF of the smartphone, nine PFi (0 ≤ i < 9) were chosen from one image stream with the resolution of 1,920 × 1,080 pixels. The principal point was (uc, vc) = (959.07, 524.86). As Figure 12 shows, the 2-D image coordinates of the points chosen are (uIj, vIk) = (300j+200−uc, 300k+200−vc) (0 ≤ j < 3, 0 ≤ k < 3).
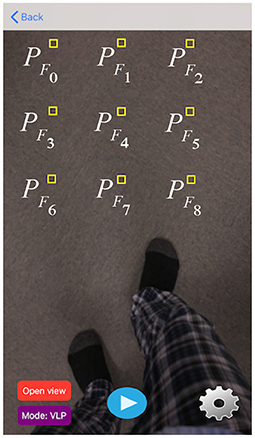
Figure 12. PFis displayed on the screen.
By using PFis in each of 50 consecutive images captured in 1 s (the camera frame rate is set to 50 fps), RefRec+ conducts the Fast Fourier Transform to obtain intensities of reflected lights coming from individual LEDs. Examples of time and frequency domain representations of signals captured at PF0, PF4, and PF8 are shown in Figure 13. The amplitude peaks are observed at 1, 6, 13 and 20 Hz in Figure 13B, which correspond to the emitted signals from LED 0 (101 Hz), LED1 (106 Hz), LED2 (113 Hz) and LED 3 (120 Hz), respectively. The 6DOF of the smartphone is calculated as described in Section 3. RefRec+ completes the 6DOF calculation before a new image is captured. When the new image is available, RefRec+ restarts the calculation in the same manner. Figure 14 shows the time variances of intensities of individual LEDs calculated using different PFis in 50 consecutive images captured between the 1st and 150th camera frames.
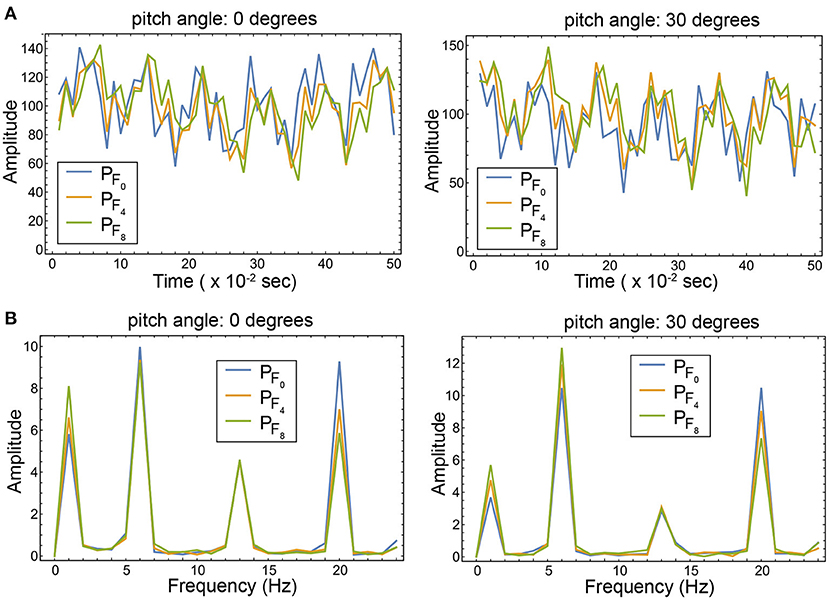
Figure 13. Examples of captured signals at PF0, PF4, and PF8 represented in the (A) time and (B) frequency domains. Note that DC components are filtered out in the frequency domain representation. The smartphone was placed at (x, y, z) = (2.5, 2.5, 1.15) and its yaw angle (θz in Figure 1) was set to 0 degrees. The pitch angle (θx) was set to 0 and 30 degrees.
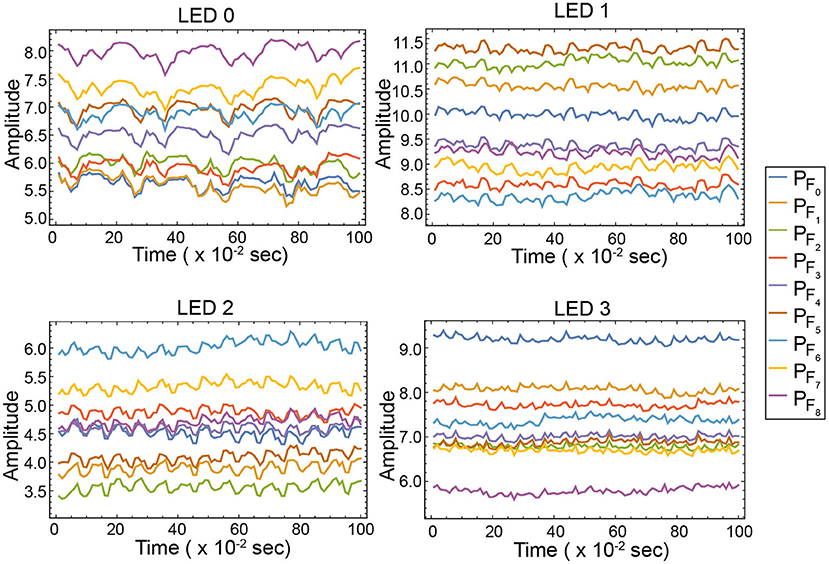
Figure 14. Examples of time variances of the LED signals captured at different PFis. The smartphone was placed at (x, y, z) = (2.5, 2.5, 1.15) and its pitch and yaw angles were set to 0 degrees.
A camera was set in the room with parameters (x, y, z) = (1.0, 0.5, 1.15) and . Each PFi position was estimated 100 times in real time as shown in Figure 15.
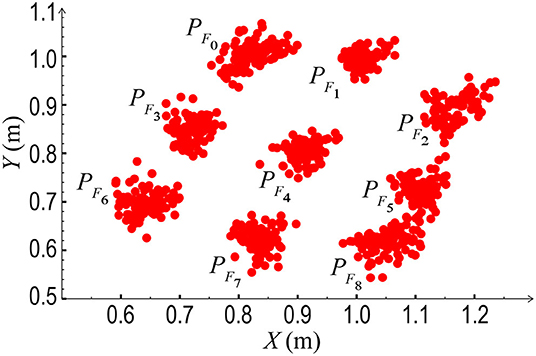
Figure 15. Estimated positions of nine PFis (100 measurements for each PFi).
The accuracy of the estimated θz regarding how multiple PFis were chosen was evaluated. The total number of PFis was nine, so the total number of combinations of choosing more than one PFi from these was 29−1−9 = 502. The estimated errors using different numbers of PFi to calculate θz are shown in Figure 16, as a box-and-whisker diagram. Based on this figure, the maximum, middle, and minimum errors (highest, middle, and lowest horizontal bars of each whisker); average error (‘x' on each box); and 25th and 75th percentile error (top and bottom of each box) are represented. When the number of PFi used was two, the estimated errors became larger than those of the other numbers, depending on which two were chosen from the nine PFis. The best 90th percentile absolute error was 6.15°, with the worst 90th percentile absolute error at 27.09°. When the baseline length [e.g., the distance between (uI0, vI0) and (uI2, vI2)] was long, the accuracy was improved. By contrast, the results for the cases with short baseline lengths [e.g., distance between (uI1, vI2) and (uI2, vI2)] were inaccurate. As the number of PFis increased, the difference between combinations (standard deviation) decreased. When the number of PFis used was eight, the performance differences between each combination composed of different chosen points became even closer: the best 90th percentile absolute error was 3.25°, and the worst 90th percentile absolute error was 5.77°.
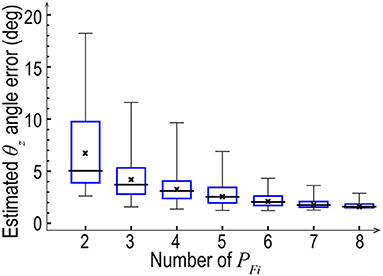
Figure 16. Estimated θz using different numbers of PFi.
Experiments for 6DoF estimation were conducted using all the PFi-captured positions. Results of the 3-D position estimation are shown in Figure 17. From the CDFs in the figure, the absolute errors at the 90th percentile for the 3-D coordinates were 0.2073, 0.1713, and 0.002464 m. The absolute 3-D position error at the 90th percentile was 0.27 m. The accuracy limitations of the smartphone's angle estimation by RefRec+ were investigated for each pose of the smartphone. The pitch, roll, and yaw of the smartphone were changed by 10° each, and its pose was estimated 100 times. Because of the movable range of a fixing apparatus of a smartphone, the measurable angles of roll, pitch, and yaw were limited to −30° to 30°, 0° to 30°, and 0° to 90°, respectively. Each 90th percentile absolute angle error at each posture of the smartphone is shown in Figure 18. Means of the 90th percentile absolute angle error were 5.69°, 5.78°, and 3.96° for the roll, pitch, and yaw, respectively.
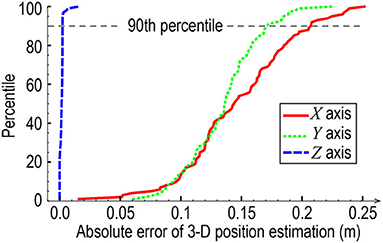
Figure 17. Absolute errors in the 3-D coordinates using nine PFis.
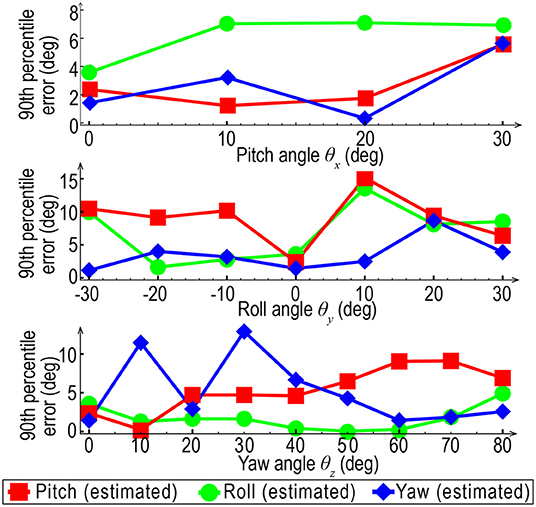
Figure 18. Ninetieth percentile absolute angle error at each posture of the smartphone using nine PFis.
5.4. Experiments in a Mobile Environment
We conducted preliminary experiments for 2-D position estimation to evaluate the performance of RefRec+ in mobile environments. A user (male, age 27, height 1.8 m) holding a smartphone was asked to walk along the six paths from right to left as shown in Figure 19A. Two hundred measurements per path were conducted. Figures 19B,C show heatmaps regarding the absolute errors and standard deviations. Bright colors mean that errors and standard deviations are large. From the figure, the positioning results in the right-side area indicated larger absolute errors and standard deviations than the left-side area. It was confirmed that the user often blocked the direct lights from LED 2 and LED3 in the former area and thus their reflected lights from the floor where his shadow was casted were not captured by the smartphone camera. Except the shadowed areas, RefRec+ could achieve absolute errors of less than 0.4 m. In order to mitigate the problem and improve the performance, we further investigate the influence of the shadow and test a couple of methods that can identify and avoid choosing POIs from shadowed areas (Yamashita et al., 2021).
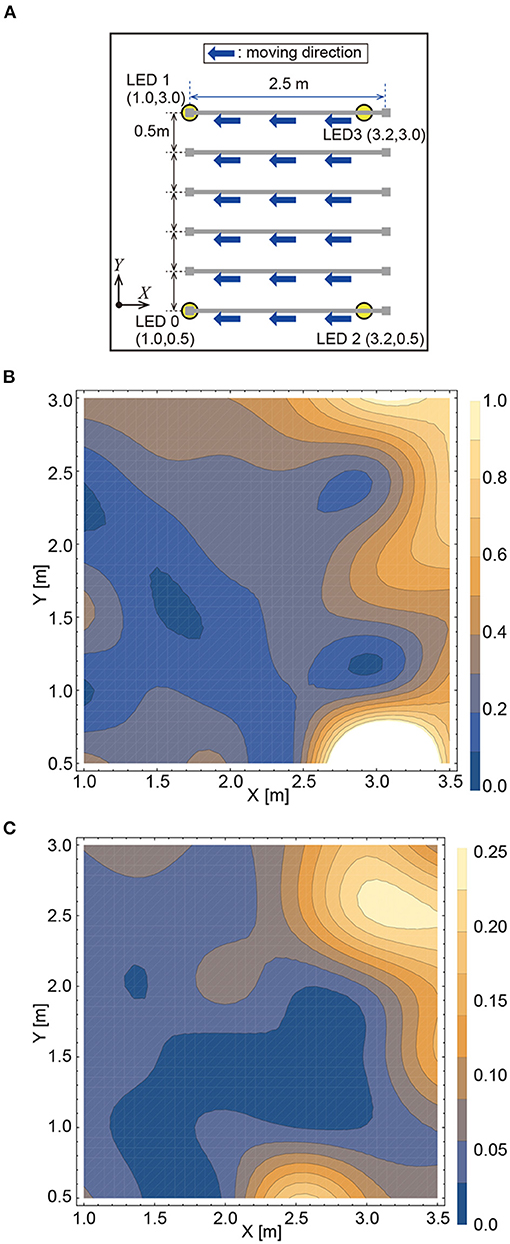
Figure 19. Preliminary experiments in mobile environments: (A) experimental setting (B) heatmap representing absolute errors (C) heatmap representing standard deviations.
6. Discussion
In this section, we discuss the limitations and advantages of RefRec+ and the potential remaining future work.
6.1. Distance Estimation in Different Settings
From experimental results shown in Section 5.2, the distance estimation performance of RefRec+ was affected by the camera parameters (ISO and SS), measurement environments (floor materials, ambient lights), and number of pixels, which were somehow related to SNRs. Lower SNRs seemed to deteriorate the estimation performance. Although decreasing the number of pixels makes the estimation performance worse, it is expected to reduce the computational complexity for image processing and improve the power consumption (Afzalan and Jazizadeh, 2019), which is critical for the run time of the smartphone battery.
The proposed (Equation 7) did not consider multipath environments and thus could not estimate the distance accurately in such situations. Calibrations of the equation by considering influences of multipath lights via reflective objects (Abou-Shehada et al., 2021) can improve the performance of RefRec+. A multipath propagation model by integrating diffuse and specular surface assumptions and its model parameter estimation method are proposed and evaluated using different reflection surface materials (De-La-Llana-Calvo et al., 2017). More intensive investigations regarding the mitigation of multipath influences are needed in our future work.
RefRec+ uses RSS values of LED lights each of which has its unique frequency among them. Therefore, theoretically, the distance estimation performance is not affected by ambient lights if their frequencies are different from those of the LED lights. However, it was not confirmed to hold in the experiments. One possible explanation regarding this issue is the nonlinearity characteristics of the camera, which compresses intensity values to avoid whiteout when the power of the signal increases. Applying gamma correction (Reinhard et al., 2010) to alleviate the problem is our another future work.
6.2. Comparison of Performance
A comparison of the performance of VLP is presented in Table 1. Note that each experimental environment differs in terms of LED installation spacing and measurement area size. Luxapose (Kuo et al., 2014) and iLAMP (Zhu and Zhang, 2017) were evaluated in mobile environments and the others were evaluated in static environments. Accuracy(°) and accuracy(m) show the 90th percentile absolute errors of 6DoF and 2-D/3-D positioning estimation using each method. Our method has the worst estimation accuracy for 6DoF. However, we claim that this result is sufficient for our application case because it satisfied our initial target described in Section 1. Density means how many LEDs are mounted on the 1 m2 ceiling. The performance index (PI) proposed by Afzalan and Jazizadeh (2019) is derived by dividing the accuracy(m) by the density. Therefore, a smaller PI value means that a larger area can be covered with higher positioning accuracy using fewer LEDs. The table shows that only RefRec+ and (Zhu and Zhang, 2017)'s method achieve a PI of less than 0.1. As mentioned in Section 2, compared with Zhu and Zhang (2017), RefRec+ has advantages in that it does not require any dataset or any cloud computing. The resolution shows that RefRec+ uses fewer pixels for positioning. As a result, our method can complete the 6DOF calculation using 50 consecutive images in the fastest time and achieve the update rate of 50 Hz.
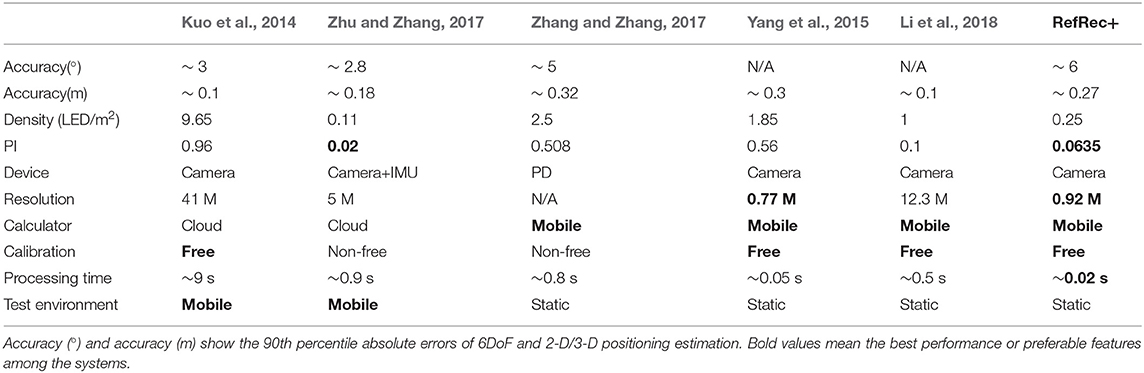
Table 1. Comparison of 6-DOF estimation accuracy with existing VLP methods.
6.3. Performance Differences Between Transmitters and Receivers
For calibration-free positioning, the performance of all LEDs used for positioning should be the same. However, individual LEDs often show different luminescence characteristics even while belonging to the same model. In the experiment, only one smartphone was tested as a receiver, and thus we did not observe any difference in results between different smartphones. The investigation of the difference between individual devices and models of transmitters and receivers remains as future work.
6.4. Solutions in the Larger-Scale Environment
A 4.0 m × 4.0 m room was chosen in our experiment to assume the office environment. Assuming a real-world application, we need to experiment in a larger-scale environment. However, allocatable frequencies need to be considered. When set to N = 50, the total number of frequencies that can be assigned is 25, which may be inadequate for real-world applications such as a navigation system in a shopping mall. Hence, a new allocation method needs to be discussed.
Using the concept of the coloring problem, there exists a method of reassigning the same frequencies so that they are not adjacent (Yang et al., 2018). We plan to utilize phase-shift keying (PSK) to identify more LEDs. βmk in Equation (4) includes phase information of a sinusoidal wave from kth LED. If 16-PSK is used for modulation, the number of LEDs that can be assigned increases to 25 × 16 = 400.
6.5. Human Movement Tracking
We do not intensively address the movement of the person holding the smartphone, although we describe preliminary experiments in Section 5.4. In particular, if the material of the floor changes during capturing, it is expected that positioning will become difficult. However, our method still has an advantage with regard to tracking because it can increase the possibilities for correctly predicting and identifying floor materials by estimating the 3-D position and pose of the smartphone. Further performance improvement, including the integration of the proposed method with pedestrian dead reckoning (PDR), remains future work.
7. Conclusion
VLP for smartphones is regarded as a promising technique that is expanding the market in many industries. This paper describes an approach to avoid existing limitations, such as line-of-sight (LOS), using a camera recording light reflected by the floor. The proposed system RefRec+ showed 90th percentile 3-D localization and pose estimation errors that were 0.2073, 0.1713, and 0.002464 m, and 5.78°, 5.69°, and 3.96°, respectively. RefRec+ has larger coverage and a smaller image processing requirement than conventional techniques. We also point out that some conditions may affect the positioning accuracy, such as camera parameters, floor materials, ambient light and multipath environments, and numbers of points chosen from captured images and their combinations. Integrating RefRec+ and conventional techniques should reduce the limitations and improve accuracy. Future work will explore cases where, for example, more people hold their smartphones and move around, objects are placed on the floor to cause occlusion, and more LEDs are used. We will perform experiments by developing applications deployable in the real world and that can be conducted in a larger area.
Data Availability Statement
The original contributions presented in the study are included in the article/supplementary material, further inquiries can be directed to the corresponding author.
Author Contributions
MS and SS wrote the manuscript. SS, MS, and HH devised and developed the conceptual idea. SS implemented and evaluated the proposed system. MS supervised the research project. All authors contributed to the article and approved the submitted version.
Funding
This research was supported by JSPS KAKENHI grant nos. 19H04222 and 20K21781.
Conflict of Interest
The authors declare that the research was conducted in the absence of any commercial or financial relationships that could be construed as a potential conflict of interest.
Publisher's Note
All claims expressed in this article are solely those of the authors and do not necessarily represent those of their affiliated organizations, or those of the publisher, the editors and the reviewers. Any product that may be evaluated in this article, or claim that may be made by its manufacturer, is not guaranteed or endorsed by the publisher.
References
Abou-Shehada, I. F., AlMuallim, A. F., AlFaqeh, A. K., Muqaibel, A. H., Park, K.-H., and Alouini, M.-S. (2021). Accurate indoor visible light positioning using a modified pathloss model with sparse fingerprints. J. Lightwave Technol. 39, 6487–6497. doi: 10.1109/JLT.2021.3098005
Afzalan, M., and Jazizadeh, F. (2019). Indoor positioning based on visible light communication: a performance-based survey of real-world prototypes. ACM Comput. Surveys 52, 1–36. doi: 10.1145/3299769
Armstrong, J., and Lowery, A. J. (2006). Power efficient optical OFDM. Electron. Lett. 42, 370–372. doi: 10.1049/el:20063636
Bai, X., Huang, M., Prasad, N. R., and Mihovska, A. D. (2019). “A survey of image-based indoor localization using deep learning,” in Proceeding of WPMC 2019 (Lisbon), 1–6.
Bradski, G., and Kaehler, A. (2008). Learning OpenCV: Computer Vision With the OpenCV Library. Sebastopol, CA: O'Reilly Media, Inc.
Chen, Z., Zhu, G., Wang, S., Xu, Y., Xiong, J., Zhao, J., et al. (2021). M3: multipath assisted Wi-Fi localization with a single access point. IEEE Trans. Mobile Comput. 20, 588–602. doi: 10.1109/TMC.2019.2950315
Cillis, F. D., Faramondi, L., Inderst, F., Marsella, S., Marzoli, M., Pascucci, F., et al. (2020). Hybrid indoor positioning system for first responders. IEEE Trans. Syst. Man Cybern. Syst. 50, 468–479. doi: 10.1109/TSMC.2017.2772821
Davidson, P., and Piché, R. (2016). A survey of selected indoor positioning methods for smartphones. IEEE Commun. Surveys Tutorials 19, 1347–1370. doi: 10.1109/COMST.2016.2637663
De-La-Llana-Calvo, A., Lázaro-Galilea, J. L., Gardel-Vicente, A., Rodríguez-Navarro, D., Bravo-Mu noz, I., Tsirigotis, G., et al. (2017). Modeling infrared signal reflections to characterize indoor multipath propagation. Sensors 17, 847. doi: 10.3390/s17040847
Duh, P.-J., Sung, Y.-C., Chiang, L.-Y. F., Chang, Y.-J., and Chen, K.-W. (2021). V-Eye: a vision-based navigation system for the visually impaired. IEEE Trans. Multimedia 23, 1567–1580. doi: 10.1109/TMM.2020.3001500
Engel, J., Schöps, T., and Cremers, D. (2014). “LSD-SLAM: large-scale direct monocular SLAM,” in Proceedings of ECCV 2014 (Zurich), 834–849.
Faragher, R., and Harle, R. (2015). Location fingerprinting with bluetooth low energy beacons. IEEE J. Select. Areas Commun. 33, 2418–2428. doi: 10.1109/JSAC.2015.2430281
Grosswindhager, B., Rath, M., Kulmer, J., Bakr, M. S., Boano, C. A., Witrisal, K., et al. (2018). “SALMA: UWB-based single-anchor localization system using multipath assistance,” in Proceedings of SenSys 2018 (Shenzhen), 132–144.
Hauschildt, D., and Kirchhof, N. (2010). “Advances in thermal infrared localization: challenges and solutions,” in Proceedings of IPIN 2010 (Zurich), 1–8.
IndustryArc (2017). Indoor Positioning and Navigation Market-Forecast (2021–2026). Available online at: https://www.industryarc.com/Report/43/global-indoor-positioning-navigation-market.html.
Jung, S.-Y., Hann, S., and Park, C.-S. (2011). TDOA-based optical wireless indoor localization using LED ceiling lamps. IEEE Trans. Consum. Electron. 57, 1592–1597. doi: 10.1109/TCE.2011.6131130
Kuo, Y.-S., Pannuto, P., Hsiao, K.-J., and Dutta, P. (2014). “Luxapose: Indoor positioning with mobile phones and visible light,” in Proceedings of MobiCom 2014 (Maui, HI), 447–458.
Lausnay, S. D., Strycker, L. D., Goemaere, J.-P., Nauwelaers, B., and Stevens, N. (2016). “A survey on multiple access visible light positioning,” in Proceedings of EmergiTech 2016 (Moka), 38–42.
Li, L., Hu, P., Peng, C., Shen, G., and Zhao, F. (2014). “Epsilon: a visible light based positioning system,” in Proceeings of NDSI 2014 (Seattle, WA), 331–343.
Li, L., Xie, P., and Wang, J. (2018). “Rainbowlight: towards low cost ambient light positioning with mobile phones,” in Proceedings of MobiCom 2018 (New Delhi), 445–457.
Liang, C.-K., Chang, L.-W., and Chen, H. H. (2008). Analysis and compensation of rolling shutter effect. IEEE Trans. Image Process. 17, 1323–1330. doi: 10.1109/TIP.2008.925384
Mautz, R., and Tilch, S. (2011). “Survey of optical indoor positioning systems,” in Proceedings of IPIN 2011 (Guimar aes), 1–7.
Meneguzzi, F., Kannan, B., Sycara, K., Gnegy, C., Yordanov, P., and Dias, B. (2013). “Predictive indoor navigation using commercial smart-phones,” in Proceedings of SAC 2013 (Coimbra).
Ministry of Land Infrastructure T. Tourism (2018). Indoor High-precise Positioning Project. Available online at: https://www.mlit.go.jp/common/001111217.pdf.
Murakami, H., Nakamura, M., Hashizume, H., and Sugimoto, M. (2021). Five degrees-of-freedom pose-estimation method for smartphones using a single acoustic anchor. IEEE Sens. J. 21, 8030–8044. doi: 10.1109/JSEN.2020.3047854
Nakazawa, Y., Makino, H., Nishimori, K., Wakatsuki, D., Kobayashi, M., and Komagata, H. (2017). Precise indoor localization method using dual-facing cameras on a smart device via visible light communication. IEICE Trans. Fundament. Electron. Commun. Comput. Sci. 100, 2295–2303. doi: 10.1587/transfun.E100.A.2295
Rahman, M. S., Haque, M. M., and Kim, K.-D. (2011). Indoor positioning by LED visible light communication and image sensors. Int. J. Electr. Comput. Eng. 1, 161. doi: 10.11591/ijece.v1i2.165
Rajagopal, N., Lazik, P., and Rowe, A. (2014). “Visual light landmarks for mobile devices,” in Proceedings of ISPN 2014 (Berlin), 249–260.
Reinhard, E., Heidrich, W., Debevec, P., Pattanaik, S., Ward, G., and Myszkowski, K. (2010). High Dynamic Range Imaging, Second Edition: Acquisition, Display, and Image-Based Lighting (Burlington, MA: Morgan Kaufmann).
Shimada, S., Akiyama, T., Hashizume, H., and Sugimoto, M. (2017). “OFDM visible light communication using off-the-shelf video camera,” in Proceedings of MobiSys 2017 (Delft).
Shimada, S., Hashizume, H., and Sugimoto, M. (2018). “Indoor positioning using reflected light and a video camera,” in Proceedings of IPIN 2018 (Nantes), 1–8.
Shimada, S., Hashizume, H., and Sugimoto, M. (2020). “RefRec: indoor positioning using a camera recording floor reflections of lights,” in Proceedings of UBICOMM 2020 (Nice), 55–63.
Sony Group Corporation (2021). Sony Develops the Industry's First 3-Layer Stacked CMOS Image Sensor with DRAM for Smartphones. Available online at: https://www.sony.com/en/SonyInfo/News/Press/201702/17-013E/.
Steendam, H., Wang, T. Q., and Armstrong, J. (2017). Theoretical lower bound for indoor visible light positioning using received signal strength measurements and an aperture-based receiver. J. Lightwave Technol. 35, 309–319. doi: 10.1109/JLT.2016.2645603
Sugimoto, M., Kumaki, H., Akiyama, T., and Hashizume, H. (2017). Optimally modulated illumination for rapid and accurate time synchronization. IEEE Trans. Signal Process. 65, 505–516. doi: 10.1109/TSP.2016.2612176
Sun, B., Ma, Q., Cao, Z., and Liu, Y. (2019). “iTracker: towards sustained self-tracking in dynamic feature environment with smartphones,” in Proceedings of SECON 2019 (Boston, MA), 1–9.
Wang, T. Q., Sekercioglu, Y. A., Neild, A., and Armstrong, J. (2013). Position accuracy of time-of-arrival based ranging using visible light with application in indoor localization systems. J. Lightwave Technol. 31, 3302–3308. doi: 10.1109/JLT.2013.2281592
Yamashita, Y., Shimada, S., Watanabe, H., Hashizume, H., and Sugimoto, M. (2021). “A localization method using reflected luminance distribution,” in Proceedings of MobiQuitous 2021 (Beppu), 390–405.
Yang, F., Li, S., Zhang, H., Niu, Y., Cheng, Q., and Zhe, Y. (2019). Visible light positioning via floor reflections. IEEE Access 7, 97390–97400. doi: 10.1109/ACCESS.2019.2929160
Yang, L., Wang, Z., Wang, W., and Zhang, Q. (2018). NALoc: nonlinear ambient-light-sensor-based localization system. Interact. Mobile Wearable Ubiquit. Technol. 2, 1–22. doi: 10.1145/3287077
Yang, S.-H., Kim, H.-S., Son, Y.-H., and Han, S.-K. (2014). Three-dimensional visible light indoor localization using AOA and RSS with multiple optical receivers. J. Lightwave Technol. 32, 2480–2485. doi: 10.1109/JLT.2014.2327623
Yang Zhice Wang, Z., Zhang, J., Huang, C., and Zhang, Q. (2015). “Wearables can afford: light-weight indoor positioning with visible light,” in Proceedings of MobiSys 2015 (Florence), 317–330.
Yoshino, M., Haruyama, S., and Nakagawa, M. (2008). “High-accuracy positioning system using visible LED lights and image sensor,” in Proceedings of RWS 2008 (Orlando, FL), 439–442.
Zhang, C., and Zhang, X. (2017). “Pulsar: towards ubiquitous visible light localization,” in Proceedings of MobiCom 2017 (Snowbird, UT), 208–221.
Zhang, H., and Yang, F. (2020). Push the limit of light-to-camera communication. IEEE Access 8, 55969–55979. doi: 10.1109/ACCESS.2020.2982209
Zhang, Z.. (2000). A flexible new technique for camera calibration. IEEE Trans. Pattern Anal. Mach. Intell. 22, 1330–1334. doi: 10.1109/34.888718
Zhu, S., and Zhang, X. (2017). “Enabling high-precision visible light localization in today's buildings,” in Proceedings of MobiSys 2017 (Niagara Falls, NY), 96–108.
Keywords: indoor localization, visible light positioning, smartphone, 6DoF estimation, received signal strength
Citation: Sugimoto M, Shimada S and Hashizume H (2022) RefRec+: Six Degree-of-Freedom Estimation for Smartphone Using Floor Reflecting Light. Front. Comput. Sci. 4:856942. doi: 10.3389/fcomp.2022.856942
Received: 17 January 2022; Accepted: 30 March 2022;
Published: 16 May 2022.
Edited by:
Joaquín Torres-Sospedra, University of Minho, PortugalReviewed by:
Philipp Marcel Scholl, University of Freiburg, GermanyJosè Luis Lázaro-Galilea, University of Alcalá, Spain
Copyright © 2022 Sugimoto, Shimada and Hashizume. This is an open-access article distributed under the terms of the Creative Commons Attribution License (CC BY). The use, distribution or reproduction in other forums is permitted, provided the original author(s) and the copyright owner(s) are credited and that the original publication in this journal is cited, in accordance with accepted academic practice. No use, distribution or reproduction is permitted which does not comply with these terms.
*Correspondence: Masanori Sugimoto, sugi@ist.hokudai.ac.jp