Bison and elk spatiotemporal interactions in Elk Island National Park
 Jennifer M. Foca
 Mark S. Boyce
- Department of Biological Sciences, University of Alberta, Edmonton, Alberta T6G 2E9, Canada
Elk Island National Park (EINP) is a fenced park in the Beaver Hills UNESCO Biosphere Reserve of central Alberta where aspen parkland is being conserved. This area maintains high densities of native ungulates including elk (Cervus elaphus), bison (Bison bison bison, B. bison athabascae), moose (Alces alces), white-tailed deer (Odocoileus virginianus), and mule deer (O. hemionus). Our objective was to evaluate spatiotemporal overlap and interspecific interactions between bison and elk in EINP using camera traps. Bison and elk have overlapping habitat use and diet and are the primary focus of ungulate management in EINP. We examined distributions of both species in relation to season, landscape characteristics, anthropogenic features, and heterospecifics using generalized linear models (GLMs). We then examined seasonal daily activity patterns of bison and elk and calculated the degree of overlap. The spatial analysis revealed that bison counts were positively associated with higher proportions of open habitats across seasons and in areas farther from water in summer and fall but had no associations with distance to water during winter. Bison removal year (years during which bison removals were conducted by Parks Canada) was a significant predictor variable for bison counts in winter when the bison roundup takes place. Elk avoided areas with high linear feature density across seasons. During fall and winter, we observed higher elk counts associated with bison presence. Temporal activity patterns revealed that elk were crepuscular in all three seasons, but bison activity patterns varied with diurnal activity being more common in the summer, crepuscular activity in winter, and intermediate activity patterns during fall. Coefficients of overlap between elk and bison were high in all three seasons with the greatest difference in daily activity patterns in summer and the highest overlap in winter when both species showed strong crepuscular activity. Despite the fenced perimeter in EINP resulting in high ungulate densities, limited dispersal, and low predation, our data show patterns of habitat use and interactions between bison and elk that were similar to those in other systems. Spatiotemporal partitioning does not appear necessary for coexistence of bison and elk in the aspen parkland.
Introduction
Interspecific interactions and species-habitat interactions are primary drivers in shaping distributions of wildlife populations across variable landscapes (Danielson, 1991; Dunning et al., 1992). The availability and configuration of resources as well as assemblages of species present influence habitat selection and the types of interactions that occur (Sinclair and Norton-Griffiths, 1982; Sinclair, 1985; Wydeven and Dahlgren, 1985; Murray and Illius, 2000; Arsenault and Owen-Smith, 2002; Van Beest et al., 2014). Many factors influence interspecific interactions, including the species assemblage in question, population densities, predation, and the composition and structure of vegetation (Danielson, 1991; Dunning et al., 1992; Turner, 2005; Van Beest et al., 2014). Ecosystems that are more heterogenous are able to support higher species diversity and higher densities (Dunning et al., 1992).
The aspen parkland is a highly heterogenous ecosystem characterized by a patchy mosaic of habitat types capable of supporting diverse ungulate assemblages (Bird, 1961; Riley et al., 2007). The aspen parkland ecosystem is an ecotone that occurs between boreal forest and prairie ecosystems, with interspersed deciduous forests, grasslands, and wetlands (Riley et al., 2007). The diversity of vegetation types is maintained by climate conditions and various types of natural disturbances, including the impacts of ungulate grazing and foraging. During wet years, aspen and wetlands can overtake grasslands, whereas grasslands prevail under drought conditions, fire, and heavy grazing (Bird, 1961; Riley et al., 2007). Native ungulates are an integral part of the aspen parkland ecosystem and play a role in maintaining heterogeneity (Hobbs, 1996) by inhibiting aspen growth and maintaining grasslands (Campbell et al., 1994; Bork et al., 1997; Riley et al., 2007). In Canada, aspen parkland is one of the most highly exploited ecosystems, as much has been cleared and converted to agricultural lands due to its rich soils, leaving less than 34% of natural cover remaining (Young et al., 2006; Riley et al., 2007; Ferrer-Paris et al., 2019). Other threats to this ecosystem include fire suppression and decreased grazing by wild herbivores.
Elk Island National Park (EINP) is a fully fenced park in central Alberta and is one of few areas in Canada where aspen parkland is being conserved with a diverse assemblage of native ungulates. The park maintains high densities of native ungulates including elk (Cervus elaphus), plains bison (Bison bison bison), wood bison (B. bison athabascae), moose (Alces alces), white-tailed deer (Odocoileus virginianus), and mule deer (O. hemionus). Because of intensive agriculture in the aspen parkland, the perimeter of EINP is fenced, containing all native ungulates within the park to prevent conflicts with farmers. While fencing can be a useful tool to separate wildlife from conservation threats and reduce agricultural losses, fencing can also introduce challenges for wildlife managers (Van Aarde et al., 1999; Somers and Hayward, 2012). For example, due to the fenced perimeter and the partial isolation of the park within an agricultural matrix, EINP does not have many predators and predation does not substantially influence ungulate populations. The limited dispersal of ungulates, minimal predation, and highly productive aspen parkland ecosystem all contribute to high ungulate densities in EINP (Blyth, 1995; Kuzyk et al., 2009; Parks Canada, 2017). In the past, ungulate management goals in EINP included maximizing wildlife viewing opportunities with a focus on recreation (Blyth and Hudson, 1992; Kuzyk et al., 2009), but since 1999 a reduction strategy for bison and elk was implemented and current management places greater focus on managing for ecological integrity (Parks Canada, 2010; Parks Canada, 2017). The fenced perimeter of the park is semipermeable to deer, and as a result population growth rates in EINP reflect regional demographic changes (Blyth, 1995). Thus, deer have not been a primary focus of ungulate management. Similarly, the moose population in EINP has not been a management focus because moose populations appear to be limited by other mechanisms, namely parasites such as liver flukes and winter ticks (Blyth, 1995; Haigh et al., 2002; Samuel, 2004, 2007; Shury et al., 2019). Parasites have the potential to reduce ungulate populations and might be exacerbated by climate change and agricultural intensification in the aspen parkland (Patz et al., 2000; Kutz et al., 2005; O’Connor et al., 2006; Hoberg et al., 2008; Van Dijk et al., 2010); thus far only moose numbers appear to be reduced by parasites in EINP. Bison and elk have been the focus of management actions by the Park (i.e., culls, translocations), to prevent hyperabundance (McShea et al., 1997; Bradford and Hobbs, 2008; Parks Canada, 2017). Currently, Parks Canada has placed emphasis on grassland health and aims to increase the proportion of grassland in EINP (Parks Canada, 2010). Grasslands are used by both bison and elk and might be a limiting resource for these species in EINP (Cairns and Telfer, 1980).
Studies investigating ungulate effects on plant communities and ecosystem health have been a major focus in EINP. Examples include the characterization of forest plant communities in response to disturbance regimes, including herbivory (Bork et al., 1997), an investigation of effects of ungulate herbivory on beaked hazelnut (Best et al., 2003), and an evaluation of the use of rough fescue as an indicator species for ungulate herbivory and ecological integrity (Best and Bork, 2003). Hood and Bayley (2008) used an interspecific approach to assess effects of ungulate herbivory on woody plants, particularly species considered preferred forage for beavers (Castor canadensis), to assess ungulate-beaver interactions. Attempts have been made to estimate ungulate carrying capacities in EINP (Blyth, 1995; Kuzyk et al., 2009), though estimates of carrying capacity remain contentious due to challenges associated with estimating carrying capacity for entire guilds. In EINP, ungulate interguild dynamics and spatial patterns must be considered to understand the effects of ungulates on the ecosystem. For example, if bison are dominant over elk (Holsworth, 1960) and can displace elk, this might result in spatial segregation between bison and elk and less available area for elk (Arsenault and Owen-Smith, 2002). In a scenario where elk are displaced by bison and have less access to grasslands, elk have the flexibility to use a variety of food sources (Cook, 2002). Conversely high spatial overlap has potential for negative effects to rangelands because both bison and elk select grasslands (Telfer and Cairns, 1979; Cairns and Telfer, 1980).
In this study, we used camera traps to examine the spatiotemporal patterns and interactions between elk and bison in EINP. We evaluated spatiotemporal patterns and interspecific interactions in three different biologically determined seasons: summer, fall and winter. Our first objective was to determine the relationship between bison and elk distributions and landscape characteristics, anthropogenic features, heterospecifics (i.e., bison/elk). We hypothesized that bison and elk would have high spatial overlap during seasons with high habitat selection overlap because high densities of ungulates competing for resources can impede partitioning and cause more even use of available habitats (Van Beest et al., 2014). We predicted a positive association between bison and elk use during winter due to higher overlap in habitats used (Telfer and Cairns, 1979), despite bison and elk consuming different types of forage in winter. We considered anthropogenic features in addition to landscape characteristics and heterospecifics because humans have the potential to influence ungulate space use and patterns of overlap (Webb et al., 2011a; Ciuti et al., 2012). Our second objective was to determine if bison and elk partition time by comparing their daily activity patterns. We predicted that bison and elk would have different daily activity patterns because bison are diurnal (McMillan et al., 2021) and elk are largely crepuscular (Green and Bear, 1990; Boyce et al., 2010). We also predicted that elk and bison would have higher temporal overlap in winter due to shorter day lengths. This study allows us to gain unique insight into how diverse ungulate assemblages coexist in the aspen parkland ecosystem under conditions of high ungulate density and limited dispersal due to the fenced park perimeter.
Materials and methods
Study area
This study took place in Elk Island National Park (EINP), a fully fenced park located in the Beaver Hills UNESCO Biosphere Reserve of central Alberta, Canada on Treaty 6 territory (Figure 1). EINP is transected by Highway 16, dividing the park into northern (EINP-N; 134 km2) and southern (EINP-S; 60 km2) areas of the park. EINP-N and EINP-S are surrounded by a 2.2m perimeter fence, restricting movement of large mammals in and out of the park. EINP is a representative of the Southern Boreal Plains and Plateaux Natural Region and features glacial moraine topography with a patchwork of lakes and wetlands scattered throughout aspen parkland. Trembling aspen (Populus tremuloides) is the dominant tree species, and deciduous forests cover over 60% of the park with some pockets of dispersed conifers (Picea mariana and P. glauca). Much of the forest understory is covered in beaked hazel (Corylus cornuta), as well as other woody shrubs such as prickly rose (Rosa acicularis). Open water and vegetated wetlands make up 33% of the park (Hood and Bayley, 2008). Many of the lakes and ponds are surrounded by rings of open habitat, including grasslands and shrubland. The grasslands in EINP include a wide variety of grasses and forbs. Shrublands include many of the same species found in forested areas, and also include aspen and poplar regeneration (Cairns and Telfer, 1980). Habitat assemblages are very similar in EINP-N and EINP-S, however human use differs. EINP-N has more infrastructure, more linear features (paved roads and hiking trails), and higher human visitation rates than EINP-S.
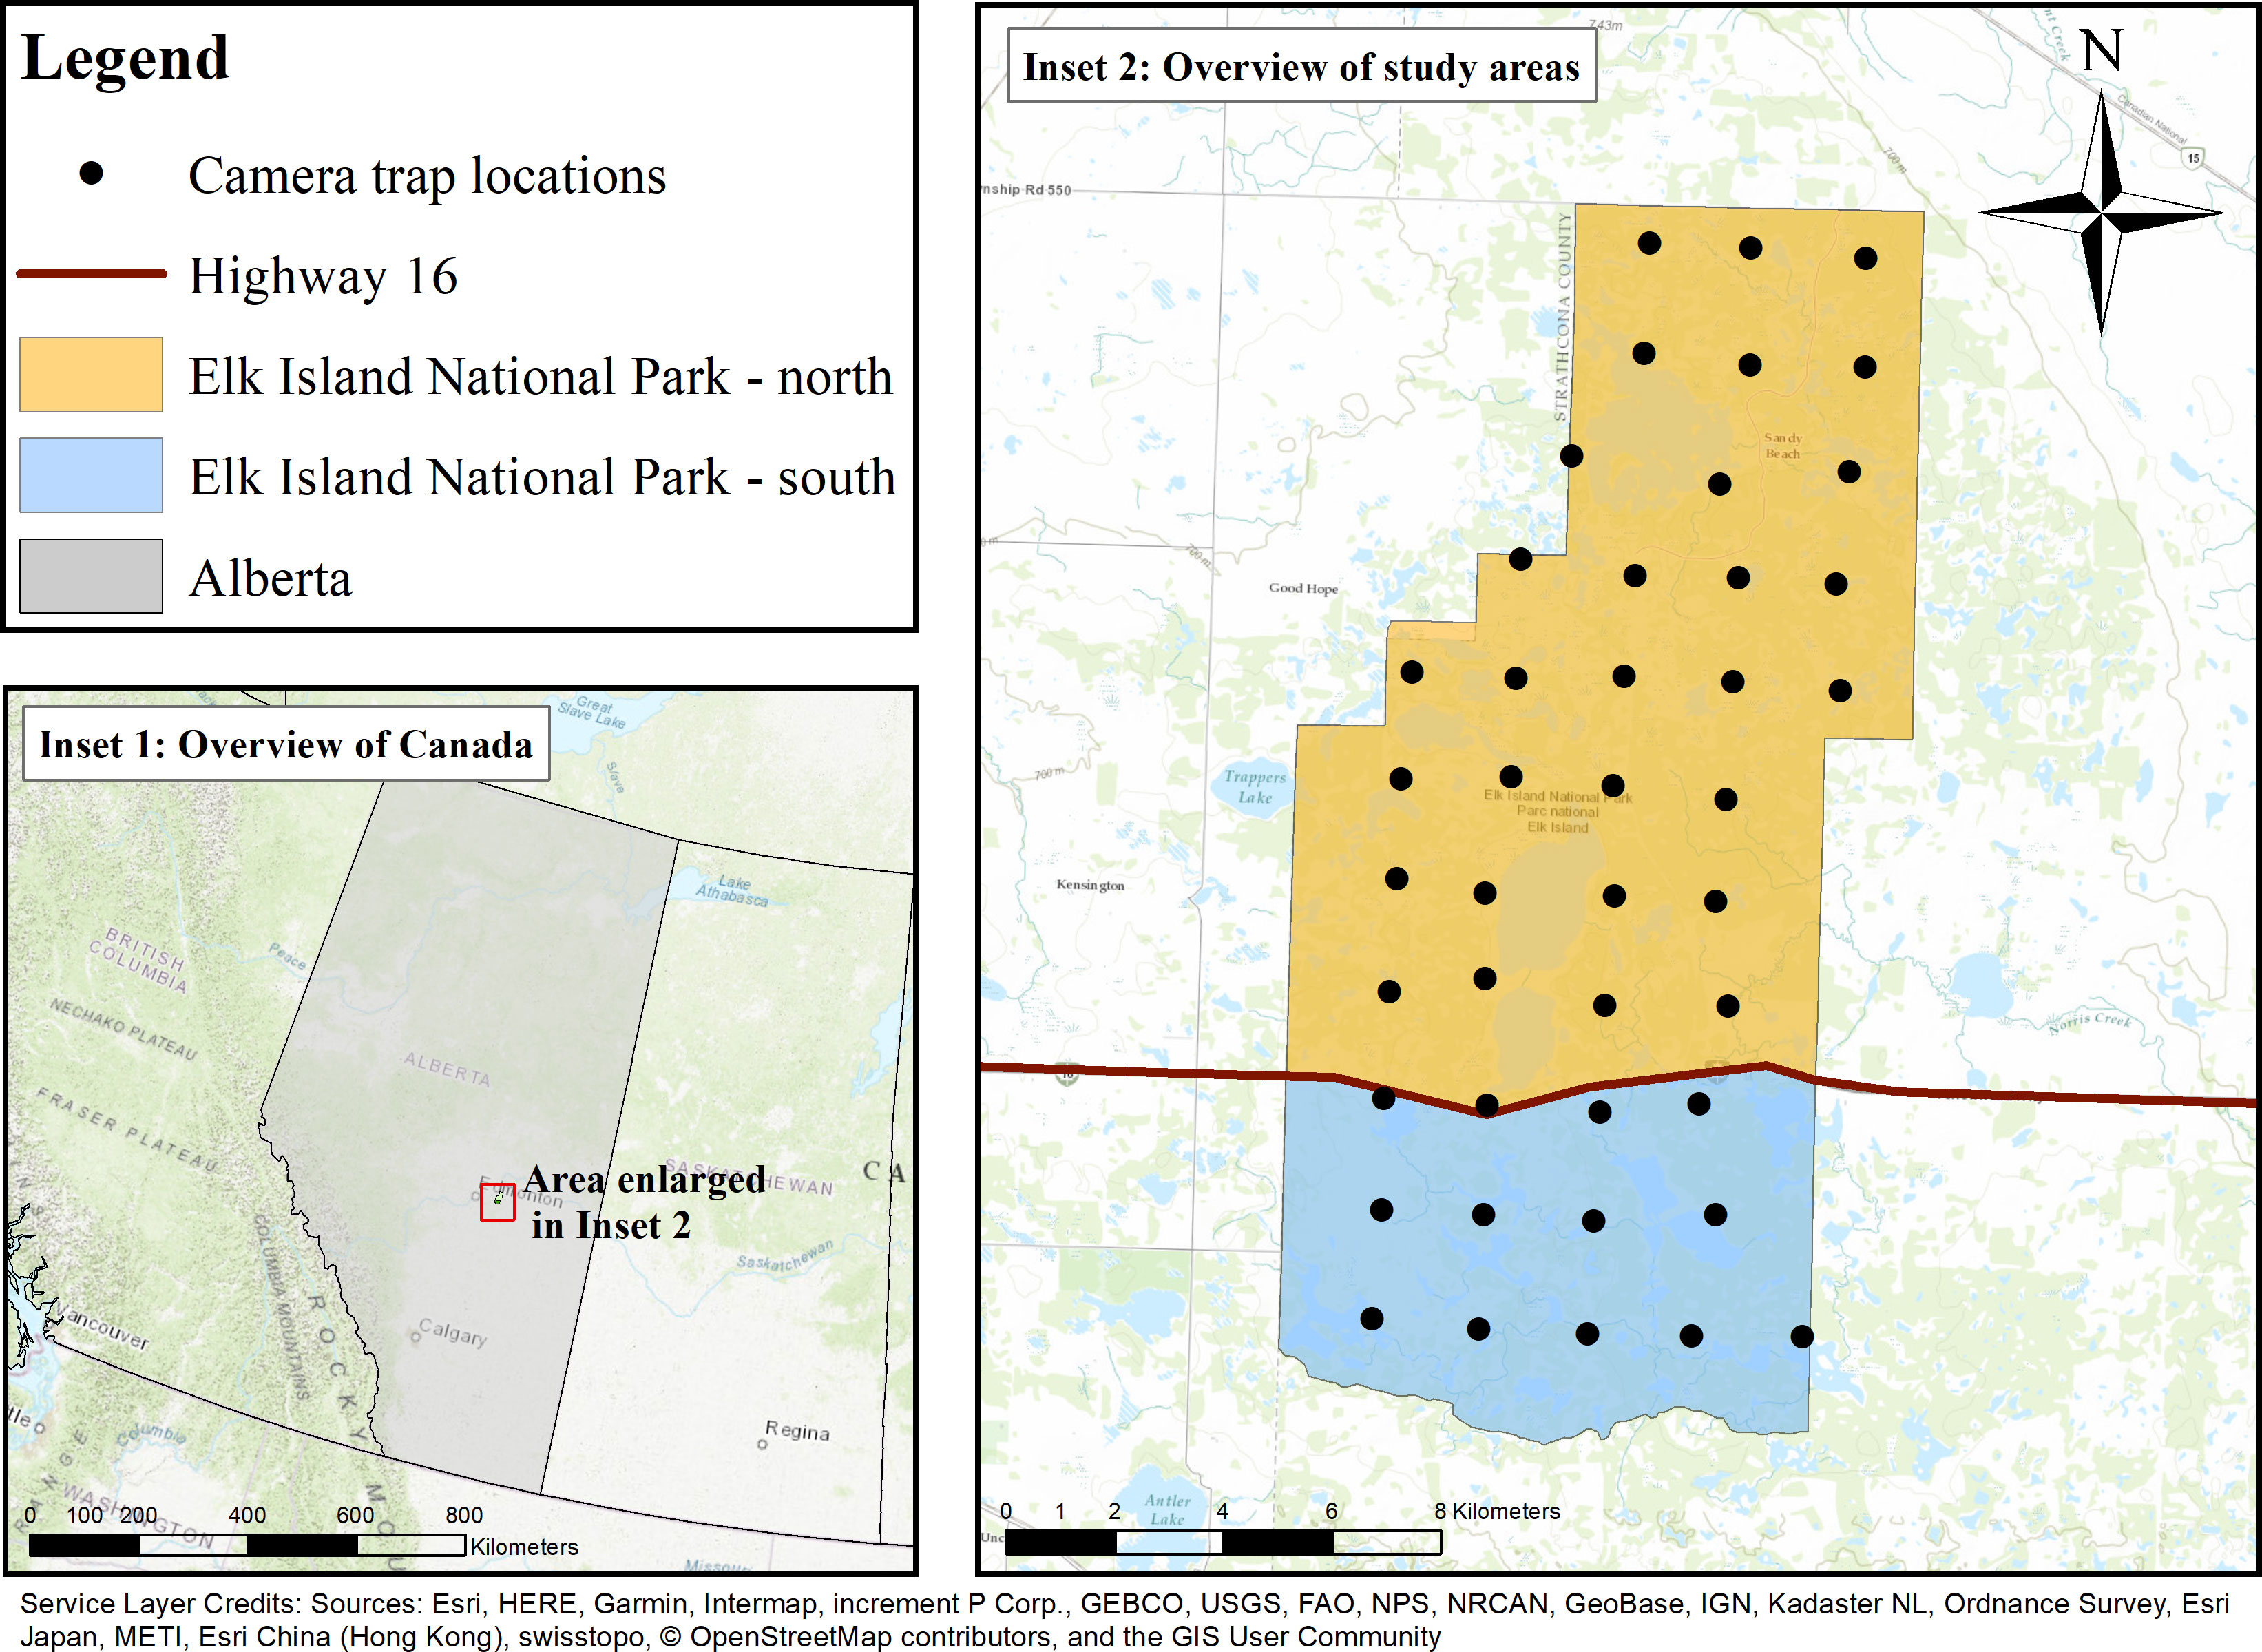
Figure 1 Camera trap survey in Elk Island National Park, Alberta, Canada. Cameras were deployed on a 2×2km2 systematic grid, shown by black points. Elk Island National Park is bisected by Highway 16, shown by the red line. Both northern and southern portions of Elk Island National Park are surrounded by a 2.2m high perimeter fence, which restricts ungulate movement.
EINP hosts a high density of ungulates including bison, elk, moose, mule deer, and white-tailed deer. Plains bison (Bison bison bison) are present in EINP-N and wood bison (B. bison athabascae) are present in EINP-S. Bison densities during this study were high with 4-5 bison/km2 in EINP-N and 7 bison/km2 in EINP-S based on aerial survey data (Foca, 2021). Currently, bison populations are actively managed to prevent hyperabundance (Parks Canada, 2017). Plains bison and wood bison populations are reduced every other year, alternating between the two subspecies (Appendix A). Bison reduction currently involves removing animals from the park and translocating them to other areas in collaboration with bison reintroduction efforts elsewhere. Elk density is high in EINP, with 3-4 elk/km2 based on aerial survey data (Foca, 2021). While elk translocations have happened in the past, they are no longer allowed due to the risk of spreading chronic wasting disease (Parks Canada, 2017) and elk have not been removed from the park during this study. Moose numbers in EINP-N are extremely low due to liver flukes and winter ticks (Samuel, 2007; Samuel, 2004; Shury et al., 2019), but moose density is high in EINP-S with 3-4 moose/km2 based on aerial survey data (Foca, 2021). Deer have not been the focus of management efforts because the fenced perimeter is semipermeable to them, and deer are difficult to survey aerially. Predators in EINP include black bears, resident coyotes, and the occasional wolf; none of which are thought to have a limiting effect on ungulate populations in the Park. Wolf numbers are low in EINP based on park staff observations and camera detections. Over the course of this four-year camera trapping program, no wolves were detected in EINP-N, and on average there were only six wolf detections per year in EINP-S. The fenced perimeter, lack of predation pressure, and high ungulate densities are important considerations for evaluating interspecific interactions in EINP.
Camera trapping
Camera traps were deployed in EINP on a 2x2km2 systematic grid with 31 cameras deployed in EINP-N and 12 cameras deployed in EINP-S (Figure 1). Camera trap data collection took place between December 2016 and October 2020. Camera models included Reconyx Hyperfire H500, P800, and P900. If the camera location fell within an open area, the location was moved to the nearest tree. Camera traps were affixed to trees 1m off the ground. They were placed facing game trails or other open areas with an unobstructed view so that ungulate detections would be possible and were placed facing northward to prevent glare. Camera locations near hiking trails were moved at least 100m away from the trail due to privacy concerns. Cameras were programmed to take pictures 24 hours a day with 3 rapidfire pictures (up to 2 frames per second) per motion trigger. We serviced cameras at least twice per year and cleared vegetation to maintain the open field of view. Images were stored and tagged in WildTrax (WildTrax, 2019). We tagged photos by species, age class, sex class, and number of animals per photo.
Analytical approach
To study bison and elk interspecific interactions, we analyzed camera trap data examining both spatial and temporal variation across three seasons: summer, fall, and winter. We defined summer as April 1 to August 31, which includes bison calving (begins in late April and peaks in May), elk calving (May/June), green up (occurs in May), calf rearing for both species, and the bison rut (June-August). We defined fall as September 1 to November 30, which includes most of the elk rut (peak in September) and leaf fall for deciduous plants. Winter spans December 1 to March 31 of the following year and is characterized by sub-freezing temperatures and snow cover. For both spatial and temporal seasonal analyses, we included data from all years because conditions in EINP, such as vegetation conditions and winter severity, were similar across all years surveyed. Camera data from EINP-N and EINP-S were analyzed together because habitats are similar in both areas, elk and bison densities are similar in EINP-N and EINP-S, and because modeling the two areas separately would have reduced our sample size.
For the spatial analysis we used generalized linear models (GLMs) to examine the relationship between bison/elk counts and camera-site characteristics, including variables for habitat, anthropogenic features, and site use by heterospecifics (see Spatial Analysis section below for model specifications). Our analysis allowed examination of relationships among species and landscape covariates, but not causality. Spatial overlap, or lack thereof, is not sufficient to infer mechanisms, such as competition or facilitation (Arsenault and Owen-Smith, 2002). For our temporal analysis we examined bison and elk daily activity patterns using circular kernel density functions to determine if they were partitioning time instead of space (see Daily Activity Pattern section below). For both analyses, we defined independent photo events based on a 120 second gap between photo sequences. Each independent photo event has an associated date, time, and species count, with species count including all age and sex classes of the same species. Species counts were summarized by camera, season, and year to create the response variables used in GLMs.
Landscape covariates
For the spatial analysis, we reviewed a suite of landscape covariates that could influence bison and elk distributions (Table 1). For landscape covariates, we included distance to water, proportion of open habitat, and forest edge density. We included distance to water because EINP is characterized by a glacial moraine landscape, which includes pockets of different habitats surrounding water bodies dispersed throughout aspen forest (Hood and Bayley, 2009). We also included a squared term for distance to water in case intermediate distances to water were used more heavily. For proportion of open habitat we included grassland and shrubland, two ecosystem types known to be important to bison and elk in EINP (Telfer and Cairns, 1979; Cairns and Telfer, 1980; Cook, 2002; COSEWIC, 2013). We calculated the proportion of open habitats within a 90×90m window at each camera trap location. This window size was chosen because it most closely reflects the vegetation at the site in which the animals were sampled, as opposed to a larger buffer that might encompass habitat types not used by the animals. We included forest edge density (m/km2) within a 500m radius buffer of each camera trap location, with edges defined as the interface between forested and unforested habitats. This covariate was selected because bison and elk have been documented to use edge habitats in EINP (Telfer and Cairns, 1979; Cairns and Telfer, 1980) and elk are known to use edge areas between forest and unforested interfaces (Skovlin et al., 2002). A larger buffer was required for this variable compared to the buffer used for habitat type in order to capture the variation in edge density between camera locations. The buffer size for forest edge density was determined by using univariate negative binomial GLMs fit to species counts and selecting the covariate with the lowest AICc (Burnham et al., 2011). Three buffer sizes were compared for edge density, including 100m, 250m, and 500m radius buffers, and the three univariate models were compared against a null model.
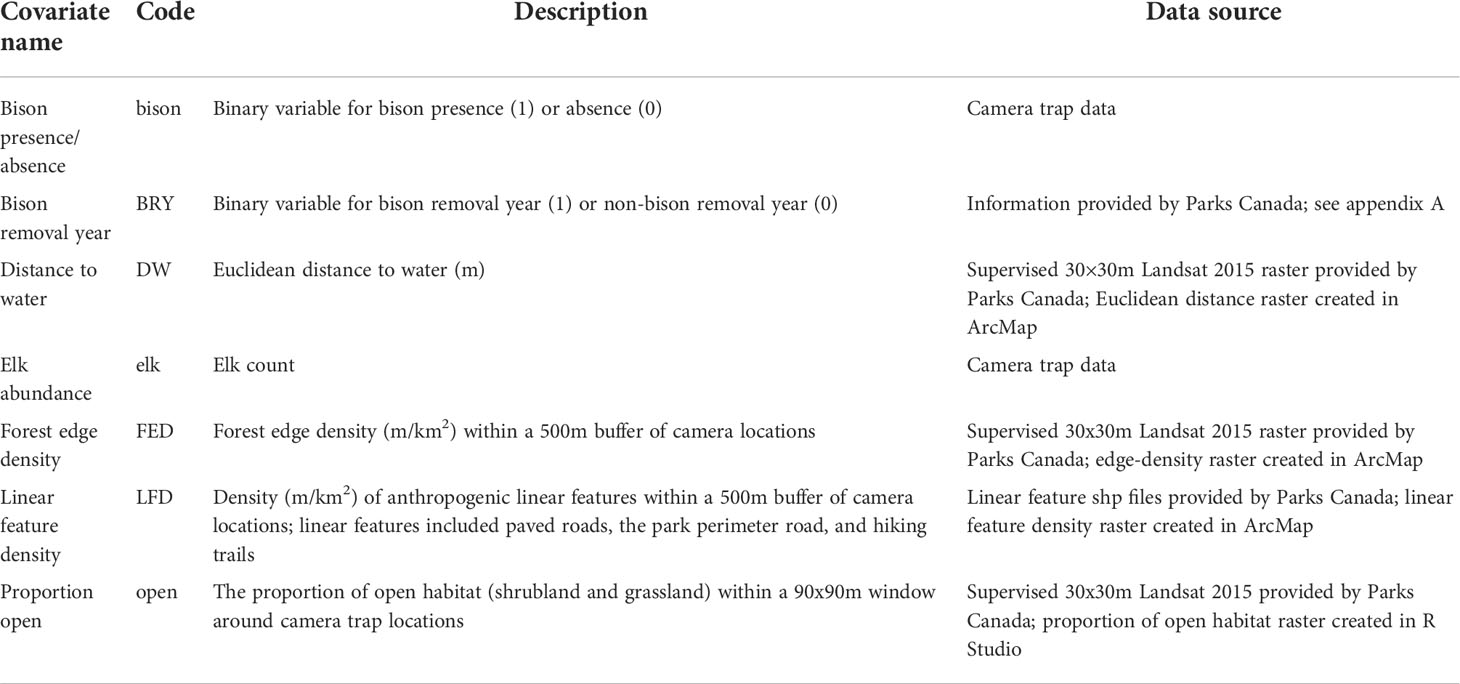
Table 1 Descriptions of covariates used in bison and elk generalized linear models.
For anthropogenic features, we included a covariate for linear feature density (m/km2) within a 500m radius buffer of each camera trap location. Linear features included paved roads, the park perimeter road, and hiking trails, and buffer size was determined by ranking univariate models. Due camera placement at least 100m away from trails and roads to address privacy concerns, the buffer size for linear feature density needed to be larger than the buffers considered for edge density. Univariate GLMs were used to compare linear feature density within a 200m radius buffer and a 500m radius buffer, and the univariate models were compared against a null model. The 500m radius buffer was selected based on the lowest AICc (Burnham et al., 2011). Elk are known to avoid linear features and other human disturbances (Prokopenko et al., 2017b; Webb et al., 2011b; Ferguson and Keith, 1982; Webb et al., 2011a; Prokopenko et al., 2017a). We expect that bison and elk would respond differently to linear feature density because bison in EINP are seemingly more tolerant of human use on roads and trails than elk.
We determined whether to use counts or presence/absence data for heterospecifics in the elk and bison models using univariate GLMs and selected the best-ranked covariate. In the bison GLMs, we used elk counts from camera trap data as the heterospecific model parameter. In the elk GLMs, we used bison presence/absence from camera trap data as the model parameter. We also included a parameter for bison removal year (Table 1, Appendix A) in some of the candidate models. Bison removal year was only present in an elk candidate model in conjunction with the parameter for bison presence/absence.
We assessed collinearity using a Pearson’s correlation matrix and had no highly correlated covariates (|r| > 0.6). All continuous variables were scaled and centered. See Table 1 for details on variable creation and data sources.
Spatial analysis
We used generalized linear models with a negative binomial distribution to investigate species counts relative to landscape variables, anthropogenic features, and heterospecifics. We created a priori candidate model sets for each target species with 14 candidate models for bison (Appendix B – Table B.1) and 19 candidate models for elk (Appendix B – Table B.2). Both sets of candidate models also included a null model, and we used the same candidate model sets for each season. Each model included an offset for log camera trap days to account for differences in the response variable related to sampling effort. We excluded cameras with less than 10 active camera days in a season. We visually examined response variable distributions for each season to identify outliers and improve model fit. A single outlier was removed for elk in fall of 2018. To account for repeated measures at a camera site due to pooling data across years, we included a random intercept for camera ID. We ranked models for each species and season using Akaike’s Information Criterion corrected for small sample sizes (AICc; Akaike, 1974; Burnham et al., 2011). We selected the most parsimonious model using a Δ AICc of 2. Top models with a Δ AICc less than 2 were considered competitive, and we chose the model with the lowest number of parameters as the best model. We considered beta coefficients to be informative if the 95% confidence intervals did not overlap 0 (Burnham et al., 2011). We calculated the proportion of deviance explained to assess model fit.
Daily activity patterns
To investigate bison and elk temporal overlap, we compared daily activity patterns for bison and elk in each season: summer (April-August), fall (September-November), and winter (December-March). Data were pooled across years and were pooled between EINP-N and EINP-S. For each season we converted time to radians and used the R package ‘overlap’ to fit kernel density functions with a von Mises distribution for circular data (Meredith and Ridout, 2020). Next, we calculated the coefficient of overlap (Δ = 0 means no overlap, Δ = 1 means complete overlap) between bison and elk for each season. For calculating this coefficient in package ‘overlap’, we selected the estimator Dhat4, which is recommended when the number of detections for both species are greater than 50, and we estimated 95% confidence intervals using a bootstrap method with 10,000 bootstrap samples (Meredith and Ridout, 2020).
Results
Camera trapping
Cameras were active for 43,076 camera trapping days across 43 sites. For summer, there were 19,764 camera trapping days, 5,790 elk detections and 3,064 bison detections. For fall there were 8,568 camera trapping days, 2,690 elk detections and 801 bison detections. In winter there were 14,744 camera trapping days, 2,407 elk detections and 1,094 bison detections. Elk were detected on all cameras in summer and winter, and 41 of 43 cameras in fall. Bison were detected on 35 out of 43 cameras in summer, 28 out of 43 cameras in fall, and 32 out of 43 cameras in winter.
Spatial analysis
For each season, we compared 14 candidate models and a null model for bison and 19 candidate models plus a null model for elk (Appendix B). Due to high sampling and measurement error, the proportion of deviance explained was low for each top model (0.01-0.04), however the contrast between top models and null models was substantial based on AICc.
In the bison GLMs, proportion of open habitat was a significant predictor in all top models across seasons and was positively associated with bison counts (Table 2, Figure 2, Appendix C). In summer and fall, the linear variable for distance to water was a significant predictor covariate and positively associated with bison, meaning bison counts were higher farther from water. Bison removal year was a significant predictor in winter and was inversely associated with bison counts. Linear feature density was absent from all bison top models. Elk count was present in some of the competing top models but not the final bison models selected for each season based on the lowest number of parameters. For models with elk counts as a parameter, elk were positively correlated with bison counts.
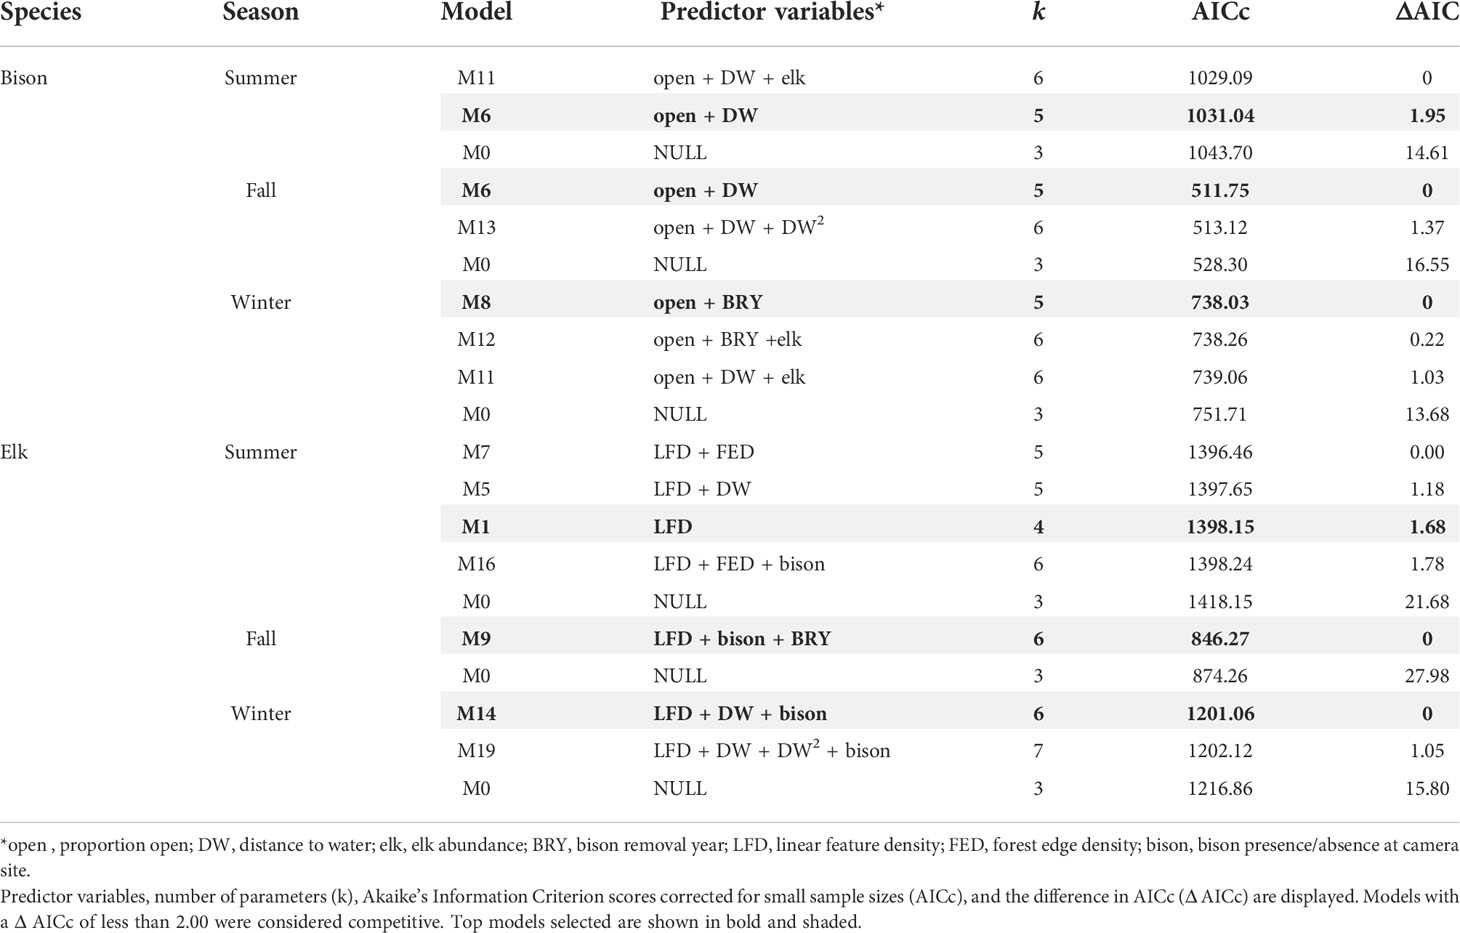
Table 2 Model selection table of the top-ranked models and null models for bison and elk in summer, fall, and winter.
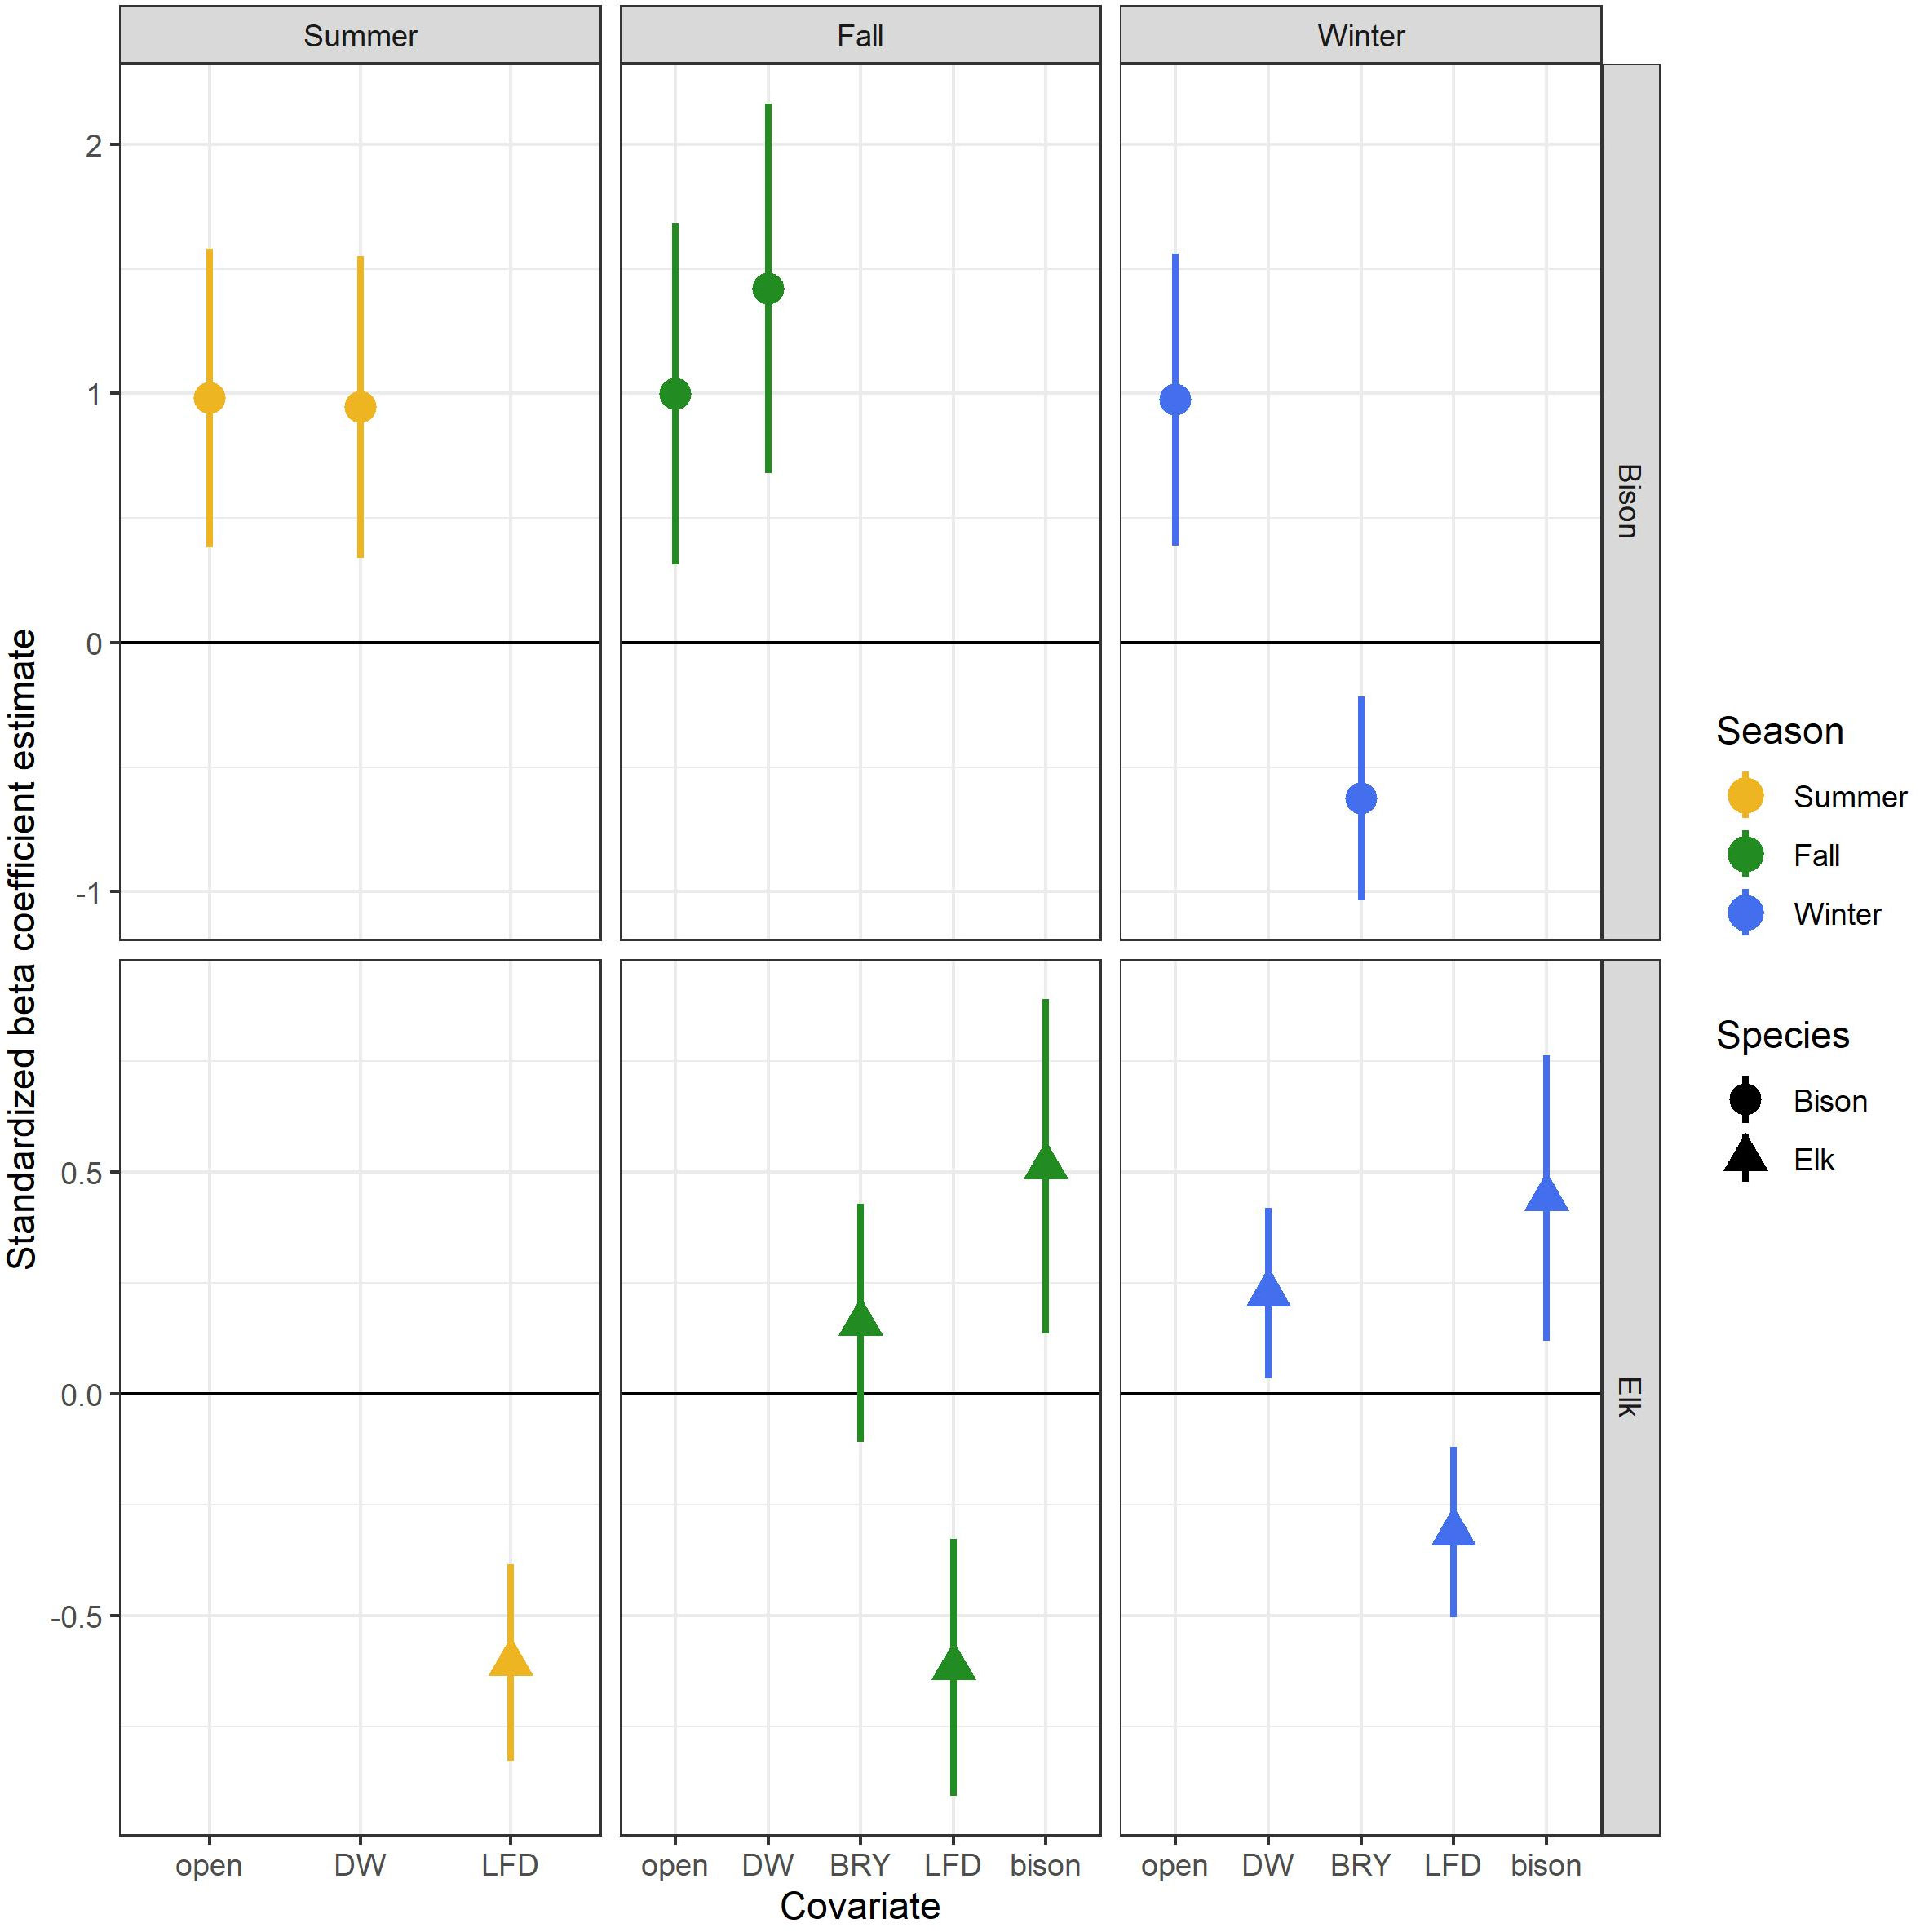
Figure 2 Scaled beta coefficient estimates from the top-ranked models for bison and elk space use during three seasons: summer (April-August), fall (September-November), and winter (December-March). Camera trap data were collected from 2016-2020 in Elk Island National Park in Alberta, Canada. Error bars represent 95% confidence intervals. Covariate descriptions are provided in Table 1.
For elk GLMs, linear feature density was a significant predictor covariate in all top models and was negatively associated with elk counts (Table 2, Figure 2, Appendix C). Bison removal year was present in the fall top model, though the beta coefficient for bison removal year was not significant (Appendix C) and the 95% confidence intervals overlapped 0. Bison presence/absence was a significant predictor variable in both fall and winter elk GLMs with bison presence positively associated with elk counts. The linear variable for distance to water was a significant predictor in the elk winter GLM, with distance to water being positively associated with elk counts (i.e., elk counts were higher farther from water).
Daily activity patterns
Bison and elk daily activity patterns overlapped substantially in all three seasons (Figure 3). Summer had the lowest coefficient of overlap (Δ4 = 0.74 [0.73-0.76]), fall had an intermediate coefficient of overlap (Δ4 = 0.76 [0.72-0.79]), and winter had the highest coefficient of overlap (Δ4 = 0.81 [0.78-0.84]). Elk activity patterns were clearly crepuscular across seasons. Bison were generally diurnal with higher peaks in activity near dawn and dusk, but as day length shortened in winter, the bison daily activity pattern mirrored that of elk with peaks near dawn and dusk and a decrease in activity midday (Figure 3).
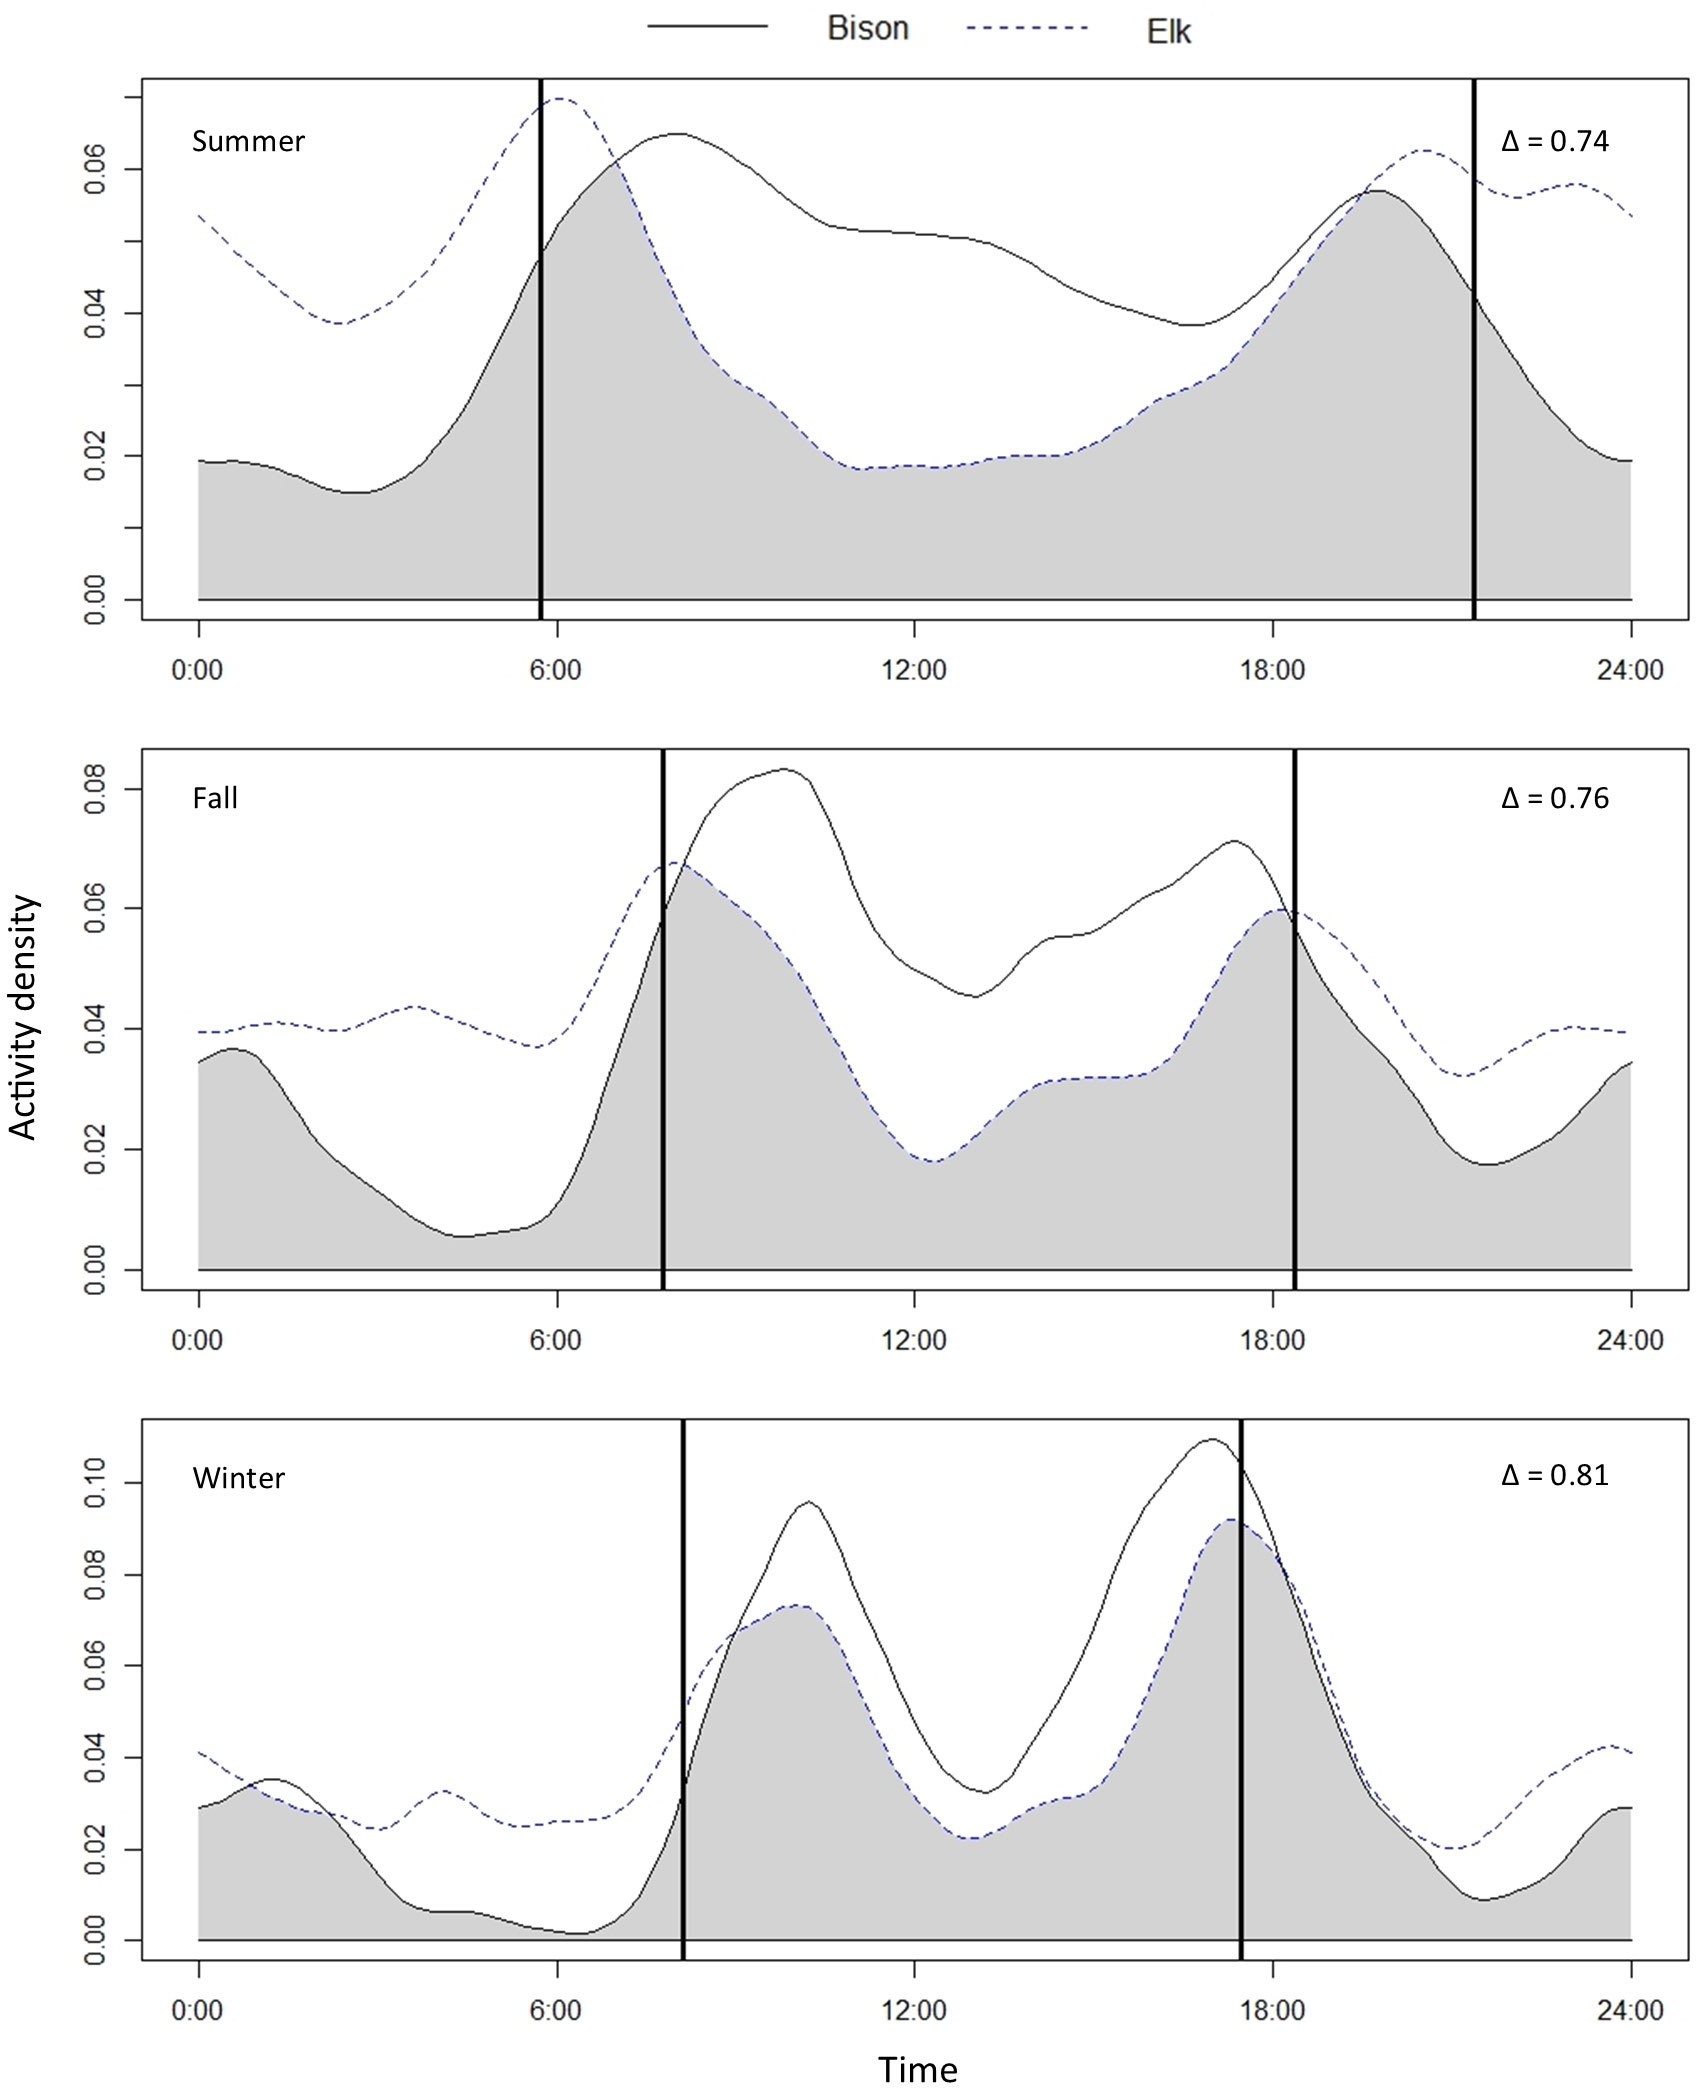
Figure 3 Activity patterns and coefficients of overlap of bison (Bison bison) and elk (Cervus elaphus) in summer (April-August), fall (September-November), and winter (December-March). Camera trap data were collected from 2016-2020 in Elk Island National Park in Alberta, Canada. The area of overlap is shaded in grey and Δ is the coefficient of overlap. The bold vertical lines show the time of sunrise and sunset based on seasonal averages.
Discussion
The aspen parkland ecosystem is able to support high ungulate densities that play a key role in maintaining the diversity of vegetation types (Bird, 1961; Riley et al., 2007). In this study, we had the unique opportunity to examine intraguild dynamics in a fully fenced protected area within the aspen parkland ecosystem. We examined bison and elk spatiotemporal patterns and interactions across three seasons in EINP. Bison counts were primarily related to habitat characteristics, whereas elk counts were influenced by anthropogenic features and bison presence. As expected, we found high spatial and temporal overlap between bison and elk in EINP, likely due in part to high ungulate densities impeding spatial partitioning (Van Beest et al., 2014). Bison were present on 65-81% of camera traps across seasons whereas elk were present on almost every camera (95-100%). Additionally, we saw high overlap of daily activity patterns across seasons with increasing overlap during winter.
In all three seasons, we found that higher bison counts were associated with open habitats (Table 2, Figure 2). This was expected because bison are grazers, with diets consisting of >90% graminoids and are therefore reliant on grasslands (COSEWIC, 2013; Kagima and Fairbanks, 2013). We also found bison were positively associated with increasing Euclidean distance to water during summer and fall. This is likely due to bison use of larger, dry grasslands in the park, which occur farther from water bodies, rather than the rings of open habitats surrounding water bodies. However, distance to water was not present in the winter model for bison counts. Because bison switch their diet to sedges in the winter when snow is deep, they are more likely to be found in sedge meadows near water bodies (Larter and Gates, 1991). The use of sedge meadows by bison has been documented in EINP (Telfer and Cairns, 1979; Cairns and Telfer, 1980), and bison used both upland grasslands and sedge meadows during winter.
The binary variable for bison removal year was a significant predictor in the bison winter model. This was expected because bison handling and removal occurs in winter (Appendix A). We observed a negative association between bison counts and bison removal year, meaning there were lower bison counts in EINP-N and EINP-S during their respective bison removal years. The parameter for linear feature density, which included paved roads, the park perimeter road, and hiking trails, was absent from all of the bison top models (Table 2). This aligns with our prediction that bison would not be negatively associated with linear features because they are more tolerant of human use. Bison also are known to use linear features such as roads and human-use trails throughout EINP based on tracks and park staff observations (Telfer and Cairns, 1979), but we did not observe a positive association between bison and linear feature density.
In contrast to the bison results, linear feature density was present in elk top models for all seasons with increased linear feature density being associated with lower elk counts (Table 2, Figure 2). This supports our prediction that elk are less tolerant of human use compared to bison. Other studies have documented similar elk responses to linear features (Prokopenko et al., 2017a, 2017b; Webb et al., 2011a, 2011b) and associated recreational activity (Ferguson and Keith, 1982; Naylor et al., 2009). The coefficient for bison removal year was present in the fall elk top model and was positively associated with higher elk counts, but it was not significant. The effect of bison presence on elk was significant for both fall and winter models, and elk counts were positively associated with bison presence. This was expected because bison and elk select similar habitats during winter despite consuming different forage (Telfer and Cairns, 1979; Cairns and Telfer, 1980; Wydeven and Dahlgren, 1985; Singer and Norland, 1994). The linear variable for distance to water was present in the elk winter model, with higher elk counts associated with areas farther from water bodies. We suspect this was also due to elk shifting their diet in winter towards a higher proportion of graminoids and browse, because elk in EINP have been documented to heavily select upland grasslands and aspen woodlands during winter (Cairns and Telfer, 1980). These findings indicate that grasslands are important habitats for not only bison, but also elk in EINP across seasons. This was also documented by Cairns and Telfer (1980), who found that upland grass is one of the least available habitat types in EINP, and is highly selected by both bison and elk, though in different seasons. They suggested maintenance of upland grass in EINP is important for supporting high ungulate densities. Interestingly, the proportion of open habitats was not represented in any of the elk top models, but this is likely because elk use a variety of habitat types in each season, apparently in proportion to their availability (Telfer and Cairns, 1979). In winter when elk in EINP select upland grass and browse, they spend a majority of time in aspen forests (Telfer and Cairns, 1979; Cairns and Telfer, 1980). This highlights the importance of the mosaic of deciduous forests interspersed with grasslands that is characteristic of the aspen parkland ecosystem. Another possible explanation for proportion of open habitats not appearing in elk top models is that elk exhibit commuting behaviour whereby patterns of habitat use change temporally (Spitz et al., 2018). Changes in elk habitat use that vary throughout the course of a day can be obscured in analyses that pool data across longer time periods.
Bison and elk daily activity patterns overlapped substantially in all three seasons (Figure 3). In summer, we saw the greatest separation in activity patterns of the three seasons, with bison showing a clear diurnal pattern with slightly higher peaks at dawn and dusk compared to the crepuscular pattern of elk. Elk activity patterns were crepuscular in all three seasons. Bison are generally considered to be diurnal, though we observed a shift towards a more crepuscular pattern during winter, and subsequently a higher coefficient of overlap. During winter, bison and elk activity patterns mirrored each other closely (Figure 3), with bison and elk sharing the same temporal peaks in activity.
Our observations appear to be consistent with bison and elk patterns of overlap in other studies. Spatial and temporal overlap are not synonymous with habitat overlap or diet overlap, two indices we were not able to evaluate in this study. However, we observed a significant positive association between elk counts and bison presence in the elk spatial model for winter, the season when bison and elk have the highest habitat overlap but low diet overlap (Telfer and Cairns, 1979). This is consistent with ungulate habitat relationships in Wind Cave National Park where some heterospecifics had high spatial and habitat overlap, meaning that they overlapped spatially and selected for the same habitat types within their spatial overlap, but coexisted by eating different types of vegetation within the same areas (Wydeven and Dahlgren, 1985). Similarly, studies of niche relationships in Yellowstone National Park determined that, although increasing bison and elk populations resulted in greater spatial overlap there was no evidence for competitive exclusion (Singer and Norland, 1994); bison and elk increased in habitat overlap, but only moderately increased in dietary overlap. Although we did not examine habitat selection or diet, Telfer and Cairns (1979) showed that bison use more sedge (Carex spp.) and elk use more browse during winter when their habitat overlap is greatest, a pattern also found for bison and elk in Yellowstone (Singer and Norland, 1994). Aside from higher overlapping habitat use reported for bison and elk during winter, bison and elk also might have higher spatial overlap in winter due to snow restricting movement and resource access.
Overall, we found that bison and elk in EINP have both high spatial overlap and high temporal overlap in daily activity patterns. We did not find strong evidence for spatial or temporal partitioning, although we observed higher positive associations between bison and elk during winter when habitat overlap is highest, and saw more separation in daily activity patterns during summer, the season when bison and elk have the highest diet overlap (Telfer and Cairns, 1979; Cook, 2002). We suspect there might be stronger evidence for spatial avoidance at finer temporal scales that we were unable to detect because of the broad seasonal time scale; future research could incorporate monthly, weekly, or daily intervals. The seasonal patterns of spatial and temporal overlap between bison and elk observed in our study paired with existing evidence of seasonal habitat selection and diet overlap (Telfer and Cairns, 1979) illustrate the complexity of intraguild sympatry within EINP. Our observations indicate that spatial and temporal partitioning between bison and elk in EINP is not necessary for ungulates to coexist in the highly productive system with high ungulate densities. However, because there is evidence of high spatiotemporal overlap of elk and bison combined with the fenced perimeter limiting dispersal and both species selecting for grasslands (Telfer and Cairns, 1979; Cairns and Telfer, 1980) that are limited in availability (Blyth, 1995; Parks Canada, 2010), there is potential to concentrate negative impacts in this habitat type. Park managers are currently working to address declining grassland health in EINP (Parks Canada, 2010). Understanding the effects of interspecific interactions and anthropogenic influences on ungulate distributions is necessary to adaptively manage grasslands and other limited ecosystems throughout EINP.
Data availability statement
The raw data supporting the conclusions of this article will be made available by the authors, without undue reservation.
Ethics statement
An exemption from ACUC review was granted from the University of Alberta Research Ethics Office because the study involved category A animal use - observation of live animals. Reference number: 2018.031a Foca.
Author contributions
The authors confirm contribution to the paper as follows: study conception and design: JF, MB; data collection: JF; analysis: JF; interpretation of results: JF, MB; draft manuscript preparation: JF, MB. All authors reviewed the results and approved the final version of the manuscript.
Funding
This project was financially supported by the University of Alberta, an Alberta Conservation Association grant to L. Roy and the Friends of Elk Island Society (030-00-90-261), the Northern Alberta Chapter of Safari Club International - Hunting Heritage Fund grants to MSB (RES0044334, RES0049275), and the Alberta Fish and Game Association – Minister’s Special Licence grants to MSB (RES0044700, RES0049598). Funds for open access publication were provided by the Natural Sciences and Engineering Research Council of Canada grant to MSB (RES0029160).
Acknowledgments
We thank L. Roy and the Friends of Elk Island Society for help with project design, assisting with grant acquisition, and supporting the field work. We thank Parks Canada for their logistical support and field work support. Thanks to J. Singh, M. Brownlee, K. Lanzenstiel, J. Pattinson, T. Strydhorst, S. Widmeyer, and R. Dawson for their help with data collection and data processing. Additionally, we thank M. Eklund, A. Zapata, J. Benade, C. Brooke, E. Hollik, H. Holzer, R. Martins, C. Nobleza, A. Suleman, and C. Zhao for their help with data processing. Research was permitted by Parks Canada (EI-2016-23336, EI-2019-31317, EI-2020-35818).
Conflict of interest
The authors declare that the research was conducted in the absence of any commercial or financial relationships that could be construed as a potential conflict of interest.
Publisher's note
All claims expressed in this article are solely those of the authors and do not necessarily represent those of their affiliated organizations, or those of the publisher, the editors and the reviewers. Any product that may be evaluated in this article, or claim that may be made by its manufacturer, is not guaranteed or endorsed by the publisher.
Supplementary material
The Supplementary Material for this article can be found online at: https://www.frontiersin.org/articles/10.3389/fcosc.2022.937203/full#supplementary-material
References
Akaike H. (1974). A new look at the statistical model identification. IEEE Trans. Automat. Contr. 19, 716–723. doi: 10.1109/TAC.1974.1100705
Arsenault R., Owen-Smith N. (2002). Facilitation versus competition in grazing herbivore assemblages. Oikos 97, 313–318. doi: 10.1034/j.1600-0706.2002.970301.x
Best J. N., Bork E. W. (2003). Using transplanted plains rough fescue (Festuca hallii [Vasey] piper) as an indicator of grazing in Elk Island National Park, Canada. Nat. Areas J. 23, 202–209. doi: 10.2307/4003836
Best J. N., Bork E. W., Cool N. L. (2003). Initial beaked hazel growth responses following protection from ungulate browsing. J. Range Manage. 56, 455–460. doi: 10.2307/4003836
Bird R. D. (1961). Ecology of the aspen parkland of western Canada in relation to land use. Public Dep. Agric. Canada 17, 5–155. doi: 10.5962/bhl.title.59307
Blyth C. B. (1995). Dynamics of ungulate populations in Elk Island National Park (MSc thesis) (Edmonton, Alberta: University of Alberta).
Blyth C. B., Hudson R. J. (1992). Elk Island National Park Alberta, Canada - a historical perspective of protected area management. Dev. Landsc. Manage. Urban Plan. 7, 69–74.
Bork E. W., Hudson R. J., Bailey A. W. (1997). Populus forest characterization in Elk Island National Park relative to herbivory, prescribed fire, and topography. Can. J. Bot. 75, 1518–1526. doi: 10.1139/b97-866
Boyce M. S., Pitt J., Northrup J. M., Morehouse A. T., Knopff K. H., Cristescu B., et al. (2010). Temporal autocorrelation functions for movement rates from global positioning system radiotelemetry data. Philos. Trans. R. Soc B Biol. Sci. 365, 2213–2219. doi: 10.1098/rstb.2010.0080
Bradford J. B., Hobbs N. T. (2008). Regulating overabundant ungulate populations: An example for Elk in Rocky Mountain National Park, Colorado. J. Environ. Manage. 86, 520–528. doi: 10.1016/j.jenvman.2006.12.005
Burnham K. P., Anderson D. R., Huyvaert K. P. (2011). AIC model selection and multimodel inference in behavioral ecology: Some background, observations, and comparisons. Behav. Ecol. Sociobiol. 65, 23–35. doi: 10.1007/s00265-010-1029-6
Cairns A. L., Telfer E. S. (1980). Habitat use by 4 sympatric ungulates in boreal mixedwood forest. J. Wildl. Manage. 44, 849–857. doi: 10.2307/3808313
Campbell C., Campbell I. D., Blyth C. B., McAndrews J. H. (1994). Bison extirpation may have caused aspen expansion in western Canada. Ecography (Cop.). 17, 360–362. doi: 10.1111/j.1600-0587.1994.tb00113.x
Ciuti S., Northrup J. M., Muhly T. B., Simi S., Musiani M., Pitt J. A., et al. (2012). Effects of humans on behaviour of wildlife exceed those of natural predators in a landscape of fear. PloS One 7, e50611. doi: 10.1371/journal.pone.0050611
Cook J. G. (2002). “Nutrition and food,” in North American elk: Ecology and management, vol. 259–349 . Eds. Toweill D. E., Thomas J. W. (Washington D.C., USA: Smithsonian Institutional Press).
COSEWIC (2013). COSEWIC assessment and status report on the plains bison Bison bison bison and the wood bison Bison bison athabascae in Canada. (Canada, Ottawa, Ontario: Committee on the Status of Endangered Wildlife).
Danielson B. J. (1991). Communities in a landscape: The influence of habitat heterogeneity on the interactions between species. Am. Nat. 138, 1105–1120. doi: 10.1086/285272
Dunning J. B., Danielson B. J., Pulliam H. R. (1992). Ecological processes that affect populations in complex landscapes. Oikos 65, 169–175. doi: 10.2307/3544901
Ferguson M. A. D., Keith L. B. (1982). Influence of nordic skiing on distribution of moose and elk in Elk Island National Park, Alberta. Can. Field-Naturalist 96, 69–78.
Ferrer-Paris J. R., Zager I., Keith D. A., Oliveira-Miranda M. A., Rodríguez J. P., Josse C., et al. (2019). An ecosystem risk assessment of temperate and tropical forests of the americas with an outlook on future conservation strategies. Conserv. Lett. 12, 1–10. doi: 10.1111/conl.12623
Foca J. M. (2021). Camera traps for evaluating ungulate densities and interspecific interactions in the Beaver Hills region of Alberta (MSc thesis) (Edmonton, Alberta: University of Alberta).
Green R. A., Bear G. D. (1990). Seasonal cycles and daily activity patterns of rocky mountain elk. J. Wildl. Manage. 54, 272–279. doi: 10.2307/3809041
Haigh J. C., Mackintosh C., Griffin F. (2002). Viral, parasitic and prion diseases of farmed deer and bison. OIE Rev. Sci. Tech. 21, 219–248. doi: 10.20506/rst.21.2.1331
Hobbs N. T. (1996). Modification of ecosystems by ungulates. J. Wildl. Manage. 60, 695–713. doi: 10.2307/3802368
Hoberg E. P., Polley L., Jenkins E. J., Kutz S. J. (2008). Pathogens of domestic and free-ranging ungulates: Global climate change in temperate to boreal latitudes across North America. OIE Rev. Sci. Tech. 27, 511–528. doi: 10.20506/rst.27.2.1818
Holsworth W. N. (1960). Interactions between moose, elk, and buffalo in Elk Island National Park, Alberta (MSc thesis) (Vancouver, British Columbia: University of British Colombia).
Hood G. A., Bayley S. E. (2008). The effects of high ungulate densities on foraging choices by beaver (Castor canadensis) in the mixed-wood boreal forest. Can. J. Zool. 86, 484–496. doi: 10.1139/Z08-029
Hood G. A., Bayley S. E. (2009). A comparison of riparian plant community response to herbivory by beavers (Castor canadensis) and ungulates in Canada’s boreal mixed-wood forest. For. Ecol. Manage. 258, 1979–1989. doi: 10.1016/j.foreco.2009.07.052
Kagima B., Fairbanks W. S. (2013). Habitat selection and diet composition of reintroduced native ungulates in a fire-managed tallgrass prairie reconstruction. Ecol. Restor. 31, 79–88. doi: 10.3368/er.31.1.79
Kutz S. J., Hoberg E. P., Polley L., Jenkins E. J. (2005). Global warming is changing the dynamics of Arctic host-parasite systems. Proc. R. Soc B Biol. Sci. 272, 2571–2576. doi: 10.1098/rspb.2005.3285
Kuzyk G. W., Cool N. L., Bork E. W., Bampfylde C., Franke A., Hudson R. J. (2009). Estimating economic carrying capacity for an ungulate guild in western Canada. Open Conserv. Biol. J. 3, 24–35. doi: 10.2174/1874839200903010024
Larter N. C., Gates C. C. (1991). Diet and habitat selection of wood bison in relation to seasonal changes in forage quantity and quality. Can. J. Zool. 69, 2677–2685. doi: 10.1139/z91-376
McMillan N. A., Fuhlendorf S. D., Luttbeg B., Goodman L. E., Davis C. A., Allred B. W., et al. (2021). Are bison movements dependent on season and time of day? investigating movement across two complex grasslands. Ecosphere 12, e03317. doi: 10.1002/ecs2.3317
McShea W. J., Underwood H. B., Rappole J. H., Taber R. (1997). The science of overabundance: Deer ecology and population management. Wildl. Soc Bull. 25, 578–580.
Meredith M., Ridout M. (2020) Package “overlap”: Estimates of coefficient of overlapping for animal activity patterns. Available at: https://cran.r-project.org/web/packages/overlap/overlap.pdf (Accessed May 9, 2020).
Murray M. G., Illius A. W. (2000). Vegetation modification and resource competition in grazing ungulates. Oikos 89, 501–508. doi: 10.1034/j.1600-0706.2000.890309.x
Naylor L. M., Wisdom M., Anthony R. G. (2009). Behavioral responses of North American elk to recreational activity. J. Wildl. Manage. 73, 328–338. doi: 10.2193/2008-102
O’Connor L. J., Walkden-Brown S. W., Kahn L. P. (2006). Ecology of the free-living stages of major trichostrongylid parasites of sheep. Vet. Parasitol. 142, 1–15. doi: 10.1016/j.vetpar.2006.08.035
Parks Canada (2010). “Elk Island National Park,” in State of the park report (Fort Saskatchwewan, AB: Elk Island National Park).
Parks Canada (2017). “What we heard: Ungulate management in Elk Island National Park - October 2016 to June 2017,” in Elk island national park (Fort Saskatchewan, AB, Canada).
Patz J. A., Graczyk T. K., Geller N., Vittor A. Y. (2000). Environmental changes & parasitic diseases. Int. J. Parasitol. 30, 1395–1405. doi: 10.1016/S0020-7519(00)00141-7
Prokopenko C. M., Boyce M. S., Avgar T. (2017a). Characterizing wildlife behavioural responses to roads using integrated step selection analysis. J. Appl. Ecol. 54, 470–479. doi: 10.1111/1365-2664.12768
Prokopenko C. M., Boyce M. S., Avgar T. (2017b). Extent-dependent habitat selection in a migratory large herbivore: road avoidance across scales. Landsc. Ecol. 32, 313–325. doi: 10.1007/s10980-016-0451-1
Riley J. L., Green S. E., Brodribb K. E. (2007). A conservation blueprint for Canada’s prairies and parklands (Toronto, ON, Canada: Nature Conservancy of Canada).
Samuel B. (2004). White as a ghost: Winter ticks & moose (Edmonton, AB, Canada: Federation of Alberta Naturalists).
Samuel W. M. (2007). Factors affecting epizootics of winter ticks and mortality of moose. Alces 43, 39–48.
Shury T. K., Pybus M. J., Nation N., Cool N. L., Rettie W. J. (2019). Fascioloides magna in moose (Alces alces) from Elk Island National Park, Alberta. Vet. Pathol. 56, 476–485. doi: 10.1177/0300985818823776
Sinclair A. R. E. (1985). Does interspecific competition or predation shape the African ungulate community? J. Anim. Ecol. 54, 899–918. doi: 10.2307/4386
Sinclair A. R. E., Norton-Griffiths M. (1982). Does competition or facilitation regulate migrant ungulate populations in the Serengeti? a test of hypotheses. Oecologia 53, 364–369. doi: 10.1007/BF00389015
Singer F. J., Norland J. E. (1994). Niche relationships within a guild of ungulate species in Yellowstone National Park, Wyoming, following release from artificial controls. Can. J. Zool. 72, 1383–1394. doi: 10.1139/z94-183
Skovlin J. M., Zager P., Johnson B. K. (2002). “Elk habitat selection and evaluation,” in North American elk: Ecology and management. Eds. Toweill D. E., Thomas J. W. (Washington D.C., USA: Smithsonian Institutional Press), 531–555.
Somers M. J., Hayward M. W. (2012). Fencing for conservation: Restriction of evolutionary potential or a riposte to threatening processes? Fencing for Conservation (New York, NY, USA: Springer). pp. 1–320. doi: 10.1007/978-1-4614-0902-1
Spitz D. B., Clark D. A., Wisdom M. J., Rowland M. M., Johnson B. K., Long R. A., et al. (2018). Fire history influences large-herbivore behavior at circadian, seasonal, and successional scales. Ecol. Appl. 28, 2082–2091. doi: 10.1002/eap.1797
Telfer E. S., Cairns A. L. (1979). “Bison-wapiti interrelationships in elk island national park, Alberta,” in North American elk: Ecology, behavior and management. Eds. Boyce M. S., Hayden-Wing L. D. (Laramie, WY, USA: University of Wyoming), 114–121.
Turner M. G. (2005). Landscape ecology: What is the state of the science? Annu. Rev. Ecol. Evol. Syst. 36, 319–344. doi: 10.1146/annurev.ecolsys.36.102003.152614
Van Aarde R., Whyte I., Pimm S. (1999). Culling and the dynamics of the Kruger national park African elephant population. Anim. Conserv. 2, 287–294. doi: 10.1111/j.1469-1795.1999.tb00075.x
Van Beest F. M., McLoughlin P. D., Vander Wal E., Brook R. K. (2014). Density-dependent habitat selection and partitioning between two sympatric ungulates. Oecologia 175, 1155–1165. doi: 10.1007/s00442-014-2978-7
Van Dijk J., Sargison N. D., Kenyon F., Skuce P. J. (2010). Climate change and infectious disease: Helminthological challenges to farmed ruminants in temperate regions. Animal 4, 377–392. doi: 10.1017/S1751731109990991
Webb S. L., Dzialak M. R., Harju S. M., Hayden-Wing L. D., Winstead J. B. (2011a). Effects of human activity on space use and movement patterns of female elk. Wildl. Soc Bull. 35, 261–269. doi: 10.1002/wsb.25
Webb S. L., Dzialak M. R., Osborn R. G., Harju S. M., Wondzell J. J., Hayden-Wing L. D., et al. (2011b). Using pellet groups to assess response of elk and deer to roads and energy development. Wildl. Biol. Pract. 7, 32–40. doi: 10.2461/wbp.2011.7.3
WildTrax (2019). User guide: Remote camera trap image tagging (Edmonton, Alberta: Alberta Biodiversity Monitoring Institute).
Wydeven A. P., Dahlgren R. B. (1985). Ungulate habitat relationships in Wind Cave National Park. J. Wildl. Manage. 49, 805–813. doi: 10.2307/3801715
Keywords: Camera trap, bison, elk, interspecific interactions, habitat use, spatio-temporal overlap, activity patterns
Citation: Foca JM and Boyce MS (2022) Bison and elk spatiotemporal interactions in Elk Island National Park. Front. Conserv. Sci. 3:937203. doi: 10.3389/fcosc.2022.937203
Received: 05 May 2022; Accepted: 29 August 2022;
Published: 20 September 2022.
Edited by:
Christine Wilkinson, University of California - Berkeley, United StatesReviewed by:
Darren Clark, Oregon Department of Fish and Wildlife, United StatesJeff M. Martin, South Dakota State University, United States
Copyright © 2022 Foca and Boyce. This is an open-access article distributed under the terms of the Creative Commons Attribution License (CC BY). The use, distribution or reproduction in other forums is permitted, provided the original author(s) and the copyright owner(s) are credited and that the original publication in this journal is cited, in accordance with accepted academic practice. No use, distribution or reproduction is permitted which does not comply with these terms.
*Correspondence: Jennifer M. Foca, foca@ualberta.ca