Future spatial modeling of vegetation in the Central Atlantic Forest Corridor, Brazil
 Romário Oliveira de Santana
 Rafael Coll Delgado
 Alexandre Schiavetti
- 1Department of Agricultural and Environmental Sciences at the State University of Santa Cruz, Bahia, Brazil
- 2Department of Environmental Sciences, Forest Institute, Federal Rural University of Rio de Janeiro (UFRRJ), Seropédica, Rio de Janeiro, Brazil
- 3Department of Agricultural and Environmental Sciences at the State University of Santa Cruz, Brazil, Investigador Asociado ao Centro para el Estudio de Sistemas Marinos (CESIMAR/CENPAT), Puerto Madryn, Argentina
Tropical forests stand out among forest domains, due to their wide diversity of flora and fauna. However, these areas concentrate a large number of the forest fires that occur annually on the planet. In this context, the present study performs spatial modeling of the normalized multi-band drought index (NMDI) in the Central Atlantic Forest Corridor during past (2001-2020) and future (2021-2040) periods to identify the relationship between drought and forest fires. Fire foci data, soil moisture, and data from the MOD09A1 product were used to obtain the NMDI. Rainfall and mean air temperature data from the past and for different future scenarios (SSP126 and SSP585) were also used. The autoregressive integrated moving average model (ARIMA) was used for modeling the NMDI. The results found indicate a recurrence of fire in the CAFC during the period of 2001–2020. Future data indicate reductions in rainfall and an increase in temperature in the CAFC area. The NMDI data indicate that the central region of the corridor is the driest and, among the priority areas for conservation, the Ilha do Lameirão Municipal ecological station has the lowest index values. Future modeling indicates the drought intensifying in the coming years in the corridor area. The CAFC is an extremely important area for the maintenance of Atlantic Forest remnants; however, this area continues to suffer disturbances and without the adoption of public policies, these disturbances could compromise the conservation of natural resources.
1 Introduction
Tropical forests are important forest domains that present high productivity and a broad diversity of flora and fauna species (Blundo et al., 2021). These forest domains are present on three continents (Americas, Africa, and Asia) and occupy 10% of the Earth’s surface, with more than half of the cataloged species on Earth being found in these areas (Shennan-Farpón et al., 2021). South America has two of the great tropical forests, the Amazon Rainforest and the Atlantic Forest (Marques et al., 2021). The original area of the Atlantic Forest covered 1,345,300 km² of the South American continent, being found in Brazil (93% of the total area), Paraguay (5.3%), and Argentina (1.7%) (Marques et al., 2021; Santana et al., 2021). Currently, its remnants represent 12.4% of the original area due to human actions (Santana et al., 2020).
Public policies have been created to mitigate the impacts caused by human activities in this biodiversity hotspot, such as the implementation of two ecological corridors, the Central Atlantic Forest Corridor and the Serra do Mar Biodiversity Corridor (Lamas et al., 2015; Santana et al., 2020; Santana et al., 2021). These corridors are important tools created to connect the Atlantic Forest remnants through protected areas and to reduce forest fragmentation in these important areas of endemism (Crepaldi et al., 2015; Santana et al., 2021). The responses of these domains in relation to climate change remain uncertain, which raises a number of questions as to the future impacts of these changes on forests (Bennett et al., 2021).
Anthropic actions can cause several negative impacts on tropical forests and these impacts can be enhanced due to climate change (Cassell et al., 2019), with the occurrence and propagation of forest fires being among the impacts. These events depend on the interactions between climate and vegetation that affect biomass availability and material flammability (Dietze et al., 2019). Forest fires in tropical rainforests can significantly reduce forest biomass for decades, as these events slow or paralyze post-fire recovery in forests (Silva et al., 2018).
Climatic conditions have become more extreme and, as a result, the occurrence of forest fires has increased due to changes in fire dynamics (Gholamnia et al., 2020). To help identify these events, numerical indices were developed that attempt to estimate the intensity of possible fires (Chandler et al., 1983; Sharples et al., 2009; Chelli et al., 2015). These indices can use meteorological data such as the McArthur Forest Fire Danger Index (FFDI) (McArthur, 1967), which uses data on mean air temperature, relative humidity, and wind speed at a height of 10 m, or they can be spectral indices using satellite images such as the normalized multi-band drought index (NMDI) (Wang and Qu, 2007; Santos et al., 2021). NMDI is used to monitor forest fires due to its accuracy in assessing the severity of drought due to the combination of near infrared and short-wave bands that make it possible to estimate soil and vegetation moisture (Wang and Qu, 2007; Santos et al., 2021). This index was used by Santos et al. (2021), to monitor Atlantic Forest vegetation in the state of Rio Janeiro, Brazil, relating it to biophysical variables and analyzing susceptibility to forest fires.
The relationships between drought events in tropical forests and fires have already been addressed in certain studies (Ribeiro et al., 2018; Silva et al., 2020; Santos et al., 2021), indicating increased biomass burning in severe drought scenarios in the Amazon (Brando et al., 2014; Silva Júnior et al., 2019; Silva et al., 2020) and the Atlantic Forest (Andrade et al., 2019; Santos et al., 2021). Given these scenarios, and the future projections of the Intergovernmental Panel on Climate Change (IPCC) that indicate an increase in the Earth’s temperature, it is important to use tools to assist firefighting through monitoring and mitigation of forest domains in the fight against climate change at a spatiotemporal scale (Lemos and Cunha, 2021).
In light of the above, this study aims to evaluate the spatio-temporal dynamics for the past, present (2001-2020) and future (2021-2040) in relation to forest fires in the Atlantic Forest Central Corridor, Brazil. As such, the research questions investigated were: Which regions of the Central Atlantic Forest Corridor have the highest density of hotspots? What are the years and regions with the highest and lowest soil moisture values? What is the climate trend in the Central Atlantic Forest Corridor? Did auto regressive integrated moving average modeling satisfactorily simulate the past and future NMDI in the Central Atlantic Forest Corridor?
2 Methodology
2.1 Study area
The Central Atlantic Forest Corridor (CAFC) (Figure 1) is located between latitudes 13°0’6” and 21°18’36” S and longitudes 41°52’43” and 37°16’40” W. Its area is 13.3 million hectares covering 108 municipalities in the state of Bahia and the entire state of Espírito Santo, Brazil (Brasil, 2006; Schiavetti et al., 2012; Santana et al., 2020).
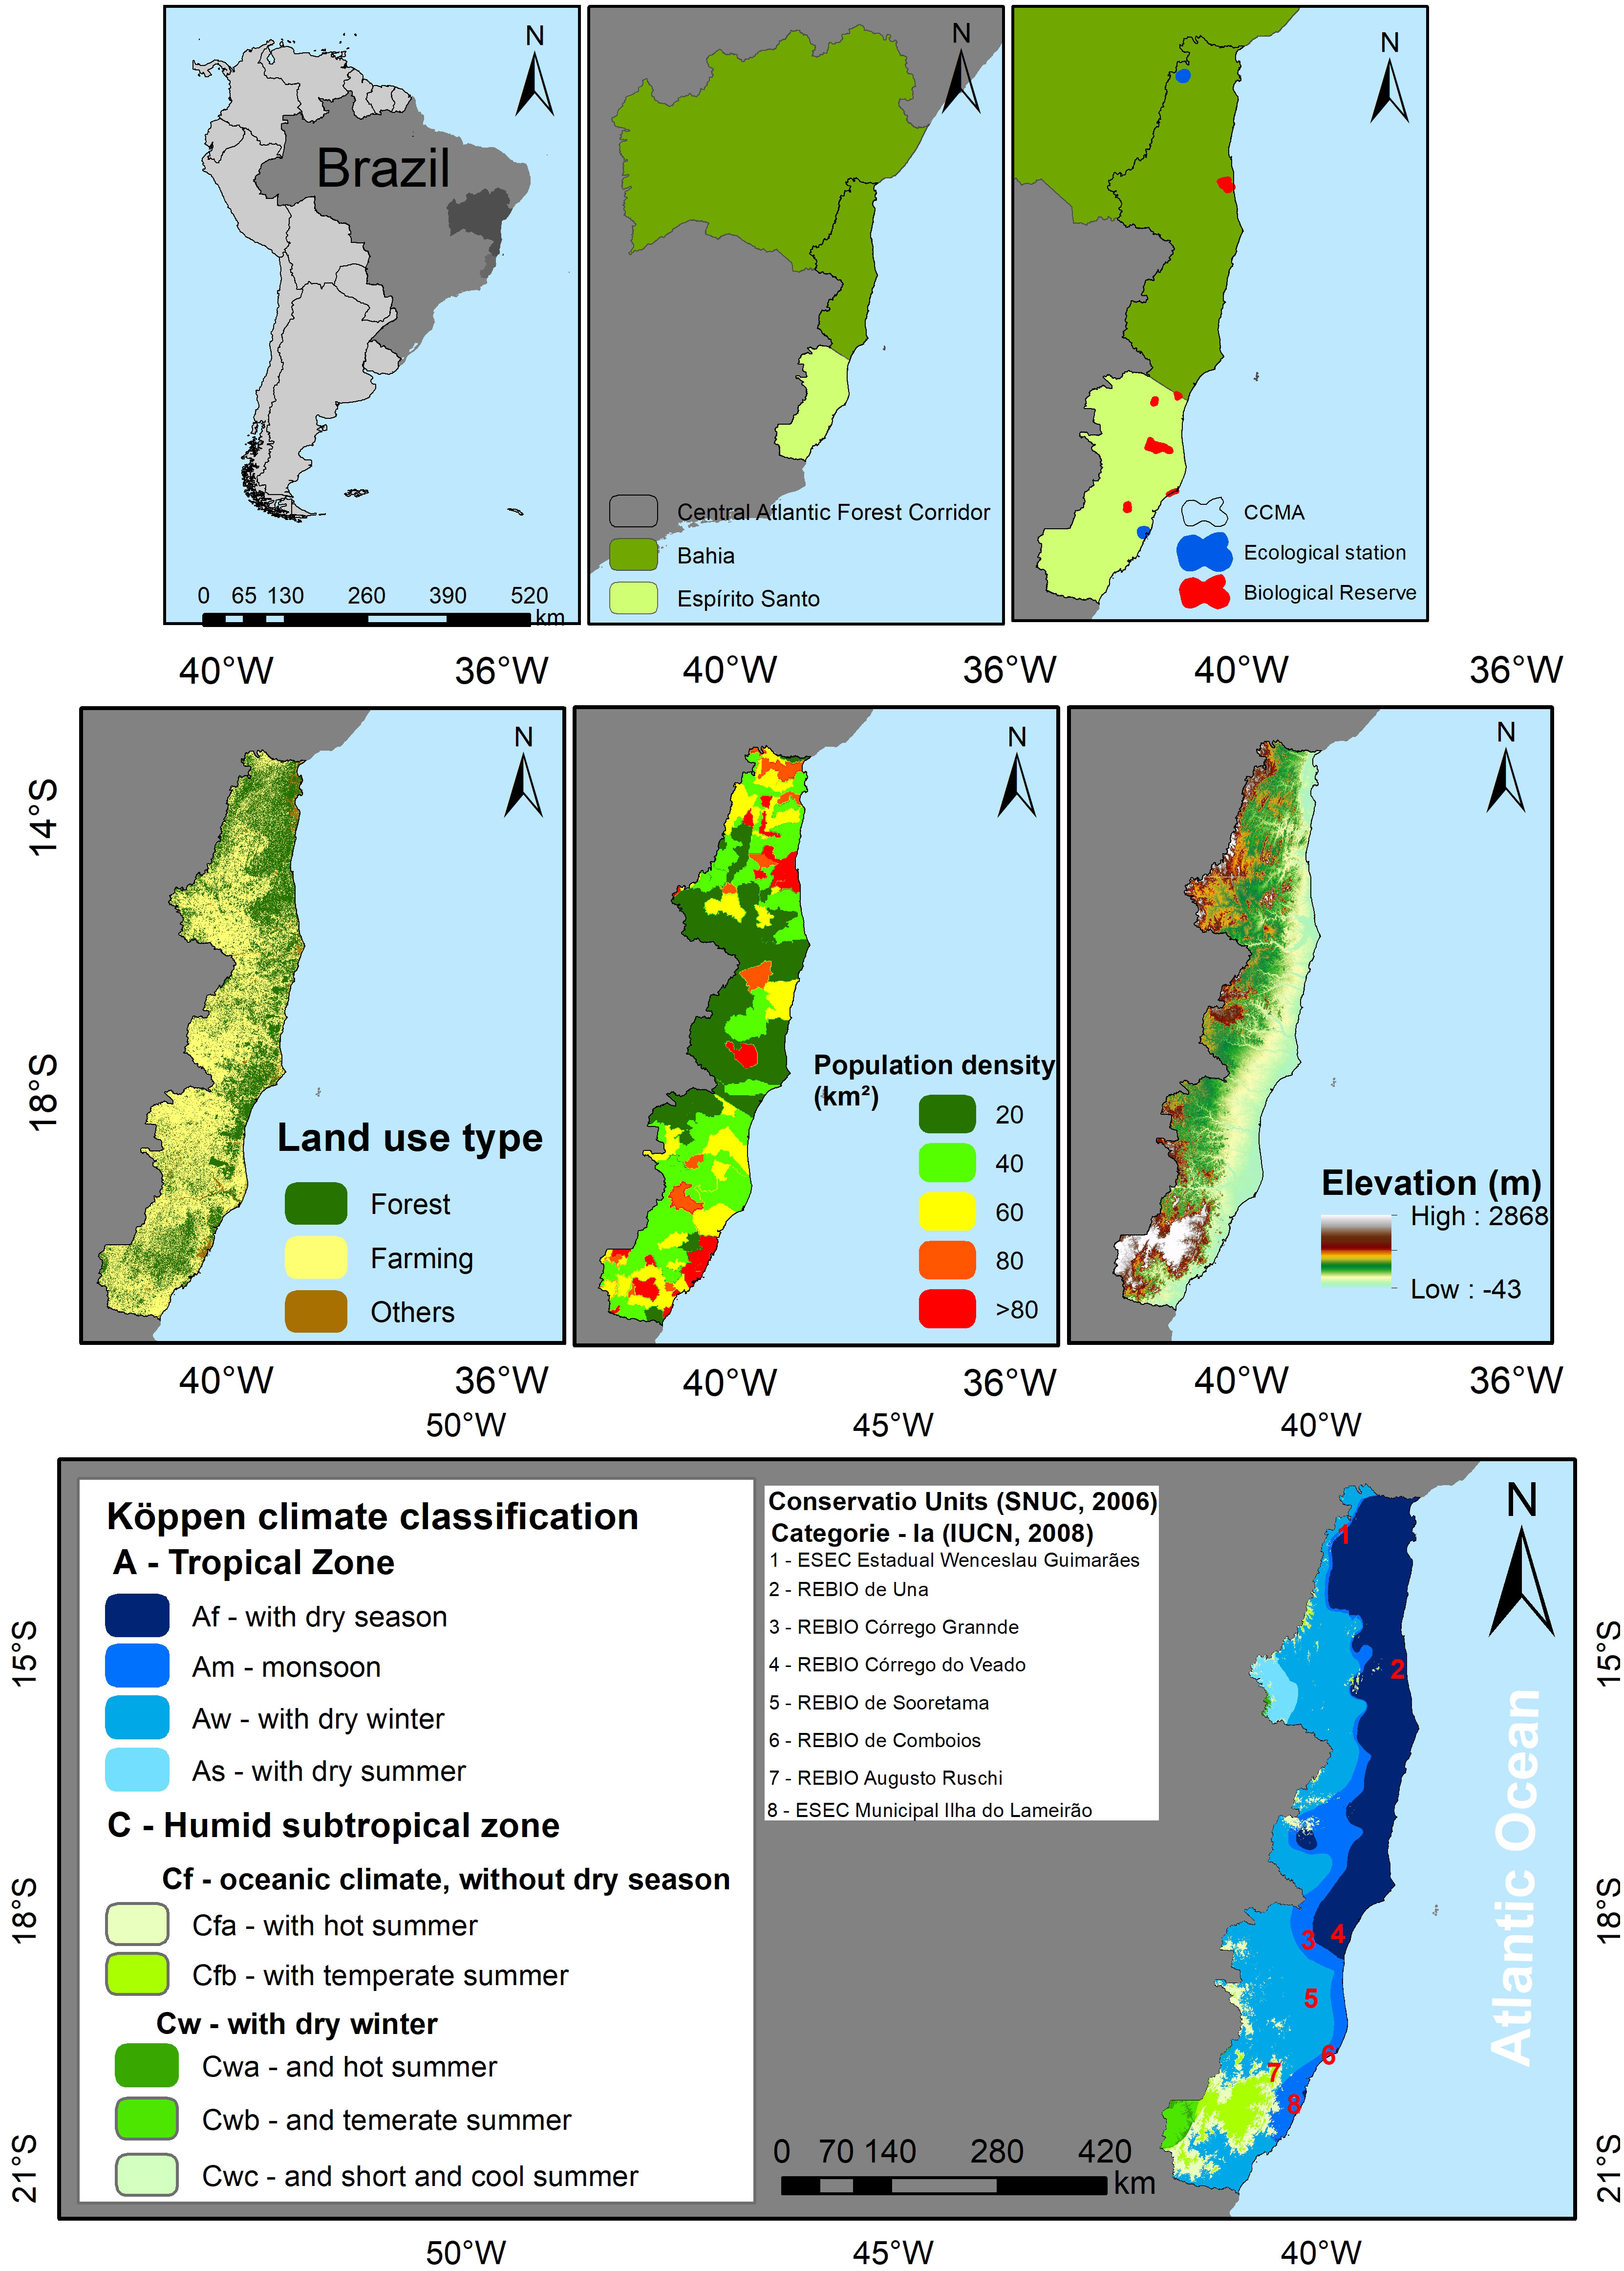
Figure 1 Geographic location, land use and land cover classes, population density, terrain elevation, and Köppen climate domains.
Within the CAFC, there are 258 protected areas that are of private or public domain (federal, state, and municipal) from different categories according to the classification of the Sistema Nacional de Unidades de Conservação (National System of Conservation Units) (SNUC - LAW 9.985/2000) (Brasil, 2006; Schiavetti et al., 2012). Considering the International Union for the Conservation of Nature (IUCN) System of Protected Areas Management Categories, the CAFC has 113 protected areas distributed across the six categories (IUCN, 2008). To assist in the identification of priority areas for species conservation in the CAFC, category I protected areas, with an area greater than 100 hectares (1 km²) and with their territorial limits made available in the database of some government agency, were used. Category I protected areas are created for resource conservation and are therefore considered to be the most pristine areas in the CAFC. Thus, the changes found should reflect in the conservation of species, which is the reason for the establishment of the corridor. The protected areas included in this category are six Biological Reserves (REBIO) and two Ecological Stations (ESEC). The biological reserves are REBIO Una, REBIO Córrego Grande, REBIO Córrego do Veado, REBIO de Comboios, REBIO Sooretama, and REBIO Augusto Ruschi. The ecological stations are ESEC Wenceslau Guimarães and ESEC Ilha do Lameirão Municipal.
There is a predominance of two climate types in the CAFC area, tropical zone without dry season (Af) and tropical zone with dry winter (Aw), being found in 39.46% and 32.62% of the corridor territory, respectively (Alvares et al., 2013; Santana et al., 2021). The CAFC has an estimated population of 7,302,527 inhabitants (IBGE, Instituto Brasileiro de Geografia e Estatística, 2020). The metropolitan region of Vitória, the capital of Espírito Santo, has the highest population density in the CAFC, with a density greater than 80 inhabitants/km².
The elevation of the CAFC varies between -43 and 2.868 m, with a mean altitude of 262 m (Santana et al., 2021). The Agriculture and Forestry classes occupy 97.77% (56.91 and 40.86%, respectively) of the total area of the CAFC and the Others class (Natural Non-Forestry Formation, Non-Vegetated Area, Water Bodies and Unobserved) 2.23% (Mapbiomas, 2020; Santana et al., 2021).
The mean temperature of the CAFC varies between 20°C and 26°C; the central region has the highest mean temperature values (Alvares et al., 2013; Santana et al., 2021). Mean evapotranspiration is between 3.64 and 4.10 mmd-1; the northwest and central regions concentrate the highest evapotranspiration values. Mean relative humidity varies between 74.17 and 80.77%. Mean wind speed is between 1.08 and 1.81 ms-1 (Santana et al., 2021). Mean annual rainfall of the CAFC is between 700 and 1,600 mm; the south and northeast regions concentrate the highest values and the northwest region the lowest annual averages (Xavier et al., 2016; Santana et al., 2021).
2.2 Past and future climate data
Rainfall (mm) and mean air temperature (°C) data obtained from WorldClim (2021) were used for climatological analysis. In this analysis, baseline climate data from 1970-2000 with a spatial resolution of 30 seconds (1 km²) were used. In the future analysis, data referring to scenarios SSP126 and SSP585 with low and high radiative forcing from the Canadian Earth System Model version 5 (CanESM5) for the years 2021-2040 were used; these data have a spatial resolution of 2.5 minutes (20.25 km²).
The SSP126 and SSP585 scenarios are projections of future climate change from the Scenario Model Intercomparison Project (ScenarioMIP) that provide important information to the Intergovernmental Panel on Climate Change (IPCC). SSP126 is the most optimistic scenario with a projection of an increasingly sustainable world in which natural resources are preserved, income inequalities are reduced, and energy is consciously used and consumed. On the other hand, SSP585 is the most pessimistic scenario, in which development is based on fossil fuels with the highest emissions and the highest values of global temperature increase (O'Neill et al., 2016; IPCC, 2021).
To extract these data, grids of points were created for the entire area of the CAFC with a spatial resolution of 30 seconds. The data extraction procedure was performed on R software version 4.0.5, using the libraries (readxl, raster, rgdal, maptools and RSAGA).
2.3 Kernel density and heat spots data
For the analysis of fire in the CAFC, data from hotspots were used for the period between January 1, 2001, and December 31, 2020. These data were obtained from the Fire Information for Resource Management System (FIRMS) (https://firms.modAPs.eosdis.nasa.gov/) in shapefile format. Processing, treatment, and analysis of heat source data were performed using ArcGis 10.5 software. For spatial analysis of the concentration of heat sources, the Kernel density algorithm was used. The maps generated with this algorithm have a spatial resolution of 1 km (Andrade et al., 2019; Barbosa et al., 2019). The density classes were classified into three categories, based on their color and hue: red = very high density, orange = high density, yellow = medium density, light green = low density, and dark green = very low density.
2.3 Soil moisture data
For soil moisture analysis (SoilM) (mm) in the period from 2001 to 2020, data produced by the NCEP-DOE Reanalysis-2 were used, which are available at NOAA/OAR/ESRL PSD (www.esrl.noaa.gov/psd/data/gridded/data.ncep.reanalysis2.html), with a spatial resolution of 2.5 x 2.5 degrees. Soil moisture data processing was carried out on R software version 4.0.5. Annual soil moisture maps were generated using Co-Kriging interpolation with a pixel size of 1 km in the ArcGis 10.5 environment.
2.4 Normalized multi-band drought index
To obtain the normalized multi-band drought index (NMDI) (Wang and Qu, 2007; Santos et al., 2021), during the period from 2001 to 2020, data from the 8-day MOD09A1 product with a spatial resolution of 500 m were used. The NMDI can be obtained using Equation 1, below:
in which, R 0.86µm, R 1.64µm, and R 2.13µm are apparent reflectances observed by a satellite sensor in the bands R 0.86 µm, R 1.64µm, and R 2.13µm.
The processing of the MOD09A1 images to calculate the NMDI was performed using R software version 4.0.5. A grid of points with a resolution of 30 km was generated to extract information from the images for the entire CAFC area. The generated maps were processed on ArcGis 10.5. NMDI values were classified according to Wang and Qu, 2007, in which the highest values indicate high soil water concentration or wet conditions, and low values indicate low soil water concentration or high occurrence of drought. The classification used was as follows: very dry (< 0.2), dry (<0.4), wet (≥ 0.4 – 0.6), and very wet (>0.6) (Wang and Qu, 2007; Santos et al., 2021).
The Pettitt test (1979) was applied to the NDMI data time series to identify the main significant changes in the data series during the study period (2001-2020), the year identified with the main inflection/sign was specialized by month using the Ordinary Kriging interpolator and 1 km spatial resolution for the maps.
2.5 Spatiotemporal modeling – ARIMA
The autoregressive integrated moving average model (ARIMA) was used for spatiotemporal modeling of the normalized multi-band drought index (NMDI) in the CAFC during the period of 2001-2020 and for 2021-2040. The ARIMA model (Equation 2) uses past data to perform the future forecast based on two main characteristics of autocorrelation and moving averages. The future modeling methodology used in this study was adapted from (Silva Junior et al., 2019; Santana et al., 2020; Vilanova et al., 2020; Santos et al., 2021).
where y(d) is Y differentiated d times, e and c are constants, p is the autoregressive order, d is the order of differentiation (1 or 2 normally), and q is the moving average order.
The modeling was performed on R software version 4.0.5 using the “MASS” (Venables and Ripley, 2002; Ripley, 2020), “forecast” (Hyndman and Khandakar, 2008; Hyndman et al., 2020) and “Tseries” (Trapletti and Hornik, 2007) Packages. The forecast package was used to forecast the future NMDI (2021-2040) in the CAFC area. Observed NMDI data from the period of 2001-2020 were used as training data for modeling. The spatialization of NMDI data was performed on ArcGis 10.5 using the Co-Kriging interpolation method with a pixel size of 1 km. Three NMDI maps were generated, mean map of the past (2001-2020), future map (2021-2040), and the map of the difference between the future and the past.
3 Results
3.1 Biophysical variables
The NMDI in the CAFC (Figure 2) did not show large variations in annual means, with the highest value of 0.49 in 2018 and the lowest of 0.45 in 2003. The mean for the study period was 0.47. August had the lowest monthly mean, and December and January had the highest monthly mean (0.45 and 0.49, respectively).
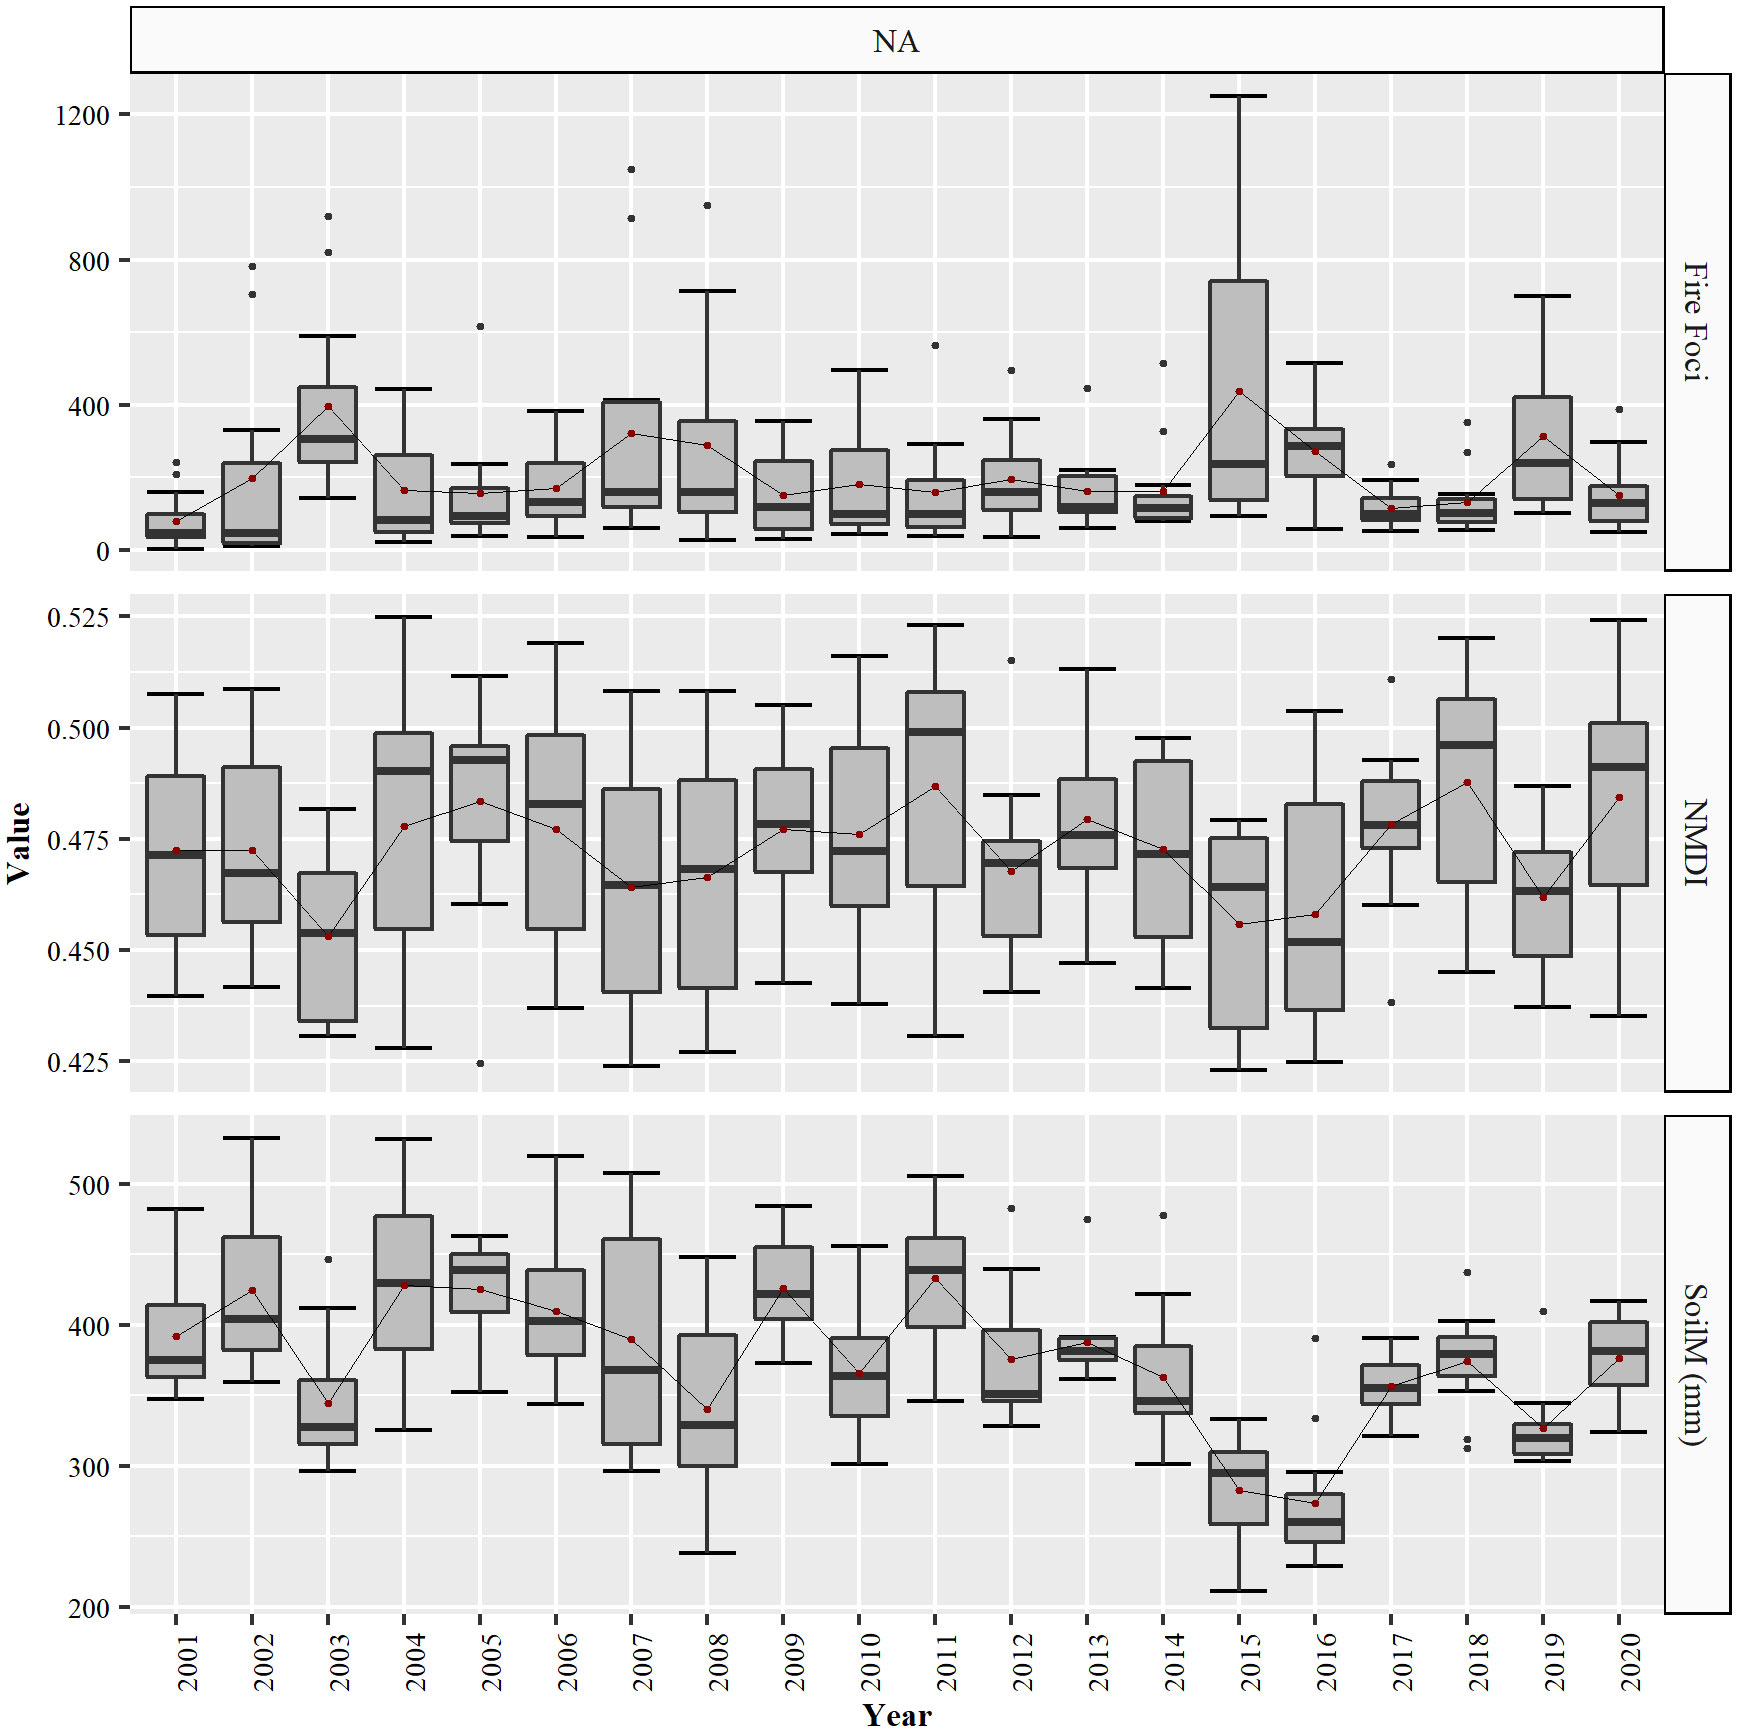
Figure 2 Boxplot of NMDI, fire foci, and soil moisture [SoilM (mm)] variables in the Central Atlantic Forest Corridor.
During the study period, 50,560 hotspots were registered in the CAFC. The years 2015 and 2001 had the highest and lowest heat source records, respectively (5,261 and 969). The highest occurrences of hotspots are found in October and September (9,249 and 7,222) and the lowest in May and June (1,977 and 2,002).
The annual values of soil moisture in the CAFC presented a variation between 273.69 and 433.14 mm, with the lowest value recorded in 2016 and the highest in 2011, respectively. The mean for the study period was 374.82 mm, with the mean yearly value being higher than this value in eleven years and lower in nine of the analyzed years. The period from 2014 to 2019 stands out for concentrating the values furthest below the mean values for the period. The highest monthly values of soil moisture are found in January and the lowest in October. In the period from June to November, the monthly means are below the mean and in the period of December, the monthly mean is higher than the general monthly mean.
3.2 Spatial analysis of the NMDI
Based on the Pettitt test, it was identified that the year 2014 presented a significant change in the data series used by the NMDI (Figure 3). The northern region of the CAFC concentrates the highest NMDI values during all the months. The central region of the CAFC presented the lowest NMDI values during the analyzed months, with a predominance of the dry and very dry classes, indicating that this region is the driest in the corridor.
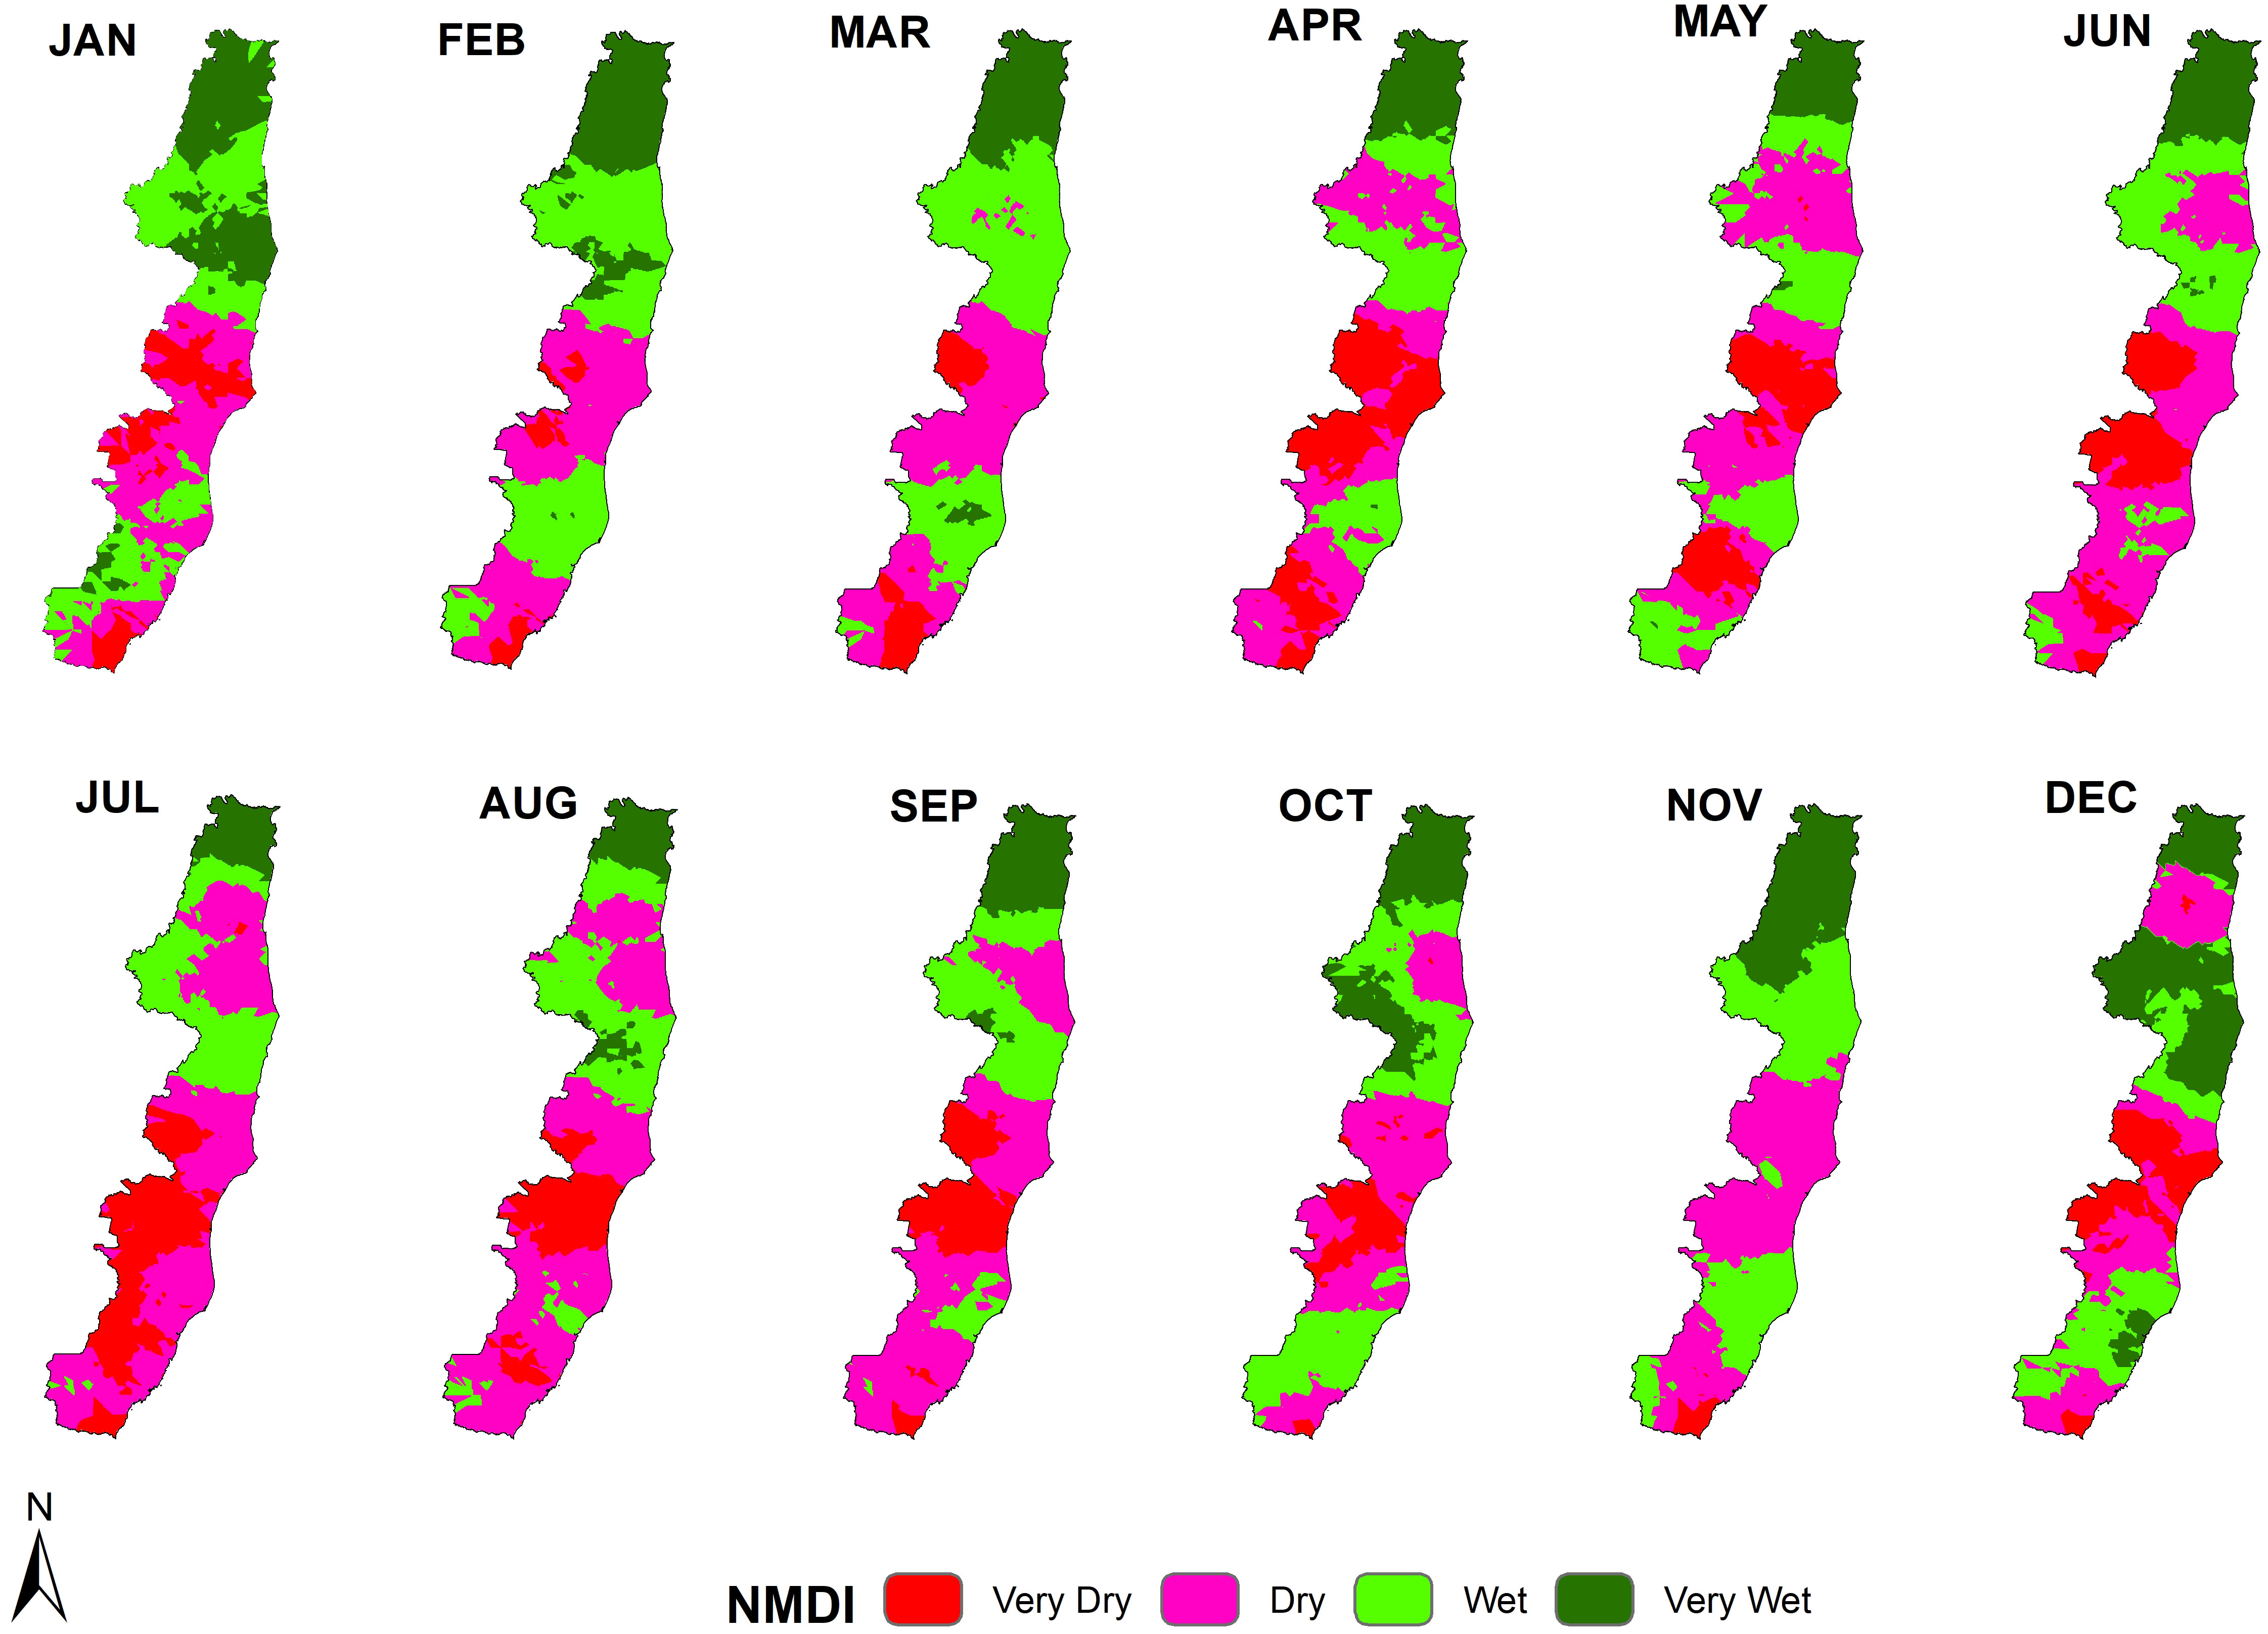
Figure 3 NMDI spatial analysis for the Pettit test (for the year 2014) in the Central Atlantic Forest Corridor.
Among the protected areas analyzed, four are located in drier areas, three in humid areas, and one, REBIO Una, had a divided monthly distribution, with six months in the dry classes and six in the humid classes. ESEC Wenceslau Guimarães is located in the northern region of the CAFC, which is the region with the highest NMDI values, and throughout 2014 the NMDI was classified as very wet. REBIO Córrego Grande and REBIO Córrego do Veado had low NMDI values during all the analyzed months, the latter with seven of the twelve months classified as very dry. This indicates a greater propensity for fire when compared to REBIO Comboios, which, among the analyzed months, had eight months with NMDI values classified in the wet class.
3.3 Soil moisture
In the spatial analysis of the soil moisture values, it is possible to identify in Figure 4 that the years 2003 and 2015 were those in which the classes with the lowest values were predominant (280.25 – 315.86 and 218.53 – 257.33). The highest values of soil moisture, represented in blue, were predominant in the CAFC in the years 2017 and 2005 (383.05 – 401.87 and 452.29 - 483.76). The northeastern region of the CAFC registered the occurrence of classes with higher soil moisture values, with the exception of 2017, 2018, and 2019, in which low values were registered. The southern region also showed a recurrence of classes with higher soil moisture values in twelve of the twenty years analyzed. The northwest and central regions of the corridor were those with the highest recurrence of lower soil moisture values during the study period. In these two regions there was a predominance of classes with lower values, and in the northwest region there was the occurrence of only higher soil moisture values in 2018.
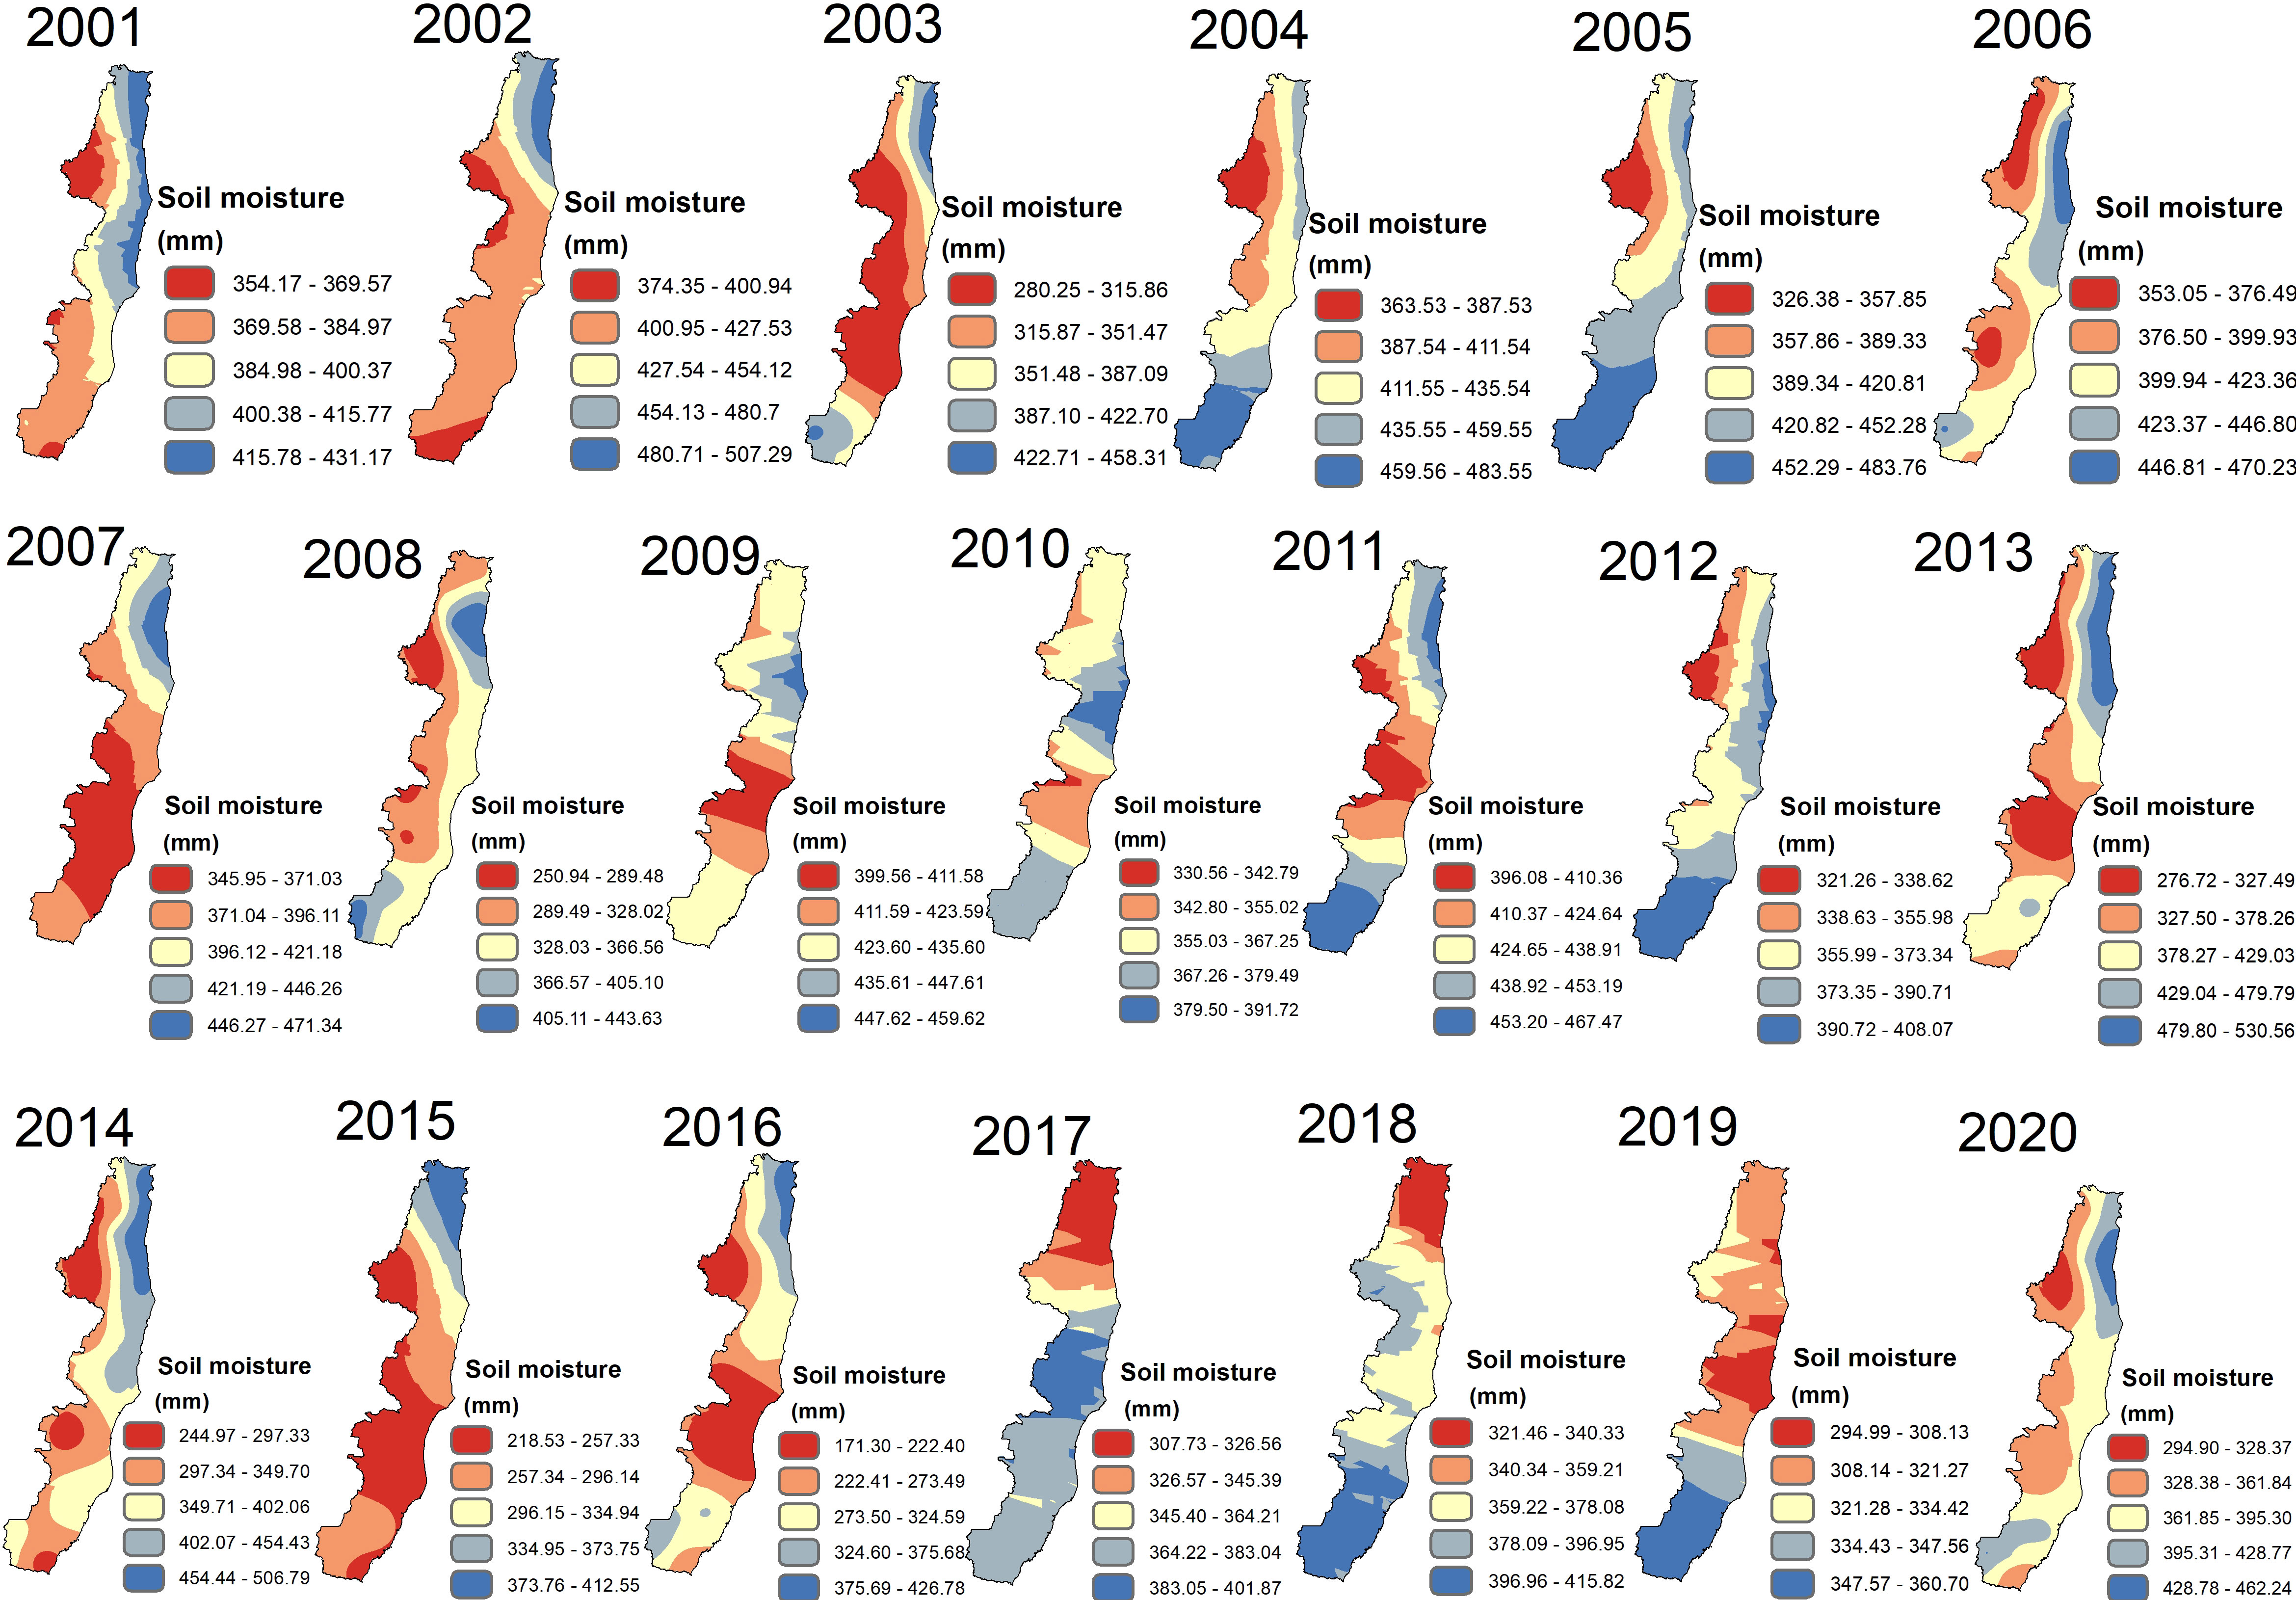
Figure 4 Spatiotemporal analysis of soil moisture in the Central Atlantic Forest Corridor, Brazil.
Among the protected areas, REBIO Una is the area with the highest soil moisture values during the study period, with 2017 and 2019 being the only years when the reserve had low values. The Córrego Grande, Córrego do Veado, and Sooretama reserves presented lower values during the analyzed period.
3.4 Spatial analysis of hotspots
The spatial analysis of hotspots from the Kernel density (Figure 5) indicates a concentration of hotspots in the southeastern area of the CAFC. This high concentration occurs in the metropolitan region of Vitória, the capital of the state of Espírito Santo, mainly at the territorial limits between the cities of Vitória and Serra. The Ilha do Lameirão municipal ecological station is located in this region and, among the protected areas, it has the highest record of the very high-density class, being identified in nineteen of the twenty years analyzed. These results indicate a high concentration of fire in this area that can cause habitat destruction and compromise the preservation of species protected by the ecological station.
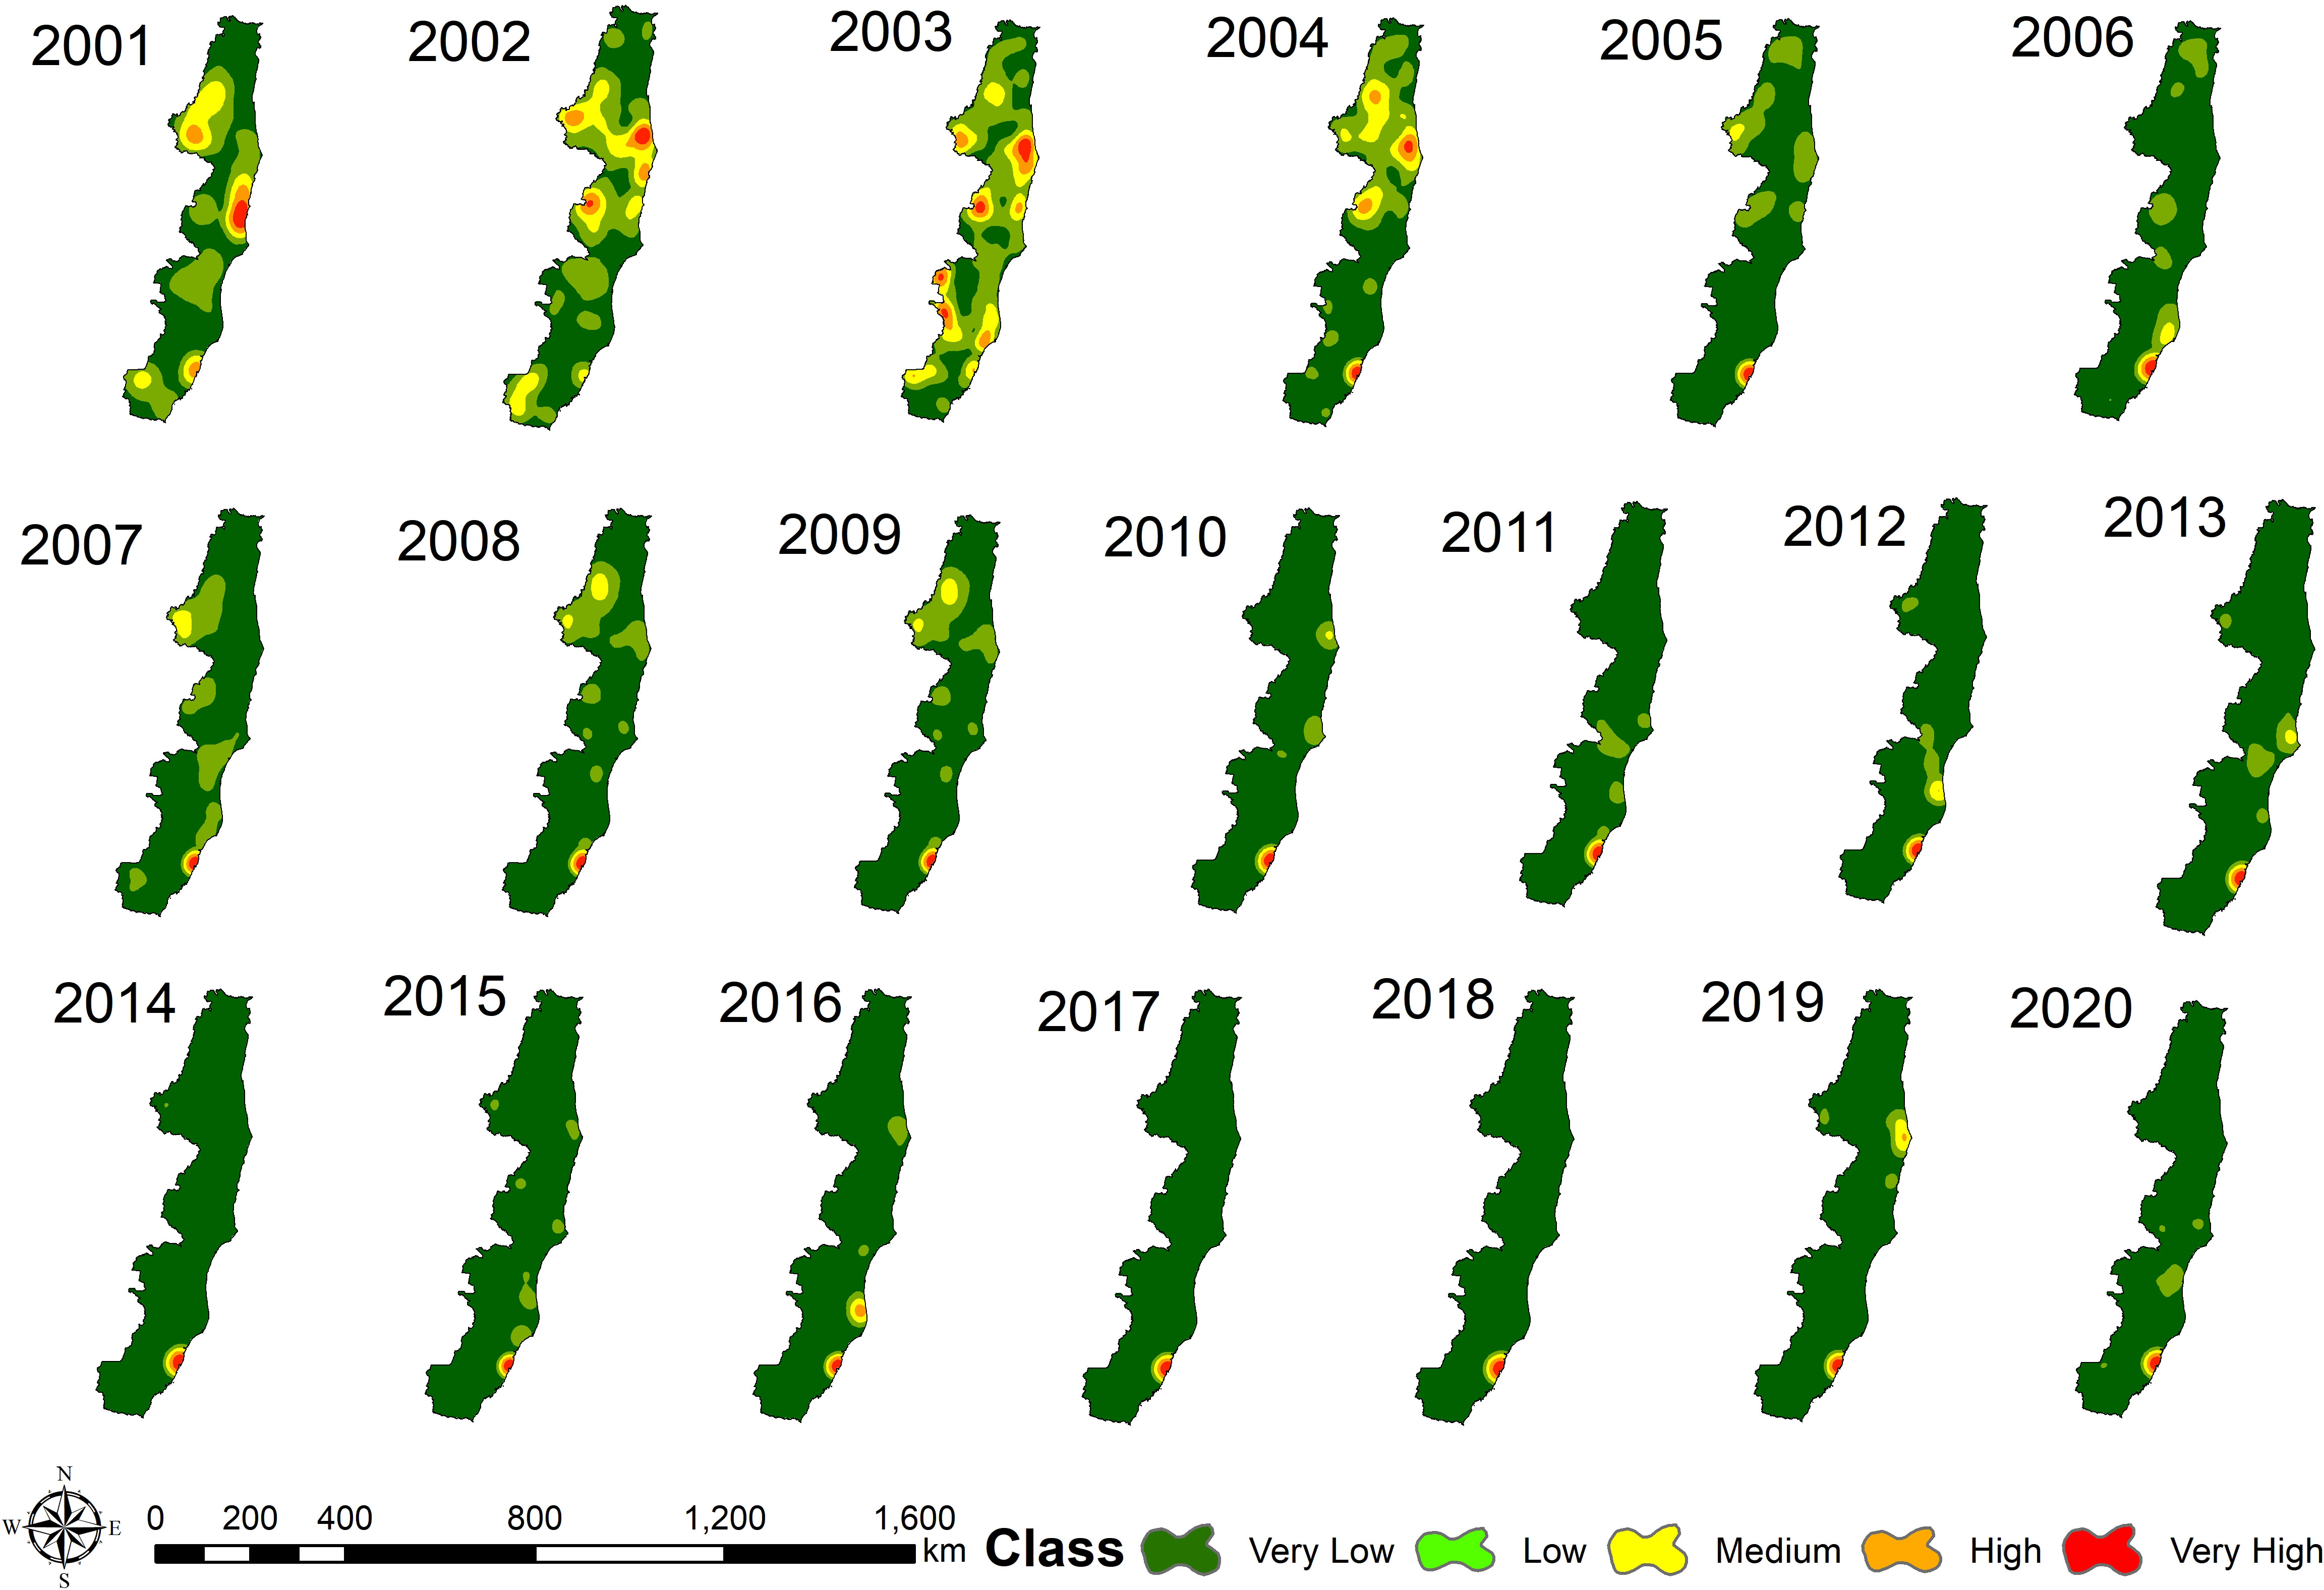
Figure 5 Kernel density of hotspots in the Central Atlantic Forest Corridor, Brazil.
REBIO Sooretama is the reserve with the highest occurrence of the upper class of Kernel density, being in five of the twenty years analyzed (2003, 2006, 2012, 2015, and 2016). REBIO Augusto Ruschi and ESEC Wenceslau Guimarães are the protected areas with the highest occurrence of the low class (15 and 14 years, respectively). Nevertheless, a recurrence of the upper and middle classes in the buffer zone of these units is identified, mainly in REBIO Augusto Ruschi. The occurrence of fire in these areas and in their vicinity can destroy the existing biota in these areas if the fire is not controlled and becomes a forest fire.
3.5 Climate analysis (baseline and future)
The climatological analysis of the temperature in the CAFC (Figure 6) during the baseline climate period, indicates an average corridor temperature of 22.97°C. The highest mean monthly temperature in this climate was registered in February and the lowest in July (25.10 and 20.31°C, respectively). The spatial analysis of the baseline indicates higher mean air temperature values in the central region of the CAFC, with values ranging between 22.53 and 24.27°C. The southern region of the CAFC concentrates the lowest mean temperature values between 19.91 and 21.65°C.
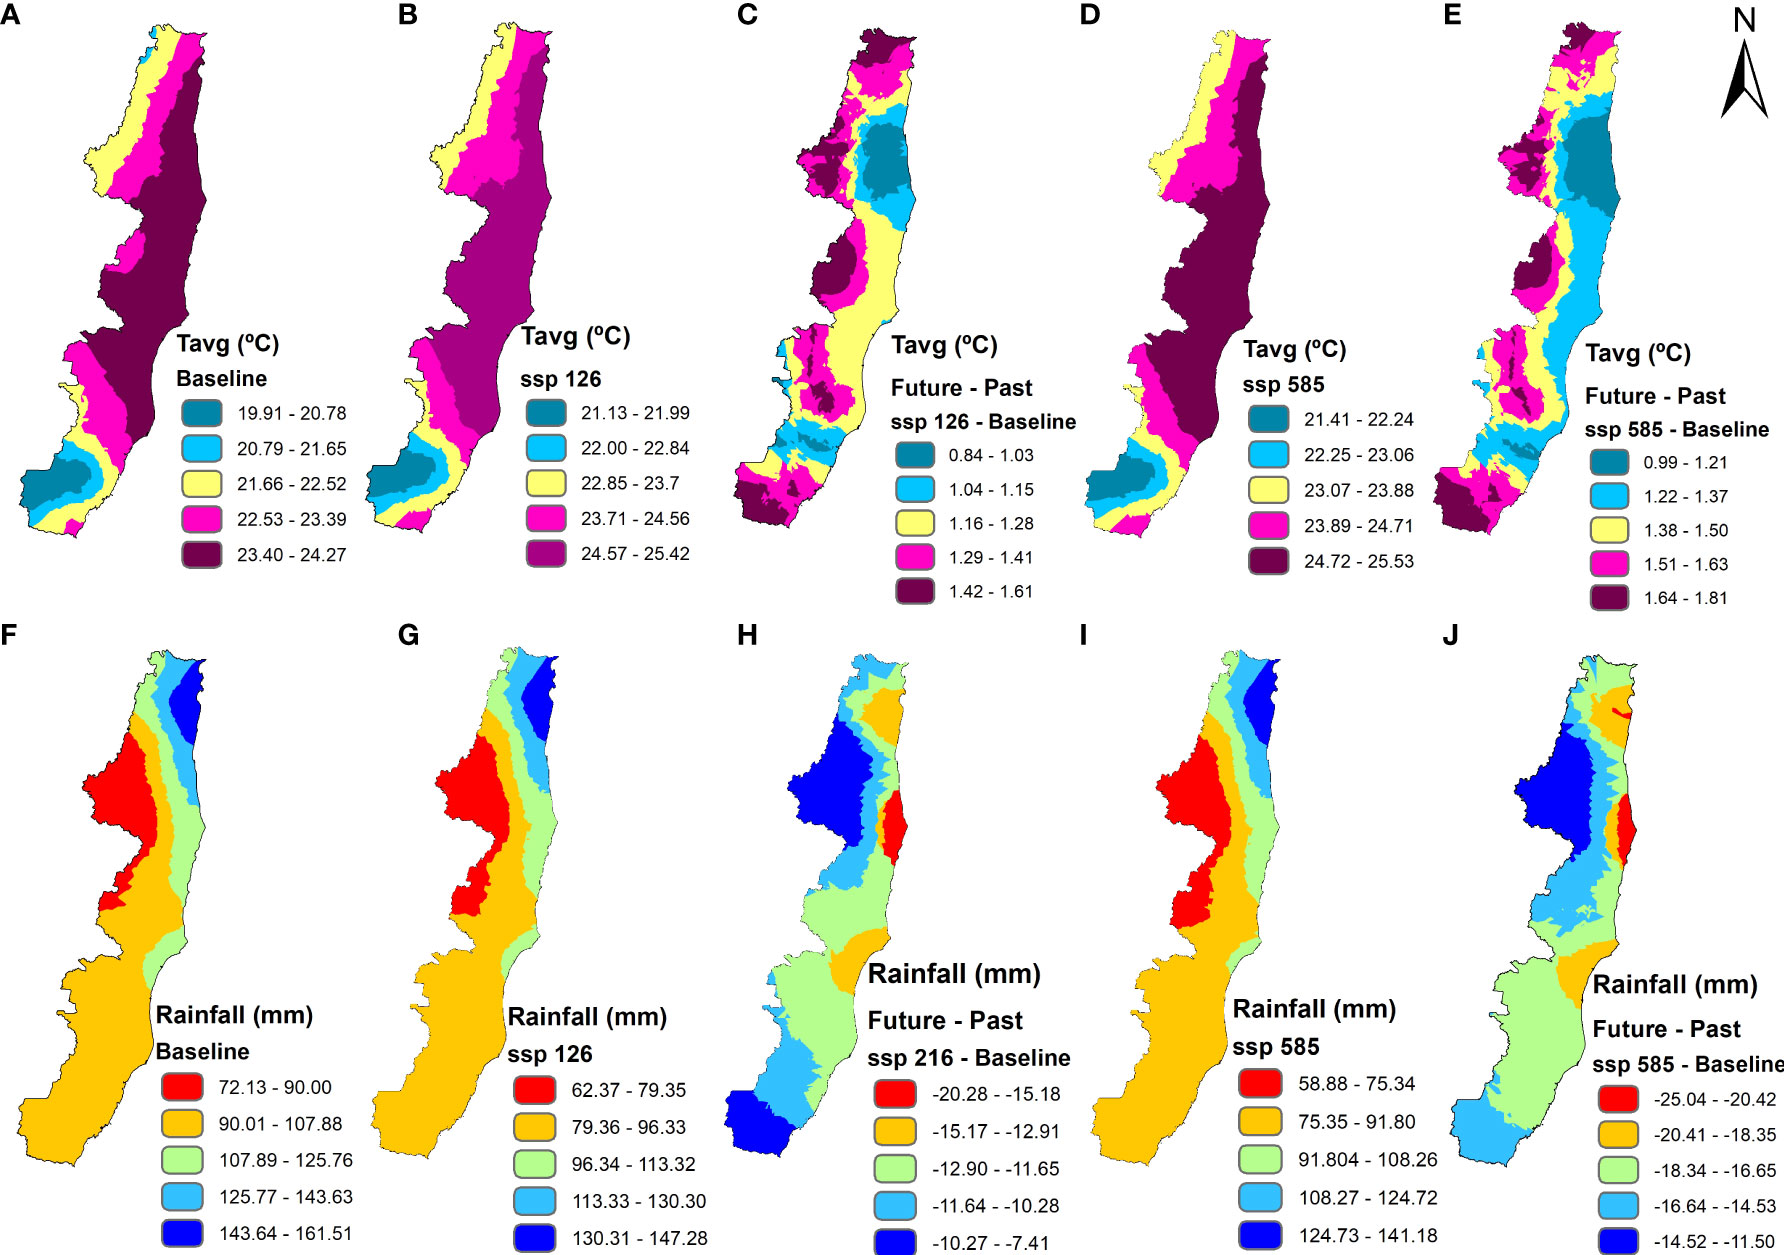
Figure 6 (A) mean air temperature (°C) Baseline; (B) mean air temperature (°C) scenario ssp126; (C) mean air temperature (°C) difference between scenario ssp126 and Baseline; (D) mean air temperature (°C) scenario ssp585; (E) mean air temperature (°C) difference between scenario ssp585 and Baseline; (F) rainfall (mm) Baseline; (G) rainfall (mm) scenario ssp126; (H) rainfall (mm) difference between scenario ssp126 and Baseline; (I) rainfall (mm) scenario ssp585; (J) rainfall (mm) difference between scenario ssp585 and Baseline.
For the SSP126 scenario, an increase of 1.26°C is registered in the mean air temperature of the CAFC; in addition, an increase in temperature is registered during every month in the analyzed scenario, with values above 26°C from January to March. For the SSP585 scenario, the mean air temperature in the CAFC will be 24.41°C; considering the baseline temperature, this value represents an increase of 1.44°C. In this scenario, all regions showed an increase in temperature of 1°C, with emphasis on the southern region where almost the entire area may have an increase of 1.8°C.
Rainfall in the CAFC presented a mean value of 103.86 mm in the baseline climate. The rainy period in the CAFC is from October to March and the dry period from April to September. November is the wettest month, with a mean value of 158.55 mm, on the other hand, the month of August is the driest with a mean of 61.95 mm.
For the SSP126 scenario, a reduction in rainfall is observed in the CAFC; the mean rainfall in this scenario is 92.27 mm, with a reduction of -11.59 mm when compared to the baseline mean. In this scenario, rainfall reduction is registered in every month, with a negative highlight for the month of November, when the reduction will be -39.88 mm, when compared to the baseline. When comparing the CAFC rainfall values in the SSP126 scenario with the baseline, it is possible to identify that all regions of the CAFC showed a reduction in rainfall.
For the SSP585 scenario, rainfall reductions are more accentuated when compared to the baseline. The mean rainfall in this scenario was 87.11 mm, which means a mean annual reduction of 16.75 mm. November also presented the largest monthly reduction in this scenario, with a decrease of -44.41 mm. When compared to the baseline, reductions in the SSP585 scenario can reach a decrease of 25.04 mm. The regions that present the lowest decreases are those that already present low rainfall values, and reductions of up to -16.64 mm in the annual mean can further compromise the water regime of these regions.
Among the priority areas for conservation of the CAFC, ESEC Wenceslau Guimarães shows the greatest increase in the simulated scenarios, with an increase of 1.48°C in SSP126 and 1.62°C in SSP585. In addition to the increase in the mean air temperature, this area would also be affected by reductions in mean annual rainfall, which may have decreases of -11.88 mm and -17.22 mm in the SSP126 and SSp585 scenarios, respectively. The increase in mean air temperature and the reduction in rainfall could compromise the role of this area as a stronghold for the conservation and protection of a variety of species in the Atlantic Forest.
The Sooretama Biological Reserve is one of the priority areas for conservation of the CAFC that shows high temperature increases of 1.34 °C and 1.52 °C in SSP126 and SSP585, respectively. In addition, mean rainfall may be reduced by up to -18.34 mm in the SSP585 scenario. The REBIO in Sooretama is one of the oldest protected areas at the level of protected areas in Brazil and its main objective is the integral preservation of the fauna and forest remnants of the Atlantic Forest (Ferreira et al., 1981). The presence of a variety of endangered species is recorded in its area, among which we can highlight the jaguar (Panthera onca), the brown jaguar (Puma concolor capricornensis), and the southeastern ringed woodpecker (Celeus torquatus tinnunculus) (ICMBio - Instituto Chico Mendes de Conservação da Biodiversidade, 2018). The imbalance in the climate conditions of this area may compromise the preservation of these species and aggravate the extinction process.
3.6 Past and future analysis of the NMDI
The northern region of the CAFC, in which the Wenceslau Guimarães Ecological Station is located, concentrates the highest NMDI values for the past (Figure 7). Future data from the NMDI indicate that this area should continue to show the highest values of the index in the CAFC; however, as with the other areas of the CAFC, this region should show a reduction, as shown in the overlay map between future and past. This reduction in the NMDI indicates an increase in drought and fire propensity in the vicinity of ESEC Wenceslau Guimarães, which could compromise the role of this protected area in the maintenance of Atlantic Forest remnants, in addition to the protection of endangered species such as the maned sloth (Bradypus torquatus), (Evangelista et al., 2019; INEMA (Instituto do Meio Ambiente e Recursos Hídricos), 2021).
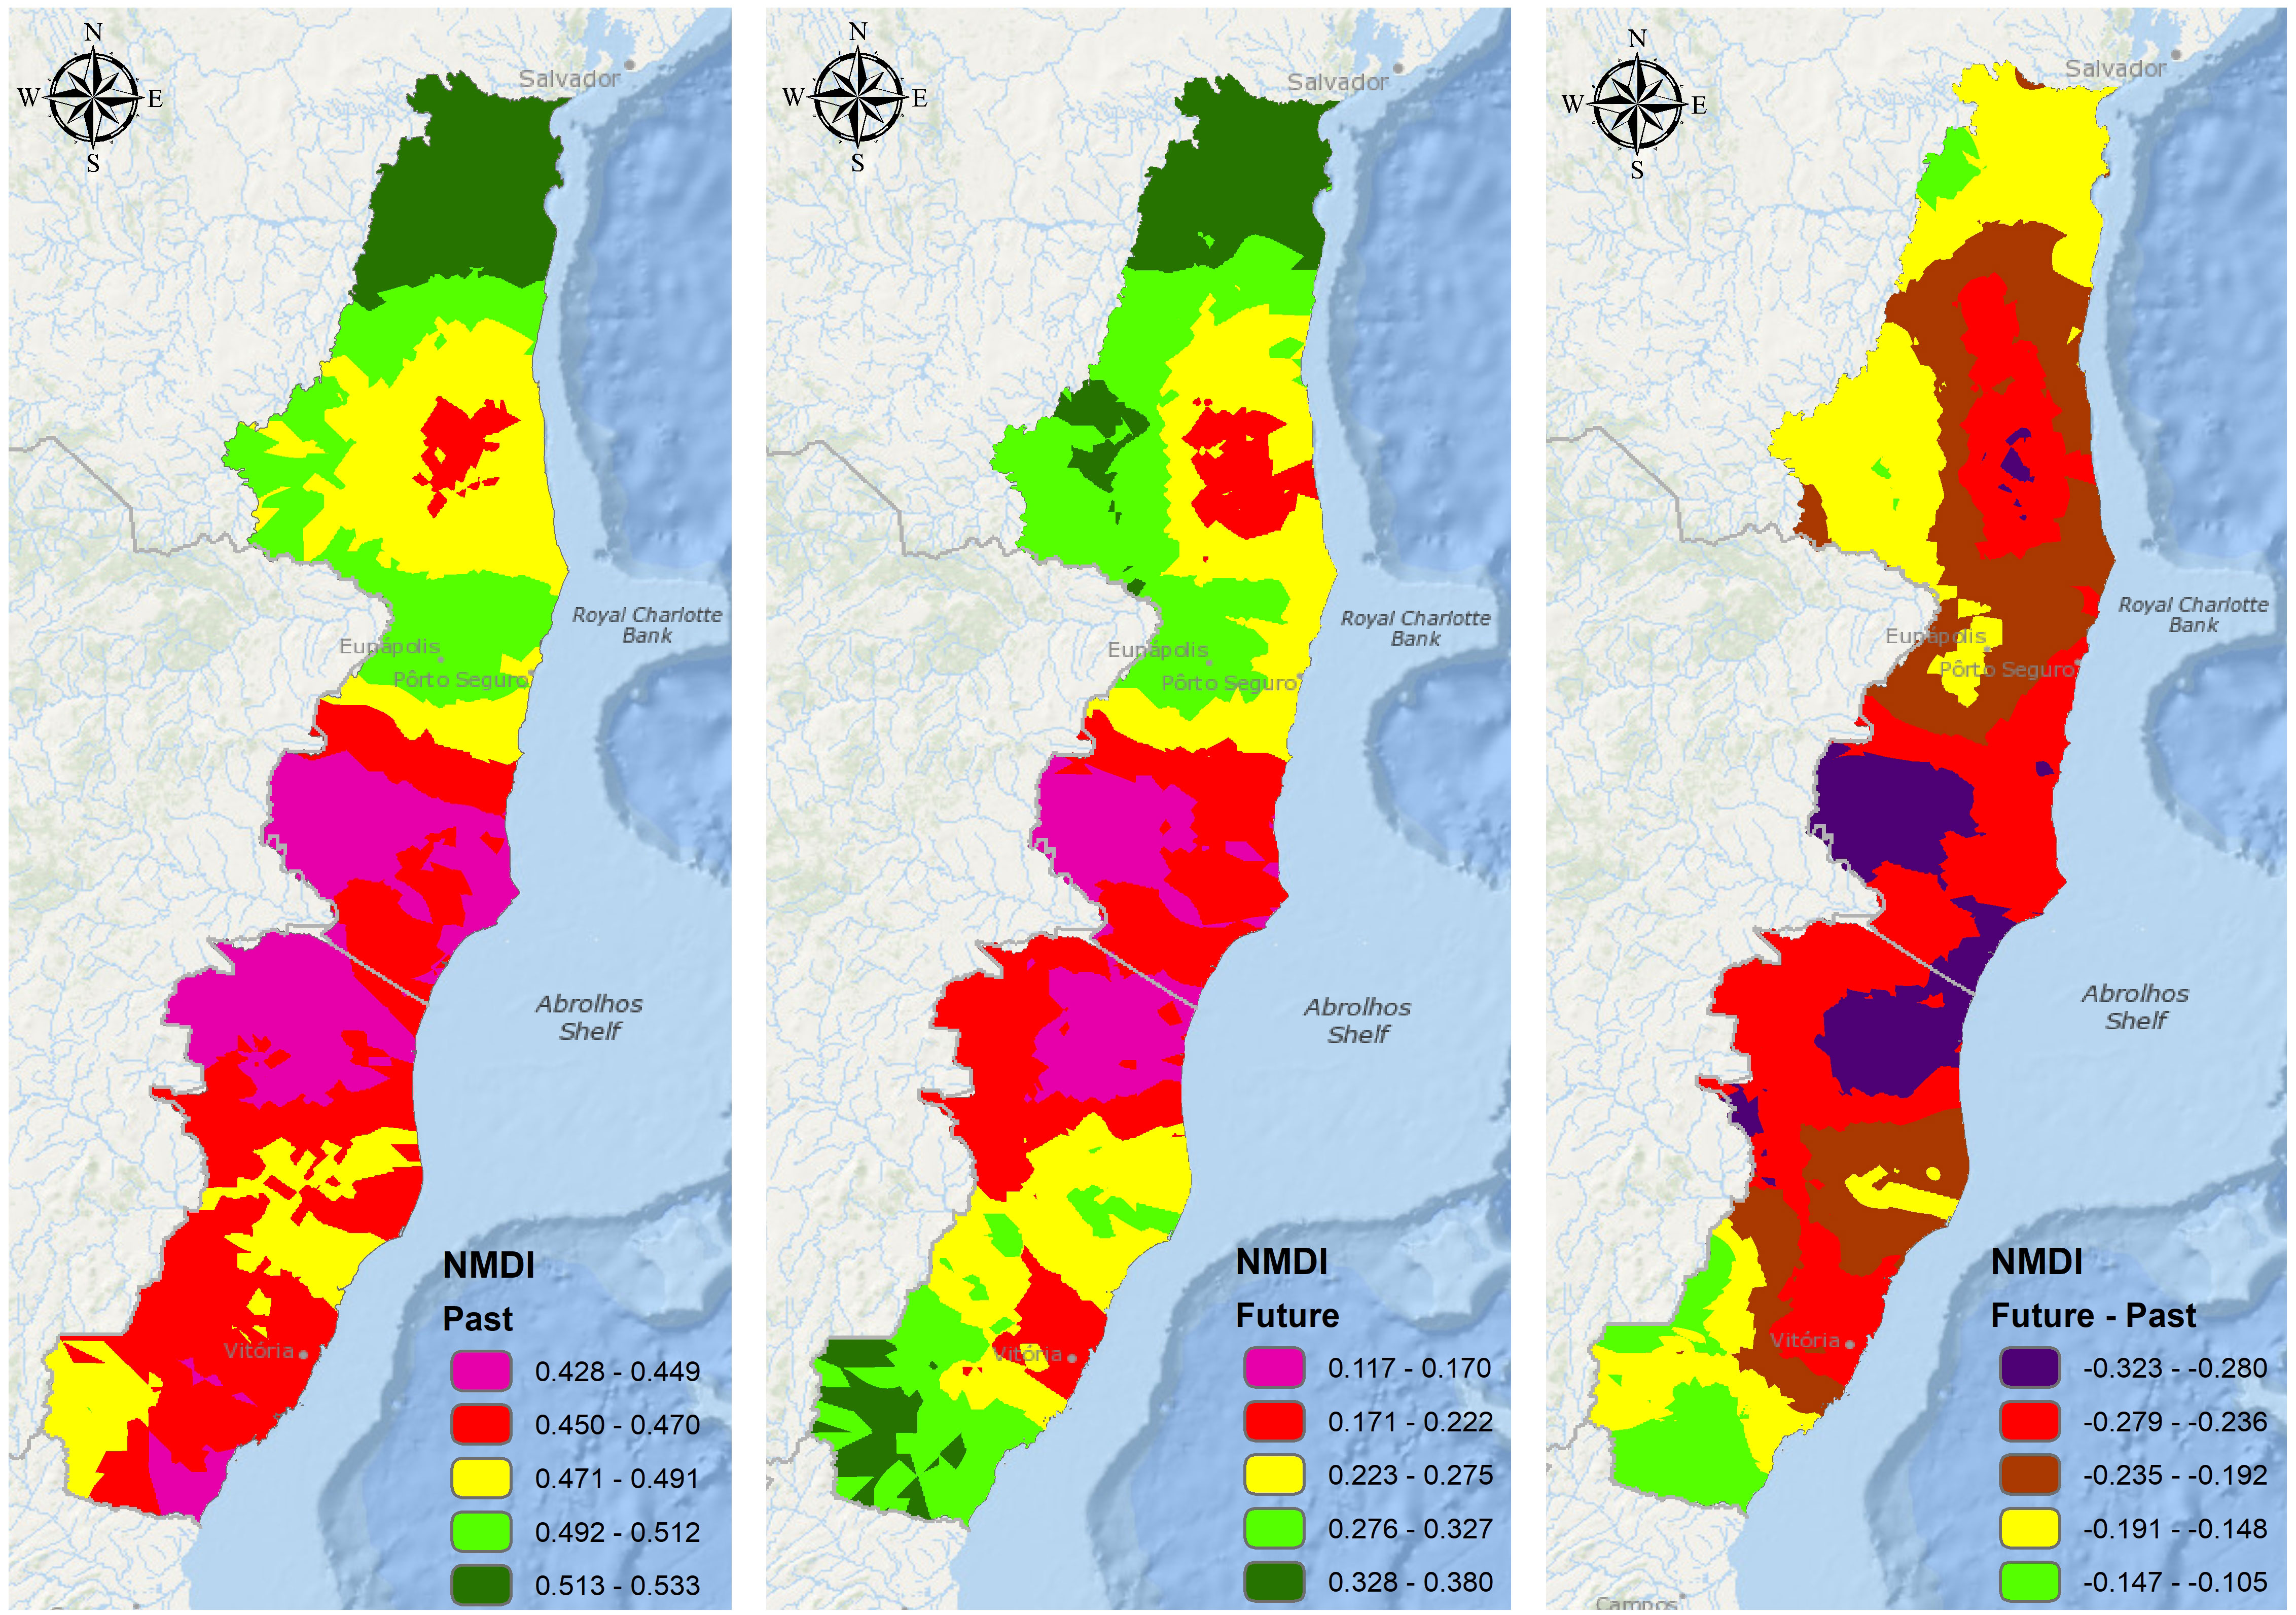
Figure 7 Spatial variation of the past, future simulation, and difference (future-past) of the normalized multi-band drought index (NMDI) in the Central Atlantic Forest Corridor, Brazil.
ESEC Ilha do Lameirão Municipal is located in an area that presents low NMDI values, shown in red, and should present large reductions in the future, which indicates an increase in drought in this area. The region in which ESEC Ilha do Lameirão Municipal is located already has a high occurrence of hotspots and with the potential for drought, the number of fires should increase.
Among the Biological Reserves (REBIO), REBIO Una is located in an area with higher NMDI values. However, these values are considered intermediate when compared with other areas of the CAFC. The areas of REBIO Una should present intermediate values in the future, although this means a reduction in NMDI values close to 50%, when compared to the past. REBIO Una is home to a variety of species of flora and fauna, including the golden-headed lion tamarin (Leontopithecus chysomelas), a species considered to be in danger of extinction, with its conservation being one of the foci for the creation of the REBIO Una (Moura, 2003).
REBIO Córrego do Veado is located in the central part of the CAFC. This area concentrates the lowest NMDI values for the past, represented in pink. The future projection indicates that the REBIO Córrego do Veado area is among those with the greatest reductions in the NMDI, so this area should present a reduction in its biomass and have an increase in the occurrence of forest fires, which could compromise the conservation of several species of flora and fauna, especially birds, of which 187 species have already been recorded, 11 of which are threatened and 21 endemic to the Atlantic Forest (Faria et al., 2016).
Overall, spatial distribution values for the future indicate a reduction in the NMDI in all CAFC areas compared to past values. The northern region continues to be that with the highest values and the central region with the lowest values. The expansion of areas with low NMDI values in the CAFC indicates an intensification of fires and forest fires, especially in the central region.
4 Discussion
Despite an abundance of data and information regarding the impacts of fires on tropical forests, the occurrence of fire in these areas remains a recurrent problem. As shown in the present study, there is a recurrence of fire throughout the Central Atlantic Forest Corridor (CAFC) during the period from 2001 to 2020. The occurrence of fire in the CAFC was also demonstrated in the studies of Santana et al. (2021) and Santana et al. (2020), in which the authors report the influence of human activities and climate on the occurrence and spread of fire. In the study by Santana et al. (2021), the authors used a model to identify that the central and northwestern regions of the CAFC are the most susceptible to forest fires and this is due to agricultural activities in these regions, in addition to the dry climate, which acts as an intensifier for increased fire.
The occurrence of fire in the Brazilian Atlantic Forest was also identified in regions other than the corridor, as presented in the studies by Silva et al. (2021); Santos et al. (2021), Freitas et al. (2020), and Andrade et al. (2019). These studies present the temporal distribution of fire from the north to the south of the Atlantic Forest. The recurrence of fire in this forest domain jeopardizes attempts to recover and conserve an area with a high level of degradation, with only 12.4% of its original area currently remaining (Santana et al., 2020). In addition to the Atlantic Forest, the occurrence of fires in other tropical forests has been increasingly recurrent, and the long-term impacts of this large-scale disturbance on forest domains remain difficult to evaluate (Fischer, 2021).
In addition to compromising large forest domains such as the Amazon, the Cerrado, the Pantanal, and the Atlantic Forest (Silva Junior et al., 2019), human activities threaten the role of protected areas in conserving natural resources throughout the world (Mansuy et al., 2019). Our results indicate the occurrence of foci in protected areas and their buffer zones due to the high density of hotspots identified in these areas. The occurrence of fire and/or deforestation in protected areas is nothing new and is often caused by conflicts related to land use (Pontes et al., 2020). These interferences end up being recurrent in several protected areas and this compromises the role of these areas in preserving and protecting biodiversity. Protected areas function as an important tool for the preservation of many species threatened with extinction. The Atlantic Forest houses 50.5% of the species threatened with extinction in Brazil, 38.5% of which are endemic to this forest domain (ICMBio - Instituto Chico Mendes de Conservação da Biodiversidade, 2018). The occurrence of fire in these areas can cause the destruction of the habitats of several species and thus accelerate the disappearance of many species.
The results of fire incidence in protected areas in Brazil, as presented in certain studies (Torres et al., 2017; Jesus et al., 2020) and the deforestation record in these areas (Mapbiomas, 2020), indicate the need for improved investments in management and planning by the government and environmental agencies. The lack of surveillance in the combat of human activities inside the unit or in its buffer zone (Bacha, 2020), coupled with budget cuts in environmental agencies, compromise the effectiveness of protected areas.
Among the impacts caused by forest fires is the reduction in forest biomass and a slowdown in the forest regeneration process. In the study by Silva et al. (2018) for the Brazilian Amazon, the authors found that forest fires in tropical rainforests can significantly reduce forest biomass for decades as forest fires slow or paralyze post-fire recovery of forests (Silva et al., 2018). A reduction in biomass and a slowdown in the forest recovery process was also identified in African tropical forests by Fischer (2021), who identified a 46% reduction in tropical forest biomass on Mount Kilimanjaro (Tanzania), and this reduction could still reach 80% if there is a recurrence of fire.
Climate is an important component in the process of occurrence and spread of forest fires. The increase in temperature due to climate change and its impacts on forests, such as increased evaporation of water from the soil and reduced humidity, contributed to the number of forest fires doubling since 1984. According to the report released by the Intergovernmental Panel on Climate Change (IPCC, 2021), human actions were responsible for an increase of 1.07°C in the temperature of the Earth’s surface, and if changes are not adopted to reduce greenhouse gas emissions, the Earth’s temperature should continue to increase in the coming decades.
The increase in air temperature and the reduction in rainfall in all areas of the CAFC is an alert for the need to adopt measures to mitigate the impacts of climate change on tropical forests. The increase in temperature and the reduction in rainfall tend to make areas drier, thus favoring the spread of fire used indiscriminately in areas of crops and pastures. These climate changes should also affect agricultural production as crop growth is influenced by climatic variation due to physiological processes of plants that respond directly to changes in meteorological variables such as air and/or soil temperature, relative humidity, rain, and wind speed.
Among the agricultural crops in the CAFC, the production of cocoa in the north and northeastern regions of the corridor stands out. This area corresponds to the southern mesoregion of the state of Bahia, one of the largest cocoa producers in Brazil, which was one of the centers of cocoa production and export in the world throughout the 20th century (Xavier et al., 2021). The water deficit caused by reduced rainfall and increased temperature can affect the productivity of this species due to physiological and biochemical damage (Borjas Ventura et al., 2019), compromising an entire production chain. In addition to cocoa production, the CAFC area also stands out in coffee production. The state of Espírito Santo, which corresponds to the southern region of the CAFC, is the second largest coffee producer in Brazil, with Brazil being the largest producer in the world. With climate change, the area suitable for coffee cultivation and production may be reduced. In the period from 1974 to 2017, the temperature in coffee producing municipalities in Brazil increased by ± 0.25°C per decade and rainfall decreased, resulting in a 20% reduction in coffee production in the southeastern region of Brazil (Koh et al., 2020). Some CAFC regions with coffee production may have an increase of almost 2°C by 2040, which could compromise the cultivation of this species if there is no adaptation in the producing regions.
The use of indices in the monitoring of forest fires is a well-established practice in certain countries such as Canada, with the Forestry Canada Fire Danger Group (Canada. Forestry Canada et al., 1992), and Australia (Sneeuwjagt and Peet, 1985). In Brazil and in other South American countries, this practice is yet to be employed. The application of the NMDI showed good results in identifying which years and areas of the CAFC were drier during the study period. The spatial distribution of the NMDI in the study area in 2014 indicates that the central area of the CAFC is the driest, which indicates that it is the area of the Corridor most prone to the occurrence of fires. This result corroborates the findings of Santana et al. (2021), who identified the central region of the CAFC as the most susceptible to the occurrence of forest fires. The results of our future projections for the NMDI indicate that the central region may have an increase in the occurrence of fires given that this region is expected to become drier. The NMDI’s ability to detect fires has already been proven in other studies for southern Georgia, USA, and southern Greece (Wang et al., 2008), Alberta, Canada (Akther and Hassan, 2011), and for Atlantic Forest in Rio de Janeiro, Brazil (Santos et al., 2021)
In addition to the increase in drought in the CAFC making areas more prone to forest fires, it can also affect the structure and dynamics of forests, reducing the growth and survival of trees and increasing the mortality rate (Rocha et al., 2020). Climate change and increased drought can also intensify socio-economic inequalities between countries and regions. The coastal areas of South America, the region in which the CAFC is located, are identified as some of the regions with high socioeconomic risk due to the future increase in the occurrence of droughts (Liu and Chen, 2021).
Forest fires can cause several negative impacts for tropical forests. The reduction in rainfall and the increase in temperature tend to leave some regions drier and with this, increase the occurrence of fires. The use of models to simulate and predict future scenarios is extremely important to assist in fire planning and monitoring. The ARIMA model used in this study showed satisfactory results in the NMDI spatiotemporal modeling, enabling identification of the CAFC areas that will become drier and, therefore, may be more prone to the occurrence of fires. The reliability of using the ARIMA model for temporal modeling of environmental variables in tropical forests has been shown in other studies on the Atlantic Forest (Silva Junior et al., 2019; Santana et al., 2020; Vilanova et al., 2020; Santos et al., 2021).
5 Conclusion
NMDI modeling made it possible to identify which areas of the Central Atlantic Forest Corridor are drier. Based on the results generated in this research, the central region of the CAFC is drier and more prone to the occurrence of forest fires. Among the protected areas, ESEC Ilha do Lameirão Municipal has the lowest NDMI values. The data from the future projection of the NMDI for the 2020–2040 period indicate that this scenario is unlikely to change unless public policies are adopted to combat this problem. Droughts in the CAFC are expected to intensify with an increase in temperature and a reduction in rainfall, which could compromise the role of the CAFC and its protected areas in conserving and preserving the forest remnants of the Atlantic Forest and in serving as a source of a variety of endangered species and ecosystem services.
The use of the autoregressive integrated moving average model (ARIMA) model for spatial modeling of the normalized multi-band drought index (NMDI) in the Central Atlantic Forest Corridor area showed good results. However, the understanding of fire dynamics and environmental processes can be improved with the use of more information and other models. To that end, we propose the possibility of studies that can work on different spatial and temporal scales. Another possibility is to work at the level of CAFC protected areas to identify the role and importance of these areas in the conservation and protection of forest remnants of tropical forests.
The results found in this study may contribute to the understanding of environmental processes in the area of the Central Atlantic Forest Corridor and may serve as a basis for the application of other studies in other tropical forest areas. The CAFC is of great importance for the maintenance and conservation of Atlantic Forest remnants, in addition to its social and economic importance. The results of future modeling indicate that management and conservation measures urgently need to be adopted and applied in order to protect the Atlantic Forest’s natural resources.
Data availability statement
The original contributions presented in the study are included in the article/supplementary material. Further inquiries can be directed to the corresponding author.
Author contributions
Conceptualization: RS, RD, and AS; formal analysis: RS, RD, and AS; investigation: RS, AS, and RD; resources: RD; data curation: AS and RD; writing-original draft preparation: RS, AS, and RD; writing—review and editing: RD and AS; visualization: RS, RD, and AS; supervision: AS and RD; project administration: RD and AS. All authors contributed to the article and approved the submitted version.
Acknowledgments
The authors would like to thank NASA for the free availability of the data used. The Coordination for the Improvement of Higher Education Personnel - CAPES for the granting of a doctoral scholarship. The second author thanks the funding Research Support Foundation of the State of Rio de Janeiro – FAPERJ. The last author pleases the CNPq Research Productivity grant (process 310464/2020-0). Civil society, which allows through its investment, that the public and free university works and produces scientific research, with this we can produce practical and functional knowledge, giving a return to the Brazilian people.
Conflict of interest
The authors declare that the research was conducted in the absence of any commercial or financial relationships that could be construed as a potential conflict of interest.
Publisher’s note
All claims expressed in this article are solely those of the authors and do not necessarily represent those of their affiliated organizations, or those of the publisher, the editors and the reviewers. Any product that may be evaluated in this article, or claim that may be made by its manufacturer, is not guaranteed or endorsed by the publisher.
References
Akther M. S., Hassan Q. K. (2011). “Remote sensing-based assessment of fire danger conditions over boreal forest,” in IEEE Journal of Selected Topics in Applied Earth Observations and Remote Sensing, Vol. 4. 992–999. doi: 10.1109/jstars.2011.2165940
Alvares C. A., Stape J. L., Sentelhas P. C., de Moraes G., Leonardo J., Sparovek G. (2013). K¨oppen’s climate classification map for Brazil. Meteor. Zeitsc. 22, 711–728. doi: 10.1127/0941-2948/2013/0507
Andrade C. F., Duarte J. B., Barbosa M. L. F., de Andrade M. D., de Oliveira R. O., Delgado R. C., et al. (2019). Fire outbreaks in extreme climate years in the state of Rio de Janeiro. Brazil. L. Degrad. Dev. 30, 1379–1389. doi: 10.1002/ldr.3327
Bacha C. J.C.. (2020). As unidades de conservação do Brasil. Revista de Economia Sociologia Rural 30 (4), 339–358. Available at: http://www.resr.periodikos.com.br/article/5ea0c1ce0e8825ad40c84920/pdf/resr-30-4-339.pdf. (Accessed 02-05- 2021).
Barbosa M. L. F., Delgado R. C., Teodoro P. E., Pereira M. G., Correia T. P., de Mendonça B. A. F., et al. (2019). Occurrence of fire foci under different land uses in the state of Amazonas during the 2005 drought. Environ. Dev. Sustain. 21, 2707–2720. doi: 10.1007/s10668-018-0157-4
Bennett A. C., Dargie G. C., Cuni-Sanchez A., Mukendi J. T., Hubau W., Mukinzi J. M., et al. (2021). Resistance of African tropical forests to an extreme climate anomaly. Proc. Natl. Acad. Sci. 118 (21). doi: 10.1073/pnas.2003169118
Blundo C., Carilla J., Grau R., Malizia A., Malizia L., Osinaga-Acosta O., et al. (2021). Taking the pulse of earth's tropical forests using networks of highly distributed plots. Biol. Conserv. 260, 108849. doi: 10.1016/j.biocon.2020.108849
Borjas Ventura R., Mendoza Soto V., Julca Otiniano A., Lupino Gratão P. (2019). Efeito do déficit hídrico e do aumento de temperatura sobre variáveis produtivas fisiológicas e bioquímicas do" cacau" theobroma cacao l. Arnaldoa 26 (1), 287–296. doi: 10.22497/arnaldoa.261.26112
Brando P. M., Balch J. K., Nepstad D. C., Morton D. C., Putz F. E., Coe M. T., et al. (2014). Abrupt increases in Amazonian tree mortality due to drought–fire interactions. Proc. Natl. Acad. Sci. 111 (17), 6347–6352. doi: 10.1073/pnas.1305499111
Brasil O. (2006). O corredor central da Mata Atlântica: uma nova escala de conservação da biodiversidade. Ministério do Meio Ambiente. Conservação Internacional e Fundação SOS Mata Atlântica.
Canada. Forestry Canada Fire Danger Group. (1992) Development and structure of the Canadian forest fire behavior prediction system. (Ottawa, Canada: Forestry Canada, Headquarters, Fire Danger Group and Science and Sustainable Development Directorate, (Ottawa)). 3.
Cassell B. A., Scheller R. M., Lucash M. S., Hurteau M. D., Loudermilk E. L. (2019). Widespread severe wildfires under climate change lead to increased forest homogeneity in dry mixed-conifer forests. Ecosphere 10 (11), e02934. doi: 10.1002/ecs2.2934
Chandler C., Cheney P., Thomas P., Trabaud L., Williams D. (1983). Fire in forestry. volume 1. forest fire behavior and effects. volume 2. forest fire management and organization (New York, USA: John Wiley & Sons, Inc).
Chelli S., Maponi P., Campetella G., Monteverde P., Foglia M., Paris E., et al. (2015). Adaptation of the Canadian fire weather index to Mediterranean forests. Natural Hazards. 75, 1795–1810. doi: 10.1007/s11069-014-1397-8
Crepaldi M. O. S., Pinto L. P., Lamas I. R., Fonseca M., Mesquita C. A. B. (2015) Joias do patrimônio natural as unidades de serviço do corredor central da mata atlântica. 1eded.Belo horizonte: conservação internacional. Available at: http://www.terrabrasilis.org.br/ecotecadigital/images/abook/pdf/2sem2015/outubro/Uma%20Rede%20no%20Corredor.pdf (Accessed 2 September 2019).
Dietze E., Mangelsdorf K., Andreev A., Karger C., Hopmans E. C., Schreuder L. T., et al. (2019). “Anhydrosugars in sediments of lake el'gygytgyn-fire regime reconstructions of ne Siberia during the last two interglacials,” in 29th International Meeting on Organic Geochemistry. European Association of Geoscientists & Engineers, 2019 (1), 1–2.
Evangelista M., Valente E. D. B., Bastos C. J. P., Bôas-Bastos S. B. V. (2019). Musgos (Bryophyta) da Estação Ecológica Wenceslau Guimarães, Estado da Bahia, Brasil¹. Hoehnea.
Faria L. C., Carrara L. A., de Tarso P., Z. A., Matos J. R. (2016). Avifauna da reserva biológica do córrego do veado, um dos últimos redutos de floresta atlântica de tabuleiros do espírito Santo, brasil. cotinga, (Brasil: Espírito Santo). Vol. 38. 47–59. Available at: https://www.researchgate.net/profile/Paulo-Antas-2/publication/308079625_Avifauna_da_Reserva_Biologica_do_Corrego_do_Veado_um_dos_ultimos_redutos_de_Floresta_Atlantica_de_Tabuleiros_do_Espirito_Santo_Brasil/links/57d9630408ae6399a39ad2fd/Avifauna-da-Reserva-Biologica-do-Corrego-do-Veado-um-dos-ultimos-redutos-de-Floresta-Atlantica-de-Tabuleiros-do-Espirito-Santo-Brasil.pdf. (Accessed 02-05- 2022).
Ferreira L. M., Borges G. C., Rocha S. B. (1981). Plano de manejo: Reserva biologica de sooretama ([Espirito Santo, Brasil]).
Freitas W. K., Gois G., Pereira E. R. Jr, Junior J. O., Magalhães L. M. S., Brasil F. C., Sobral B. S., et al. (2021). Influence of fire foci on forest cover in the Atlantic Forest in Rio de Janeiro, Brazil. Ecological Indicators 115, 106340. doi: 10.1016/j.ecolind.2020.106340
Fischer R. (2021). The long-term consequences of forest fires on the carbon fluxes of a tropical forest in Africa. Appl. Sci. 11 (10), 4696. doi: 10.3390/app11104696
Freitas W. K., Gois G., Pereira E. R. Jr, Junior J. O., Magalhães L. M. S., Brasil F. C., et al. (2021). Influence of fire foci on forest cover in the Atlantic Forest in Rio de Janeiro, Brazil. Ecological Indicators 115, 106340. doi: 10.1016/j.ecolind.2020.106340
Gholamnia K., Gudiyangada Nachappa T., Ghorbanzadeh O., Blaschke T. (2020). Comparisons of diverse machine learning approaches for wildfire susceptibility mapping. Symmetry 12 (4), 604. doi: 10.3390/sym12040604
Hyndman R., Athanasopoulos G., Bergmeir C., Caceres G., Chhay L., O’Hara-Wild M., et al. (2020). Forecast: Forecasting functions for time series and linear models, R Core Team (Austrália: Melbourne).
Hyndman R. J., Khandakar Y. (2008). Automatic time series forecasting: the forecast package for. J. Stat. Software. 26 (3), 1–22. doi: 10.18637/jss.v027.i03
IBGE, Instituto Brasileiro de Geografia e Estatística (2020) Estimativas da população residente no brasil e unidades da federação com data de referência em 1o de julho de 2016 (Accessed 02-05-2020).
ICMBio - Instituto Chico Mendes de Conservação da Biodiversidade (2018). Livro vermelho da fauna brasileira ameaçada de extinção. 1 (1) (ICMBio/MMA: Brasília, DF). Available at: http://www.icmbio.gov.br/portal/component/content/article/10187. (Accessed 02-05- 2022).
INEMA (Instituto do Meio Ambiente e Recursos Hídricos) (2021) Estação ecológica de wenceslau guimarães. instituto do meio ambiente e recursos hídricos. Brasília, DF: ICMBio/MMA. Available at: http://www.inema.ba.gov.br/gestao-2/unidades-de-conservacao/estacaoecologica/estacao-ecologica-de-wenceslau-guimaraes/ (Accessed 02-05-2021).
IUCN (2008) International Union for Conservation of Nature. Guidelines for applying protected area management categories. Available at: https://portals.iucn.org/library/efiles/documents/PAPS-016.pdf (Accessed 02-05- 2021).
IUCN (2021) International Union for Conservation of Nature. Guidelines for applying protected area management categories. Available at: https://www.ipcc.ch/site/assets/uploads/2019/08/4.SPM_Approved_Microsite_FINAL.pdf (Accessed 02-09-2021).
IPCC (2021) Climate change and land: an IPCC special report on climate change, desertification, land degradation, sustainable land management, food security, and greenhouse gas fluxes in terrestrial ecosystems. Available at: https://portals.iucn.org/library/efiles/documents/PAPS-016.pdf (Accessed 02-05- 2021).
Jesus J. B. D., Rosa C. N. D., Barreto Í. D. D. C., Fernandes M. M. (2020). Análise da incidência temporal, espacial e de tendência de fogo nos biomas e unidades de conservação do brasil. Ciec. Florestal. 30, 176–191. doi: 10.5902/1980509837696
Lamas I. R., Crepaldi M. O. S., Mesquita C. A. B. (2015)Uma rede no corredor: memórias da rede de gestores das unidades de conservação do corredor central da mata atlântica. 1. Available at: http://www.terrabrasilis.org.br/ecotecadigital/images/abook/pdf/2sem2015/outubro/Uma%20Rede%20no%20Corredor.pdf (Accessed 2 September 2019).
Lemos N. S. A., Cunha J. M. (2021). Analysis of fire risk in the Amazon: a systematic review. Rev. Ambiente. Água. 16. doi: 10.4136/ambi-agua.2706
Liu Y., Chen J. (2021). Future global socioeconomic risk to droughts based on estimates of hazard, exposure, and vulnerability in a changing climate. Sci. Total. Environ. 751, 142159. doi: 10.1016/j.scitotenv.2020.142159
Mansuy N., Miller C., Parisien M. A., Parks S. A., Batllori E., Moritz M. A. (2019). Contrasting human influences and macro-environmental factors on fire activity inside and outside protected areas of north America. Environ. Res. Lett. 14 (6), 064007. doi: 10.1088/1748-9326/ab1bc5
Mapbiomas (2020) Coleção 5 da série anual de mapas de cobertura e uso de solo do brasil. Available at: http://mapbiomas.org (Accessed 1 September 2021).
Marques M. C., Trindade W., Bohn A., Grelle C. E. (2021). “The Atlantic forest: An introduction to the megadiverse forest of south America,” in In the Atlantic forest (Cham: Springer), (pp. 3–(pp23). doi: 10.1007/978-3-030-55322-7_1
McArthur A. G. (1967). Fire behaviour in eucalypt forests. department of national development, forestry and timber bureau leaflet no. 107 (Canberra, Australia).
Moura R. D. (2003). Distribuição e ocorrência de mamíferos na Mata Atlântica do sul da Bahia. Corredor de biodiversidade da Mata Atlântica do sul da Bahia (PI Prado, EC Landau, RT Moura, LPS Pinto, GAB Fonseca, KN Alger, coords). IESB/CI/CABS/UFMG/UNICAMP, Ilhéus, publicação em CD-ROM.
O'Neill B. C., Tebaldi C., van Vuuren D. P., Eyring V., Friedlingstein P., Hurtt G., et al. (2016). The scenario model intercomparison project (ScenarioMIP) for CMIP6. Geosci. Model. Dev. 9, 3461–3482. doi: 10.5194/gmd-9-3461-2016
Pettitt A. N. (1979). A non-parametric approach to the change-point problem. J. R. Stat. Soc.: Ser. C. (Applied. Statistics). 28 (2), 126–135. doi: 10.2307/2346729
Pontes E. J., Fernandes G. W., Neto P. A. P. (2020). Fatores a serem observados na criação de Áreas protegidas: o caso do parque nacional do descobrimento (Prado/BA). Sociedade. Natureza. 32, 1–16. doi: 10.14393/SN-v32-2020-39010
Ribeiro I. O., Andreoli R. V., Kayano M. T., Sousa T. R., Medeiros A. S., Godoi R. H. M., et al. (2018). Biomass burning and carbon monoxide patterns in Brazil during the extreme drought years of 2005, 2010, and 2015. Environ. pollut. 243, 1008–1014. doi: 10.1016/j.envpol.2018.09.022
Ripley B. (2020). MASS: Support functions and datasets for Venables and ripley’s MASS. 7, 3–29. (UK: Oxford).
Rocha S. J. S. S., Torres C. M. M. E., Villanova P. H., Schettini B. L. S., Jacovine L. A. G., Leite H. G., et al. (2020). Drought effects on carbon dynamics of trees in a secondary Atlantic forest. For. Ecol. Manage. 465, 118097. doi: 10.1016/j.foreco.2020.118097
Santana R. O., Delgado R. C., Schiavetti A. (2020). The past, present and future of vegetation in the central Atlantic forest corridor, Brazil. Remote Sens. Applications.: Soc. Environ. 20, 100357. doi: 10.1016/j.rsase.2020.100357
Santana R. O., Delgado R. C., Schiavetti A. (2021). Modeling susceptibility to forest fires in the central corridor of the Atlantic forest using the frequency ratio method. J. Environ. Manage. 296, 113343. doi: 10.1016/j.jenvman.2021.113343
Santos R. O., Delgado R. C., Vilanova R. S., de Santana R. O., de Andrade C. F., Teodoro P. E., et al. (2021). NMDI application for monitoring different vegetation covers in the Atlantic forest biome, Brazil. Weather. Climate Extremes. 33, 100329. doi: 10.1016/j.wace.2021.100329
Schiavetti A., Magro T. C., Santos M. S. (2012). Implementação das unidades de conservação do corredor central da mata atlântica no estado da bahia: desafios e limites. Rev. Árvore. 36 (4), 611–623. doi: 10.1590/S0100-67622012000400004
Sharples J. J., McRae R. H. D., Weber R. O., Gill A. M. (2009). A simple index for assessing fire danger rating. Environ. Model. Software. 24, 764–774. doi: 10.1016/j.envsoft.2008.11.004
Shennan-Farpón Y., Visconti P., Norris K. (2021). Detecting ecological thresholds for biodiversity in tropical forests: Knowledge gaps and future directions. Biotropica 53 (5), 1276–1289. doi: 10.1111/btp.12999
Silva C. V., Aragão L. E., Barlow J., Espirito-Santo F., Young P. J., Anderson L. O., et al. (2018). Drought-induced Amazonian wildfires instigate a decadal-scale disruption of forest carbon dynamics. Philos. Trans. R. Soc. B.: Biol. Sci. 373, 20180043. doi: 10.1098/rstb.2018.0043
Silva E. M. D. S., Correia W. L. F., Oliveira J. F. D., Barros H. G., Costa M. D. S., Gois G. D., et al. (2021). Espaço-temporalidade dos focos de calor na região metropolitana de maceió. Rev. Bras. Meteorol. 35, 1029–1043. doi: 10.1590/0102-778635500009
Silva Júnior L. A. S., Delgado R. C., Pereira M. G., Teodoro P. E., da Silva Junior C. A. (2019). Fire dynamics in extreme climatic events in western amazon. Environ. Dev. 32, (100450). doi: 10.1016/j.envdev.2019.06.005
Silva S. S., Numata I., Fearnside P. M., de Alencastro Graça P. M. L., Ferreira E. J. L., dos Santos E. A., et al. (2020). Impact of fires on an open bamboo forest in years of extreme drought in southwestern Amazonia. Regional. Environ. Change 20 (4), 1–13. doi: 10.1007/s10113-020-01707-5
Sneeuwjagt R. J., Peet G. B. (1985). Forest fire behaviour tables for Western Australia (Perth: Department of Conservation and Land Management Western Australia).
Torres F. T. P., Lima G. S., das Graças Costa A., de Araújo Félix G., da Silva Júnior M. R. (2017). Perfil dos incêndios florestais em unidades de conservação brasileiras no período de 2008 a 2012. Floresta 46 (4), 531–542. doi: 10.5380/rf.v46i4.44199
Trapletti A., Hornik K. (2007). Tseries: Time series analysis and computational finance. (Viena: Áustria).
Venables W. N., Ripley B. D. (2002). Modern applied statistics with s. 4th ed. (New York: Springer).
Vilanova R. S., Delgado R. C., da Silva Abel E. L., Teodoro P. E., Junior C. A. S., Wanderley H. S., et al. (2020). Past and future assessment of vegetation activity for the state of Amazonas-Brazil. Remote Sens. Applications.: Soc. Environ. 17, 100278. doi: 10.1016/j.rsase.2019.100278
Wang L., Qu J. J. (2007). NMDI: A normalized multi-band drought index for monitoring soil and vegetation moisture with satellite remote sensing. Geophys. Res. Lett. 34 (20). doi: 10.1029/2007GL031021
Wang L., Qu J. J., Hao X. (2008). Forest fire detection using the normalized multi-band drought index (NMDI) with satellite measurements. Agric. For. Meteorol. 148 (11), 1767–1776. doi: 10.1016/j.agrformet.2008.06.005
Xavier L. B., do Nascimento F. D. C. Jr., Chiapetti J. (2021). DA CRISE REGIONAL ÀS NOVAS DINÂMICAS DE ESPECIALIZAÇÃO DA PRODUÇÃO DE CACAU NO SUL DA BAHIA. Caminhos. Geografia. 22 (79), 77–96. doi: 10.14393/RCG227953461
Keywords: environmental conservation, deforestation, forest fires, future modeling, normalized multi-band drought index
Citation: de Santana RO, Delgado RC and Schiavetti A (2022) Future spatial modeling of vegetation in the Central Atlantic Forest Corridor, Brazil. Front. Conserv. Sci. 3:946669. doi: 10.3389/fcosc.2022.946669
Received: 17 May 2022; Accepted: 06 October 2022;
Published: 20 October 2022.
Edited by:
Richard T. Corlett, Xishuangbanna Tropical Botanical Garden (CAS), ChinaReviewed by:
Rafael Rodrigues, Universidade Federal de Catalão, BrazilYosio Edemir Shimabukuro, National Institute of Space Research (INPE), Brazil
Copyright © 2022 de Santana, Delgado and Schiavetti. This is an open-access article distributed under the terms of the Creative Commons Attribution License (CC BY). The use, distribution or reproduction in other forums is permitted, provided the original author(s) and the copyright owner(s) are credited and that the original publication in this journal is cited, in accordance with accepted academic practice. No use, distribution or reproduction is permitted which does not comply with these terms.
*Correspondence: Romário Oliveira de Santana, romarioambiental1@gmail.com
†ORCID: Romário Oliveira de Santana, orcid.org/0000-0001-9603-0738
Rafael Coll Delgado, orcid.org/0000-0002-3157-2277
Alexandre Schiavetti, orcid.org/0000-0001-8429-7646