Lithological Constraints on Borehole Wall Failure; a Study on the Pennine Coal Measures of the United Kingdom
 Mark W. Fellgett1*
  Andrew Kingdon1
  Colin N. Waters1,2
  Lorraine Field1 James Shreeve3 Marcus Dobbs1
  Audrey Ougier-Simonin1
- 1British Geological Survey, Environmental Science Centre, Nottingham, United Kingdom
- 2School of Geography, Geology and the Environment, University of Leicester, Leicester, United Kingdom
- 3Geotek Ltd., Daventry, United Kingdom
Stress-related borehole deformation features have been documented across the United Kingdom, most commonly as borehole breakouts and drilling induced tensile fractures (DIFs). Recent studies using borehole imaging have allowed more detailed investigation of these features and the processes that control their formation. Within the Pennsylvanian Pennine Coal Measures Group (PCM) of the United Kingdom borehole imaging has highlighted a disproportionately high number of breakouts occurring within paleosols located immediately below coal seams. To understand the processes controlling breakout formation, a 10.5 m section of core from the Melbourne 1 borehole, incorporating a typical coal seam / paleosol sequence, was analyzed using multiple techniques including: scanning electron and optical microscopy, X-Ray Fluorescence (XRF), X-ray radiography, Point Load testing, wireline petrophysics and track-based core scanning for physical properties. Strength measurements highlight that breakouts form preferentially in poorly consolidated sediments, with low tensile strength, cross-cut by listric surfaces. The formation and termination of breakouts also corresponds to zones of diagenetic iron mineral growth with a lower propensity to fail. These coincide with greater preservation of sedimentary structures and an increase in the rock’s tensile strength; this intra-unit variation in tensile strength constrains breakout length. This demonstrates that secondary diagenetic processes, including the growth of iron minerals impose, lithological controls on the formation and length of borehole breakouts within the United Kingdom PCM.
Introduction
The United Kingdom in situ stress field has become highly topical since 2010 because it imposes a constraint to the operational conditions and safety of hydraulic fracturing for shale gas. Borehole deformation caused by in situ stress is recorded on wireline logs as either borehole breakouts or Drilling Induced Tensile Fractures (DIFs) (Tingay et al., 2008). Borehole breakouts form as the result of compressive failure, which causes caving of the borehole wall (Bell and Gough, 1979). For breakouts to form, the circumferential stress at the borehole wall must exceed the compressive strength of the rock (Peška and Zoback, 1995). DIFs are the result of tensile failure induced by the drilling process, and are often an indication of high differential stress (Zoback, 2010). The relationship of these features to the in situ stress field is well documented and has been used to characterize stress field orientations and magnitudes across the world (Tingay et al., 2008; Reinecker et al., 2010; Williams et al., 2015; Heidbach et al., 2016; Kingdon et al., 2016; Williams et al., 2016).
The World Stress Map (Heidbach et al., 2010) has produced best practice guides for interpreting and calculating stress field orientation from borehole breakouts and DIFs (Tingay et al., 2008; Heidbach et al., 2016). These guides place significant emphasis on breakout length as an indicator of quality for stress field interpretations. Establishing whether lithological variations control the length of breakouts is important for validating this quality criteria. Kingdon et al. (2016) documented a strong degree of lithological control on deformation feature formation in the United Kingdom Pennine Coal Measures (PCM). The length of both breakouts and DIFs were limited by lithological change, and appeared to cluster in specific units. One particular trend was the compressive failure of rocks forming borehole breakouts below coal seams in the PCM succession.
Until now the specific controlling mechanisms by which breakouts are formed and which determine their lengths have been unclear. However, there have been a number of studies linking the properties of specific lithologies to rock failure (e.g., Paillet and Kim, 1987; Gross, 1995; Cuss et al., 2003; Nelson et al., 2006). Despite this, the link between breakout length and intra-lithological variations has until now been largely unstudied. One reason for this is a lack of open file datasets and in particular high-resolution borehole imaging. Borehole imaging allows for mm-cm scale comparison of core and the borehole wall (Ekstrom et al., 1987; Gaillot et al., 2007) and links conventional wireline logs and core measurements.
Three boreholes in North Yorkshire, Melbourne 1, Althorpe 1, and Swinefleet 1 (Figure 1), showed a clear trend of breakouts forming beneath coal seams. Each of these boreholes was spudded into the Triassic Mercia Mudstone Group (Figure 1) targeting Pennsylvanian PCM in the East Pennines Coalfield. Table 1 shows that over 30% of all breakouts recorded across the three boreholes were located directly beneath coal seams with examples shown in Figure 2 (Fellgett et al., 2017).
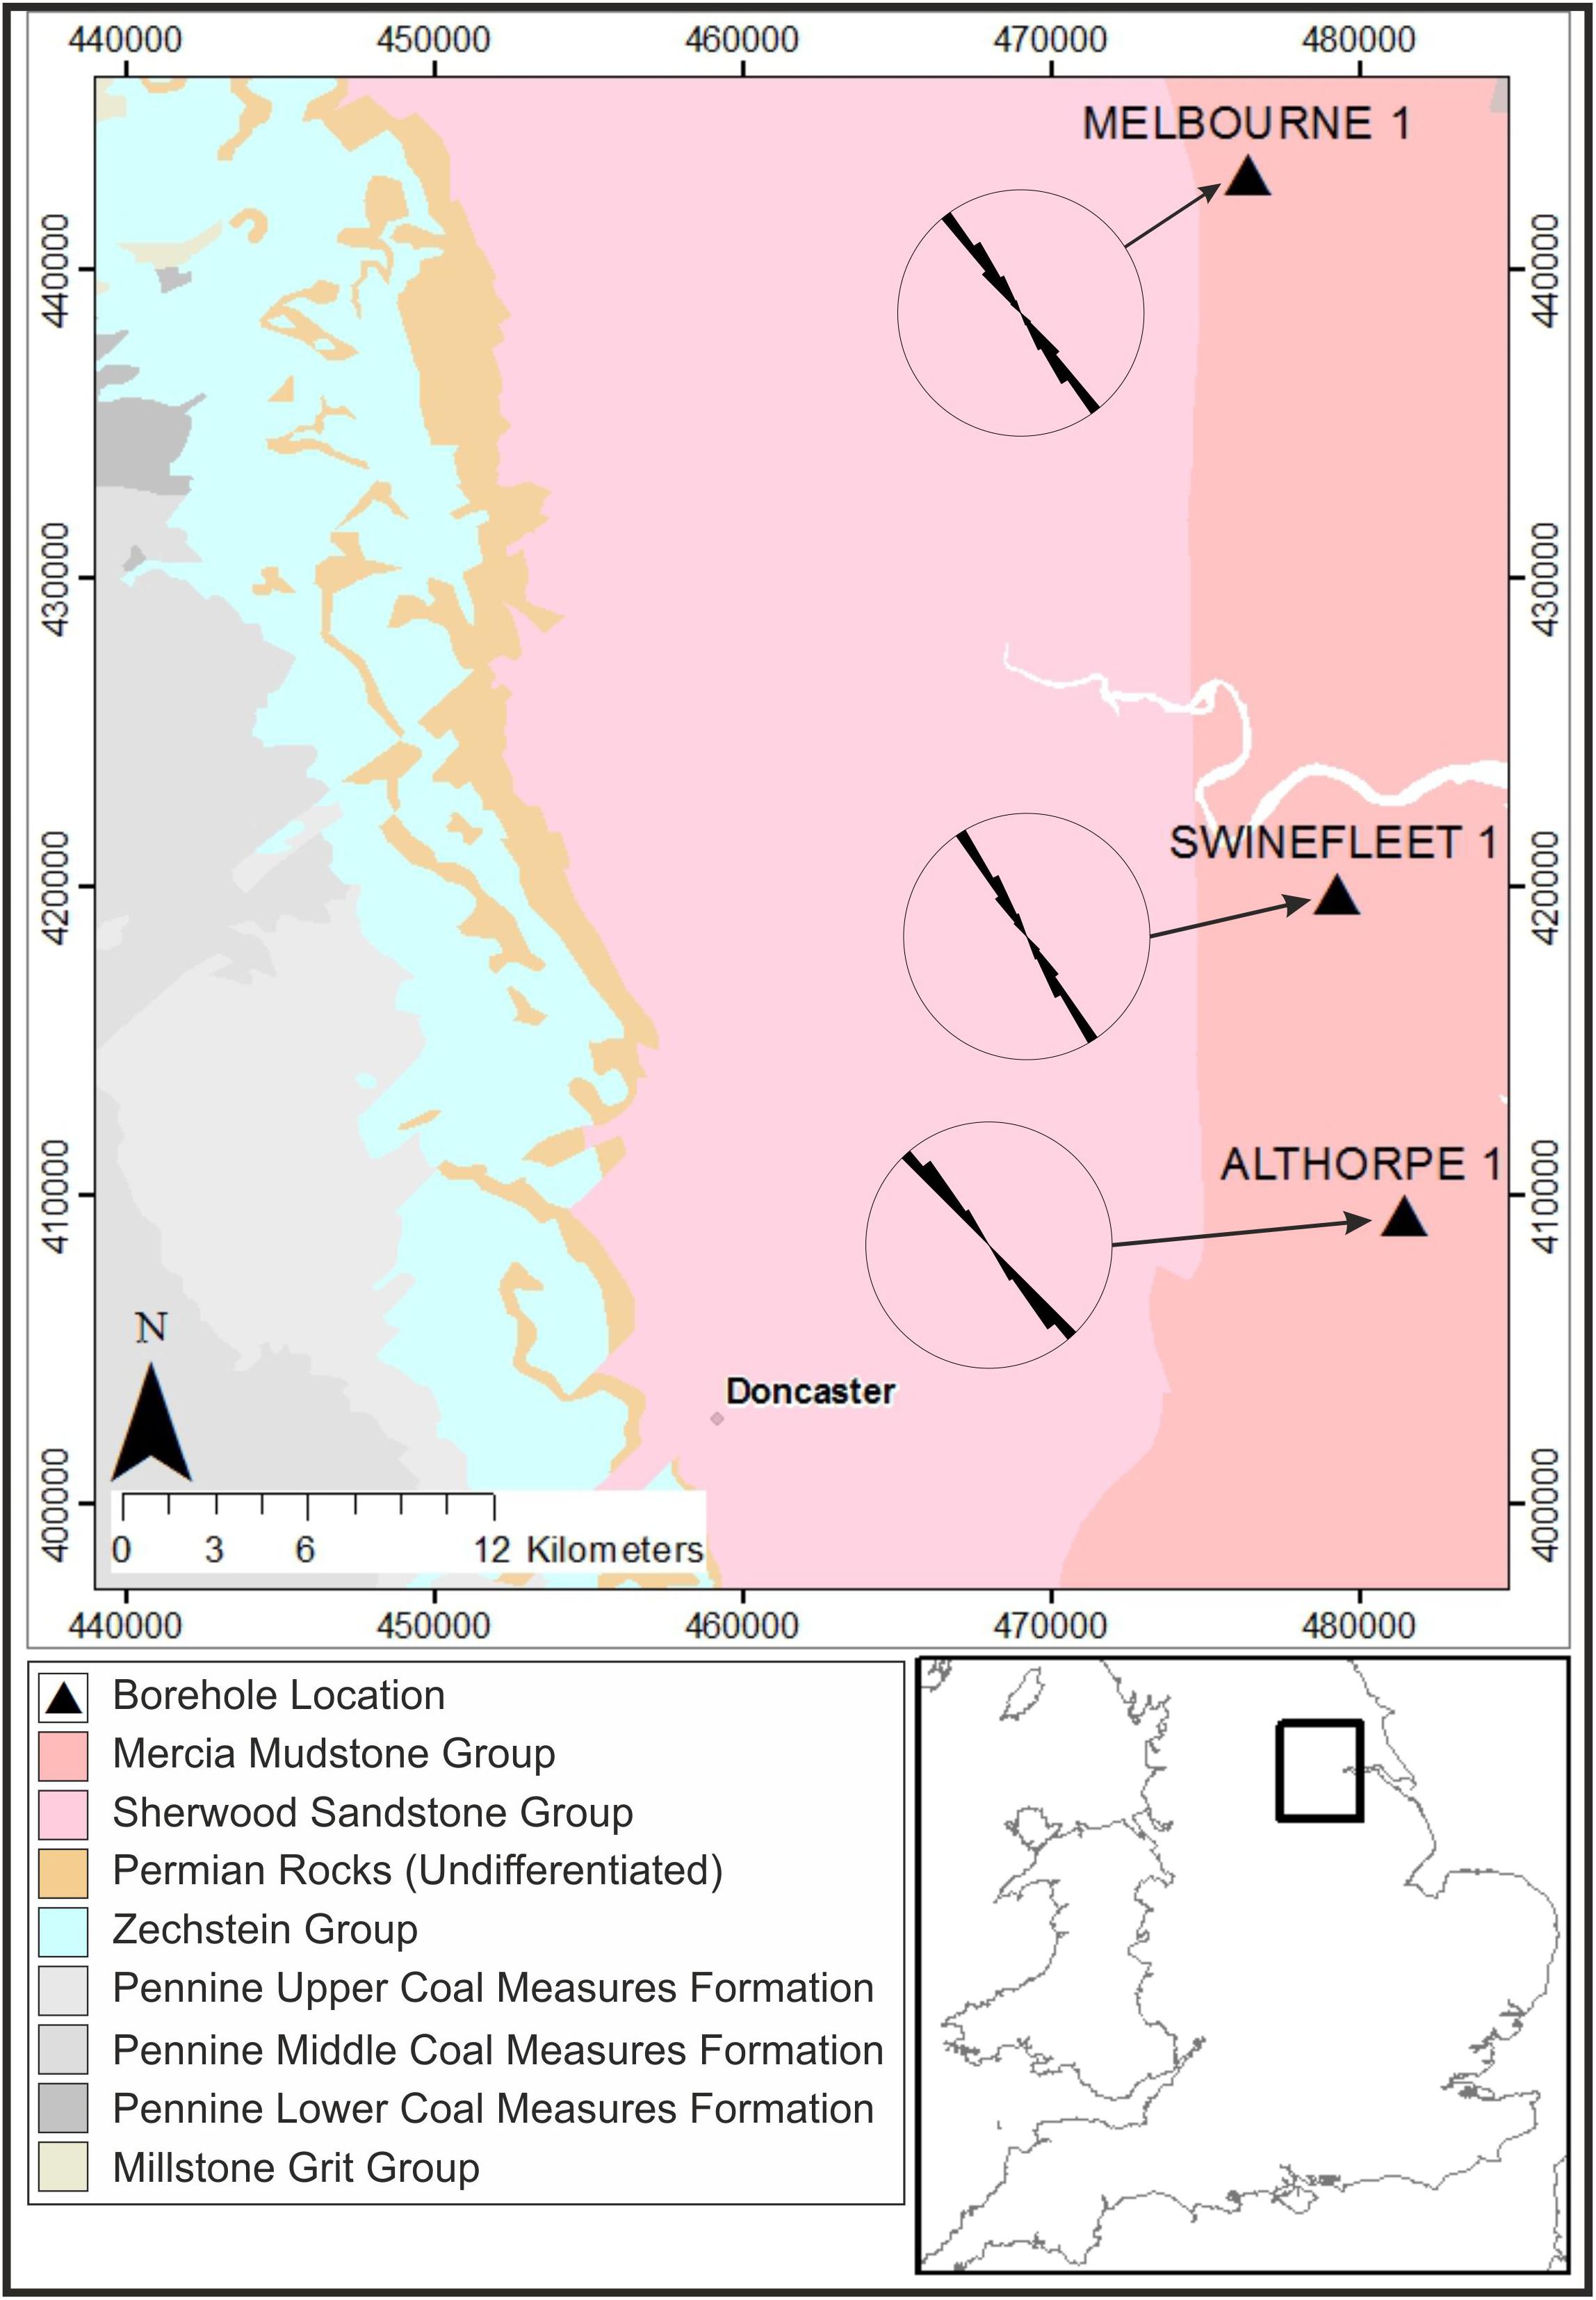
Figure 1. Map showing the location of three boreholes in North Yorkshire with whole round drill core, conventional wireline logs and high resolution borehole imaging, bedrock geology, and rose diagrams showing SHMax orientations after Kingdon et al. (2016); see Table 1 for details. Locations are in British National Grid Contains Ordnance Survey data © Crown copyright and database rights 2019. Contains British Geological Survey materials ©NERC 2019.
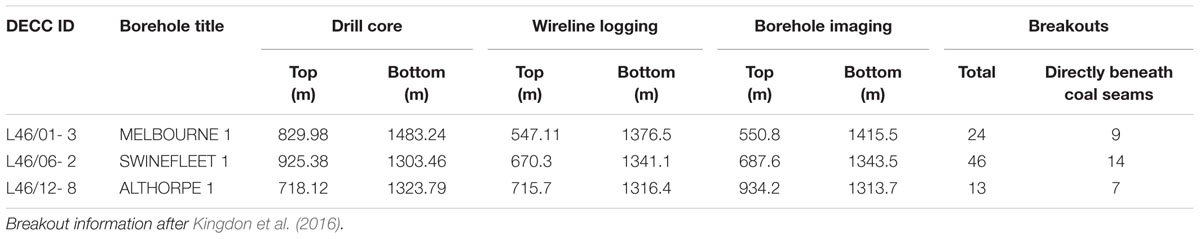
Table 1. Summary information for Coal Bed Methane boreholes in North Yorkshire.
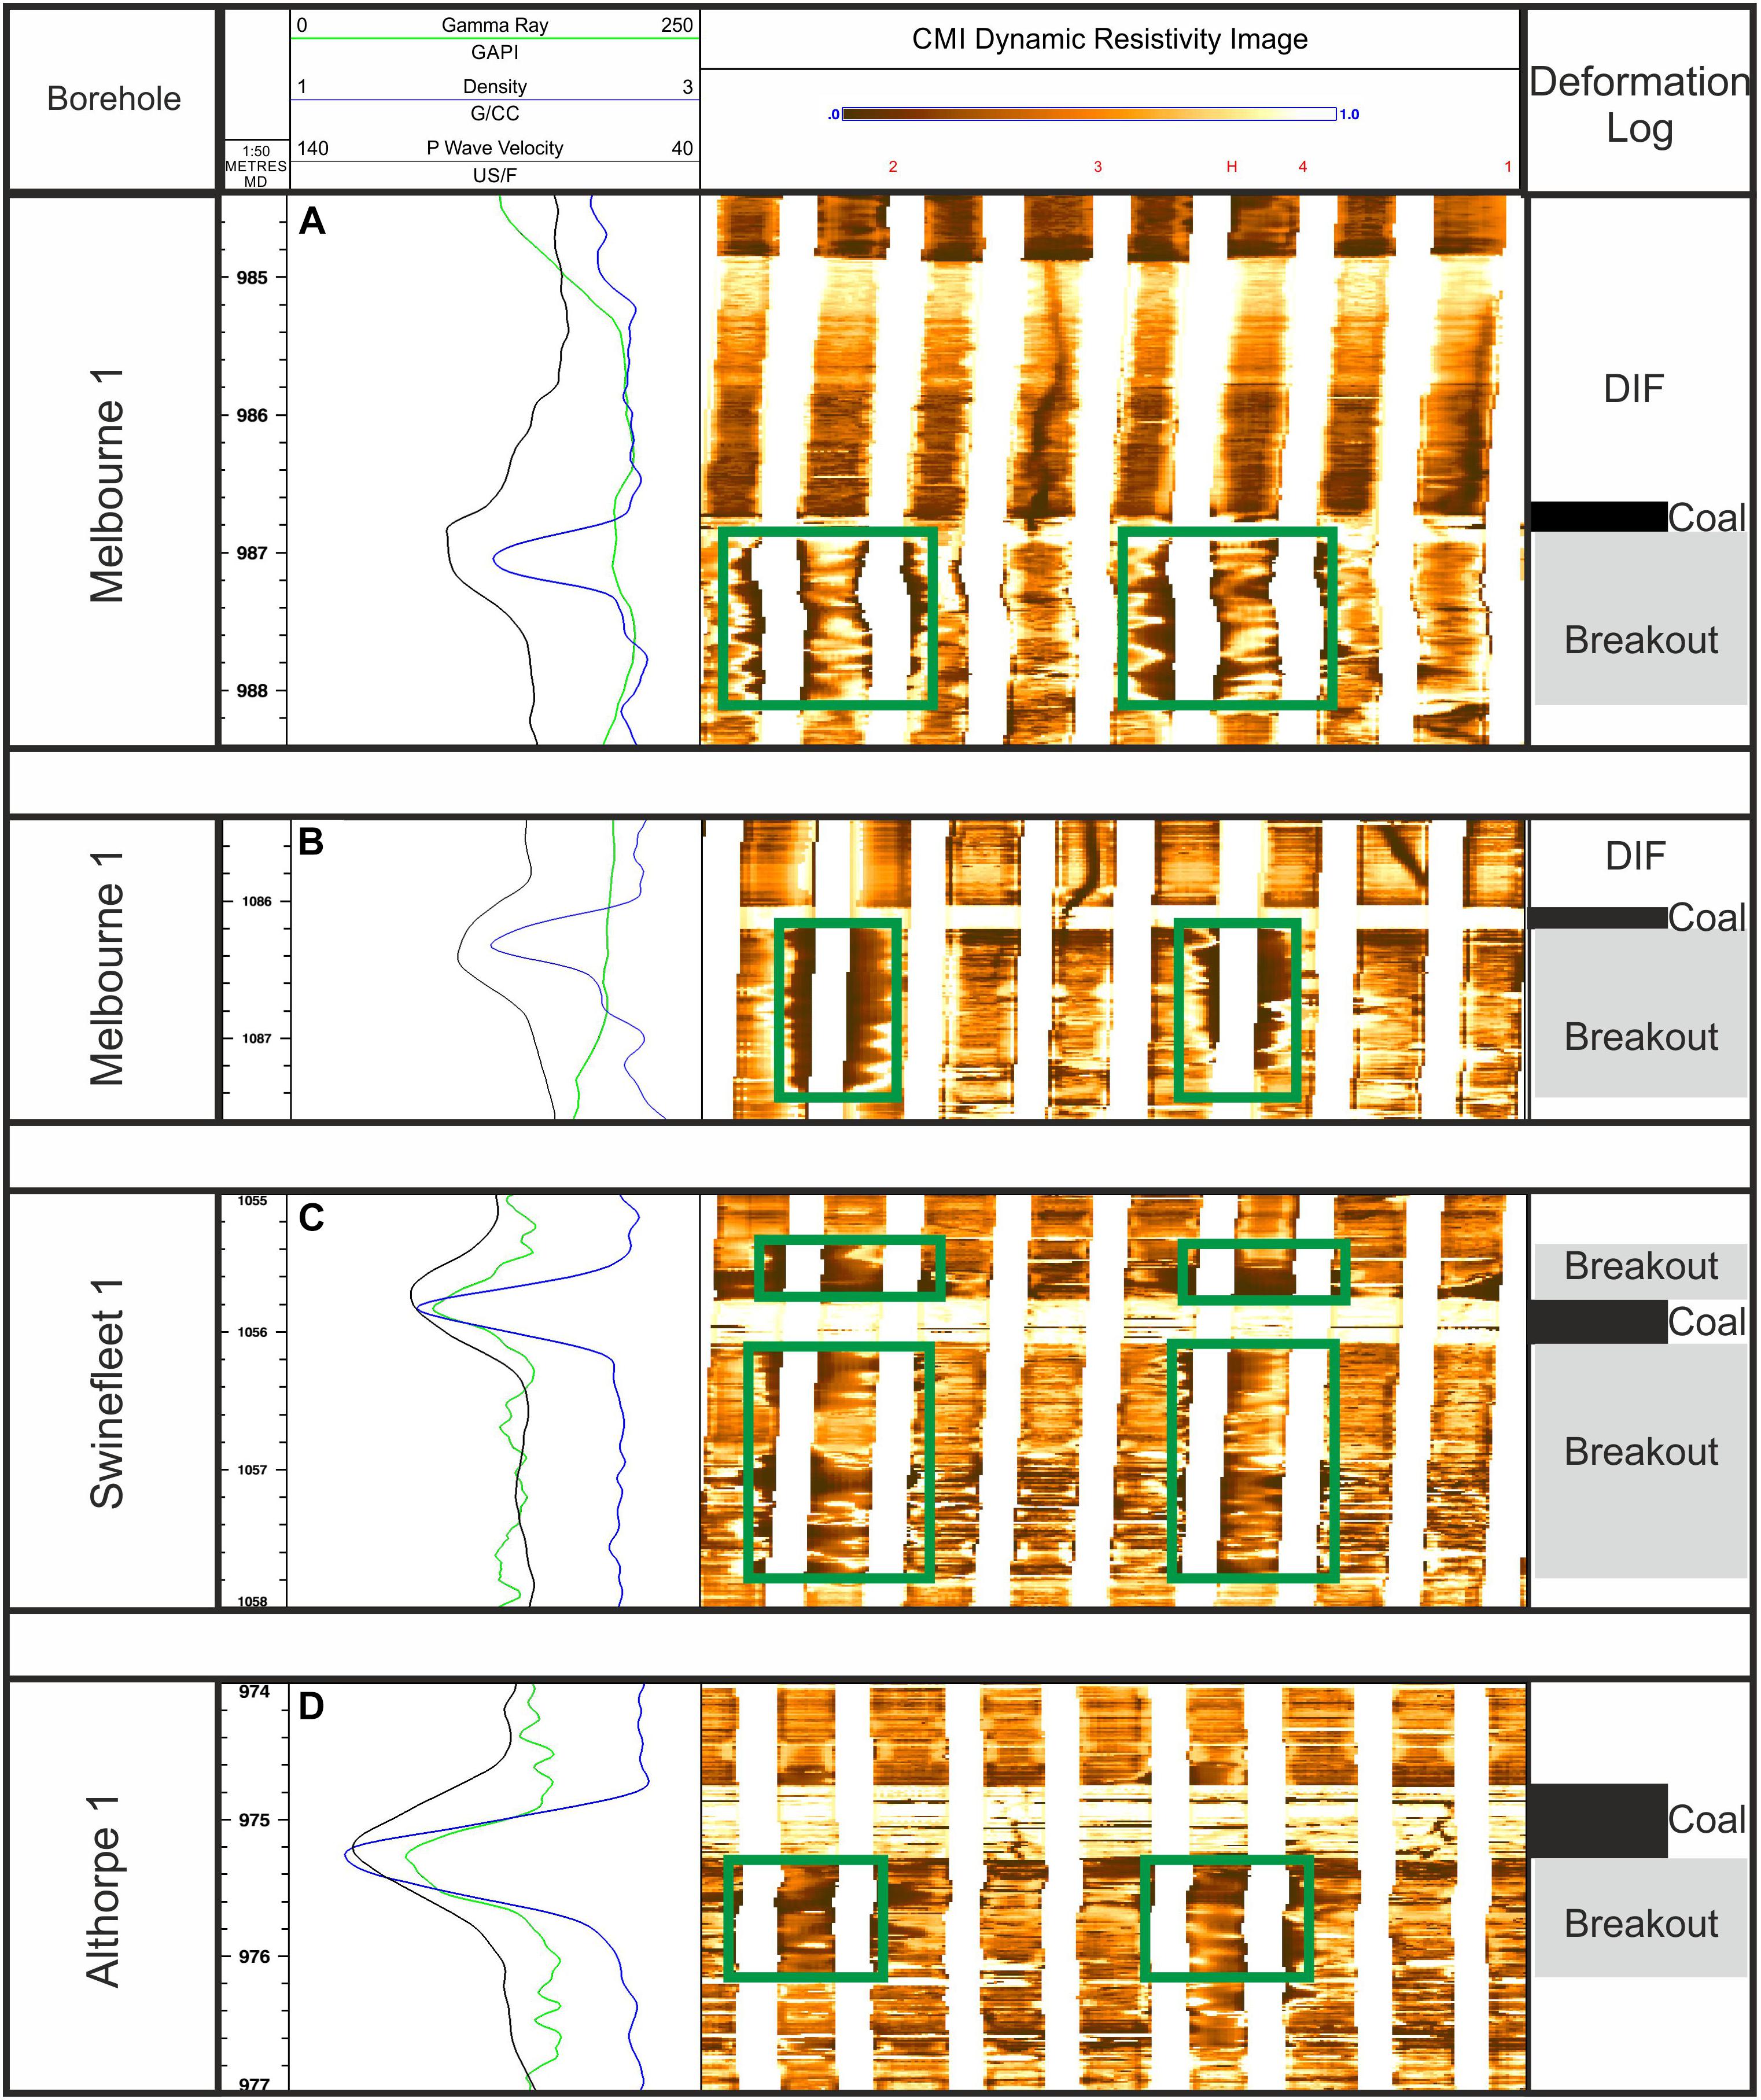
Figure 2. Plot showing breakout occurrence beneath coal seams. (A) Section from Melbourne 1, 984.4 m – 988.4 m. (B) Section from Melbourne 1, 1086.4 m – 1087.6 m. (C) Section from Swinefleet 1, 1055 m – 1058 m. (D) Section from the Althorpe 1, 974 m – 977 m. Left panel, wireline logs including Sonic Transit Time and Gamma Ray. Center Panel, Unwrapped Compact Micro Imager (CMI) resistivity image (clockwise from North) and breakouts highlighted by green boxes. Right Panel, Deformation log showing breakouts and DIFs, Coal Seams marked by black rectangles.
This strong association between coal seams and breakouts is unlikely to be random, particularly given that coals are a subordinate lithology within the PCM which is mainly comprised of cyclic successions of sandstone, gray siltstone and gray mudstone. Electrofacies analyses of the borehole imaging within the PCM for Melbourne 1, demonstrated that the coals constitute only 23.3 m from a total sampled thickness of 661.7 m or 3.5 % of the rock volume. Swinefleet 1 produces comparative figures of 20.7 m cumulative thickness of coal from a sampled PCM sequence of 653.0 m or just 3.2% coal. The breakouts consistent form within Palaeosols directly beneath coal seams. Palaeosols are a common facies within the PCM Group in the United Kingdom (Besly and Fielding, 1989), and equivalent coal-bearing Carboniferous successions globally. Hence, an understanding of the controls such palaeosols have on borehole breakouts is of great significance within a succession of continued economic importance.
Melbourne 1, Althorpe 1 and Swinefleet 1 are ideal for investigating the relationship between borehole breakouts and coal seams. This is a result of the availability of both high quality borehole imaging and substantial volumes of well-preserved core available, making them almost unique across the United Kingdom. To study the relationship between breakout and lithology a 10.5 m section of core was selected from the Melbourne 1 borehole, sampling the Pennine Middle Coal Measures (PMCM). This aim was to understand the factors that control the development of an individual borehole breakout; what causes rock failure; and the specific controls on the limits of breakout length in an intra-unit setting.
The studied interval was identified using resistivity imaging and was chosen because it showed multiple failure modes around a thin unnamed coal seam (Figure 2A). A stratigraphic log of the interval and the section of interest is shown in Figure 3 with a geological description of the interval included in the Results section. To our knowledge, no breakout interval has ever been studied in such detail using so many complementary techniques. This is most likely due to the acquisition costs of collecting both core and images, and the absence of preservation of sufficient core volume for strength tests to be reliably carried out.
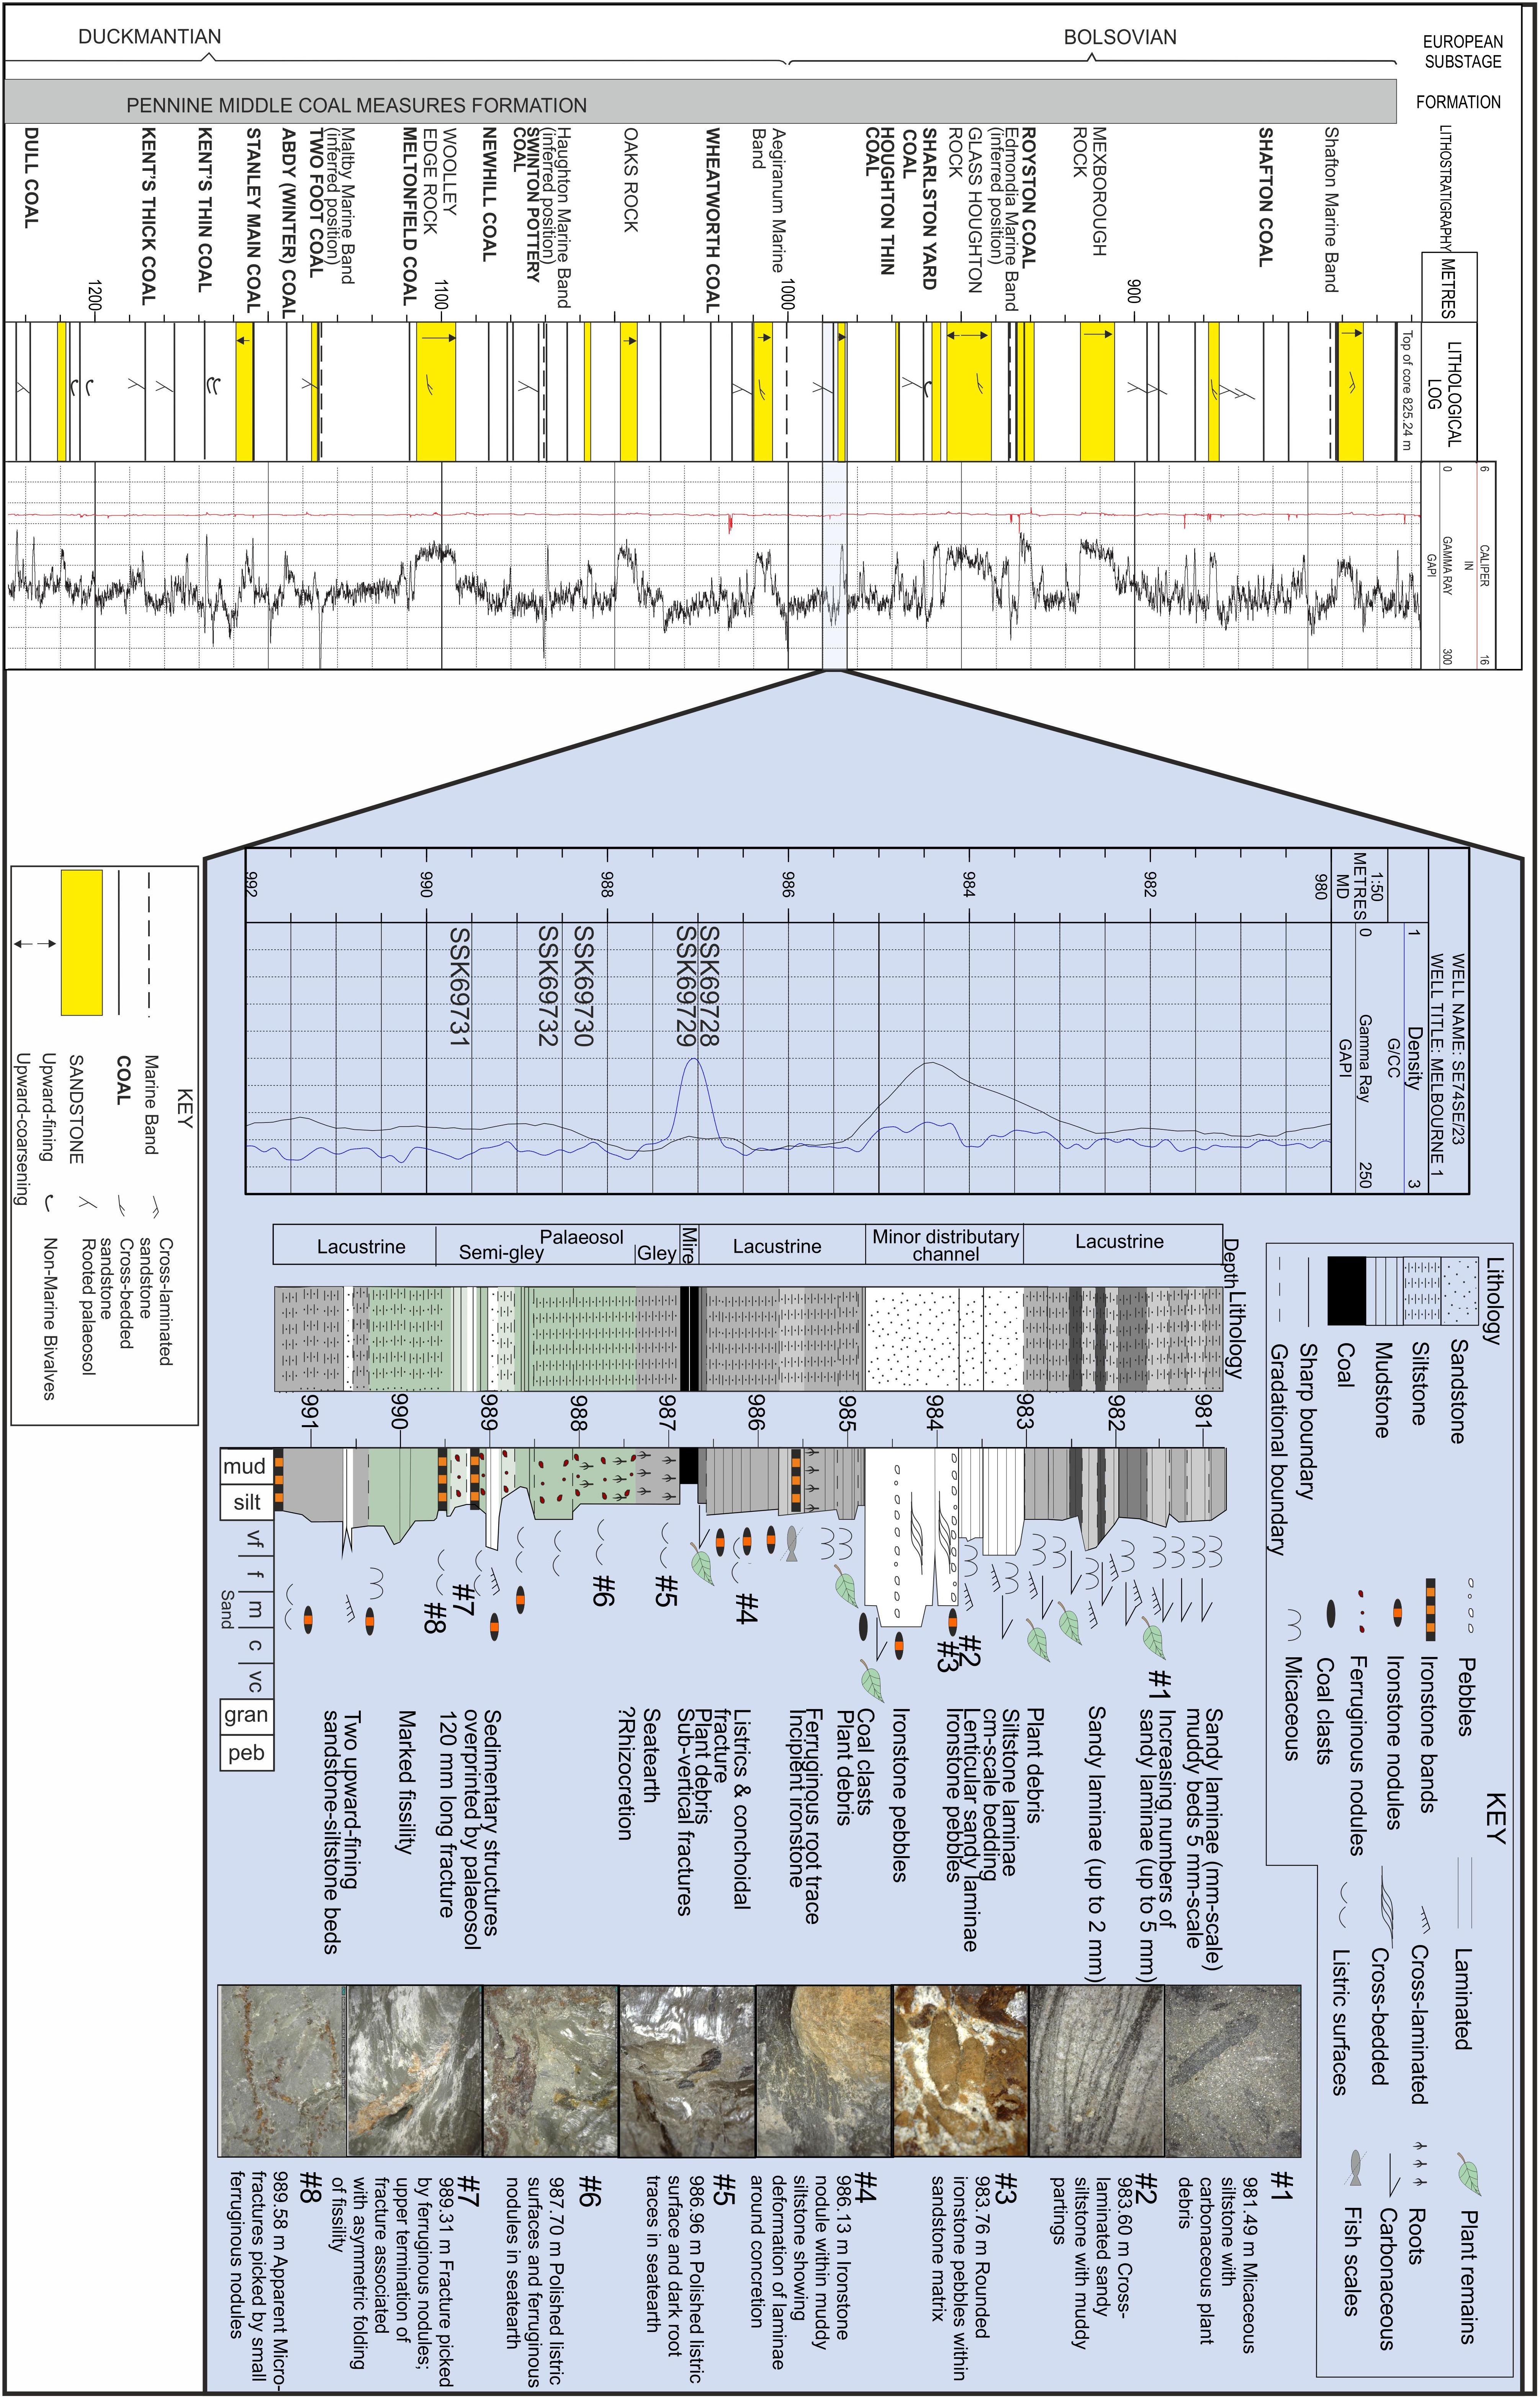
Figure 3. Stratigraphic log of the Pennine Coal Measures (PCM) proved in the Melbourne 1 borehole and the section of interest highlighted in Figure 2A. Location of Petrography samples are also shown (Table 2) and are described in the section “Materials and Methods.”
Materials and Methods
To understand what processes control breakout formation and length required the collection and integration of multiple data types. This included non-destructive core scanning measurements, lithological logging and destructive geophysical testing of samples across a palaeosol. Collectively, these techniques allow for a much more detailed understanding of the controlling processes on breakout development and termination.
Typical geomechanical methods for studying the physical properties of core material involve destructive testing of the rocks. This can be expensive and is not the optimal route to understand the bulk rock properties, especially in initial investigation phases. To maintain the integrity of core materials and to minimize costs, core scanning was undertaken prior to destructive testing. Access to track-based core scanners allowed for both assessment of core properties without risking the core integrity and targeted specific intervals for further analysis.
Borehole resistivity imaging was first used to depth-match the core section. The resistivity imaging tool used in this study was the Weatherford Compact Micro Imager (CMI), which has a borehole wall coverage of 80% in a 216 mm (8.5 inch) hole (Kingdon et al., 2016). The use of borehole imaging and whole round core in combination allows depth discrepancies to be quantified to within a centimeter vertically (Rogers et al., 2000). This is often done by identifying high angle fractures on the borehole imaging and within the core or through the identification of distinctive lithologies.
To match the core depths to the borehole imaging in Melbourne 1, it was assumed that 100% recovery had been achieved over the 10.5 m section. Three features were then selected from three different core boxes to calculate the average depth discrepancy: (i) the ironstone unit at 983.8 m; (ii) the boundary between the distributary channel-fill sandstone and the underlying lacustrine siltstone at 984.8 m; and (iii) the top of the coal seam at 986.75 m (depths for borehole imaging). The average depth discrepancy between the imaging and the core was 1.35 m, which was used to depth-shift all of the core measurements to the wireline logs. The depths used in this paper correspond to the wireline log depths.
Alongside the datasets mentioned a detailed sedimentological interpretation of the 10.5 m section of Melbourne 1 was undertaken and placed in the context of the PCM.
Wireline Logging
Wireline logging for Melbourne 1 was undertaken by Weatherford and comprised sonic, density, neutron porosity, spectral gamma ray and resistivity at increments of 30 mm. Circumferential borehole imaging was also acquired using the CMI resistivity imaging tool (sub-cm scale vertical resolution) which was used to match the core depths to the wireline logs.
Core Scanning
The non-destructive core scanning was undertaken using the GEOTEK multi sensor core logging systems (Gunn and Best, 1998; Vatandoost et al., 2008). Three separate scanning platforms were used in this study. The RXCT produced 2D x-ray imaging and CT imaging. CT images were collected by Geotek at 94 micron resolution. These were used to identify incipient micro-fractures and structure within the core.
The MSCL-S is a physical property core scanner, which can measure a range of parameters at cm-scale operated at a 10 mm increment. It collects both point measurements and volumetric data to record a range of physical properties including: p-wave velocity, volumetric magnetic susceptibility (using a loop sensor), gamma-density and gamma ray spectrometry. The MSCL-XZ system takes XRF measurements on the surface of the core as well as point sensor magnetic susceptibility and color spectrophotometry. The XRF is sensitive to fractures, core damage and nodules. In contrast to the MSCL-S data, the sampling is irregular and, across the chosen section, the sample increment was up to 40 mm but as low as 10 mm within the palaeosol. Comparison between the different magnetic susceptibility sensors were used to integrate the datasets.
Rock Testing
The core from Melbourne 1 was collected in 2009 and shortly after was stored in the National Geological Repository at Keyworth. The core was neither wrapped nor sealed, resulting in drying and consequent desiccation. Over time the core has degraded, with different lithologies suffering different degrees of degradation. Some sections are now heavily fractured, often along bedding planes or “biscuiting” (Figure 4). This image is typical of the core condition both directly above and below the breakout. Consequently such core proved insufficiently cohesive for uniaxial compressive stress (UCS) tests. Therefore, point load tests were undertaken as the best-available alternative to look at variations in rock strength across the interval given its condition.
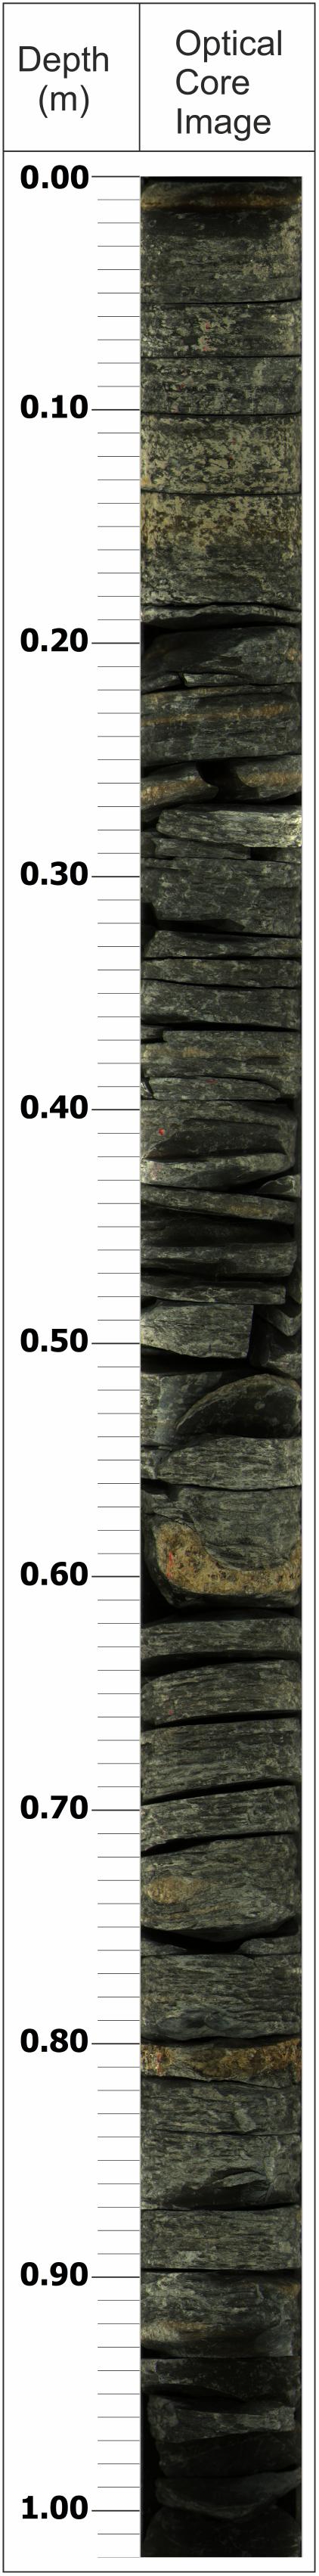
Figure 4. Optical line scan image of a 1.02 m section of core from the Melbourne 1 borehole (985.66 m – 986.68 m) showing a large number of low angle fractures along bedding planes. Due to the condition of the core there was not sufficient coherent material to undertake UCS tests.
Point load samples were prepared from 180 to 400 mm long sections using a diamond tipped rock saw. Sampling intervals were selected to intersect individual lithological beds or subsections of lithological beds displaying distinct characteristics. This was to facilitate direct comparison between the strengths of the rock in the breakout zones as well as generating a profile for tensile strength in each distinct lithology identified. Between eight and twelve block samples were prepared for each lithology with individual sides varying between approximately 20 and 40 mm, as per International Society of Rock Mechanics (ISRM) recommendations (Ulusay and Hudson, 2007). It allowed us to provide a satisfactory statistical value of tensile strength for each lithology despite the natural local heterogeneities and the testing restrictions due to the general state of the core material.
The Point Load Strength of samples was determined using the corresponding ISRM suggested method (Ulusay and Hudson, 2007). Initially, the dimensions of each sample were measured to 0.1 mm accuracy using a digital caliper to ensure the samples were within the desired tolerance and so that the normalized Point Load Value (Is(50)) could be calculated. The samples were then placed between two hardened stainless steel conical platens within the Point Load test frame (ELE International Digital Point Load Test Apparatus). Load was applied using a hydraulic jack at a steady rate to ensure failure occurred between 10 and 60 s. The maximum load prior to failure was recorded for each sample using a digital recorder. All samples were tested with axial load applied perpendicular to the bedding direction. The Is(50) for each sample interval was calculated as a mean average Is(50) of the samples, excluding the two highest and two lowest values. Tensile strength was also derived from the Is(50) values as detailed below. Results for the Point Load Strength tests are presented in Table 3. The Is(50) and tensile strength were calculated using Equations 1 and 2.
Where: F, the size correction factor, equals ; Is, the uncorrected Point Load Strength, equals ; P equals the load at failure in kN; De, the equivalent core diameter, equals ; A, the minimum cross-sectional area of a plane through the contact points, equals W ×D; D equals the distance between sample platen contact points when the sample is loaded in the Point Load frame; and W is the width of the sample along a fracture plane (perpendicular to the measurement of D).
Petrography
Rock samples from the Melbourne 1 core were selected for petrographic analysis from the same depths used for other analytical techniques, such as point load analyses and X-ray radiography. Samples were analyzed both as intact samples and as stub-mounted sub-samples. The samples in this study are referred to by The British Geological Survey’s SSK sample identity numbers, used to specifically identify sub-samples from core which is linked to the sample metadata. A summary is included in Table 2.
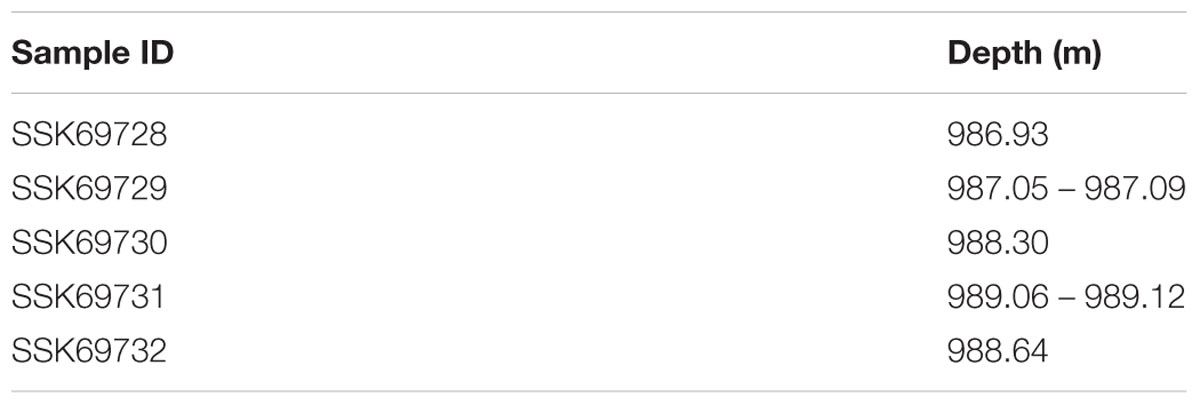
Table 2. Depths for samples taken for Petrographic analysis.
Optical Microscopy
The pieces of core were imaged using an Olympus SZX10 binocular microscope fitted with an Olympus XC30 digital camera attachment. Images were recorded as 24 bit RGB 2080x1544 pixel jpeg format files using Olympus Analysis START software.
X-Ray Radiography
The core samples were analyzed non-destructively using 2D X-ray radiography on a GE Inspection ISOVOLT Titan E X-ray generator. X-rays were taken at a distance of 1000 mm, 60 s exposure, 12 mA and 100 kV. Two orthogonal side views of the cores were imaged. This technique allows a rapid assessment of any features within the core where there is a density difference. Figure 5 shows some of the outputs from the radiography with incipient fracturing from the CT scanning shown in Figure 6.
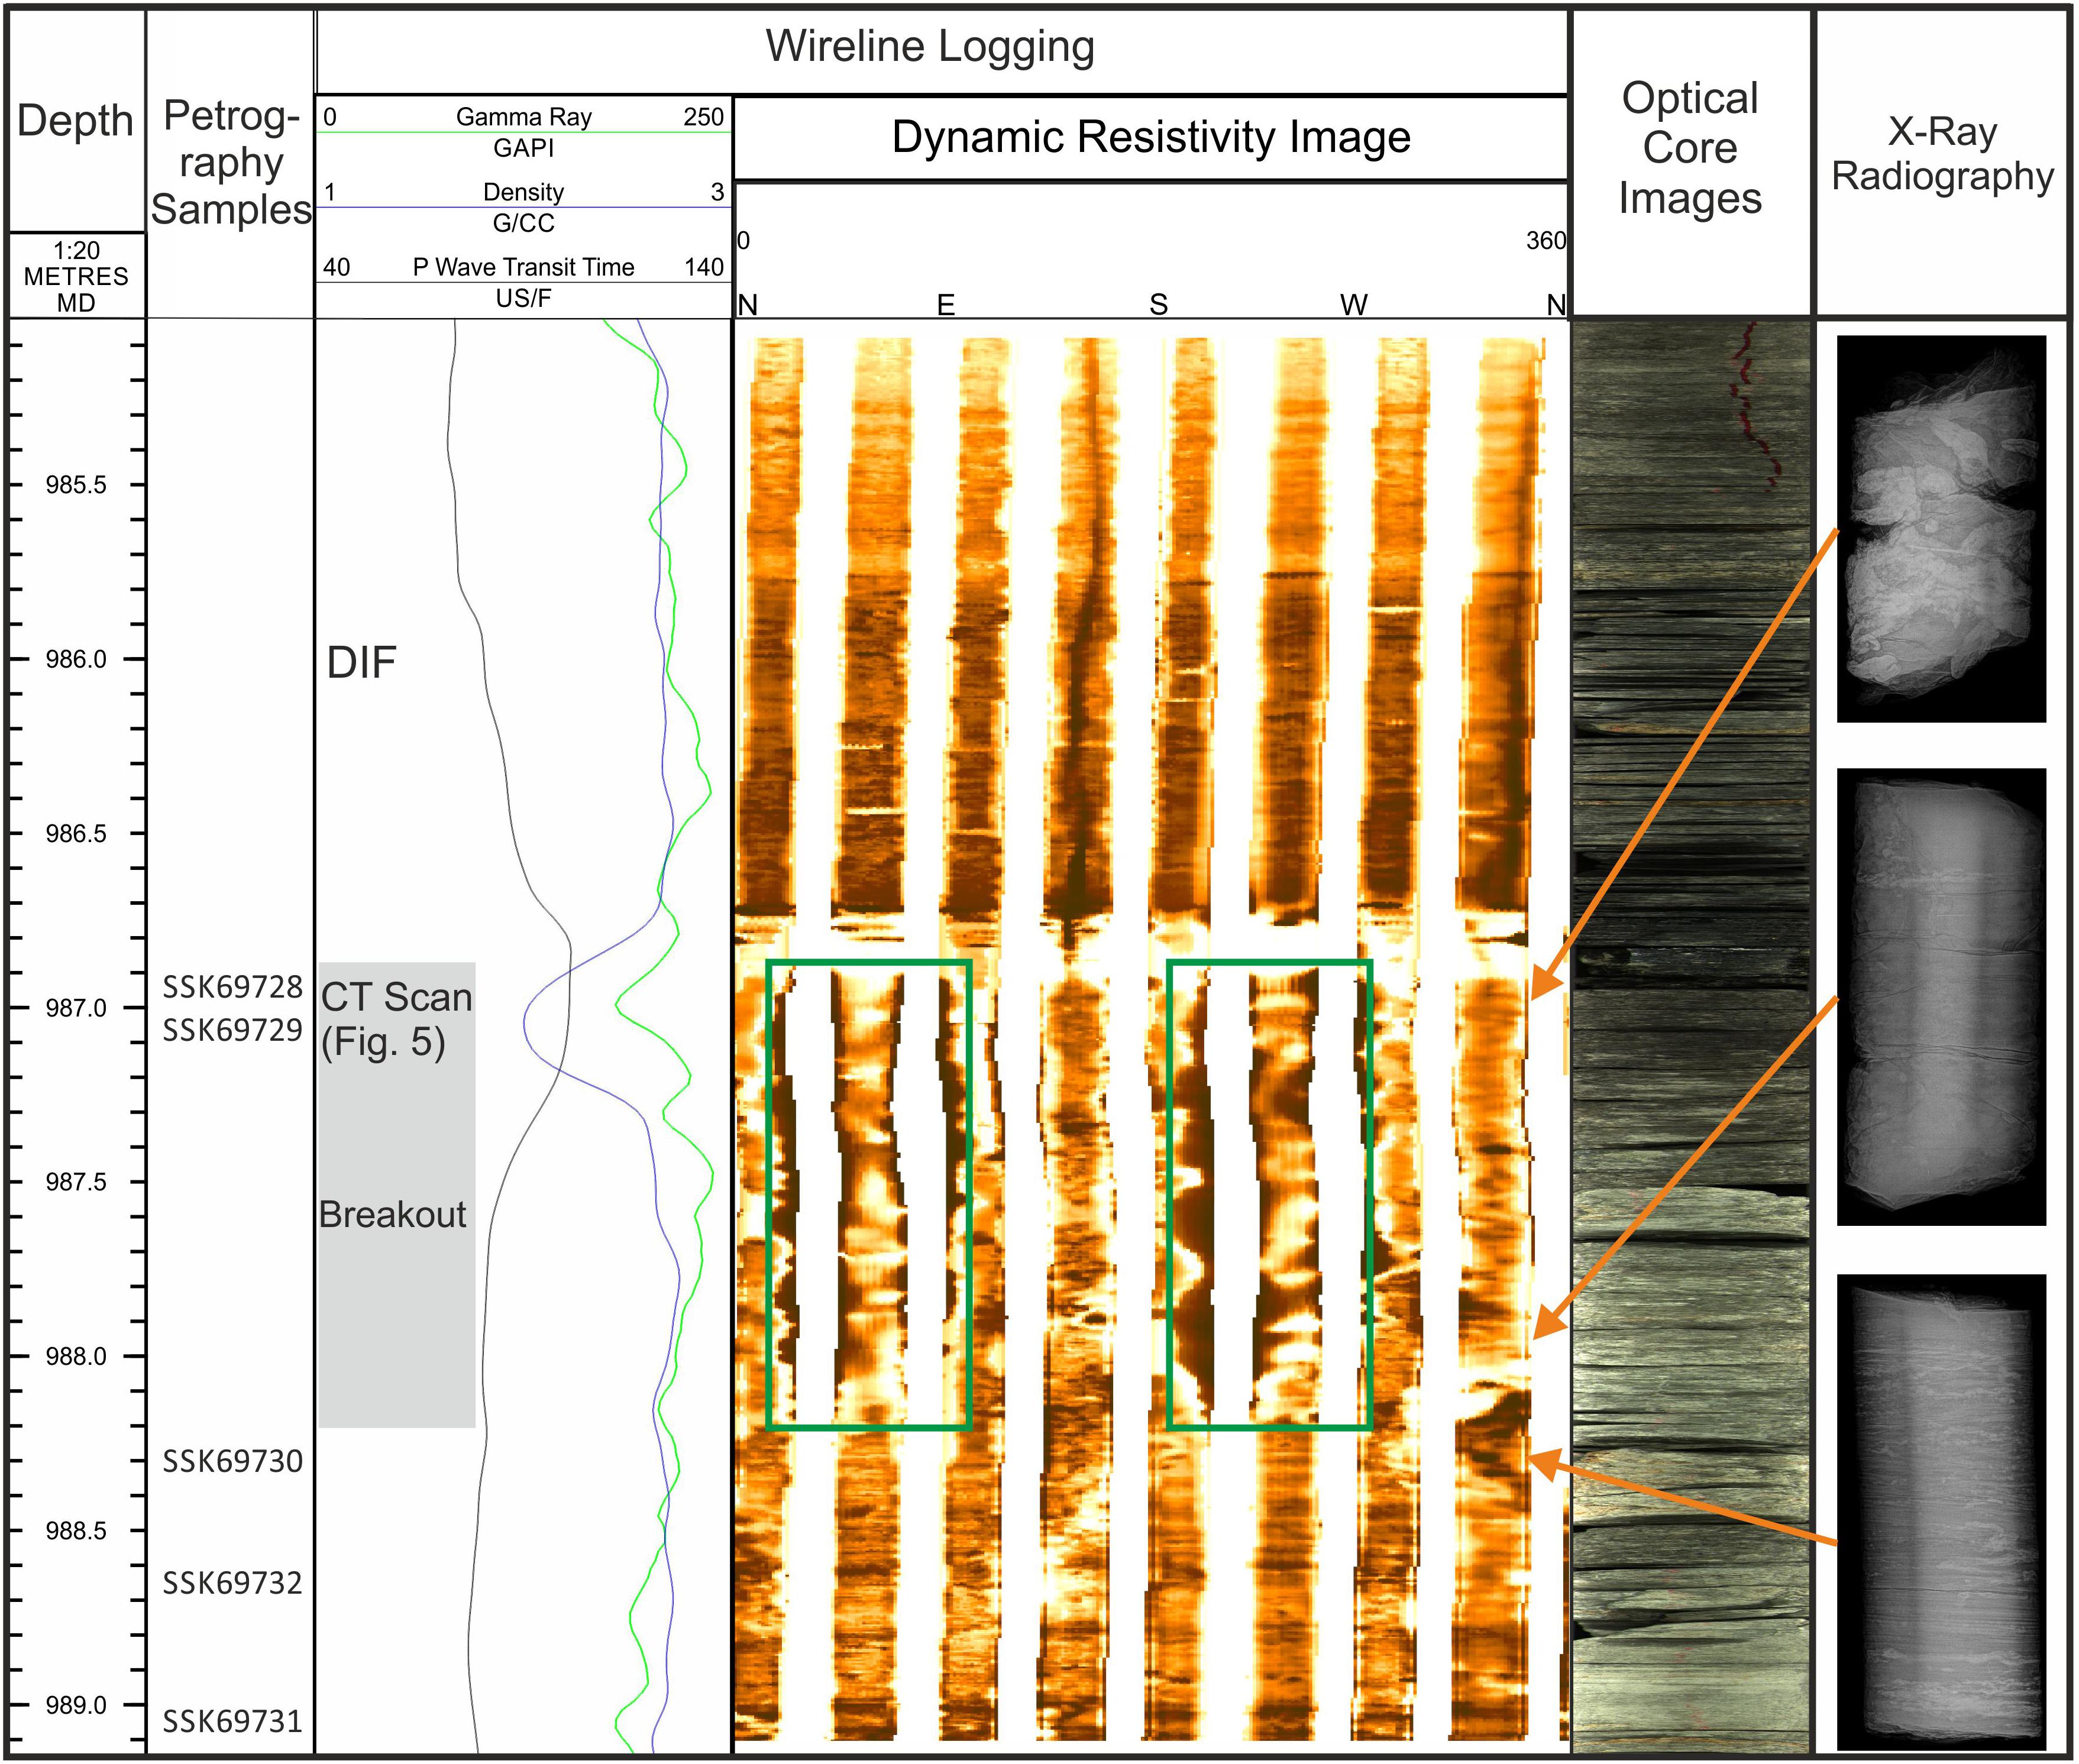
Figure 5. Borehole imaging and X-ray radiography across the breakout zone in the Melbourne 1 borehole: Left panel, Sample track showing location of Petrography samples (Table 2). Center Left panel, conventional wireline logs including Sonic Transit Time and Gamma Ray, Depth of CT scan in Figure 6 marked, breakout shown in gray. Center Panel, Unwrapped CMI resistivity image (clockwise from North) and breakouts highlighted by green boxes. Center Right Panel, Optical line scan images of the core from the MSCL-S. Right Panel, X-ray radiography from three palaeosol samples taken independently of the petrography, showing increased disruption of sedimentary structures toward the coal.
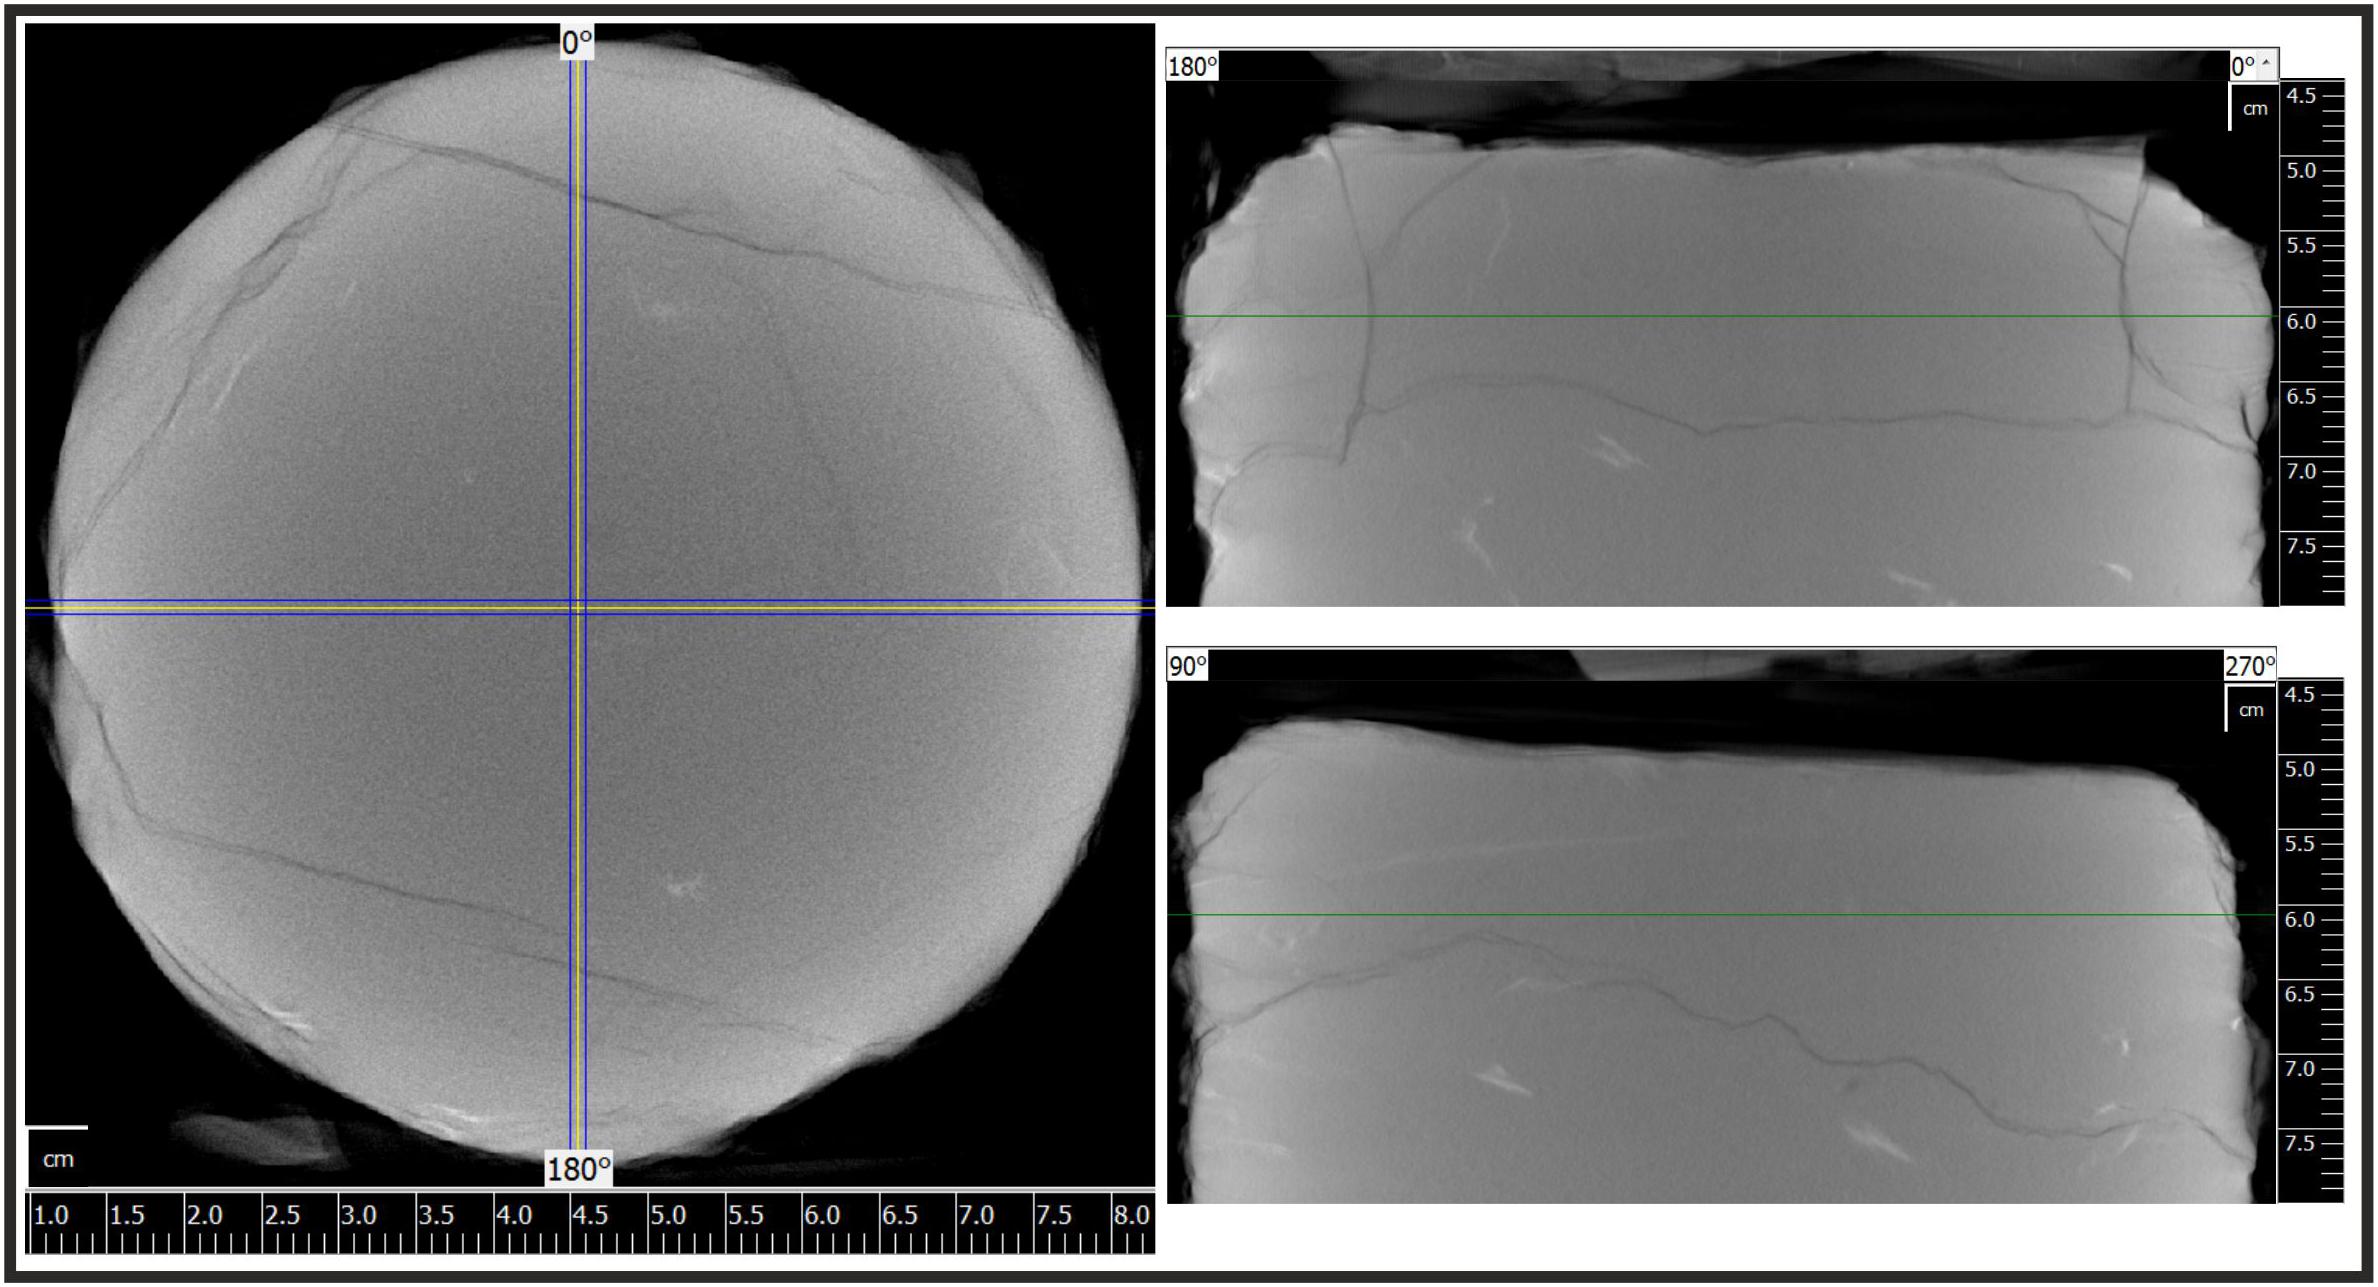
Figure 6. CT scans of the palaeosol from Melbourne 1 shown in Figure 5 at 986.90 m – 986.94 m generated using the RXCT. Left, Cross section showing incipient fractures in the core. Bottom Right, Orthogonal view (90 – 270°) of the core, Green line corresponds to the cross section shown in Top image. Top Right, Orthogonal view (0 –180°) of the core, Green line corresponds to the cross section shown in Top image.
Scanning Electron Microscopy
Scanning electron microscopy (SEI) was used to produce secondary and backscattered electron images (BSE) to make detailed high-resolution petrographical observations of the samples of core. Images were captured using a FEI QUANTA 600 environmental scanning electron microscope (ESEM) fitted with an energy-dispersive X-ray (EDX) system with an Oxford Instruments X-MAX 50 mm2 Peltier-cooled (liquid nitrogen free) silicon drift detector (SSD).
SEM observation of stub-mounted samples was undertaken initially under low vacuum conditions (typically ∼0.9 torr) using a water vapor atmosphere. Electron beam conditions were: accelerating voltage of between 10 and 15 kV and a working distance of ∼10 mm. Image brightness in BSE images is related to the density and average atomic number of the phases observed (Goldstein et al., 1981), allowing differentiation of the minerals observed in polished sections on the basis of the image brightness. Qualitative EDX data were collected simultaneously during imaging to chemically characterize the samples.
Results
Geology of the Pennine Coal Measures in Melbourne 1
Detailed Sedimentological analysis of the section was undertaken as part of this study. The PCM Group of northern and central England is a fluviolacustrine succession comprising cyclic sequences of alternating sandstone, gray siltstone and gray mudstone, with subordinate coal seams, black organic marine shales (marine bands) and seatearth (palaeosol) horizons (Guion et al., 1995). In the East Pennine Coalfield some 100 cycles have been recognized (Duff and Walton, 1962) of which at least 35 are recognized in the Melbourne 1 Borehole. In this coalfield the cycles are about 11 m thick when they include a marine band at their base, or 7 m for non-marine cycles (Duff and Walton, 1962). The studied interval (Figure 3) includes parts of two such cycles, present immediately above a major flooding event, recognized as the Aegiranum Marine Band, which shows this interval to be of earliest Bolsovian (Late Carboniferous) age (Waters et al., 2011).
The boundary between the two cycles is taken at the top of a 0.22 m-thick unnamed coal at 987 m (Figure 2A). The coal formed from plant material accumulating as peat in swamps or raised peat bogs, which were lithified following burial. The cycle above the coal is dominated by lacustrine siltstones with an intervening minor distributary channel-fill sandstone facies. The upper lacustrine facies, about 2.25 m thick, comprises micaceous and carbonaceous siltstones, commonly with plant fragments (Figure 3, Photo # 1), with parallel sandstone laminae and thicker (0.5 cm-scale) cross-laminated sandstone beds. The minor distributary channel-fill, about 1.75 m thick, shows a sharp base with initial infill by medium-grained sandstone, with common ironstone pebbles (Figure 3, Photo # 3) reworked from the underlying lacustrine mudstones, grading up to very fine, cross-laminated sandstone (Figure 3, Photo # 2). The 1.9 m-thick lacustrine facies present immediately above the coal comprises muddy siltstone, dominated by planar lamination. This interval is micaceous in the upper part, but with common secondary development of clayband ironstone (siderite/iron carbonate) nodules and bands in the lower part (Figure 3, Photo # 4), associated with conchoidal fractures within more internally structureless beds, and polished listric surfaces developed particularly adjacent to ironstone nodules.
A rooted horizon below the coal represents a palaeosol (commonly referred to as seatearths in Coal Measures successions, e.g., Guion et al. (1995) developed in argillaceous sediments beneath the mire. The interval is interpreted as an upper unleashed, gray, gley paleosol, formed where water tables were at or above ground level for prolonged periods, below which is a partly drained semi-gley palaeosol overprinting a lacustrine succession (Besly and Fielding, 1989). The palaeosol shows a distinctive upward-fining profile with upward increase in abundance of rooting and polished listric surfaces or pedogenic slickensides in the gley (Figure 3, Photo # 5), and upward decrease in red-brown iron-rich concretions, which pick out root traces or fractures in the semi-gley (Figure 3, Photo # 6). The convex-concave listric surfaces are differentiated from purely structural fractures in that arrays of slickenlines curve through arcs greater than 90o, can occur in undeformed rocks and are limited to palaeosols. These form during expansion/contraction of clay-rich vertisols where vertical movement is confined, typically during an initial better-drained phase of soil formation (Gray and Nickelsen, 1989). Resultant strong alignment of clay minerals causes reactivation during subsequent tectonic deformation. The lowermost part of the palaeosol lacks root traces and the sedimentary fabric is clearly preserved, including a sharp-based, upward-fining light gray sandstone to greenish gray mudstone in a 0.52 m succession. Iron nodules are still common but rather than listric surfaces, fractures are often filled by iron minerals (Figure 3, Photos # 7 and # 8). The lower 1.78 m part of the logged succession comprises more structureless muddy siltstones with ironstone nodules and bands and two thin, very fine-grained, upward-fining sandstone beds.
The tensile fractures appear between 984.9 m and 986.8 m and fall within the lacustrine siltstone present between the minor distributary channel-fill and the coal (Figures 2A, 3). Immediately below the coal at 987 m the DIFs terminate and a borehole breakout is present within the upper part of the palaeosol characterized by polished listric surfaces. The borehole imaging shows that the breakout formation is associated with the base of the coal (Figure 5).
Observations were made on each of the core samples taken for petrographic analysis as detailed above in section 2.4. Key characteristics were noted in each of the horizons, which are summarized below:
SSK69728 from the upper part of the gley palaeosol contains thin sheets of organic carbon (fossilized plant material, including Stigmaria: Figure 7A) on the longitudinal sample surfaces. Horizontal sections display layering of micaceous / clay material in thin sheets, forming undulating surfaces which are very smooth and polished (Figure 3, Photo # 5), with no related secondary mineralization. Along longitudinal surfaces these horizons appear as very thin, dark, hummocky or undulating layers. These listric surfaces have been previously described in the literature (e.g., Gray and Nickelsen, 1989; Enga, 2015). Occasional “dumbbells” or “sheafs” of barite crystals are present on all surfaces (Figure 8A). These morphologies have been observed as intermediate stages in spherulite growth (Andreassen et al., 2010).
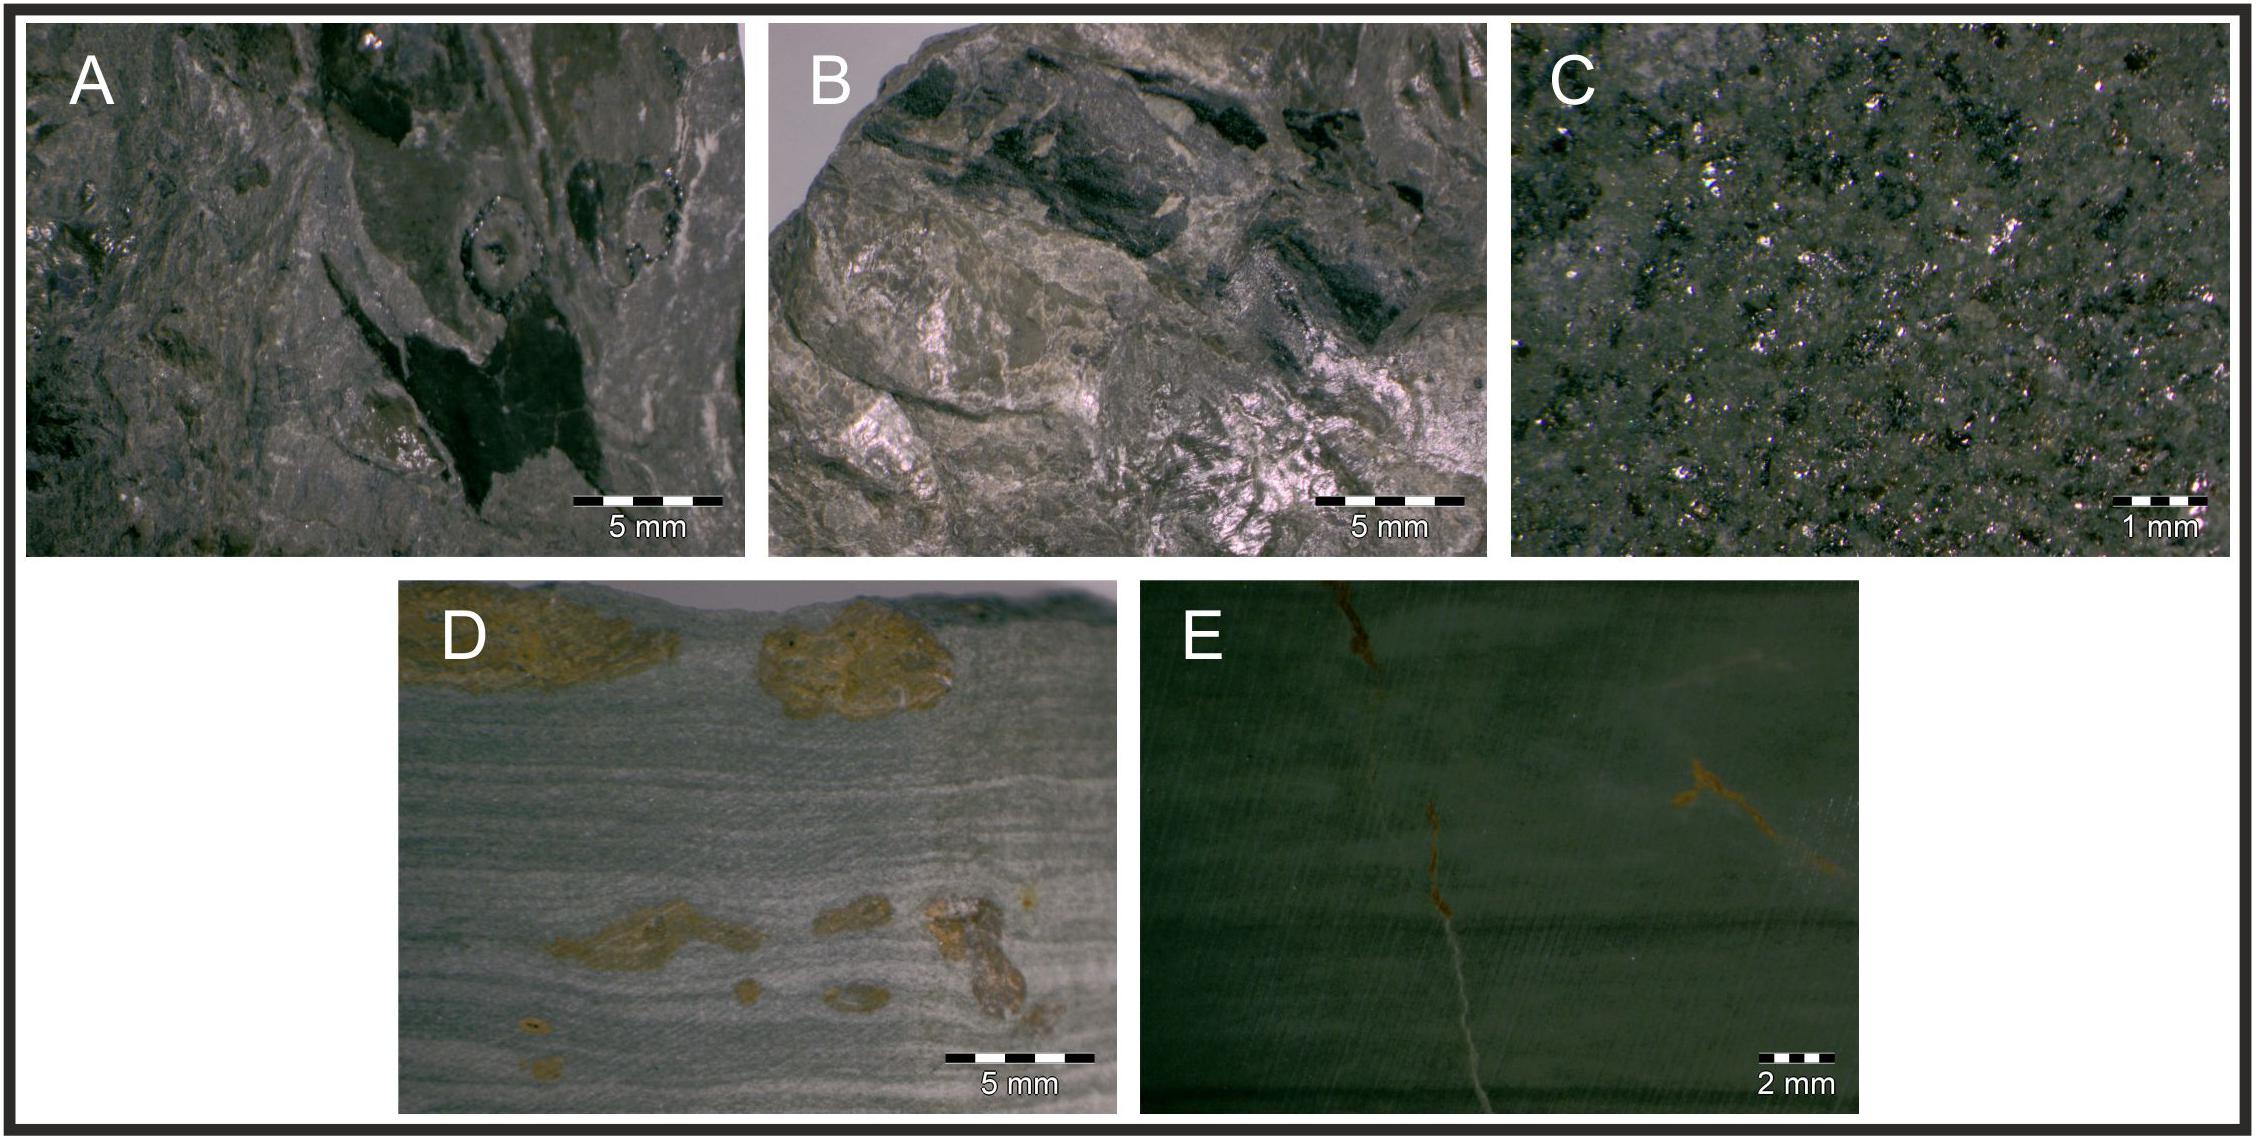
Figure 7. Optical photomicrographs from Melbourne 1 (see Figure 5 for locations of samples and Table 2 for depths). (A) Sample SSK69728 A circular feature which is typical of a fossilized Stigmaria can be observed above a patch of organic carbon, (B) Sample SSK69729 showing a polished listric surface, (C) Sample SSK69731 showing a mica-rich surface, (D) Sample SSK69731 showing horizontal laminations and Fe-nodules, (E) Sample SSK69732 showing fine-grained laminations and a microfracture with Fe-rich precipitate.
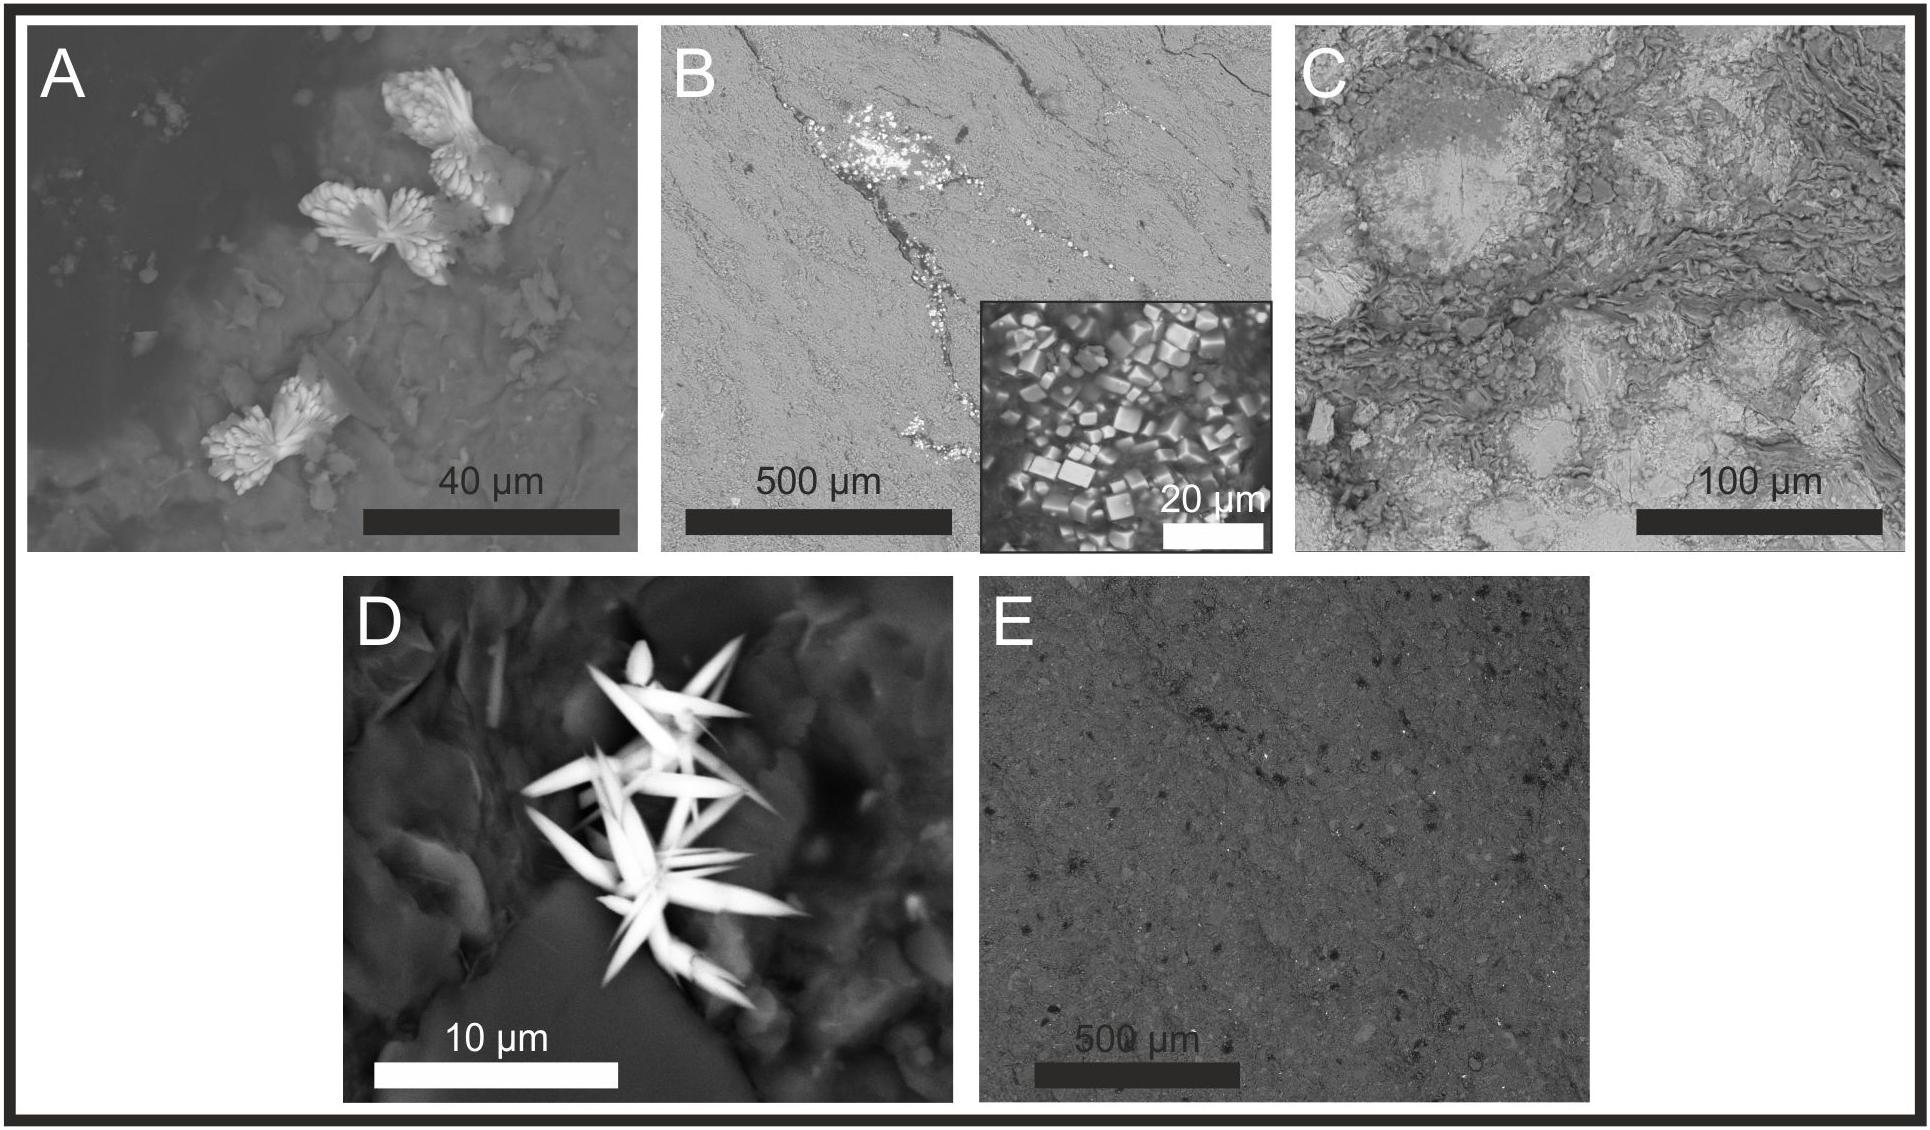
Figure 8. Back scattered electron microscope (BSEM) images from Melbourne 1 (see Figure 5 for locations of samples and Table 2 for depths). (A) Sample SSK69728 showing dumbells of barite, (B) Sample SSK69729 showing sub-horizontal veins of carbon and micro-fractures across the surface. Sulfides (pyrite and barite) are associated with the carbon. Insert shows the euhedral nature of the pyrite, (C) Sample SSK69730 showing detail of the iron oxide nodules, (D) Sample SSK69731 showing acicular crystals of barite, (E) Sample SSK69732 showing fine-grained laminations and micro-fractures, and the “polka-dot” texture defined by carbon inclusions.
SSK69729 also from the gley palaeosol contains fossilized plant material throughout, as well as the polished listric horizons (Figure 7B). Sub-horizontal fractures, which contain secondary pyrites, are also visible throughout this sample (Figure 8B). Numerous, secondary barite crystals have nucleated on top of the pyrite crystals within the fractures, but they are also closely associated with the plant fossils. This sample is extremely fissile, and a weak crenulation-type fabric is visible.
SSK69730 from the semi-gley palaeosol has strongly micro-fractured sample surfaces, with Fe oxides precipitated along the fractures (Figure 8C). Sulfates and sulfides (such as barite or pyrite), present in the previous samples, were not observed in this iron-rich sample. Secondary NaCl coatings are probably caused by the drying out of the sample.
SSK69731 from the semi-gley palaeosol is rich in micas (Figure 7C), clearly visible on the horizontal surfaces. These surfaces are also rich in thin, acicular barite crystals (Figure 8D). The sample is horizontally laminated (laminations <2 mm thickness). Orange-brown Fe-oxidation has occurred along some horizontal planes (Figure 7D), forming small concretions (siderite and ankerite) which can extend for up to 20 mm. Some lamination appears to be deformed around these features (Figure 7D), suggesting that the sediment was not fully lithified when the Fe-oxides precipitated. Under high-resolution BEM, incompetent grains are draped with sheets of more competent micaceous / clay material.
SSK69732 from the semi-gley palaeosol is very dense compared to the previous samples and is lighter in color. Horizontal depositional laminations are smooth and flat, as opposed to the undulating surfaces observed in SSK69728 and SSK69729. The laminations are finer than observed in SSK69731, and barely visible to the naked eye. Numerous, fine (<30 μm) inclusions of organic carbon give the sample a spotted appearance (Figure 8E). Micro-fractures are sub-vertical, with minor Fe oxidation (including siderite and ankerite: Figure 7E); rare sphalerite was also identified. The outputs of the core scanning and testing were compiled and compared against the wireline logs to analyse the outputs. Figure 9 shows the borehole imagery for the core studied, including the breakout zone from Melbourne 1, alongside the core scanning and rock testing data.
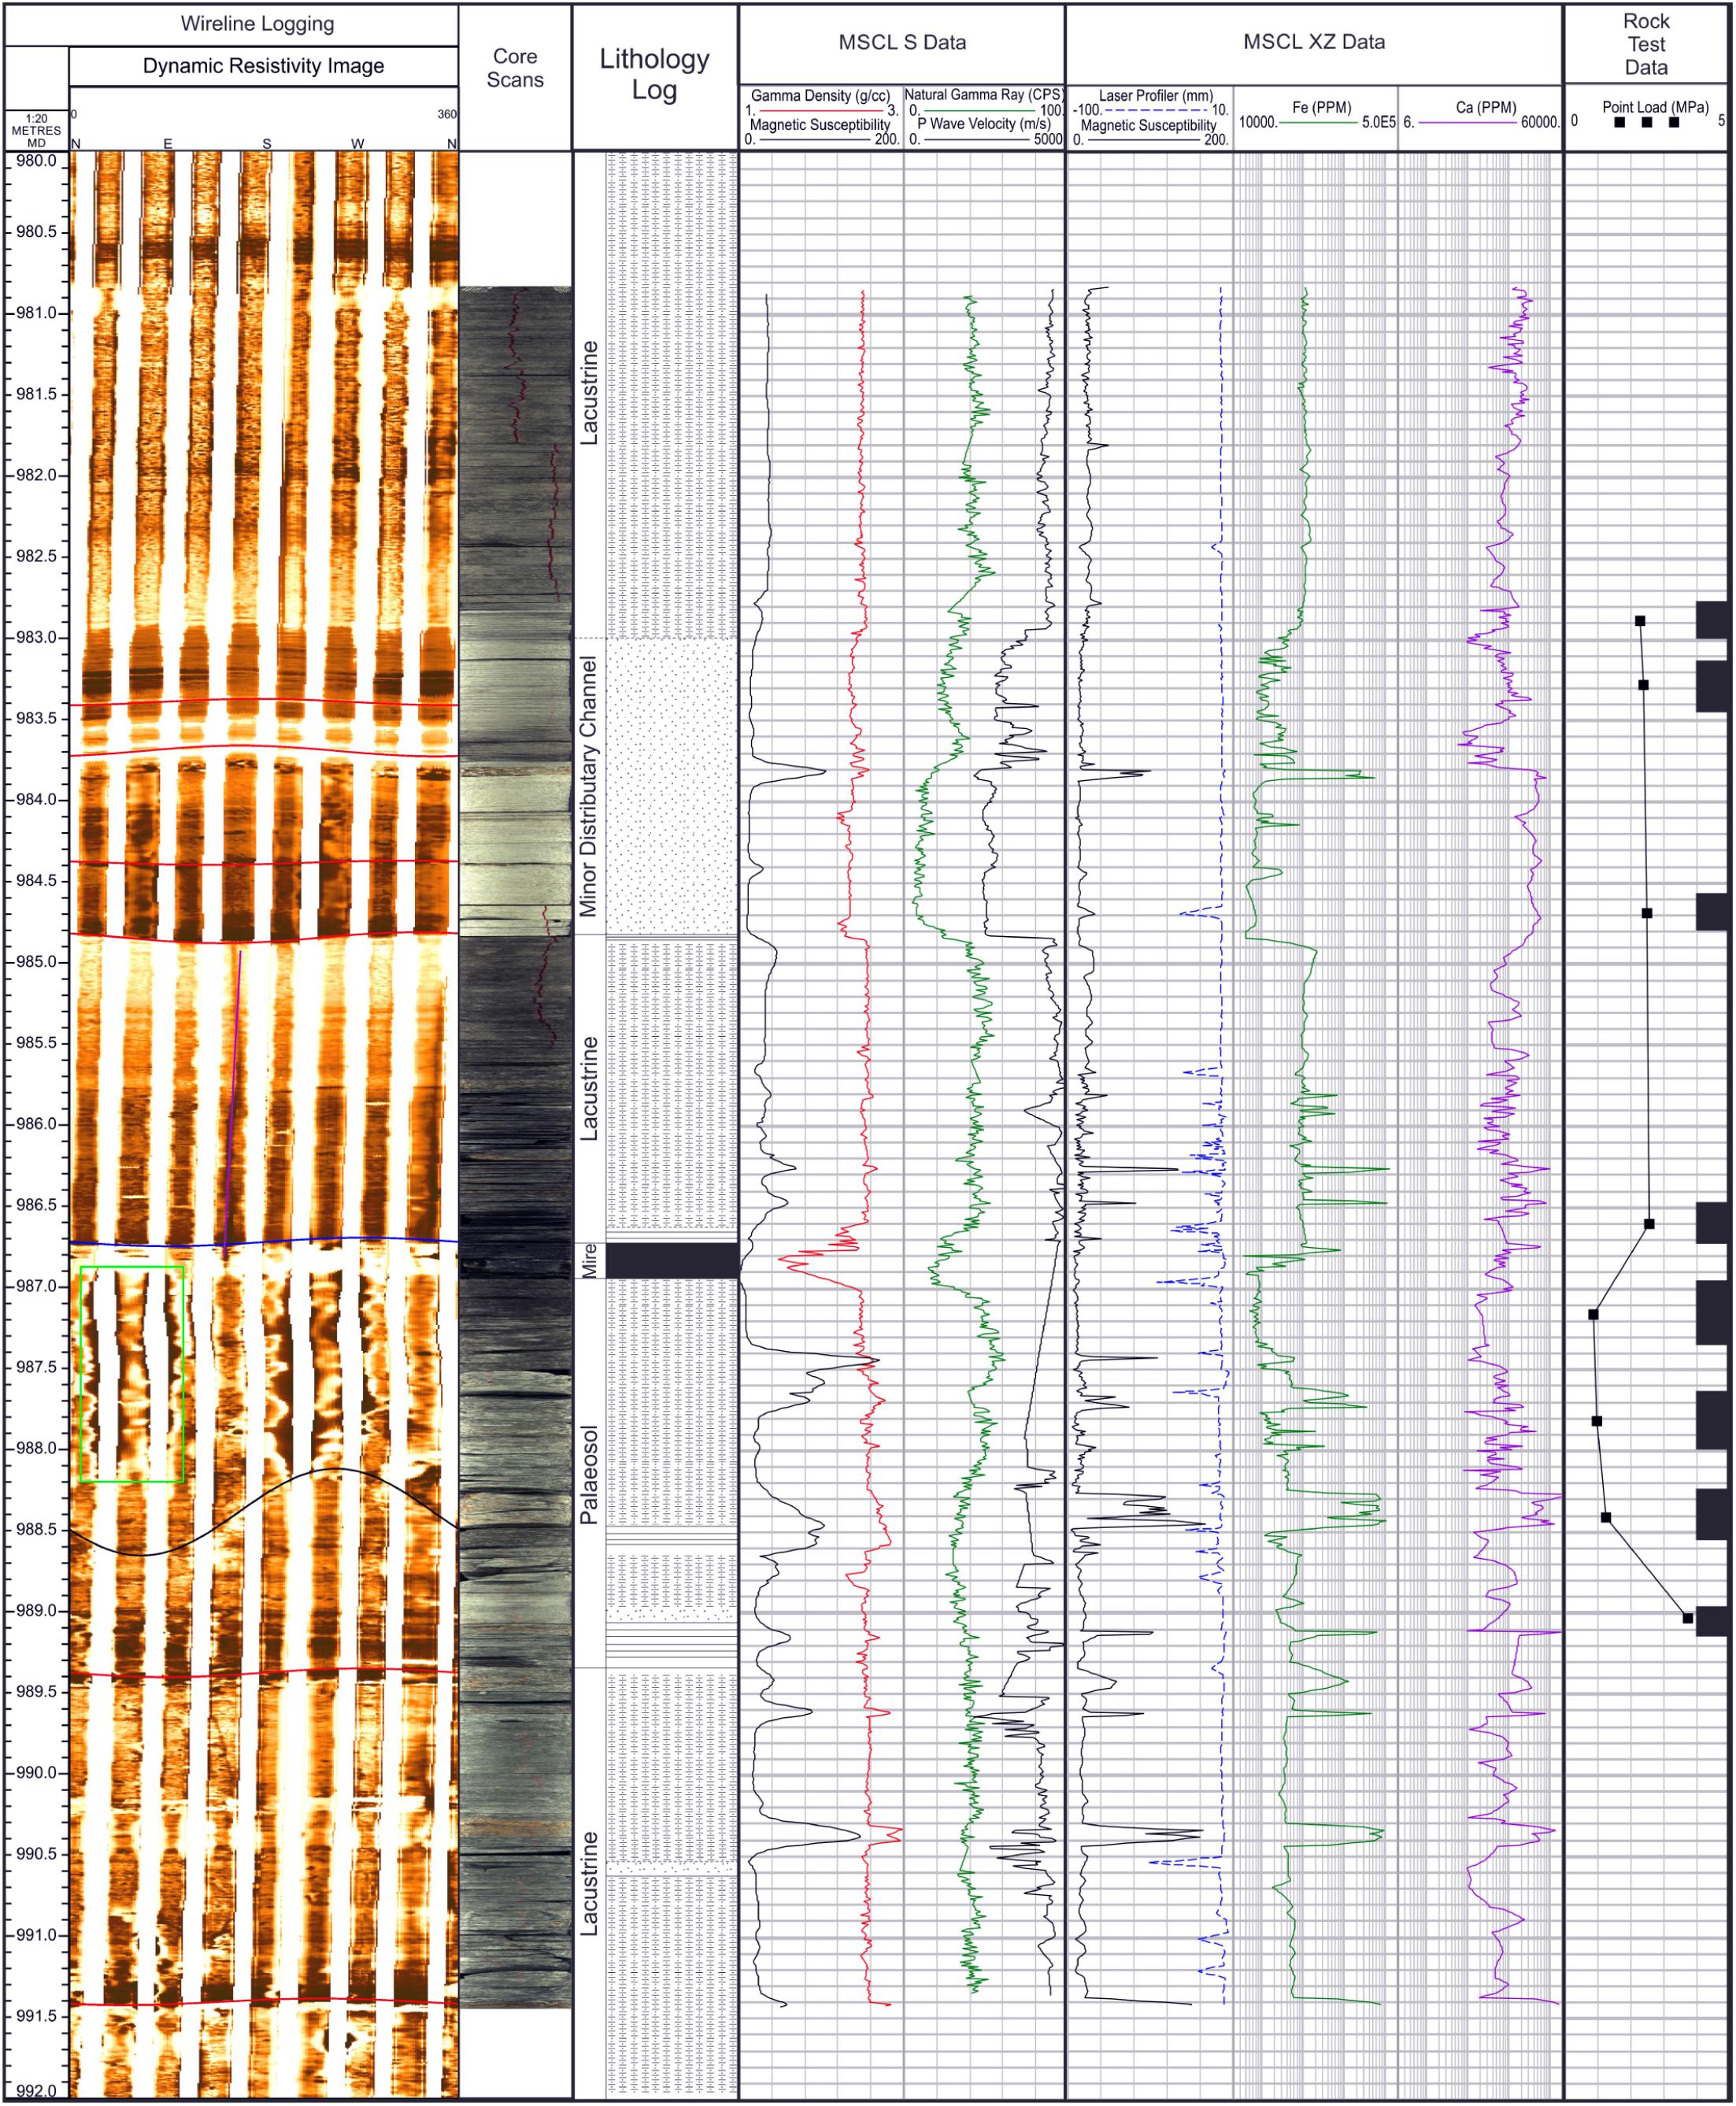
Figure 9. Depth matched plot showing the outputs of the Core Scanning and the Point Load testing for the Melbourne 1 Borehole. Left Panel, Unwrapped resistivity image (clockwise from North), breakouts highlighted by green boxes, and core images. Center Left Panel, Optical line scan images of the core from the MSCL-S and simplified lithology log derived from Figure 3. Center Panel, Selected outputs from MSCL-S physical property data including: density, p-wave velocity and gamma ray. Center Right Panel, Outputs from the MSCL-XZ showing: Iron, Calcium, and magnetic susceptibility. Right Panel, results from the Point Load testing, the intervals over which Point Load Strength (Is(50)) was calculated are shown by the black rectangles with Is(50) plotted at the mid-point of these zones.
The gamma-density track from the MSCL-S is much more sensitive to changes in lithology (Figure 9) and identifies the presence of the coal much more precisely than the wireline density tool (Figure 2A). This is possibly a result of the sampling increment between 30 mm for the wireline and 10 mm for the core scanning. However, there is little change in the density across the breakout zone (Figure 9), with the exception of an iron-rich unit of higher density at 988.25 – 988.4 m (SSK69730). The p-wave velocity track clearly identified the lithological boundary at 984.8 m, but the core was insufficiently coherent to record p-wave velocity over the breakout interval 986.7 – 988.1 m (Figure 9).
The XRF data (shown in the MSCL-XZ track Figure 9) proved most useful for pinpointing iron-rich units (e.g., at 990.4 m, 988.4 m, and 983.81 m). These are marked by Fe increases of over 200,000 ppm and Ca increases of 6000 – 15000 ppm.
The Point Load data shows a marked decrease in tensile strength of 1.3 MPa (a 56% reduction) from the lacustrine mudstone to the palaeosol (Figure 8). The base of the breakout zone corresponds to an increase of 0.1 MPa at 988.3 m, reflecting the growth of iron nodules seen in SSK69730 (Figure 8C). This variation across a small interval could be used to accurately determine in situ stress magnitude if UCS values were available over the interval.
The CT Images and the X-ray radiography both show the presence of complex fracturing within the core. The X-ray radiography (Figure 5) shows that just beneath the coal, at the top of the breakout zone (987.0 m), there is an absence of any primary sedimentary lamination and clear diagenesis. In the same interval in Figure 6, the CT images show incipient fractures or fractures that do not cross-cut the core. Micro-fracturing is observed in sample SSK69729 (Figure 8B). Figure 5 also shows that within the breakout zone at 988 m, horizontal structures such as lamination are less apparent than at 988.3 m (sample SSK69730), which has iron nodules (Figure 8C). Additionally, the X-Ray radiography shows a greater degree of fracturing at 988 m, with multiple horizontal and dipping fractures, when compared with 988.3 m where only a single horizontal fracture is visible in the radiography (Figure 5).
The pattern of the fracturing in the breakout zone also differs, with sub-vertical fractures visible (Figure 5), similar to those observed at 986.9 m (Figure 6). This demonstrates the absence of laminae directly beneath the coal seam, with fracture density decreasing toward the base of breakout zone at 988.3 m, corresponding to the growth of iron nodules within the matrix. This is supported by analysis from hand specimen and SEM which shows that toward the base of the breakout interval there are distinct horizontal laminations. The polished listric surfaces (Figure 7B) were observed from 987.09 m to the base of the studied interval, but with an upward increase in abundance (Figure 3).
Discussion
Coal seams represent only a small proportion of the total volume of the PCM but they are disproportionally associated with wellbore failure. This failure is often concentrated within the palaeosols directly beneath the coal seams.
Previous studies have focused on broad lithological properties when looking at breakout formation rather than intra-unit variation. Cuss et al. (2003) looked at the effects of porosity in sandstones on the mode of breakout formation whereas Nelson et al. (2006) examined the occurrence of breakouts in cemented sandstone units in a sandstone-shale sequence. Occurrence of breakouts has also been linked to changes in the tectonic stress regime (Ask et al., 1996; Mariucci and Müller, 2003) although there is no evidence of any stress field inversions in the area shown in Figure 1 (Kingdon et al., 2016; Fellgett et al., 2018).
To investigate how these changes were reflected in the rock using the analytical techniques detailed in the Methods section, each dataset was considered separately and then integrated. The p-wave transit time from the conventional wireline logs (Figure 9) shows a slight increase in response to the coal at 987 m and a decrease across the underlying breakout zone (987 – 988 m). This could be a response to borehole enlargement due to the formation of the breakout rather than a change in rock properties. The density log clearly detects the coal but smears this signature across 400 mm, making it difficult to distinguish the properties of the breakout zone from the wireline logs (Figure 5). It is unclear whether this is because the breakout zone is too short to characterize properly, or due to interference from the loss of material and the coal seam, but the conventional logs do not provide sufficient information to study controls on borehole breakouts.
For Melbourne 1, Point Load data show a tensile strength increase from 0.7 MPa within the palaeosol at 987.16 m, to 1 MPa within the palaeosol at 988.41 m (Figure 9 and Table 3). This results in the termination of the breakout. The tensile strength cannot be used directly to derive UCS but it is likely that the increase in the rock tensile strength also corresponds to an increase in UCS as it is expected that the weaker rocks will break out (Brodsky et al., 2017). However, this is not always the case as in some areas stronger rocks have been observed to break out preferentially (Nelson et al., 2006) and in certain environments the relationship may be more complex (Brodsky et al., 2017). The increase in tensile strength within the palaeosol in Melbourne 1 also corresponds to a slight increase on the gamma density on the MSCL-S of 0.2 G/CC and the data displayed from the XRF measurements clearly responds to the presence of iron with increases of tens of thousands of ppm in both iron and calcium (Figure 9).
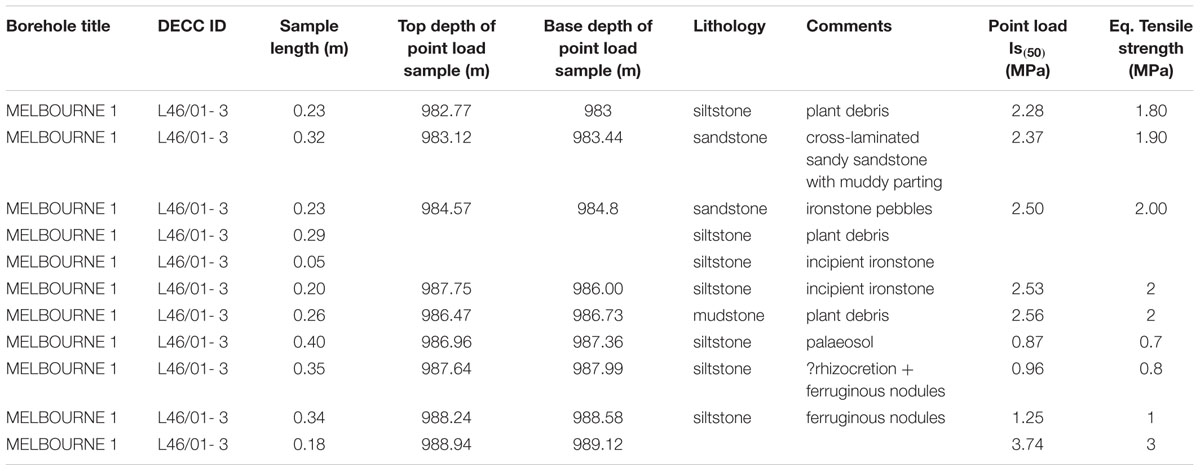
Table 3. Point Load results.
Palaeosols commonly show upward grading from coarser lithologies with few roots, but with Stigmaria and sphaerosiderite spheres up to about 2 mm, fining upward to silt or clay grade with many roots, and is in turn overlain by a coal (Guion et al., 1995). Two samples were taken from the palaeosol in this interval for petrographic analysis, SSK69728, and SSK69729. Of these SSK69728 showed traces of Stigmaria at 986.93 m (Figure 7A). Sphaerosiderite is a distinct millimeter-scale spherulitic siderite (FeCO3), which also forms as an early diagenetic product predominantly in wetland soils (Ludvigson et al., 1998). In some cases mineral accumulations can occur around the root traces which are referred to as rhizocretions (Klappa, 1980). Possible rhizocretions were observed within the palaeosol (Figure 3 and Table 3), however, neither rhizocretions nor sphaerosiderite were observed in the petrographic analysis.
Listric surfaces, or pedogenic slickensides, are more prevalent in palaeosols of clay grade, and since the parent material of the palaeosols typically shows upward fining, the listric surfaces may be expected to occur more commonly immediately beneath coal seams. Listric surfaces were observed within the study interval in both the hand specimen and petrographic analysis (Figure 3, Photo # 5; Figure 7B).
Images from the X-ray radiography (Figure 5) and the CT scans (Figure 6) show the presence of incipient fracturing at the top of the palaeosol, as well as the disruption of the primary sedimentary structures. Figure 5 also shows that with increasing distance from below the coal the number of incipient fractures reduces and the sedimentary structures become more prevalent. From below 988 m, iron precipitation was seen in micro-fractures (Figure 7E) and nodular growth of iron minerals was observed between lamina at 988.64 m. These iron rich units are also recorded on the MSCL-XZ (Figure 9). This corresponds to the increase in tensile strength which coincides with the iron mineralization.
It is not clear from the datasets available when the growth of iron within the incipient fractures (Figure 7E) and within the rock fabric (Figure 7D) occurred, but it is likely to have been shortly after deposition, consistent with Fe concentration in the lower part of the palaeosol horizon. This consistent variation between an upper clay-rich palaeosol with common roots and listric surfaces and lower Fe-rich profile with increased the tensile strength appears to constrain the location of borehole breakouts within the upper part of the palaeosol profile (Figure 9).
Borehole breakouts have been used in other studies, alongside other data such as Leak Off Tests (LOT) and UCS / triaxial tests, to undertake geomechanical analysis (Zoback et al., 2003; Chiaramonte et al., 2008; Williams et al., 2016). Such techniques also require information about drilling fluid properties and these vary downhole including temperature and mud weight. For a discussion on the implementation of these techniques see (Barton and Zoback, 1988; Moos and Zoback, 1990; Zoback et al., 2003). However, there are significant uncertainties in the determination of stress magnitudes and in particular maximum horizontal stress magnitudes which can be overestimated by 18% (Ramirez and Frydman, 2006).
Such dynamic drilling data was not available for the Melbourne 1 borehole and only a single formation integrity test has been conducted in this borehole. In the absence of UCS or triaxial tests there is not sufficient data available to undertake any meaningful geomechanical analysis for the interval described in this paper.
Conclusion
This study highlights that small changes in the composition of the palaeosol, which may not be reflected in its bulk properties, can control whether a rock fails or not. Therefore this research highlights that breakouts are controlled both within and between lithologies in the United Kingdom and that their length should not be used as a quality criteria.
Integrating multiple data types for the Melbourne 1 borehole has demonstrated that the properties for the specific breakout interval differ notably from those of the host rock around that feature. In contrast the conventional wireline logs provided no indication of changes in the physical properties of this section, therefore conventional wireline logs are not reliable indicators of the propensity of breakouts to form beneath coal seams.
The core scanning highlighted significant variation in mineralogy across the section identifying that the breakout occurred within the upper part of a palaeosol and terminated at an iron-rich unit in the lower part of the palaeosol.
A high degree of incipient fracturing was observed in the core in the interval where the breakout occurred. This corresponded to a zone in which the primary sedimentary structures have been disrupted by root traces and pedogenic discontinuities.
At the base of the breakout the growth of secondary iron was observed within the incipient fractures (Figure 7E). Nodular iron growth was also seen between laminae (Figure 7D). This mineralization appears to strengthen the rock sufficiently (evidenced by increased tensile strength) to prevent compressive failure. It is not clear when this iron growth occurred, though it is likely to have been shortly after deposition; such growth is a common constituent of partly drained semi-gley palaeosol formation, which commonly occurs below true gley palaeosols within the PCM Group (Besly and Fielding, 1989).
The use of core scanning has significantly improved the physical property information available over the interval compared with traditional wireline tools and has helped to maximize the value of the core.
Author Contributions
MF and AK initiated this research project and identified the core material of interest used in the study. MF interpreted borehole imaging data and wrote the conclusions. AK co-wrote introduction and conclusions with MF and assisted in core log integration. CW conducted detailed sedimentary logging of the discussed interval and wrote section 2. JS collected core scanning data used in the project and contributed to the methods. LF undertook petrological analysis of intervals selected by MF and contributed to the methods. MD and AO-S conducted point load analysis on the core material and contributed to methods.
Funding
This research was funded by the BGS National Capability funding from the NERC.
Conflict of Interest Statement
Core scanning was provided free of charge by Geotek Ltd., and undertaken by JS, the Sales and Services Manager.
The remaining authors declare that the research was conducted in the absence of any commercial or financial relationships that could be construed as a potential conflict of interest.
Acknowledgments
This manuscript was published with the permission of the Executive Director of the British Geological Survey. Contains Ordnance Survey data © Crown copyright and database rights. All rights reserved (2015) Ordnance Survey (100021290 EUL), Use of this data is subject to terms and conditions. We would like to thank Geotek Ltd., Daventry, United Kingdom for the extensive core scanning of the core, Composite Energy United Kingdom donated the Melbourne 1 cores to BGS upon which this research is based, Elisabeth Steer, Tim Kearsey, and John Williams for their helpful comments to improve the manuscript. Trevor Plimmer and Michael Mills of Intertek NDT Services Ltd., Derby, United Kingdom who carried out the X-ray radiography. EDX data was acquired and processed using the Oxford Energy INCA Suite software package. Borehole Imaging displayed using Landmark RECALL software.
References
Andreassen, J.-P., Flaten, E. M., Beck, R., and Lewis, A. E. (2010). Investigations of spherulitic growth in industrial crystallisation. Chem. Eng. Res. Des. 88, 1163–1168. doi: 10.1016/j.cherd.2010.01.024
Ask, V. S., Müller, B., and Stephansson, O. (1996). In situ stress determination from breakouts in the tornquist fan, denmark. Terra Nova 8, 575–584. doi: 10.1111/j.1365-3121.1996.tb00787.x
Barton, C. A., and Zoback, M. D. (1988). In-situ stress orientation and magnitude at the fenton geothermal site, new Mexico, determined from wellbore breakouts. Geophys. Res. Lett. 15, 467–470. doi: 10.1029/gl015i005p00467
Bell, J. S., and Gough, D. I. (1979). Northeast-southwest compressive stress in alberta: evidence from oil wells. Earth Planet. Sci. Lett. 45, 475–482. doi: 10.1016/0012-821X(79)90146-8
Besly, B. M., and Fielding, C. R. (1989). Palaeosols in westphalian coal-bearing and red-bed sequences, central and northern england. Palaeogeogr. Palaeoclimatol. Palaeoecol. 70, 303–330. doi: 10.1016/0031-0182(89)90110-7
Brodsky, E. E., Saffer, D., Fulton, P., Chester, F., Conin, M., Huffman, K., et al. (2017). The postearthquake stress state on the Tohoku megathrust as constrained by reanalysis of the JFAST breakout data. Geophys. Res. Lett. 44, 8294–8302. doi: 10.1002/2017GL074027
Chiaramonte, L., Zoback, M. D., Friedmann, J., and Stamp, V. (2008). Seal integrity and feasibility of CO2 sequestration in the teapot dome EOR pilot: geomechanical characterization. Environ. Geol. 54, 1667–1675. doi: 10.1007/s00254-007-0948-7
Cuss, R. J., Rutter, E. H., and Holloway, R. F. (2003). Experimental observations of the mechanics of borehole failure in porous sandstone. Int. J. Rock Mech. Min. Sci. 40, 747–761. doi: 10.1016/S1365-1609(03)00068-6
Duff, P. M. D., and Walton, E. K. (1962). Statistical basis for cyclothems: a quantitative study of the sedimentary succession in the east pennine coalfield. Sedimentology 1, 235–255. doi: 10.1111/j.1365-3091.1962.tb01149.x
Ekstrom, M. P., Dahan, C., Chen, M.-Y., Lloyd, P., and Rossi, D. J. (1987). Formation imaging with microelectrical scanning arrays. Log. Anal. 28, 294–306. doi: 10.1088/1741-2560/6/6/066009
Enga, J. (2015). Palaeosols in the Triassic De Geerdalen and Snadd Formations. Master thesis, Norwegian University of Science and Technology, Trondheim.
Fellgett, M. W., Kingdon, A., and Williams, J. D. O. (2017). UK stress field orientation from borehole breakouts and drilling induced tensile fractures identified using borehole imaging. doi: 10.5285/cb9c22d8-53f1-489fb4d3-5d008d2a7841
Fellgett, M. W., Kingdon, A., Williams, J. D. O., and Gent, C. M. A. (2018). Stress magnitudes across UK regions: new analysis and legacy data across potentially prospective unconventional resource areas. Mar. Pet. Geol. 97, 24–31. doi: 10.1016/j.marpetgeo.2018.06.016
Gaillot, P., Brewer, T., Pezard, P., and Yeh, E. C. (2007). Contribution of borehole digital imagery in core-log-seismic integration. Sci. Drilling 5, 50–53. doi: 10.5194/sd-5-50-2007
Goldstein, J., Newbury, D. E., Echlin, P., Joy, D. C., Fiori, C., and Lifshin, E. (1981). Scanning Electron Microscopy and X-Ray Microanalysis: A Text for Biologists, Materials Scientists, and Geologists. New York, NY: Springer.
Gray, M. B., and Nickelsen, R. P. (1989). Pedogenic slickensides, indicators of strain and deformation processes in redbed sequences of the appalachian foreland. Geology 17, 72–75.
Gross, M. R. (1995). Fracture partitioning: failure mode as a function of lithology in the monterey formation of coastal. california. Geol. Soc. Am. 107, 779–792. doi: 10.1130/0016-7606(1995)107%3C0779%3Afpfmaa%3E2.3.co%3B2
Guion, P. D., Fulton, I. M., and Jones, N. S. (1995). “Sedimentary facies of the coal-bearing westphalian A and B north of the wales-brabant high,” in European Coal Geology, eds M. K. G. Whateley and D. A. Spears (London: Geological Society), 45–78. doi: 10.1144/gsl.sp.1995.082.01.03
Gunn, D. E., and Best, A. I. (1998). A new automated nondestructive system for high resolution multi-sensor core logging of open sediment cores. Geo. Mar. Lett. 18, 70–77. doi: 10.1007/s003670050054
Heidbach, O., Rajabi, M., Reiter, K., Ziegler, M., and Wsm Team. (2016). World Stress Map Database Release 2016. Potsdam: GFZ.
Heidbach, O., Tingay, M., Barth, A, Reinecker, J., Kurfeβ, D., and Müller, B. (2010). Global crustal stress pattern based on the World Stress Map database release 2008. Tectonophys 482, 3–15, doi: 10.1016/j.tecto.2009.07.023
Kingdon, A., Fellgett, M. W., and Williams, J. D. O. (2016). Use of borehole imaging to improve understanding of the in-situ stress orientation of central and northern england and its implications for unconventional hydrocarbon resources. Mar. Pet. Geol. 73, 1–20. doi: 10.1016/j.marpetgeo.2016.02.012
Klappa, C. F. (1980). Rhizoliths in terrestrial carbonates: classification, recognition, genesis and significance. Sedimentology 27, 613–629. doi: 10.1111/j.1365-3091.1980.tb01651.x
Ludvigson, G. A., González, L. A., Metzger, R. A., Witzke, B. J., Brenner, R. L., Murillo, A. P., et al. (1998). Meteoric sphaerosiderite lines and their use for paleohydrology and paleoclimatology. Geology 26, 1039–1042.
Mariucci, T. M., and Müller, B. (2003). The tectonic regime in Italy inferred from borehole breakout data. Tectonophysics 361, 21–35. doi: 10.1016/S0040-1951(02)00536-X
Moos, D., and Zoback, M. D. (1990). Utilization of observations of well bore failure to constrain the orientation and magnitude of crustal stresses: application to continental, deep sea drilling project, and ocean drilling program boreholes. J. Geophys. Res. 95, 9305–9325.
Nelson, E., Hillis, R., and Mildren, S. (2006). Stress partitioning and wellbore failure in the west tuna area. Gippsland basin. Exp. Geophys. 37, 215–221. doi: 10.1071/eg06215
Paillet, F. L., and Kim, K. (1987). Character and distribution of borehole breakouts and their relationship to in situ stresses in deep columbia river basalts. J. Geophys. Res. 92, 6223–6234.
Peška, P., and Zoback, M. D. (1995). Compressive and tensile failure of inclined well bores and determination of in situ stress and rock strength. J. Geophys. Res. 100, 12791–12811. doi: 10.1029/95jb00319
Ramirez, H. A., and Frydman, M. (2006). “Using breakouts for in situ stress estimation in tectonically active areas,” in Proceedings of the 41st U.S. Symposium on Rock Mechanics (USRMS) Golden Rocks 2006, Golden, CO.
Reinecker, J., Tingay, M., Müller, B., and Heidbach, O. (2010). Present-day stress orientation in the molasse basin. Tectonophysics 462, 129–138. doi: 10.1016/j.tecto.2009.07.021
Rogers, S. F., Bailey, D. E., and Kingdon, A. (2000). Orientation of drill core by use of borehole geophysical imaging. Appl. Earth Sci. 109, 184–190. doi: 10.1179/aes.2000.109.3.184
Tingay, M., Reinecker, J., and Müller, B. (2008). Borehole Breakout and Drilling-Induced Fracture Analysis from Image Logs World Stress Map Project—Guidelines Image Logs, Helmholtz Cent. Potsdam: GFZ German Research Centre for Geosciences.
Ulusay, R., and Hudson, J. A. (2007). The Complete ISRM Suggested Methods for Rock Characterization, Testing and Monitoring: 1974-2006. Ankara: ISRM.
Vatandoost, A., Fullagar, P., and Roach, M. (2008). Automated multi-sensor petrophysical core logging. Exp. Geophy. 39, 181–188. doi: 10.1071/eg08020
Waters, C. N., Jones, N. S., Collinson, J. D., and Cleal, C. J. (2011). Chapter 11: craven basin and southern pennines. 26, 74–81. doi: 10.1144/sr26.11
Williams, J. D. O., Fellgett, M. W., Kingdon, A., and Williamson, J. P. (2015). In-situ stress orientations in the UK southern north sea: regional trends, deviations and detachment of the post-zechstein stress field. Mar. Pet. Geol. 67, 769–784. doi: 10.1016/j.marpetgeo.2015.06.008
Williams, J. D. O., Fellgett, M. W., and Quinn, M. F. (2016). Carbon dioxide storage in the captain sandstone aquifer: determination of in situ stresses and fault-stability analysis. Pet. Geosci. 22, 211–222. doi: 10.1144/petgeo2016-036
Keywords: borehole breakouts, lithology, failure, deformation, core scanning, petrography
Citation: Fellgett MW, Kingdon A, Waters CN, Field L, Shreeve J, Dobbs M and Ougier-Simonin A (2019) Lithological Constraints on Borehole Wall Failure; a Study on the Pennine Coal Measures of the United Kingdom. Front. Earth Sci. 7:163. doi: 10.3389/feart.2019.00163
Received: 28 January 2019; Accepted: 07 June 2019;
Published: 02 July 2019.
Edited by:
Ivar Midtkandal, University of Oslo, NorwayReviewed by:
Kim Senger, The University Centre in Svalbard, NorwayMaria Ansine Jensen, The University Centre in Svalbard, Norway
Copyright © 2019 Fellgett, Kingdon, Waters, Field, Shreeve, Dobbs and Ougier-Simonin. This is an open-access article distributed under the terms of the Creative Commons Attribution License (CC BY). The use, distribution or reproduction in other forums is permitted, provided the original author(s) and the copyright owner(s) are credited and that the original publication in this journal is cited, in accordance with accepted academic practice. No use, distribution or reproduction is permitted which does not comply with these terms.
*Correspondence: Mark W. Fellgett, markf@bgs.ac.uk