A multi-scale temperature-based strategy to map hydrologic exchange flows in highly dynamic systems
 Frederick D. Day-Lewis
 Patrick Royer†
  Luke Placzek
 Kameron Markham
- Pacific Northwest National Laboratory, Earth Systems Science Division, Richland, WA, United States
Mapping and quantifying hydrologic exchange flows (HEFs) is critical to environmental monitoring and remediation at contaminated sites; however, these objectives are challenging in highly dynamic systems, e.g., along dam-regulated rivers, where HEFs vary rapidly. Direct seepage measurements are labor-intensive and difficult to automate, whereas indirect (e.g., thermal) and remote sensing methods have potential to allow continuous monitoring with limited field effort. We present a preliminary assessment of a multi-scale temperature-based strategy for monitoring HEFs along the Hanford Reach of the Columbia River, in eastern WA, United States. Five thermal methods were assessed. First, a vertical temperature profile (VTP) was installed into the streambed. The VTP data were analyzed using a data assimilation algorithm designed for automated real-time estimation in dynamic systems. Second, a thermal infrared (TIR) camera was used in roving surveys to identify seeps. Third, a TIR camera was stationed at the VTP site to collect images at 1-h intervals. Together, the two TIR datasets provided a basis to assess the potential for drone-based TIR. Fourth, temperature was measured at the sediment/water interface to assess fiber-optic distributed temperature sensing. Fifth, imagery from the ECOSTRESS satellite mission was acquired to assess the potential of spaceborne thermal monitoring. Based on our preliminary assessment, VTP, TIR, and bed temperature measurements provide complementary spatial coverage, temporal sampling, and resolution; these methods have potential for long-term, automated monitoring of HEFs. The publicly available spaceborne imagery, however, proved inadequate because of insufficient spatial resolution and data gaps resulting from cloud cover and revisit frequency.
Introduction
Characterizing and quantifying hydrologic exchange flows (HEFs) is important to understanding and addressing fate and transport of contaminants at the Hanford Site in eastern WA, United States. HEFs between the aquifer system and the Columbia River vary substantially in space and time due to geomorphologic and river-stage controls, respectively (e.g., Arntzen et al., 2006; Fritz and Arntzen, 2007; Slater et al., 2010; Johnson et al., 2012; Shuai et al., 2019; Chen et al., 2022; Johnson et al., 2022). HEFs comprise bidirectional water exchange through both the bank and bed, and thus include nested hyporheic and groundwater flow paths. Mapping and quantifying the spatial and temporal distribution of HEFs is difficult and costly using direct measurements with seepage meters (Lee, 1977); these issues are further compounded at the Hanford Site by challenges associated with the highly dynamic, dam-regulated Columbia River and the armoring of the streambed. Large (>1 m) diel stage fluctuations, and coarse bed sediments complicate the use of seepage meters and installation of piezometers. Although electronic seepage meters and differential pressure transducers have enormous potential (e.g., Fritz et al., 2009), heat tracing requires only low-cost and robust passive sensors and thus is more amenable to automated, autonomous, and cost-effective measurement over long periods of time (e.g., Zhou et al., 2017).
Measurements of temperature have been interpreted qualitatively to map the spatial pattern of HEFs and quantitatively to infer water flux in diverse environments (Anderson, 2005). Vertical temperature profiles (VTPs) collected over time below the sediment/water interface (SWI) can be analyzed using signal-extraction approaches (e.g., Hatch et al., 2006; Gordon et al., 2012) or model-calibration (e.g., Lapham, 1989; Koch et al., 2016) to yield quantitative estimates of water flux across the SWI, both upwelling and downwelling, in lotic and lentic environments. VTP-based estimates of flux are highly local to VTP probes, which is both an advantage and disadvantage. On one hand, VTPs can resolve spatial variability in flux where exchange varies as a function of permeability, as at the Hanford Site. On the other hand, VTPs are poorly suited to finding seeps or mapping HEFs spatially.
For mapping HEFs, appropriate thermal technologies include thermal infrared (TIR) imaging (e.g., Torgersen et al., 2001; Deitchman and Loheide 2006; Loheide and Gorelick, 2006; Briggs et al., 2013), and fiber-optic distributed temperature sensing (FO-DTS) (e.g., Selker et al., 2006; Slater et al., 2010). TIR imaging can measure spatially distributed temperatures using handheld or mounted cameras (e.g., Loheide and Gorelick, 2006) or aerial surveys (e.g., Briggs et al., 2019; Harvey et al., 2019). TIR imagery has been analyzed quantitatively to infer seepage (e.g., Loheide and Gorelick, 2006), but it is more commonly used to qualitatively map the spatial distribution of seepage (e.g., Briggs et al., 2013; Briggs et al., 2019; Harvey et al., 2019). The sensitivity of TIR measurements is limited to the surface skin (first ∼0.1 mm; Abolt et al., 2018) of the target, i.e., the water surface; thus, TIR cannot sense flux from a stream downward through the streambed (downwelling) or from the stream into the bank. Furthermore, the effectiveness of TIR to detect upwelling also requires that 1) a sufficient temperature contrast exists between seepage and surface water, and 2) the water column is sufficiently shallow or unmixed that the seepage manifests a detectable signal. TIR sensitivity to upwelling is optimal in winter conditions, when discharging water is warm and buoyant relative to surface water (e.g., Harvey et al., 2019); however, stage and discharge are also considerations.
Spaceborne imaging has potential to extend the capabilities of ground and airborne TIR to the regional scale; however, the resolution of publicly available spaceborne imaging is several orders of magnitude inferior to that of ground-based TIR. For monitoring applications, temporal resolution is also limited. For example, the ECOsystem Spaceborne Thermal Radiometer Experiment on Space Station (ECOSTRESS) satellite mission (e.g., Fisher et al., 2020) and Landsat have revisit times of 4 and 16 days, respectively. Furthermore, the timing of image acquisition is fixed by the satellite’s orbit and may not be optimal for a given locality (i.e., when emissivity is at its diurnal peak). Lack of cloud-free images can also pose challenges.
Temperature measurements at the SWI provide information to map seepage spatially (e.g., Conant, 2004) and can be acquired using thermistors, thermocouples, or FO-DTS. Whereas the first two are point measurements, FO-DTS provides spatially distributed measurements along cables of up to several kilometers in length (e.g., Selker et al., 2006). FO-DTS is well suited to long-term automated monitoring. In terms of spatial coverage, FO-DTS is limited to providing information only at the cable. FO-DTS at the SWI has been used to infer the spatial locations (e.g., McCobb et al., 2018) and timing (e.g., Slater et al., 2010) of seepage. Like TIR, FO-DTS cannot detect downwelling when deployed above the SWI, although mixing and the buoyancy of discharging water are less important than for TIR.
The Hanford Site (Figure 1A) is an area of over 500 miles2 located in eastern WA, United States. Now operated by the Department of Energy, the site was used for over 40 years starting in 1943 for nuclear reactor fuel fabrication, reactor operations, and chemical separation. Fluids containing radioisotopes and metals were discharged to the shallow subsurface, and environmental remediation efforts are ongoing. The Columbia River, which borders the site, is regulated by a series of hydropower dams, which results in large stage fluctuations, commonly exceeding a meter a day. Dam operations and seasonal precipitation and snowmelt patterns result in highly dynamic exchange between the aquifer and river, with high-frequency flow reversals (e.g., Arntzen et al., 2006; Fritz and Arntzen, 2007; Johnson et al., 2012; Johnson et al., 2022). The annual average flow in the Hanford Reach was 3,360 m3/s, and average daily flows varied from 1,000 to 10,000 m3/s during the period from 1994–2005 (Fritz et al., 2009). Additional complexity in HEFs is imposed by the morphology of the streambed and permeability heterogeneity arising from the distribution and variability of reworked alluvial deposits derived from the Hanford and Ringold formations (Figure 1B). HEFs are focused where more permeable streambed deposits connect the groundwater system to the river. The pattern of discharge to the river is thus spatially and temporally complex; hence new approaches are needed at Hanford and in other dynamic systems to monitor exchange and provide hydraulic context to guide sampling design and interpretation.
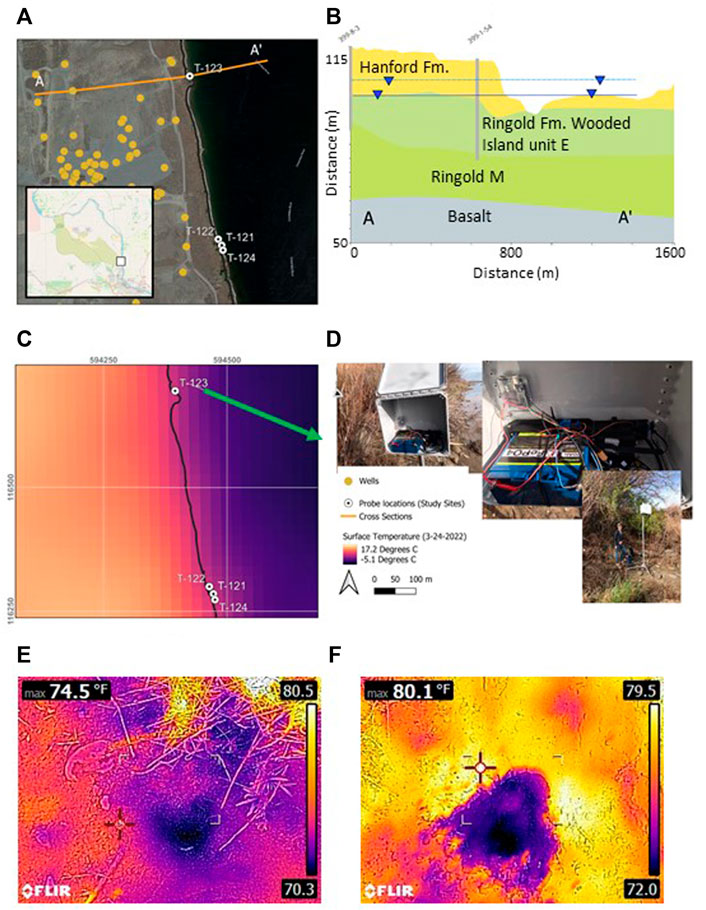
FIGURE 1. (A) Study site and location of probes, highlighting T-123, wells (yellow circles), and cross-section transect; (B) cross section along transect A-A′ in (A), (C) ECOSTRESS thermal image from 6:28 p.m. local time 3/24/2022; (D) thermal camera setup for automated monitoring; (E) TIR image of the water surface collected in shallow (∼6 cm) surface water using the FLIR E8-XT within 5 feet of T-123 on 9/12/2022; and (F) TIR image collected of the SWI in the absence of surface water using the FLIR E8-XT within 5 feet of T-123 on 9/12/2022. In (E) and (F), focused seeps appear as cold anomalies, and the field of view is approximately 1 m in the x direction.
Our objective in this brief report is to present a preliminary assessment of five different technologies for a multi-scale strategy to map and quantify seepage along the Hanford Reach of the Columbia River and in highly dynamic systems in general.
Materials and method
We assess the utility of 1) VTPs collected in the streambed, 2) roving TIR imaging, 3) time-series TIR imaging of water surface temperature, 4) spaceborne thermal imaging of surface temperature, and 5) temperature measurements at the SWI. Flux estimates based on the VTP data provide a basis to evaluate the other types of temperature data for identifying where and when HEFs (especially discharge to surface water) occur.
VTP-based flux estimation
A TRodX (AlphaMach) VTP was installed in the bed of the Columbia River in the Hanford Reach within the transition between the free-flowing river and McNary pool (Figure 1A) at a site where seepage was observed visually and confirmed using handheld TIR. The probe contained sensors along its vertical length. A hole was piloted and the TRodX inserted to achieve sensor depths of 0.00, 0.05, 0.10, 0.15, 0.25, and 0.35 m below the SWI. Data were collected at a 10-min interval. The sensor resolution, R, is reported to be 0.0625°C. Sensor calibration was checked using a water bath to confirm readings were within sensor resolution. The VTP results provide a basis for assessing the ability of TIR, satellite-based imaging, and SWI temperature to detect upwelling. For the VTP analysis, we did not consider data from the 0.00-m depth thermistor which instead were used as proxy for FO-DTS deployed at the SWI.
We use the recently published tempest1d library (McAliley et al., 2022a; McAliley et al., 2022b) to analyze the VTP data. tempest1d includes tools for analysis of VTP data collected in highly dynamic systems subject to rapid changes and reversals in flux. We implement the library’s Extended Rauch-Tung-Striebel Smoother (ERTSS) as a fixed-interval smoother, i.e., the full dataset is used for rolling estimation of flux over time; however, tempest1d also includes filtering codes for real-time data analysis.
The VTP analysis requires 1) values for sediment thermal properties, 2) a model for measurement error, and 3) a model for the process covariance. We measured thermal conductivity and heat capacity in situ using a Tempos analyzer and SH-3 probe (Meter Group). Three measurements were collected and averaged. Temperature measurement error was assumed to be gaussian white noise with a standard error,
The analysis of over 20,000 VTP measurements required ∼10 min of CPU time on an Intel(R) i7-1185G7 3.00 GHz processor with 16 GB of RAM. Most of the CPU time was devoted to identification of the process noise model. In practice, this would be performed once (or perhaps on a schedule) and the tempest1d filtering algorithm would assimilate new data as they became available and update estimates in real time.
Temperature at the SWI
As a proxy for FO-DTS, a temperature sensor was located at the SWI. We compare the resulting SWI data with the co-located flux estimates, but, of course, the proxy data does not demonstrate the value of FO-DTS being spatially distributed. Current FO-DTS technology has sub-meter resolution in space, and, depending on instrument configuration, the temperature accuracy and precision of FO-DTS is similar to point-measurement instruments. FO-DTS has been used to locate seeps and qualitatively monitor discharge over time. In some studies, FO-DTS data have been analyzed using time-frequency (Henderson et al., 2009) and classification methods (Mwakanyamale et al., 2013) to map seepage locations within a probabilistic framework. Here, we use wavelet coherence (Grinsted et al., 2004) to assess the potential of relating FO-DTS to discharge (i.e., upwelling not downwelling).
From mid-March to early-May, stage was low (Figure 2A), and the FO-DTS proxy was in very shallow water or else exposed, as confirmed visually using the optical images from the TIR camera. Our proxy for FO-DTS thus was strongly affected by, or else measuring, air temperature; this complication must be expected for FO-DTS deployments in shallow water in highly dynamic systems. We therefore limit the coherence analysis to data from mid-May through July, when stage was high and both upwelling and downwelling occurred.
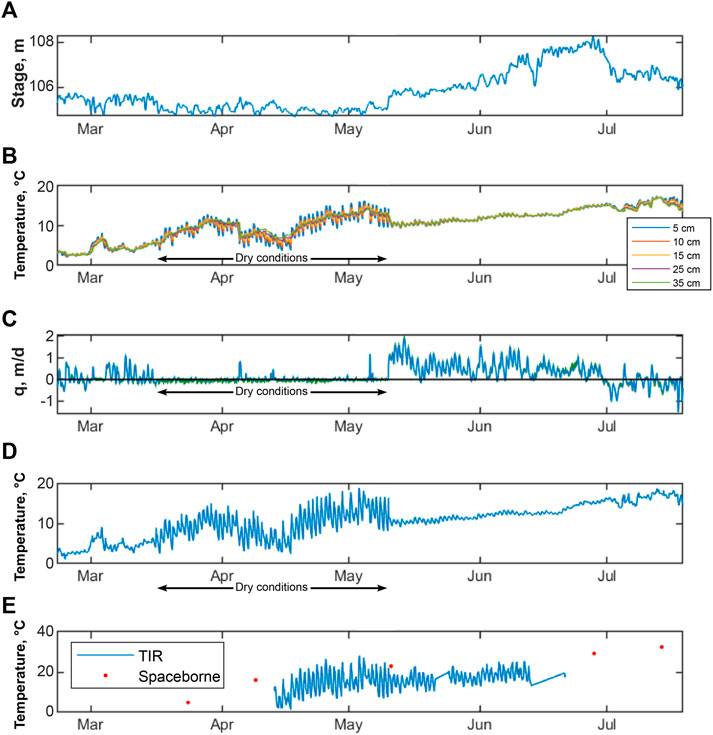
FIGURE 2. (A) Columbia River stage measured in the Hanford Reach ∼900 m south (downstream) of the study site; (B) VTP data at different depths below the SWI; (C) estimated flux with upwelling negative and downwelling positive; (D) temperature measured at the SWI; (E) TIR time-series and ECOSTRESS data.
TIR surveys and monitoring
TIR data were collected in two modes 1) roving TIR surveys with handheld cameras were used to detect locations of focused HEFs and thus assess the potential for drone-based TIR; and 2) a mounted camera was programmed to collect time-series TIR imaging at a single location at 60-min intervals to ground-truth the spaceborne images, which are lower resolution. A FLIR E8-XT camera was used for roving “snapshot” surveys, and a FLIR Duo Pro R camera in a waterproof enclosure with an infrared (IR) window was used for time-series data collection. The Duo Pro R was mounted approximately 2.5 m above the SWI and 2.25 m above the water surface at the time of its installation to take images with a downward planar view; however, the Columbia River is highly dynamic, and high stage conditions prevented data collection for much of the study period (Figures 1A,D). Both cameras have thermal sensitivities of <0.05°C per the manufacturer. The goal of roving surveys is anomaly detection, and the goal for time-series monitoring is correlation of fluctuations with other datasets. Neither goal requires field calibration to correct for instrument bias (e.g., Harvey et al., 2019), although this would be important for measurement of absolute temperature.
Spaceborne thermal imaging
Temperature imagery from the ECOSTRESS satellite mission (Fisher et al., 2020) was acquired. Compared to drone-based IR, spaceborne imaging offers synoptic data, which obviates corrections for time variations and thus facilitates interpretation. The satellite images were collected every 4 days at 6:28 p.m. Pacific Standard Time, which is sub-optimal for inference of groundwater discharge, for which sensitivity is maximized during the hottest or coldest times of day, respectively, in warm and cold months. The image pixel size is ∼21 m; thus, a single pixel may cover both land and water depending on river stage (Figure 1B).
Cloud cover and lack of tier 1 data limited useable ECOSTRESS data to six images during the period of VTP data collection and only one image during the period of TIR camera operations. The paucity of spaceborne data during the study period prevents use of the wavelet and other time-series comparisons with other data types. In our assessment, the spaceborne data could not be correlated with flux estimates and could not resolve areas where HEFs are focused. For this reason, we limit presentation of spaceborne results and refer the reader to the Supplemental Information.
Results
The experimental results are shown and compared in Figure 2 for a 5-month period starting in late February 2022. Short gaps (a few to tens of samples) in VTP data resulted from instrument issues and dropped measurements during download. Longer data gaps occurred with the TIR monitoring because of power issues and the rise of stream stage above the mounted camera. Gaps between spaceborne datasets precluded their further consideration (Figure 2E).
VTP-based flux estimation
The tempest1d analysis yields estimates of flux as specific discharge, q. By convention, q is positive downward, negative upward; hence, positive q indicates downwelling and negative indicates upwelling. The results (Figure 2A, Figure 3) show reversals driven by seasonal and higher-frequency fluctuations in the hydraulic gradient between the river and aquifer. The flux estimates indicate predominant upwelling during low-stage conditions in winter and early spring and predominant downwelling during high-stage conditions in later spring and into summer as stage rises; however, notable high-frequency fluctuations and flow reversals occur throughout the study period. During very low stage, when the streambed in the vicinity of the VTP was dry except for a few days, the analysis produced flux estimates close to zero, thus highlighting the robustness of the algorithm. tempest1d matched the data, on average to the target root-mean-squared error of 0.04°C. The range of flux estimates compares favourably with that of Chen et al. (2022) (−1.5 to 1.5 m/d). Although data gaps are problematic for signal-extraction approaches, data gaps posed no significant challenges to tempest1d.
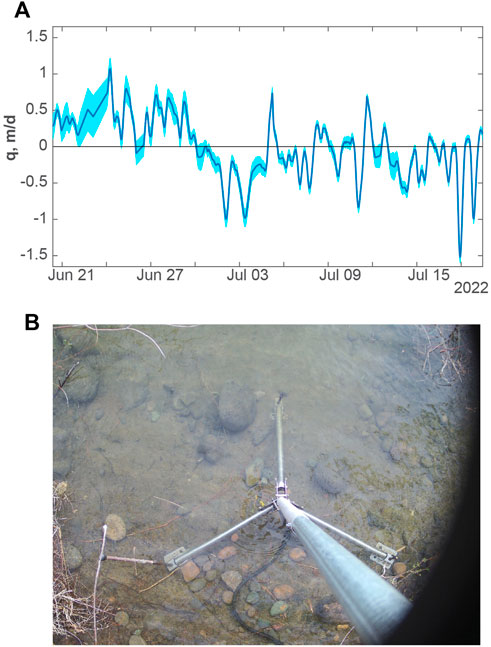
FIGURE 3. (A) A subset of ERTSS flux estimates (dark blue line) as specific discharge and 95% confidence interval (cyan) showing fluctuations and reversals in flux. Downwelling is positive, and upwelling is negative. The confidence interval expands in width in between sample times as a function of sensitivity or changing measurement interval; this is evident during data gaps (e.g., there are several gaps during June 23–24). (B) Visual-light image of the IR camera site, collected by the Duo Pro R.
Temperature at the SWI
The time series of SWI temperature is displayed in Figure 2D. Commonly, FO-DTS data are interpreted qualitatively for locations or periods of upwelling based in part on inspection of variance, with the conceptual model that upwelling modulates the amplitude of fluctuations in surface water that are driven by diurnal heating and nocturnal cooling; i.e., where/when upwelling occurs, amplitudes are diminished, and thus variance is lower (Domanski et al., 2020). Here, however, comparing with estimated flux (Figure 2C), we see weaker SWI temperature variability during periods of downwelling rather than upwelling in mid-March to early May.
TIR camera surveys and monitoring
Roving TIR surveys were used to detect focused seepage (Figures 1E,F) at locations where the streambed is submerged or exposed. The time-series TIR data of water surface temperature are summarized in terms of the image mean, plotted as a time series (Figure 2E). Comparison of TIR with spaceborne results was precluded by lack of spaceborne time-series data. The time-series TIR measurements of surface temperature exhibit stronger diel fluctuations than VTP or proxy FO-DTS data, as expected. It was not possible to redeploy the camera during the period of predominant upwelling; thus, most of the period of data collection was during downwelling, to which TIR is insensitive.
Discussion
The VTP-based flux estimates (Figure 2C, Figure 3) show rapid changes and reversals in flux consistent with findings of past studies in the Hanford Reach of the Columbia River (Arntzen et al., 2006; Fritz and Arntzen, 2007; Johnson et al., 2012; Chen et al., 2022; Johnson et al., 2022). Comparing flux estimates between studies is difficult because of permeability heterogeneity between study sites and temporal variability in hydraulic conditions; however, the range and annual pattern of our flux estimates compare favourably with previous work nearby (Fritz and Arntzen, 2007; Chen et al., 2022).
Many time-series and signal-processing approaches available to estimate flux from TIR, SWI temperature (or FO-DTS), and (or) spaceborne thermal imaging require continuous datasets. As discussed above, data gaps were observed in all temperature data types. Such data gaps must be anticipated for long-term, autonomous monitoring.
The use of proxy FO-DTS to compare with flux is limited to 1) the timeframe during which the temperature sensor is submerged, and 2) upwelling conditions. During our study period, these two conditions were satisfied from June 30 through July 19. This complication should be anticipated for FO-DTS deployments in streams subject to large stage fluctuations. Commonly, FO-DTS investigations target the shallow terrestrial/aquatic interface, and thus the cable is installed in shallow water near the edge of the stream. At our study site, however, this interface migrates laterally and vertically as stage rises and falls; consequently, any future deployments should involve multiple cables at different distances from the bank.
The proxy FO-DTS and flux estimates are compared in Figure 4A. Past FO-DTS work in the Hanford Reach demonstrated time-frequency decomposition of FO-DTS time series to map HEFs (Mwakanyamale et al., 2012; Mwakanyamale et al., 2013). Here, we examine the wavelet coherence between SWI temperature and flux (Figure 4B) to assess time- and frequency-dependent correlations between SWI temperature and estimated flux. During upwelling conditions, strong coherence (0.8–1 expressed as magnitude squared) is observed at multiple periods with phase locking. Persistent coherence is observed across the entire upwelling period at a period of ∼2.5 days and with a lag of ∼7.5 h. Following strong upwelling events (e.g., July 2, 3, 11, 17, and 18), additional coherence peaks with consistent phase appear at shorter periods, extending to ∼1.5 h. These results indicate the potential for using time-series classification to detect upwelling occurring along FO-DTS cables. Mwakanyamale et al. (2013) used discriminant analysis to classify a reach of the Columbia River bed as exchange/non-exchange based on FO-DTS and training data for alluvial thickness. Based on our results, we suggest future use of time-series classification to detect upwelling conditions; this is an easier problem than quantifying flux, for which VTP or more direct measurements remain necessary.
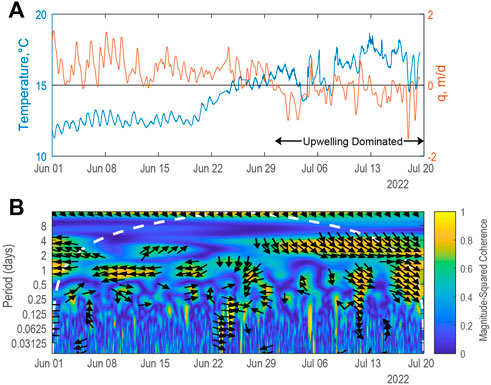
FIGURE 4. (A) Time series of proxy FO-DTS and flux; and (B) wavelet coherence between proxy FO-DTS and flux, with arrows indicating phase lag relative to period. During upwelling, coherence is strong at multiple periods, with phase locking, and positive lags between temperature and flux indicated by phase arrows pointed to the right and downward. For guidance on interpreting wavelet coherence plots, the reader is referred to Harmon et al. (2021).
The roving TIR surveys revealed locations of focused HEFs, underscoring the potential utility of drone-based TIR for mapping submerged seeps in shallow water. Additional work is required to assess the limits on detection imposed by water depth and mixing. Drone-based surveys would not produce data with the sampling frequency of the mounted camera, but missions could be triggered by conditions seen in other datasets. For example, if VTP estimates or FO-DTS measurements indicate upwelling, drone surveys could be performed to map seepage. Mapping seepage under various stage conditions could provide a spatial inventory of HEFs.
The ECOSTRESS image data proved inadequate for mapping HEFs or quantifying flux for lack of 1) the spatial resolution required for identifying locations where upwelling is occurring or meaningful correlation with VTP, and 2) temporal sampling, which is limited by the 4-day revisit time and greatly exacerbated by issues with cloud cover or data quality. Only ∼10% of the ECOSTRESS data collected during our study period were tier 1, rendering the average interval between datasets effectively ∼35 days.
Although publicly available spaceborne imagery does not appear to be feasible for characterizing spatial-temporal variation in surface temperature relevant to HEFs, airborne imagery from drones offers adequate resolution and scheduling flexibility. In July of 2017 a fixed-wing airborne mission with TIR sensor was used to map surface temperature across the Hanford Site at 0.5-m resolution (see appendix, Figure 1). This resolution appears adequate for identifying discharge at a scale observed by the handheld TIR camera.
There is increasing use of unmanned aerial vehicles (UAVs) at Department of Energy Legacy Management sites and other cleanup sites throughout the U.S. (DOE, 2020). UAVs are an increasingly practical monitoring solution as costs decrease and technology advances lead to more practical utilization. UAV flight schedule can be programmatically aligned with ideal daily conditions for capturing thermal signatures. Relevant to this study, drones can presumably capture imagery to detect seepage at the scale observed in this study area.
This brief report provides a preliminary assessment of how FO-DTS and drone- or satellite-based TIR information could be used to fill gaps between locations where VTPs are available. The sensitivity of TIR and FO-DTS is limited to upwelling (discharge), whereas VTPs are sensitive to upwelling and downwelling. Nevertheless, information about the timing—and possibly magnitude—of discharge is critical to understanding fate and transport at the Hanford Site. Our preliminary conclusions are:
(1) The new tempest1d code is well suited to analysis of VTP data from the Hanford Reach. To the best of our knowledge, this is the first application of these codes to field experimental data from the type of dynamic system for which they were developed.
(2) The spaceborne thermal imagery currently available for the site is inadequate with respect to temporal coverage and spatial resolution for monitoring upwelling; however, thermal imagery collected from UAVs does appear adequate.
(3) TIR cameras, which were assessed as a proxy for data from drone-based TIR, showed potential for mapping locations of upwelling. Additional work is required to assess constraints (water depth, velocity) on TIR-based seep detection.
(4) Temperature data collected at the SWI, taken as proxy for FO-DTS, showed potential for integration with VTP results within statistical frameworks.
Data availability statement
The raw data supporting the conclusion of this article will be made available by the authors, without undue reservation.
Author contributions
PR and FD-L co-managed the execution of the work and participated equally in the writing and analysis. The fieldwork and maintenance of instrumentation were performed collaboratively by LP, KM, PR, and FD-L.
Funding
This document was prepared under the Deep Vadose Zone–Applied Field Research Initiative at Pacific Northwest National Laboratory. The Pacific Northwest National Laboratory is operated by Battelle Memorial Institute for the U.S. Department of Energy under Contract DE-AC05-76RL01830.
Acknowledgments
The authors are grateful to Evan Arntzen and Delphine Appriou for constructive colleague reviews.
Conflict of interest
The authors declare that the research was conducted in the absence of any commercial or financial relationships that could be construed as a potential conflict of interest.
Publisher’s note
All claims expressed in this article are solely those of the authors and do not necessarily represent those of their affiliated organizations, or those of the publisher, the editors and the reviewers. Any product that may be evaluated in this article, or claim that may be made by its manufacturer, is not guaranteed or endorsed by the publisher.
Author Disclaimer
Reference herein to any specific commercial product, process, or service by trade name, trademark, manufacturer, or otherwise does not necessarily constitute or imply its endorsement, recommendation, or favoring by the United States Government or any agency thereof, or Battelle Memorial Institute. The views and opinions of authors expressed herein do not necessarily state or reflect those of the United States Government or any agency thereof.
Supplementary material
The Supplementary Material for this article can be found online at: https://www.frontiersin.org/articles/10.3389/feart.2022.1070393/full#supplementary-material
References
Abolt, C., Todd Caldwell, C., Wolaver, B., and Pai, H. (2018). Unmanned aerial vehicle-based monitoring of groundwater inputs to surface waters using an economical thermal infrared camera. Opt. Eng. 57 (5), 1. doi:10.1117/1.OE.57.5.053113
Anderson, M. P. (2005). Heat as a ground water tracer. Ground Water 43, 951–968. doi:10.1111/j.1745-6584.2005.00052.x
Arntzen, E. V., Geist, D. R., and Dresel, P. E. (2006). Effects of fluctuating river flow on groundwater/surface water mixing in the hyporheic zone of a regulated, large cobble bed river. River Res. applic. 22 (8), 937–946. doi:10.1002/rra.947
Briggs, M. A., Voytek, E. B., Day-Lewis, F. D., Rosenberry, D. O., and Lane, J. W. (2013). Understanding water column and streambed thermal refugia for endangered mussels in the Delaware river. Environ. Sci. Technol. 47 (20), 11423–11431. doi:10.1021/es4018893
Briggs, M. A., Wang, C., Day-Lewis, F. D., Williams, K. H., Dong, W., and Lane, J. W. (2019). Return flows from beaver ponds enhance floodplain-to-river metals exchange in alluvial mountain catchments. Sci. Total Environ. 685, 357–369. ISSN 0048-9697. doi:10.1016/j.scitotenv.2019.05.371
Chen, K., Chen, X., Song, X., Briggs, M. A., Jiang, P., Shuai, P., et al. (2022). Using ensemble data assimilation to estimate transient hydrologic exchange flow under highly dynamic flow conditions. Water Resour. Res. 58, e2021WR030735. doi:10.1029/2021WR030735
Conant, B. (2004). Delineating and quantifying ground water discharge zones using streambed temperatures. Ground Water 42 (2), 243–257. doi:10.1111/j.1745-6584.2004.tb02671.x
Deitchman, R. S., and Loheide, S. P. (2009). Ground-based thermal imaging of groundwater flow processes at the seepage face. Geophys. Res. Lett. 36 (14), L14401. doi:10.1029/2009GL038103
DOE (2020). DOE office of legacy management employs lasers and drones to track change. Available at: https://www.energy.gov/lm/articles/doe-office-legacy-management-employs-lasers-and-drones-track-change (Accessed 2 10, 2022).
Domanski, M., Quinn, D., Day-Lewis, F. D., Briggs, M. A., Werkema, D., and Lane, J. W. (2020). Dtsgui: A Python program to process and visualize fiber-optic distributed temperature sensing data. Ground Water 58, 799–804. doi:10.1111/gwat.12974
Fritz, B. G., and Arntzen, E. V. (2007). Effect of rapidly changing river stage on uranium flux through the hyporheic zone. Ground Water 45, 753–760. doi:10.1111/j.1745-6584.2007.00365.x
Fisher, J. B., Lee, B., Purdy, A. J., Halverson, G. H., Dohlen, M. B., Cawse-Nicholson, K., et al. (2020). Ecostress: NASA’s next generation mission to measure evapotranspiration from the international space station. Water Resour. Res. 56 (4), e2019WR026058. doi:10.1029/2019WR026058
Fritz, B. G., Mendoza, D. P., and Gilmore, T. J. (2009). Development of an electronic seepage chamber for extended use in a river. Ground Water 47 (1), 136–140. PMID: 18793205. doi:10.1111/j.1745-6584.2008.00491.x
Gordon, R. P., Lautz, L. K., Briggs, M. A., and McKenzie, J. M. (2012). Automated calculation of vertical pore-water flux from field temperature time series using the VFLUX method and computer program. J. Hydrology 420 (421), 142–158. doi:10.1016/j.jhydrol.2011.11.053
Grinsted, A., Moore, J. C., and Jevrejeva, S. (2004). Application of the crosswavelet transform and wavelet coherence to geophysical time series. Nonlin. Process. Geophys. 11, 561–566. doi:10.5194/npg-11-561-2004
Harmon, R. E., Barnard, H. R., Day-Lewis, F. D., Mao, D., and Singha, K. (2021). Exploring environmental factors that drive diel variations in tree water storage using wavelet analysis. Front. Water 3, 682285. doi:10.3389/frwa.2021.682285
Harvey, M. C., Hare, D. K., Hackman, A., Davenport, G., Haynes, A. B., Helton, A., et al. (2019). Evaluation of stream and wetland restoration using UAS-based thermal infrared mapping. Water 11 (8), 1568. doi:10.3390/w11081568
Hatch, C. E., Fisher, A. T., Revenaugh, J. S., Constanz, J., and Ruehl, C. (2006). Quantifying surface water–groundwater interactions using time series analysis of streambed thermal records: Method development. Water Resour. Res. 42 (10), 1–14. doi:10.1029/2005WR004787
Henderson, R. D., Day-Lewis, F. D., and Harvey, C. F. (2009). Investigation of aquifer-estuary interaction using wavelet analysis of fiber-optic temperature data. Geophys. Res. Lett. 36, L06403. doi:10.1029/2008GL036926
Johnson, T. C., Slater, L. D., Ntarlagiannis, D., Day-Lewis, F. D., and Elwaseif, M. (2012). Monitoring groundwater/surface-water interaction using time-series and time-frequency analysis of transient three-dimensional electrical resistivity changes. Water Resour. Res. 48, W07506. doi:10.1029/2012WR011893
Johnson, T., Thomle, J., Stickland, C., Goldman, A., and Stegen, J. (2022). Riverbed temperature and 4D ERT monitoring reveals heterogenous horizontal and vertical groundwater-surface water exchange flows under dynamic stage conditions. Front. Earth Sci. 10, 910058. doi:10.3389/feart.2022.910058
Koch, F. W., Voytek, E. B., Day-Lewis, F. D., Healy, R., Briggs, M. A., Lane, J. W., et al. (2016). 1DTempPro V2: New features for inferring groundwater/surface-water exchange. Groundwater 54, 434–439. doi:10.1111/gwat.12369
Lapham, W. (1989). Use of temperature profiles beneath streams to determine rates of vertical ground-water flow and vertical hydraulic conductivity. Reston, Virginia: USGS, 35. U.S. Geological Survey Water Supply Paper 2337.
Lee, D. R. (1977). A device for measuring seepage flux in lakes and estuaries 1. Limnol. Oceanogr. 22 (1), 140–147. doi:10.4319/lo.1977.22.1.0140
Loheide, S. P., and Gorelick, S. M. (2006). Quantifying stream-aquifer interactions through the analysis of remotely sensed thermographic profiles and in situ temperature histories. Environ. Sci. Technol. 40, 3336–3341. doi:10.1021/es0522074
McAliley, W. A., Day-Lewis, F. D., Rey, D., Briggs, M. A., Shapiro, A. M., and Werkema, D. (2022a). Application of recursive estimation to heat tracing for groundwater/surface-water exchange. Water Resour. Res. 58, e2021WR030443. doi:10.1029/2021WR030443
McAliley, W. A., Rey, D. M., and Day-Lewis, F. D. (2022b). Data release for tempest1d: Recursive estimation of vertical groundwater/surface-water exchange using heat tracing. Reston, Virginia: U.S. Geological Survey Data Release. doi:10.5066/P99DBTKT
McCobb, T. D., Briggs, M. A., LeBlanc, D. R., Day-Lewis, F. D., and Johnson, C. D. (2018). Evaluating long-term patterns of decreasing groundwater discharge through a lake-bottom permeable reactive barrier. J. Environ. Manag. 220, 233–245. doi:10.1016/j.jenvman.2018.02.083
Mwakanyamale, K., Day-Lewis, F. D., and Slater, L. D. (2013). Statistical mapping of zones of focused groundwater/surface-water exchange using fiber-optic distributed temperature sensing. Water Resour. Res. 49, 6979–6984. doi:10.1002/wrcr.20458
Mwakanyamale, K., Slater, L., Day-Lewis, F. D., Elwaseif, M., Ntarlagiannis, D., and Johnson, C. D. (2012). Spatially variable stage-driven groundwater-surface water interaction inferred from time-frequency analysis of distributed temperature sensing data. Geophys. Res. Lett. 39. doi:10.1029/2011GL050824
Selker, J. S., van De Giesen, N., Westhoff, M., Luxemburg, W., and Parlange, M. B. (2006). Fiber optics opens window on stream dynamics. Geophys. Res. Lett. 33, L24401. doi:10.1029/2006GL027979
Shuai, P., Chen, X., Song, X., Hammond, G. E., Zachara, J., Royer, P., et al. (2019). Dam operations and subsurface hydrogeology control dynamics of hydrologic exchange flows in a Regulated River reach. Water Resour. Res. 55, 2593–2612. doi:10.1029/2018WR024193
Slater, L. D., Ntarlagiannis, D., Day-Lewis, F. D., Mwakanyamale, K., Versteeg, R. J., Ward, A., et al. (2010). Use of electrical imaging and distributed temperature sensing methods to characterize surface water–groundwater exchange regulating uranium transport at the Hanford 300 Area, Washington, Water Resour. Res 46, W10533. doi:10.1029/2010WR009110
Torgersen, C. E., Faux, R. N., McIntosh, B. A., Poage, N. J., and Norton, D. J. (2001). Airborne thermal remote sensing for water temperature assessment in rivers and streams. Remote Sens. Environ. 76, 386–398. doi:10.1016/s0034-4257(01)00186-9
Keywords: hydrologic exchange flows (HEFs), vertical temperature profile, fiber optic distributed temperature sensing, remote sensing, wavelet-analysis
Citation: Day-Lewis FD, Royer P, Placzek L and Markham K (2022) A multi-scale temperature-based strategy to map hydrologic exchange flows in highly dynamic systems. Front. Earth Sci. 10:1070393. doi: 10.3389/feart.2022.1070393
Received: 14 October 2022; Accepted: 17 November 2022;
Published: 01 December 2022.
Edited by:
Prabhash Kumar Mishra, National Institute of Hydrology, Roorkee, IndiaReviewed by:
Santosh Murlidhar Pingale, National Institute of Hydrology (Roorkee), IndiaSunil Gurrapu, National Institute of Hydrology (Roorkee), India
Mohit Mohanty, Indian Institute of Technology Roorkee, India
Copyright © 2022 Day-Lewis, Royer, Placzek and Markham. This is an open-access article distributed under the terms of the Creative Commons Attribution License (CC BY). The use, distribution or reproduction in other forums is permitted, provided the original author(s) and the copyright owner(s) are credited and that the original publication in this journal is cited, in accordance with accepted academic practice. No use, distribution or reproduction is permitted which does not comply with these terms.
*Correspondence: Frederick D. Day-Lewis, frederick.day-lewis@pnnl.gov
†These authors have contributed equally to this work and share first authorship