Future Changes in Drought Frequency Due To Changes in the Mean and Shape of the PDSI Probability Density Function Under RCP4.5 Scenario
 Yulei Qi
 Haipeng Yu3
  Quanliang Chen
- 1College of Atmospheric Sciences, Lanzhou University, Lanzhou, China
- 2Plateau Atmosphere and Environment Key Laboratory of Sichuan Province, School of Atmospheric Sciences, Chengdu University of Information Technology, Chengdu, China
- 3Key Laboratory of Land Surface Process and Climate Change in Cold and Arid Regions, Northwest Institute of Eco-Environment and Resources, Chinese Academy of Sciences, Lanzhou, China
- 4Department of Atmospheric Sciences, University of Washington, Seattle, WA, United States
- 5Sichuan Branch of Meteorologist Training Institute, CMA, Heavy Rain and Drought-Flood Disasters in Plateau and Basin Key Laboratory of Sichuan Province, Chengdu, China
This study investigates the changes in the drought frequency in 2070–2099 relative to 1970–1999, due to the mean and shape changes of the probability density function (PDF) of the self-calibrated Palmer Drought Severity Index (PDSI), using CMIP5 multi-model historical simulations and projections under the RCP4.5 scenario. For severe droughts defined with PDSIs less than the 10th percentile, it is shown that over 41% of the global land, the increase in the severe drought frequency due to the shape change exacerbates the increase due to the mean change. Over 28% of the global land, the decrease in the drought frequency due to the shape change partially offsets the increase due to the mean change. Over 31% of the global land, the drought frequency increases due to the shape changes, but decreases due to the mean changes. The severe drought frequency due to both PDSI PDF mean and shape changes increases over almost the entire global land. We show that the PDSI standard deviation change is mainly determined by the mean precipitation change, while the PDSI mean change is determined by both mean precipitation and potential evapotranspiration changes. In particular, the PDSI standard deviation increases with the increase in mean precipitation which broadens the PDSI PDF, and thus enhances the severe drought frequency, and vice versa. On the other hand, the PDSI mean decreases with the decrease (increase) in mean precipitation (mean potential evapotranspiration). The difference in the attribution of drought frequency changes to the mean and shape changes over different regions can thus be largely explained by the mean precipitation and potential evapotranspiration changes. We also examine the moderate droughts defined with PDSIs between 10th and 20th percentiles in this study. For the moderate drought frequency, the spatial pattern of its changes due to the PDSI mean changes is similar to that of severe drought but with much smaller magnitudes, while its change in the spatial pattern due to the shape changes differs from severe drought with no significant changes. The moderate drought frequency due to both PDSI PDF mean and shape changes increases over 71% of the global land but decreases over 29% of the land.
Introduction
Drought is one of the most destructive natural hazards worldwide. It can lead to adverse effects to the ecological system, industrial production, agricultural practices, drinking water availability, hydrological processes, and water quality (Vicente-Serrano et al., 2012; Wang et al., 2014; Wang et al., 2017; Lai et al., 2019; Bussi and Whitehead, 2020; Wang L. et al., 2021). The International Disaster Database (EM-DAT) reported that drought has caused USD 221 billion loss from 1960 to 2016 (Wang Q. et al., 2021). Drought can persist for a period of weeks or longer with reduced precipitation and is often intensified through a positive feedback loop, in which dry soils and diminished vegetation cover can further suppress precipitation through reduced evapotranspiration and enhanced surface warming (Dai et al., 2018). Because of its large impacts, the variations and future changes in drought frequency and severity and their causes are of great interest (Zhao and Dai, 2015; Omer et al., 2020; Zhang et al., 2020; Du et al., 2021; Diallo et al., 2022).
Both observations and model simulations have documented an increase in drought over the past 50 y (Dai, 2012; Feng and Fu, 2013; Dai and Zhao, 2016). The model future projections suggest an increased risk of drought in most terrestrial areas in the 21st century under greenhouse gas (GHG)-induced global warming (Wang, 2005; Burke et al., 2006; Sheffield and Wood, 2007; Burke and Brown, 2008; Dai, 2010; Fu and Feng, 2014; Prudhomme et al., 2014; Sherwood and Fu, 2014; Feng et al., 2017; Cook et al., 2018; Dai et al., 2018; Cook et al., 2020). This is due to a decreased precipitation in subtropical land areas and increased atmospheric water vapor demand everywhere over land (Feng and Fu, 2013; Fu and Feng, 2014; Scheff and Frierson, 2014; Zhao and Dai, 2015; Dai et al., 2018). It was suggested that the change in the drought frequency was mainly caused by changes in the mean value of the drought index probability density function (PDF), and that changes in the shape of PDF exacerbated the changes in the drought frequency under CMIP5 RCP4.5 and CMIP6 SSP2-4.5 as well as SSP5-8.5 (Zhao and Dai, 2015; Zhao and Dai, 2021). However, the changes in the drought frequency caused by the changes in the drought index PDF mean value vs. those caused by the PDF shape have not been systematically examined. Furthermore, the change in the moderate drought frequency and its attributions has not been separated from the change in the severe drought frequency.
The Palmer Drought Severity Index (PDSI) is one of the most widely used drought indices. The PDSI was originally developed by Palmer (1965) to measure cumulative deviations in the ground surface water balance. It incorporates previous and current moisture supply (precipitation, P) and demand (potential evapotranspiration, PET) into a hydrological accounting system that includes a two-layer bucket model for soil moisture calculations. To improve the spatial comparability, Wells et al. (2004) proposed a self-calibrating PDSI by using local conditions to calibrate the PDSI, instead of using the fixed coefficients. The self-calibrating PDSI was shown to perform better than the original PDSI in Europe and North America in the 20th century (van der Schrier et al., 2006a; van der Schrier et al., 2006b; van der Schrier et al., 2007). The use of the Thornthwaite equation (Thornthwaite, 1948) to calculate PET in the original Palmer model can lead to errors in energy-limited regions (Hobbins et al., 2008) because the Thornthwaite PET is based only on temperature, latitude, and month. This error can be minimized by calculating PET using the physically based Penman–Monteith equation taking the effects of temperature, radiation, humidity, and wind speed into account (Burke et al., 2006). The self-calibrating PDSI with the Penman–Monteith PET is considered as one of the best indices available for quantifying long-term changes in agricultural drought (Zhao and Dai, 2015). In this study, we used the self-calibrated PDSI with the Penman–Monteith PET (scPDSIpm).
The spatial patterns of drought frequency changes under CMIP5 RCP4.5 and CMIP6 SSP2-4.5 were very similar to minimal differences (Zhao and Dai, 2015; Zhao and Dai, 2021). Therefore, the results of CMIP5 are used here. This study systematically examines the changes in the drought frequency caused by the changes in the mean of the PDSI PDF vs. those caused by its shape for both severe and moderate droughts. This article is organized as follows. Data and Methods section provides a description of the model data and analysis method. PDSI PDF Mean and Shape Changes and Impact on Drought Frequency section presents the PDSI PDF mean and shape changes and impact on the drought frequency. Relating PDSI PDF Mean and Shape Changes to Mean Precipitation and PET Changes section relates the PDSI PDF mean and shape changes to mean precipitation and PET changes. Conclusions and discussions are presented in Conclusions and Discussions section.
Data and Methods
The PDSI data used in the article are from Zhao and Dai (2015). The CMIP5 simulations from 14 coupled global climate models (Table 1) were used. They included the historical simulations with specified anthropogenic and natural external forcing from 1850 to 2005 and the future projections with GHGs and anthropogenic aerosols following the representative concentration pathway (RCP4.5) for 2006–99 (van Vuuren et al., 2011; Taylor et al., 2012). The first ensemble run was used if a model has multiple ensemble simulations. The monthly data for precipitation, surface air temperature, net radiation, specific humidity, wind speed, and air pressure were first regridded onto a 2.5°grid (Zhao and Dai, 2015). The regridded model variables were used to calculate the Penman–Monteith PET and the self-calibrating PDSI at each grid box following Dai (2011).
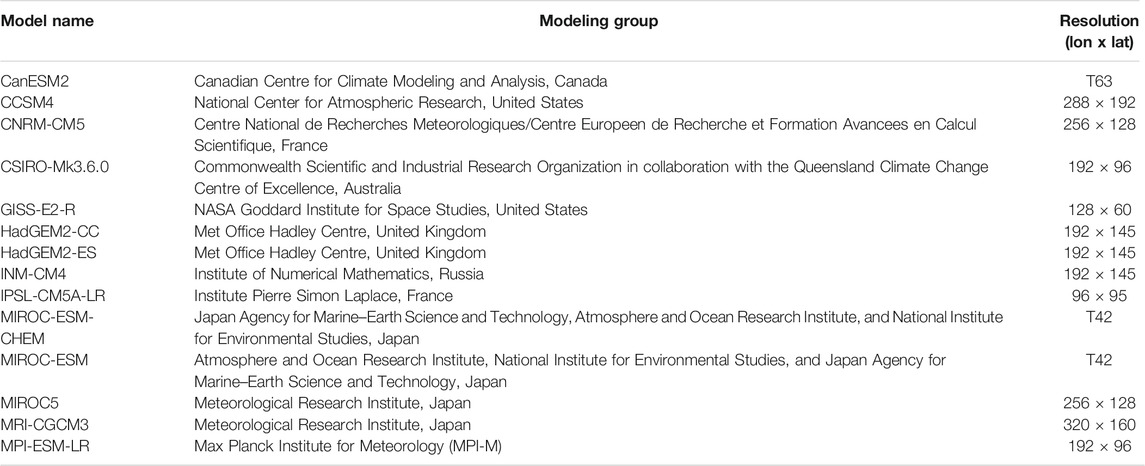
TABLE 1. ist of CMIP5 models used in this study.
Zhao and Dai (2015) defined severe droughts as those with PDSIs less than the 10th percentile, and moderate droughts as those with PDSIs less than the 20th percentile. Their moderate droughts thus include severe droughts. In this study, we defined those less than the 10th percentile as severe droughts following Zhao and Dai (2015) but those between the 10th and 20th percentiles as moderate droughts, based on the 1970–1999 PDSI.
Herein, we use the period of 1970–1999 as the reference period and the 2070–2099 as the future period. Suppose that the reference and future states are represented by (m0, s0) and (m1, s1), respectively, where m is for the PDSI PDF mean and s for the PDSI PDF shape. To eliminate the non-linear effect, we derive the mean effect by comparing (m1, s0) with (m0, s0), and shape effect by comparing (m1, s1) with (m1, s0), referred to as method 1. We also derive the mean effect by comparing (m1, s1) with (m0, s1), and the shape effect by comparing (m0, s1) with (m0, s0), referred to as method 2. Then, we used the averages of methods 1 and 2 to minimize the sensitivity to the method used. Using this approach, the total change in the drought frequency due to both PDSI PDF mean and shape changes by comparing (m1, s1) with (m0, s0) is exactly the sum of the change due to the mean change and that due to the shape change.
The drought frequency in (m0, s0) is, for example, 10% based on the definition. For the drought frequency in (m1, s0), we added the monthly PDSI values from 1970 to 1999 by the difference between 2070–2099 and 1970–1999 averages to derive a new series, after which we calculated the drought frequency using the new series. For the drought frequency in (m0, s1), we subtracted the monthly PDSI values from 2070 to 2099 by the difference between 2070–2099 and 1970–1999 averages to derive a new series, after which we calculated the drought frequency using the new series. For the drought frequency in (m1, s1), it was directly calculated from the PDSI values for 2070–2099. We first calculated the change in the drought frequency for each model individually and then calculated the multi-model ensemble average.
PDSI PDF Mean and Shape Changes and Impact on Drought Frequency
Figure 1A presents the multi-model ensemble average of the changes in the PDSI mean from 1970–1999 to 2070–2099 under the RCP4.5 emission scenario. The PDSI can be used not only to characterize the degree of drought, but its climatology mean value can also reflect the mean dry and wet conditions. As can be seen in Figure 1A, the PDSI decreases in southern North America, north-central South America, the Mediterranean region, South Africa, Australia, Central Asia, Western Siberia, and southeastern China, indicating that these regions will become drier by the end of the century (e.g., Feng and Fu, 2013). The decrease in PDSI is most significant and robust over northern South America, the Mediterranean region, and South Africa. In contrast, the PDSI increases in northern North America, mid- and high-latitude Asia, North and East Africa, India, and Indonesia, suggesting that these regions will become wetter by the end of the century. The increase in PDSI is most pronounced and robust over the northern North America and high-latitude Asia.
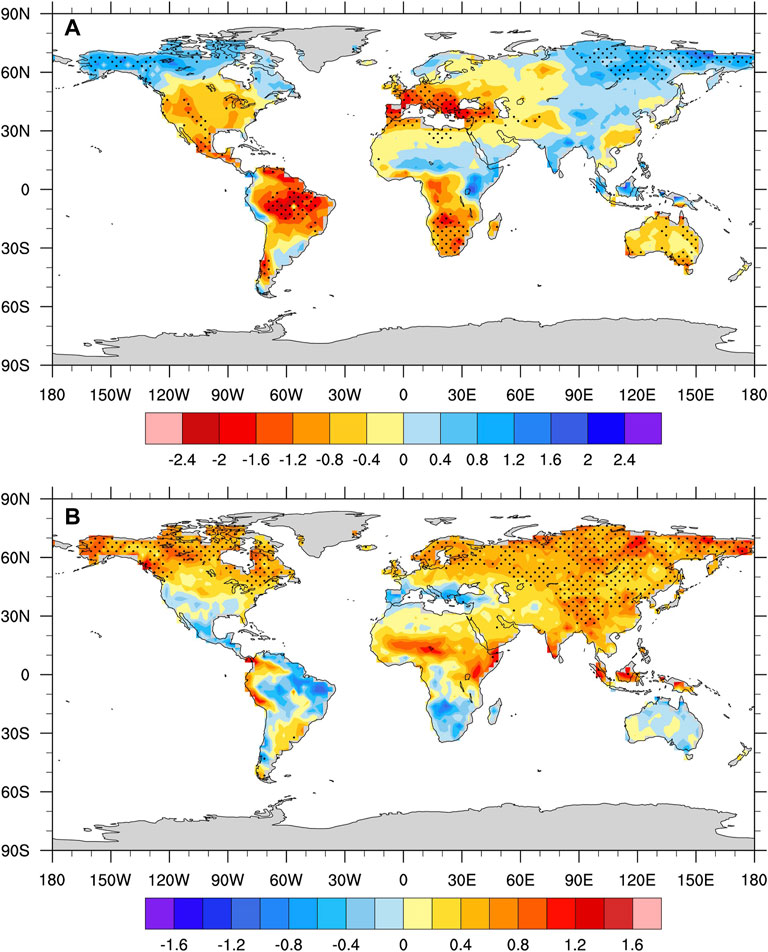
FIGURE 1. Multi-model ensemble averaged changes in the PDSI (A) mean value and (B) standard deviation from 1970–1999 to 2070–2099 under the RCP4.5 emission scenario. Black dots represent the sign change agreement for more than 80% of the model.
The multi-model ensemble averaged changes in the PDSI standard deviation from 1970–1999 to 2070–2099 under the RCP4.5 scenario are shown in Figure 1B. In the northern North America, almost entire Eurasia, North and East Africa, northwestern and southeastern South America, and the Southeast Asian archipelago, the standard deviation of PDSI increases, indicating enhanced PDSI variability in these regions (e.g., Zhao and Dai, 2015; Zhao and Dai, 2021). The increase in PDSI variability is particularly pronounced and robust in middle and high latitudes of Asia and northern North America. In contrast, the PDSI standard deviation decreases in the southern North America, north-central South America, the Mediterranean region, South Africa, and Australia, indicating a weakening of PDSI variability in these regions (e.g., Zhao and Dai, 2015; Zhao and Dai, 2021). But these decreases are not robust.
Drought is defined as the period in which the PDSI value lies in the left tail of its probability density function (PDF). Herein, we use the period of 1970–1999 as the reference period. Months with the PDSI smaller than the 10th percentile of the PDSI PDF for the reference period are defined as severe droughts, while months between the 10th and 20th percentile as moderate droughts (see the method in Data and Methods section). The drought frequency is the percentage of the number of drought months to the total number of months for a given location. The mean and standard deviation of the PDSI change significantly from 1970–1999 to 2070–2099 (Figure 1), which would lead to significant changes in the PDSI PDF and then the drought frequency in the future relative to the reference period. Later, we examine the change in the drought frequency caused by the change in the PDSI PDF mean for a given shape, change in the PDSI PDF shape for a given mean, and both together (see the method in Data and Methods section).
Figure 2 (left panels) presents the changes in the severe drought frequency for 2070–2099 relative to 1970–1999, due to changes in the PDSI PDF mean, shape, and both together. It can be seen that the severe drought frequency due to the changes in the PDSI PDF mean increases in the United States and Mexico, most of South America, Europe, most of Africa, west of the Asian continent, Australia, and southeastern China (Figure 2A). The most significant increases in the drought frequency were found in northern South America, southern Europe, and South Africa, with robust increases ranging from 8 to 24%. There are also significant drought frequency increases of 2–12% in most areas in southern North America and Australia. But in North and Central Africa, Eastern Europe and Western Siberia, and southeastern China, the changes from various models are not robust. The severe drought frequency due to mean change decreases in northern North America, middle and high latitudes of Asia, India, and the Horn of Africa. The decreases are usually below ∼ 4%, while in some regions at high latitudes, the decreases are robust and can reach 4–8%.
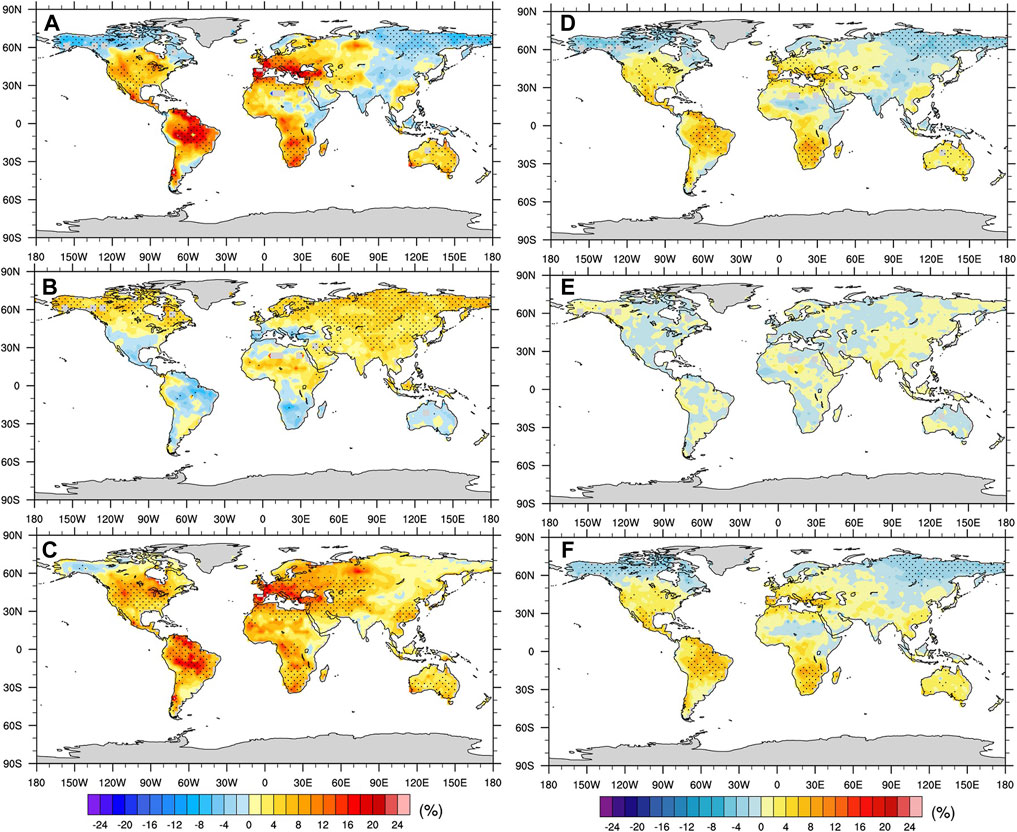
FIGURE 2. Change in severe (left panels) and moderate (right panels) drought frequencies for 2070–2099 relative to 1970–1999 under the RCP4.5 emission scenario, due to the changes in (A,D) mean, (B,E) shape, and (C,F) both together of the PDSI PDF. The black dots in the figure represent more than 80% of the models which agree with each other on the sign changes.
The severe drought frequency due to the shape change in the PDSI PDF increases in most of the global terrestrial regions, except in the southern United States Mexico, northern South America, the Mediterranean coast, South, Africa, and Australia (Figure 2B). The robust increase in the drought frequency can be found in northern North America, northern Europe, and the middle- and high-latitude Asian continent, with increases of up to 2–8%. The large increase in the drought frequency can reach 6–8% in North Africa, but is not robust. The decrease in the drought frequency is generally not robust, except for a few scattered spots.
The severe drought frequency due to the PDSI PDF changes, including both mean and shape changes, increases in almost all global land, except for a slight decrease in Alaska (Figure 2C). The robust increases were found in the United States, northern South America, the Mediterranean regions, west of the Asian continent, South Africa, Australia, and southeastern China. In these regions, the increase in the drought frequency was mainly caused by mean changes, and shape changes often partially offset the drought frequency increase, except in west of the Asian continent. In northern North America, mid–upper Asia, India, and the Horn of Africa, the severe drought frequency increase is mainly caused by shape changes, which is partially offset by the mean changes.
Figure 2 (right panels) presents the changes in moderate drought frequency for 2070–2099 relative to 1970–1999, due to the changes in the PDSI PDF mean, shape, and both together. It can be seen that the spatial pattern of the moderate drought frequency changes due to the PDF mean changes is very similar to that of severe drought (Figure 2D vs. Figure 2A). But the magnitude of the moderate drought frequency changes is much smaller than that of severe droughts, especially in regions with increased drought frequencies such as northern South America, South Africa, and the Mediterranean. In addition, the area with robust moderate drought frequency changes due to the PDF mean change is also smaller than that for severe droughts.
Different from the severe drought, the moderate drought frequency changes due to the PDF shape change decreases in most North America, Europe, South Africa, Western and Central Siberia, and most Australia, but increases in East Asia, South Asia, the Southeast Asia, East Africa, and the Arabian Peninsula (Figure 2E). Over most of the terrestrial regions, the moderate drought frequency changes due to the PDF shape change have a magnitude within ∼ 2% and are not robust.
The moderate drought frequency due to the PDSI PDF changes including both mean and shape changes increases in the United States and Mexico, South America, the Mediterranean, South Africa, West Asia, and Western Siberia and with smaller magnitude than severe drought (Figure 2F). But it decreases in northern North America, most of mid- and high-latitude Asia, the Horn of Africa, and parts of North Africa, India, and island countries in Southeast Asia. The moderate drought frequency changes caused by the PDSI PDF changes are dominated by the PDF mean changes (Figure 2F vs. Figure 2D). The moderate drought frequency due to both PDSI PDF mean and shape changes increases and decreases over 71 and 29% of the global land, respectively.
For both severe and moderate droughts, over regions where the drought frequency due to the PDF mean change increases significantly, the drought frequency due to the PDF shape change often decreases, partially offsetting the increase, especially for severe drought. But over regions where the severe drought frequency due to the PDF mean change significantly decreases, severe drought frequency due to the PDF shape change usually has a robust increase. But moderate drought did not exhibit this characteristic. These issues are discussed in the next section.
Figure 3A shows the spatial distribution of the sign of the multi-model ensemble mean severe drought frequency changes due to the PDSI PDF mean and shape changes under the RCP4.5 scenario. It can be seen that the regions where both the PDF mean and shape changes lead to an increase in drought frequency (Type I: red dots in Figure 3A) are mainly located in the majority of the United States, most of Europe, western Asia, northern and central Africa, and coastal areas of East Asia. The regions where the drought frequency increases due to the PDF mean changes but decreases due to the PDF shape changes (Type II: blue dots in Figure 3A) are mainly located in the southern United States and Mexico, the Amazon basin of South America, the Mediterranean coast, South Africa, and Australia. The regions where the drought frequency decreases due to the PDF mean changes but increases due to the PDF shape changes (Type III: green dots in Figure 3A) are mainly located in northern North America, northern Asia, western East Asia, South Asia, Southeast Asian island countries, and East Africa. Types I, II, and III regions account for 41, 28, and 31% of the global land, respectively. Over 41% of the land, the increased severe drought frequency due to the PDF shape changes exacerbates the increase due to the PDF mean changes. Over 28% of the global land, the decrease in severe drought frequency due to the PDF shape changes partially offsets the increase due to the PDF mean changes. Over 31% of the global land, the increase in the severe drought frequency due to the PDF shape changes exceeds the decrease due to the PDF mean changes.
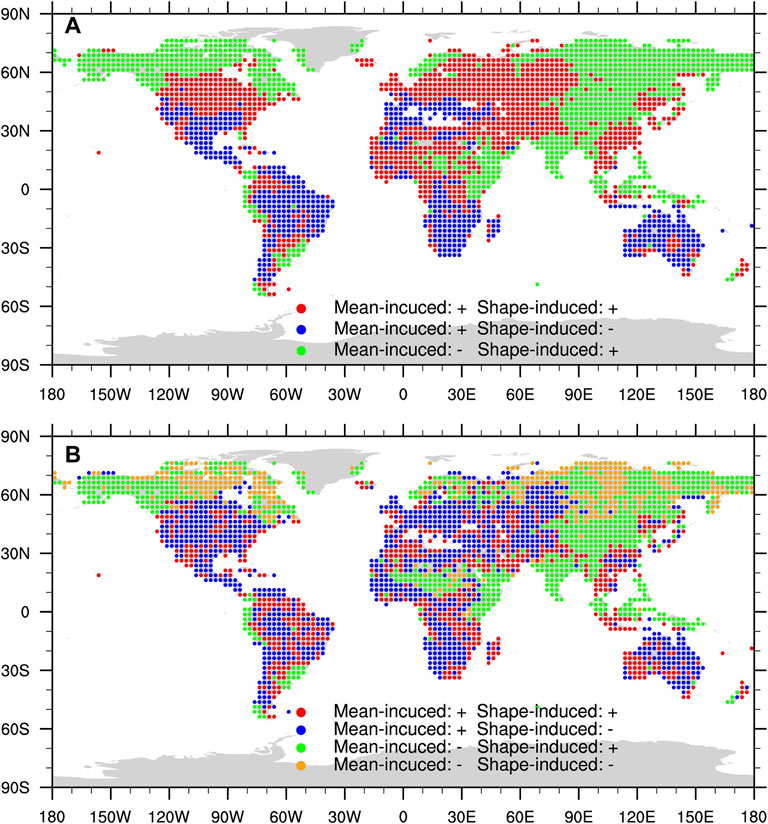
FIGURE 3. Spatial distribution of the signs of (A) severe and (B) moderate drought frequency changes due to the PDSI PDF mean and shape changes following Figures 2A,B and Figures 2D,E. Red dots indicate positive changes due to both mean and shape (Type I). Blue dots indicate positive change due to the mean but negative change due to the shape (Type II). Green dots indicate negative due to the mean but positive due to the shape (Type III). Orange dots in (B) indicate negative due to both mean and shape (Type IV).
Figure 3B is the same as Figure 3A but for the moderate droughts. Unlike the severe droughts, an additional type is added for the regions where both the PDSI PDF mean and shape changes lead to a decrease in moderate drought frequency (Type IV: orange dots in Figure 3B). For moderate drought, the regions of Type I are scattered over the global land, accounting for 28% of the land area. Type II regions are mainly located in the United States, Mexico, South America, South Africa, Europe, west of Asian continent, and Australia, accounting for 37% of the global land. The Type III regions are mainly located in East Asia, India, northwestern North America, North Africa, the Horn of Africa, and Southeast Asian island countries, accounting for 27% of the land. The Type IV regions are mainly located in the high latitudes of the northern hemisphere, accounting for only 8% of the land.
Relating PDSI PDF Mean and Shape Changes to Mean Precipitation and PET Changes
The difference between Figure 3A and Figure 3B is mainly caused by the differences in drought frequency changes due to the PDSI PDF shape changes (Figure 2B vs. Figure 2E). The severe drought is the left tail of the PDSI PDF (less than the 10th percentile), and a flattening of the PDF shape (i.e., a larger PDSI standard deviation) would lead to an increase in the severe drought frequency, and vice versa. In contrast, moderate drought is located between the 10th and 20th percentiles, and the moderate drought frequency changes because the PDF shape changes are more complex. For instance, a flattening of the PDF shape can result in either an increase or decrease in the moderate drought frequency. Therefore, the moderate drought frequency might not uniquely respond to the PDSI PDF shape changes. We focus on severe drought in the following discussions. We are particularly interested in what causes the PDSI standard deviation changes and thus along with the PDSI mean changes is responsible for the sign pattern shown in Figure 3A. Here, we use the standard deviation to represent the shape of PDSI PDF.
The severe drought frequency increases as the PDSI mean value decreases due to the decrease (increase) of mean precipitation (potential evapotranspiration), and vice versa. This is demonstrated by the very similar patterns of Figure 1A and Figure 2A as compared with the change pattern of the aridity (P/PET) shown in Fig. 7d of Feng and Fu (2013), and also see the mean PET and P change patterns in their Figs. 7b and 7c, respectively. We further notice that the PDSI standard deviation change pattern (Figure 1B) is very similar to the precipitation change pattern shown in Fig. 7c of Feng and Fu (2013), although they considered the RCP8.5 scenario. To explore the relationship between the PDSI standard deviation and mean precipitation changes, Figure 4A presents the multi-model ensemble average of the change in the mean precipitation from 1970–1999 to 2070–2099 under the RCP4.5 emission scenario. The PDSI standard deviation does increase over the regions where the mean precipitation increases, and vice versa. To enforce our point that the PDSI standard deviation change is largely determined by the mean P changes, Figure 5A shows the scatter plots of the changes in the standard deviation of PDSI vs. the changes in mean precipitation (P). It can be seen that the PDSI standard deviation generally increases (decreases) when precipitation increases (decreases). The percentage of the points where the PDSI standard deviation and P changes have the same sign is 83%, indicating that the variability of PDSI is mainly dominated by the mean precipitation changes. The correlation coefficient between changes in the PDSI standard deviation and mean P is 0.67. Thus, 45% of the PDSI standard deviation change variance can be explained by the mean P change. Figure 4B is the same as Figure 4A but for the changes in mean PET. Figure 5B indicates a negative correlation between changes in the PDSI standard deviation and mean PET, which is because of a negative correlation between the PET and P changes. The latter can be seen in Figure 4: at the places where the precipitation decreases, the PET change tends to be larger. Note that the PDSI standard deviation change variance can be explained by 46% with both P and PET changes, demonstrating that mean PET change plays a very minor role in explaining the PDSI standard deviation change in addition to the P changes.
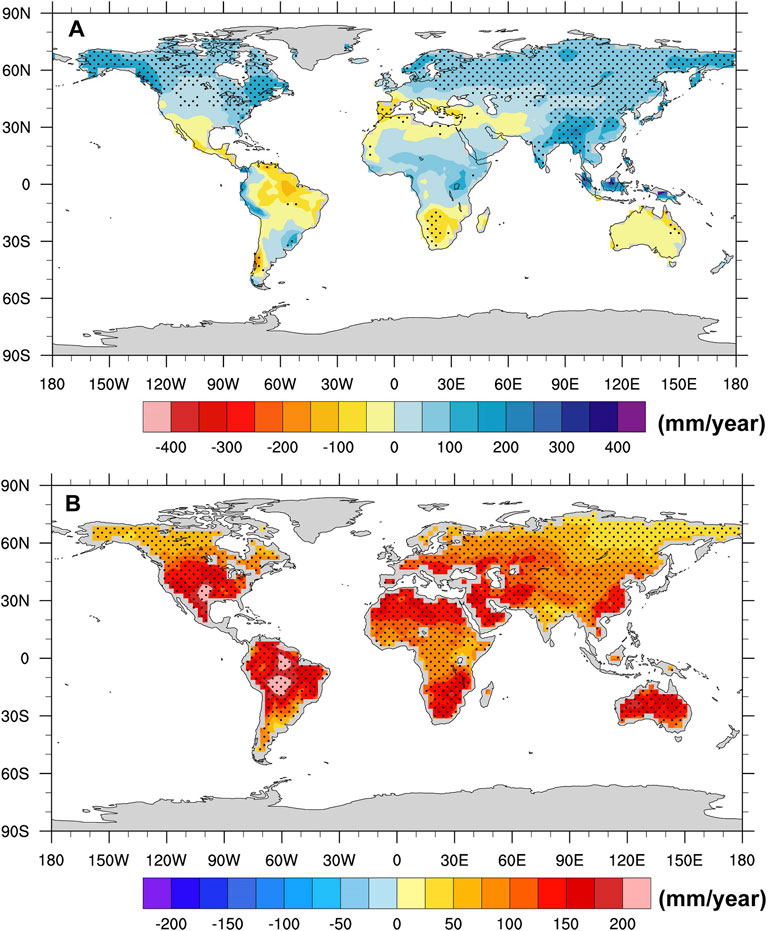
FIGURE 4. Same as Figure 1A but for the changes in the mean (A) precipitation and (B) potential evapotranspiration.
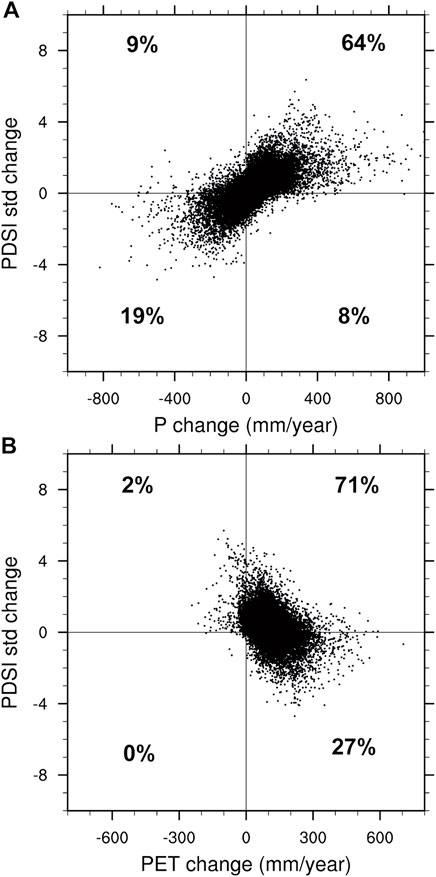
FIGURE 5. Scatter plots of the PDSI standard deviation (std) change vs. mean (A) precipitation (P) and (B) potential evapotranspiration (PET) changes for all grids over global land from all multi-model ensemble simulations considered in this study under the RCP4.5 emission scenario. The four numbers in each panel represent the percentage of points in that region to the total number of points.
This relationship between the PDSI standard deviation and mean P changes can be understood by the fact that the precipitation variability and thus the PDSI variability are enhanced associated with the mean precipitation increases. Noting that the PDSI mean change is simply determined by the mean PET and P changes, the difference in the signs of severe drought frequency changes due to the changes in the PDSI PDF mean and shape over different regions (Figure 3A) can largely be explained by the changes in the mean precipitation and PET.
In Type I regions, the future precipitation largely increases (over three quarters of the regions), but the drying effect of enhanced potential evapotranspiration is larger than the wetting effect due to the precipitation increase. Together, there is a decrease in the PDSI mean and thus an increase in the drought frequency due to the PDSI PDF mean change. On the other hand, the increase in precipitation would lead to an enhancement of the PDSI standard deviation, that is, a flatter PDF shape, and thus an increase in the severe drought frequency due to the PDSI PDF shape change. Therefore, the signs of the severe drought frequency changes due to the changes in the PDSI PDF mean and shape are both positive in these regions.
In Type II regions, the future precipitation largely decreases (over two-thirds of the regions), and the enhancement of potential evapotranspiration exacerbates the drying effect due to the precipitation decrease. This leads to a significant decrease in the PDSI mean and thus an increase in the severe drought frequency due to the PDSI PDF mean change. However, the decrease in precipitation would lead to a decrease in the PDSI standard deviation, that is, a steeper PDF shape, and thus a decrease in severe drought frequency due to the PDSI PDF shape change. Therefore, the signs of severe drought frequency changes due to changes in the PDSI PDF mean and shape in these regions are opposite.
In Type III regions, the future precipitation increases significantly over 94% of the regions, and its wetting effect exceeds the drying effect associated with the potential evapotranspiration enhancement. This leads to an increase in the PDSI mean, and thus a decrease in the severe drought frequency due to the PDSI PDF mean change. However, the increase in precipitation would lead to an enhancement of PDSI standard deviation, that is, a flatter PDF shape, and thus an increase in the severe drought frequency due to the PDSI PDF shape change. Therefore, the signs of severe drought frequency changes due to the changes in the PDSI PDF mean and shape in these regions are also opposite.
Finally, to intuitively demonstrate the effect of PDSI PDF change on the severe drought frequency change, Figure 6 shows the multi-model ensemble averaged PDSI PDF for the periods 1970–1999 and 2070–2099 under the RCP4.5 scenario, averaged over the robust grids in the Types I, II, and III regions (Figure 3A) and over the robust grid points in Figure 2C. It can be seen in Figure 6A that the PDSI PDF shifts to the left from 1970–99 to 2070–99, and the shape becomes flatter with a decrease in the peak frequency, both leading to an increase in the severe drought frequency. In Figure 6B, the PDSI PDF shifts to the left from 1970–99 to 2070–99, but the shape becomes steeper with an increase in the peak frequency, leading to an increase due to mean change, but a decrease due to shape change in severe drought frequency. In Figure 6C, the PDF shifts to the right from 1970–99 to 2070–99, but the shape becomes flatter with a decrease in the peak frequency, leading to a decrease due to mean change but an increase due to shape change in the severe drought frequency. The combined effect of the PDF mean and shape leads to an increase in the severe drought frequency in all type of regions. In Type II regions, the PDSI PDF mean effect dominates, while in Type III regions, the PDF shape effect dominates. In the Type I region, the PDF mean and shape effects enforce each other. Figure 6D presents PDSI PDFs using the grids with a robust increase in severe drought frequency due to both PDSI PDF mean and shape changes (see Figure 2C). There is a left shift in the PDF and a flatter shape with a decrease in the peak frequency, both leading to an increase in the drought frequency. Overall, both the PDF mean and shape changes need to be considered to examine the drought frequency changes.
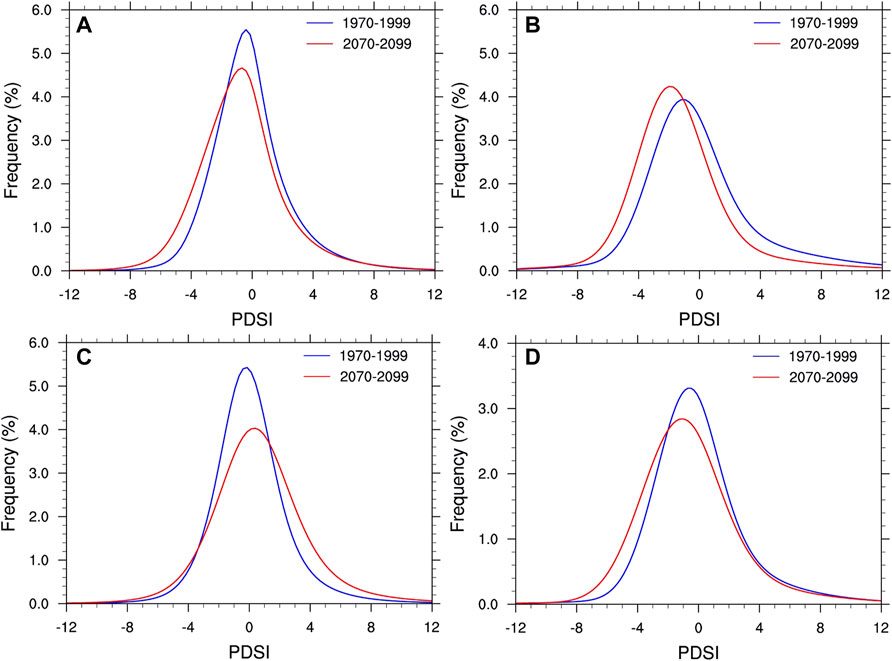
FIGURE 6. Multi-model ensemble-averaged PDFs of PDSI for 1970–1999 and 2070–2099 averaged over the grids with robust changes in severe drought frequency due to the changes in both mean and shape for (A) Type I, (B) Type II and (C) Type III regions in Figures 3A and (D) over the robust grids in Figure 2C.
Conclusions and Discussions
In this study, we systematically investigated the changes in drought frequency in 2070–2099 relative to 1970–1999, due to the mean and shape changes of the probability density function (PDF) of the self-calibrated Palmer Drought Severity Index (PDSI), using CMIP5 multi-model historical simulations and projections under the RCP4.5 scenario. A method used to separate the PDSI PDF mean and shape effects is robust and does not contain the non-linear effect. We considered the severe drought that is defined with PDSIs less than the 10th percentile, and moderate drought that is defined as those with PDSI between 10th and 20th percentiles. The main conclusions are as follows.
The severe drought frequency due to changes in the PDF mean increases significantly in northern South America, southern Europe, and South Africa, with robust increases ranging from 8 to 24%. The severe drought frequency due to the change in the PDF shape robustly increases in northern North America, northern Europe, and the mid- and high-latitude Asian continent, with increases of up to 2–8%. The spatial pattern of moderate drought frequency changes due to the changes in the mean is very similar to that of severe drought but with smaller magnitude. Moderate drought frequency changes due to the PDF shape changes are different from severe drought and are not significant. The severe drought frequency due to both the PDSI PDF mean and shape changes increases over almost the entire global land. The moderate drought frequency due to both the PDSI PDF mean and shape changes increases and decreases over 71 and 29% of the global land, respectively.
For severe drought, increased drought frequency due to the change in the shape exacerbated the increase due to the change in the mean over 41% of the global land. They are mainly located in the majority of the United States, most of Europe, western Asia, northern and central Africa, and coastal areas of East Asia. Over 28% of the global land, the decrease in the drought frequency due to the change in the shape partially offsets the increase due to the change in the mean. They are mainly located in the southern United States and Mexico, the Amazon basin of South America, the Mediterranean coast, South Africa, and Australia. Over 31% of the global land, the drought frequency increased due to the change in the shape but decreased due to the change in the mean. They are mainly located in northern North America, northern Asia, western East Asia, South Asia, Southeast Asian island countries, and East Africa. For moderate drought, an additional type is added for the regions where both the PDSI PDF mean and shape changes lead to a decrease in drought frequency. The four type regions account for 28, 37, 27, and 8% of the land, respectively.
It is revealed that the PDSI standard deviation change is mainly dominated by the mean precipitation changes, while the PDSI mean change is determined by the combined effect of the mean precipitation and potential evapotranspiration changes. In particular, the PDSI standard deviation increases with the increase in mean precipitation, which broadens the PDSI PDF, and thus enhances the severe drought frequency, and vice versa. On the other hand, the PDSI mean decreases with the decrease (increase) in mean precipitation (mean potential evapotranspiration). The difference in the attribution of severe drought frequency change to the mean and shape changes of the PDSI PDF over different regions is thus largely determined by the corresponding future changes in mean precipitation and potential evapotranspiration.
In the warming world, the potential evapotranspiration increases almost over all global land. In the regions with the wetting effect due to increased precipitation, which is smaller than the drying effect due to increased potential evapotranspiration, the change in the mean and shape of the PDSI PDF both lead to an increase in the severe drought frequency. In the regions with the drying effect due to decreased precipitation which is intensified by increased potential evapotranspiration, the severe drought frequency increases due to the change in the mean but decreases due to the change in the shape, and the former dominates. In the regions with the wetting effect due to increased precipitation exceeding the drying effect due to increased potential evapotranspiration, the severe drought frequency decreases due to the PDSI mean change but increases due to the shape change, and the latter dominates.
Data Availability Statement
The original contributions presented in the study are included in the article/Supplementary Material, further inquiries can be directed to the corresponding author.
Author Contributions
QF initiated the project and provided the idea. YQ conducted analysis and YQ and QF wrote the manuscript. HY, QC, JR and ZY contributed to discussion and revision of the manuscript. All authors read and edited the manuscript.
Funding
Funding for this project was provided by the National Natural Science Foundation of China (42075043, 42122034, Grant U20A2097), Science and Technology Program of Gansu Province (21JR7RA067), the Youth Innovation Promotion Association CAS and the Sichuan Provincial Key Laboratory Science and Technology Development Fund Project (SCQXKJQN2019019).
Conflict of Interest
The authors declare that the research was conducted in the absence of any commercial or financial relationships that could be construed as a potential conflict of interest.
Publisher’s Note
All claims expressed in this article are solely those of the authors and do not necessarily represent those of their affiliated organizations, or those of the publisher, the editors, and the reviewers. Any product that may be evaluated in this article, or claim that may be made by its manufacturer, is not guaranteed or endorsed by the publisher.
Acknowledgments
We thank editors and reviewers for their valuable suggestions and comments, which have led to considerable improvements in this work. We thank Aiguo Dai for the PDSI data. We acknowledge the World Climate Research Program’s Working Group on Coupled Modeling, which is responsible for CMIP and we acknowledge the climate modeling groups for producing and making available their model output.
References
Burke, E. J., Brown, S. J., and Christidis, N. (2006). Modeling the Recent Evolution of Global Drought and Projections for the Twenty-First Century with the Hadley Centre Climate Model. J. Hydrometeorol. 7 (5), 1113–1125. doi:10.1175/jhm544.1
Burke, E. J., and Brown, S. J. (2008). Evaluating Uncertainties in the Projection of Future Drought. J. Hydrometeorol. 9 (2), 292–299. doi:10.1175/2007jhm929.1
Bussi, G., and Whitehead, P. G. (2020). Impacts of Droughts on Low Flows and Water Quality Near Power Stations. Hydrological Sci. J. 65 (6), 898–913. doi:10.1080/02626667.2020.1724295
Cook, B. I., Mankin, J. S., and Anchukaitis, K. J. (2018). Climate Change and Drought: From Past to Future. Curr. Clim. Change Rep. 4 (2), 164–179. doi:10.1007/s40641-018-0093-2
Cook, B. I., Mankin, J. S., Marvel, K., Williams, A. P., Smerdon, J. E., and Anchukaitis, K. J. (2020). Twenty‐First Century Drought Projections in the CMIP6 Forcing Scenarios. Earth's Future 8 (6), 1–20. doi:10.1029/2019ef001461
Dai, A. (2011). Characteristics and Trends in Various Forms of the Palmer Drought Severity Index during 1900-2008. J. Geophys. Res. 116 (D12), 1–26. doi:10.1029/2010jd015541
Dai, A. (2010). Drought under Global Warming: A Review. Wires Clim. Change 2 (1), 45–65. doi:10.1002/wcc.81
Dai, A. (2012). Increasing Drought under Global Warming in Observations and Models. Nat. Clim Change 3 (1), 52–58. doi:10.1038/nclimate1633
Dai, A., Zhao, T., and Chen, J. (2018). Climate Change and Drought: A Precipitation and Evaporation Perspective. Curr. Clim. Change Rep. 4 (3), 301–312. doi:10.1007/s40641-018-0101-6
Dai, A., and Zhao, T. (2016). Uncertainties in Historical Changes and Future Projections of Drought. Part I: Estimates of Historical Drought Changes. Climatic Change 144 (3), 519–533. doi:10.1007/s10584-016-1705-2
Diallo, I., Xue, Y., Chen, Q., Ren, X., and Guo, W. (2022). Effects of spring Tibetan Plateau Land Temperature Anomalies on Early Summer Floods/droughts over the Monsoon Regions of South East Asia. Clim. Dyn, 1–23. doi:10.1007/s00382-021-06053-8
Du, Y., Zhang, J., Zhao, S., and Chen, Z. (2021). A Mechanism of Spring Barents Sea Ice Effect on the Extreme Summer Droughts in Northeastern China. Clim. Dyn. 58, 1033–1048. doi:10.1007/s00382-021-05949-9
Feng, S., and Fu, Q. (2013). Expansion of Global Drylands under a Warming Climate. Atmos. Chem. Phys. 13 (19), 10081–10094. doi:10.5194/acp-13-10081-2013
Feng, S., Trnka, M., Hayes, M., and Zhang, Y. (2017). Why Do Different Drought Indices Show Distinct Future Drought Risk Outcomes in the U.S. Great Plains? J. Clim. 30 (1), 265–278. doi:10.1175/jcli-d-15-0590.1
Fu, Q., and Feng, S. (2014). Responses of Terrestrial Aridity to Global Warming. J. Geophys. Res. Atmos. 119 (13), 7863–7875. doi:10.1002/2014jd021608
Hobbins, M. T., Dai, A., Roderick, M. L., and Farquhar, G. D. (2008). Revisiting the Parameterization of Potential Evaporation as a Driver of Long-Term Water Balance Trends. Geophys. Res. Lett. 35 (12), 1–6. doi:10.1029/2008gl033840
Lai, C., Zhong, R., Wang, Z., Wu, X., Chen, X., Wang, P., et al. (2019). Monitoring Hydrological Drought Using Long-Term Satellite-Based Precipitation Data. Sci. Total Environ. 649, 1198–1208. doi:10.1016/j.scitotenv.2018.08.245
Omer, A., Zhuguo, M., Zheng, Z., and Saleem, F. (2020). Natural and Anthropogenic Influences on the Recent Droughts in Yellow River Basin, China. Sci. Total Environ. 704, 135428. doi:10.1016/j.scitotenv.2019.135428
Palmer, W. C. (1965). Meteorological Drought, 45. Washington, DC: U.S. Weather Bureau Research Paper, 55.
Prudhomme, C., Giuntoli, I., Robinson, E. L., Clark, D. B., Arnell, N. W., Dankers, R., et al. (2014). Hydrological Droughts in the 21st century, Hotspots and Uncertainties from a Global Multimodel Ensemble experiment. Proc. Natl. Acad. Sci. USA 111 (9), 3262–3267. doi:10.1073/pnas.1222473110
Scheff, J., and Frierson, D. M. W. (2014). Scaling Potential Evapotranspiration with Greenhouse Warming. J. Clim. 27 (4), 1539–1558. doi:10.1175/jcli-d-13-00233.1
Sheffield, J., and Wood, E. F. (2007). Projected Changes in Drought Occurrence under Future Global Warming from Multi-Model, Multi-Scenario, IPCC AR4 Simulations. Clim. Dyn. 31 (1), 79–105. doi:10.1007/s00382-007-0340-z
Sherwood, S., and Fu, Q. (2014). Climate Change. A Drier Future? Science 343 (6172), 737–739. doi:10.1126/science.1247620
Taylor, K. E., Stouffer, R. J., and Meehl, G. A. (2012). An Overview of CMIP5 and the Experiment Design. B. Am. Meteorol. Soc. 93 (4), 485–498. doi:10.1175/bams-d-11-00094.1
Thornthwaite, C. W. (1948). An Approach toward a Rational Classification of Climate. Geographical Rev. 38 (1), 55. doi:10.2307/210739
van der Schrier, G., Briffa, K. R., Jones, P. D., and Osborn, T. J. (2006a). Summer Moisture Variability across Europe. J. Clim. 19 (12), 2818–2834. doi:10.1175/jcli3734.1
van der Schrier, G., Briffa, K. R., Osborn, T. J., and Cook, E. R. (2006b). Summer Moisture Availability across North America. J. Geophys. Res. 111 (D11102), 1–10. doi:10.1029/2005jd006745
van der Schrier, G., Efthymiadis, D., Briffa, K. R., and Jones, P. D. (2007). European Alpine Moisture Variability for 1800-2003. Int. J. Climatol. 27 (4), 415–427. doi:10.1002/joc.1411
van Vuuren, D. P., Edmonds, J., Kainuma, M., Riahi, K., Thomson, A., Hibbard, K., et al. (2011). The Representative Concentration Pathways: An Overview. Climatic Change 109 (1-2), 5–31. doi:10.1007/s10584-011-0148-z
Vicente-Serrano, S. M., López-Moreno, J. I., Beguería, S., Lorenzo-Lacruz, J., Azorin-Molina, C., and Morán-Tejeda, E. (2012). Accurate Computation of a Streamflow Drought Index. J. Hydrol. Eng. 17 (2), 318–332. doi:10.1061/(asce)he.1943-5584.0000433
Wang, G. (2005). Agricultural Drought in a Future Climate: Results from 15 Global Climate Models Participating in the IPCC 4th Assessment. Clim. Dyn. 25 (7-8), 739–753. doi:10.1007/s00382-005-0057-9
Wang, L., Chen, W., Fu, Q., Huang, G., Wang, Q., Chotamonsak, C., et al. (2021a). Super Droughts over East Asia since 1960 under the Impacts of Global Warming and Decadal Variability. Intl J. Climatology, 1–4. doi:10.1002/joc.7483
Wang, Q., Wu, J., Lei, T., He, B., Wu, Z., Liu, M., et al. (2014). Temporal-Spatial Characteristics of Severe Drought Events and Their Impact on Agriculture on a Global Scale. Quat. Int. 349, 10–21. doi:10.1016/j.quaint.2014.06.021
Wang, Q., Wu, J., Li, X., Zhou, H., Yang, J., Geng, G., et al. (2017). A Comprehensively Quantitative Method of Evaluating the Impact of Drought on Crop Yield Using Daily Multi-Scale SPEI and Crop Growth Process Model. Int. J. Biometeorol. 61 (4), 685–699. doi:10.1007/s00484-016-1246-4
Wang, Q., Zeng, J., Qi, J., Zhang, X., Zeng, Y., Shui, W., et al. (2021b). A Multi-Scale Daily SPEI Dataset for Drought Characterization at Observation Stations over mainland China from 1961 to 2018. Earth Syst. Sci. Data 13 (2), 331–341. doi:10.5194/essd-13-331-2021
Wells, N., Goddard, S., and Hayes, M. J. (2004). A Self-Calibrating Palmer Drought Severity Index. J. Clim. 17 (12), 2335–2351. doi:10.1175/1520-0442(2004)017<2335:aspdsi>2.0.co;2
Zhang, Q., Han, L., Zeng, J., Wang, X., and Lin, J. (2020). Climate Factors during Key Periods Affect the Comprehensive Crop Losses Due to Drought in Southern China. Clim. Dyn. 55 (9-10), 2313–2325. doi:10.1007/s00382-020-05379-z
Zhao, T., and Dai, A. (2021). CMIP6 Model-Projected Hydroclimatic and Drought Changes and Their Causes in the 21st Century. J. Clim., 1–58. doi:10.1175/jcli-d-21-0442.1
Keywords: drought, mean, shape, probability density function, PDSI, RCP4.5
Citation: Qi Y, Yu H, Fu Q, Chen Q, Ran J and Yang Z (2022) Future Changes in Drought Frequency Due To Changes in the Mean and Shape of the PDSI Probability Density Function Under RCP4.5 Scenario. Front. Earth Sci. 10:857885. doi: 10.3389/feart.2022.857885
Received: 19 January 2022; Accepted: 24 February 2022;
Published: 11 March 2022.
Edited by:
Bin Yu, Environment and Climate Change, CanadaReviewed by:
Zengyun Hu, Xinjiang Institute of Ecology and Geography (CAS), ChinaTianbao Zhao, Institute of Atmospheric Physics (CAS), China
Copyright © 2022 Qi, Yu, Fu, Chen, Ran and Yang. This is an open-access article distributed under the terms of the Creative Commons Attribution License (CC BY). The use, distribution or reproduction in other forums is permitted, provided the original author(s) and the copyright owner(s) are credited and that the original publication in this journal is cited, in accordance with accepted academic practice. No use, distribution or reproduction is permitted which does not comply with these terms.
*Correspondence: Qiang Fu, qfuatm@gmail.com