Study on the Pore Structures and Adsorption Characteristics of Coking Coal of Liulin Mining in China Under the Condition of High Temperature and High Pressure
 Qi Lingling
 Peng Xinshan
 Wang Zhaofeng1,2,3,4
 - 1School of Safety Science and Engineering, Henan Polytechnic University, Jiaozuo, China
- 2MOE Engineering Research Center of Coal Mine Disaster Prevention and Emergency Rescue, Jiaozuo, China
- 3Collaborative Innovation Center of Coal Work Safety and Clean High Efficiency Utilization, Jiaozuo, China
- 4State Key Laboratory Cultivation Base for Gas Geology and Gas Control, Jiaozuo, China
In order to study the change of pore structure and adsorption characteristics of coking coal after the high-temperature and high-pressure adsorption test, the coking coal from the Liulin coalmine was selected for the research. Both the mercury injection experiments were carried out on the raw coal and the coal after the isothermal adsorption experiment processing with a pressure of 11 MPa and temperature ranging from 30 to 90°C. The results show that the pressure is beneficial to gas adsorption, while the temperature has a restraining effect on the gas adsorption of coking coal, and there is a good negative exponential relationship between the adsorption capacity and temperature. The hysteresis loop of that after the high-temperature and high-pressure isothermal adsorption test is smaller than that of raw coal, and the connectivity of pores becomes worse. In the process of the mercury injection experiment, the hysteresis loop of coking coal after the high-temperature and high-pressure adsorption experiment is smaller than that of raw coal. This demonstrates that the open pores decrease and the semi-closed pores increase, and then the connectivity of the pores becomes worse, which is not conducive to the gas flow when the coking is subjected to high-temperature and high-pressure action. After the high-temperature and high-pressure adsorption experiment, the volume of macropores, visible pores, and crannies of the coking coal decreases, and the volume of micropores and minipores increases. However, the total pore volume reduced overall. Under the same pressure, with the increase in temperature, the volume of macropores, visible pores, and crannies increases, while the volume of micropores and minipores decreases, and the total pore volume increases. After the high-temperature and high-pressure adsorption experiment, the proportion of micropores and minipores increases, and the specific surface area also increases. Under the same pressure, the surface areas of micropores and minipores decrease and the total specific surface area also decreases with the increase in temperature.
Introduction
The development and utilization of coking coal play a vital role in the development of China’s steel industry, and coking coal is an indispensable resource for China’s economic construction (Liu, 2014). With the depletion of shallow coking coal resources, many coal mines have shifted to deep mining (Peng, 2008; Xu, 2020). With the extension of the depth, coking coal mining has highlighted the problems of high ground temperature and high gas pressure, which pose a great threat to the safe and effective mining of deep resources (Feng, 2018). The influence of temperature and pressure on gas adsorption characteristics of coal has been studied at different degrees, and significant research results have been obtained (Levy et al., 1997; Liang, 2000; Hu et al., 2002; Zhao et al., 2012). Hou Cheng et al. believe that the process of gas adsorption by coal under high temperature and high pressure can still be accurately described by the Langmuir adsorption equation, and the adsorption amount increases with increasing adsorption pressure. Moreover, by increasing the temperature of coal under the same pressure condition, the gas adsorption capacity of all coal samples shows a significant decrease (Zhong, 2001; Cui et al., 2003a; Cui et al., 2003b; Hou et al., 2019). For gas, high temperature and high pressure are the oxymorons, and how their combined effect will affect the adsorption and storage of coal seam gas, the adsorption characteristics and storage properties of deep coal seam gas, and how the change has not been agreed upon and still need further study (Zhong et al., 2002b; Zhang et al., 2005; Liu, 2011).
The pore structure of coal directly affects the gas adsorption and desorption characteristics of coal (Crosdale et al., 2008; Zhang, 2008; Qu, 2011; Zhao et al., 2018). As the main site of gas deposition, the pore structure of coal has an influence on gas adsorption mainly depending on the micropore content (Zhang et al., 2005; Gu et al., 2017), and in the meantime, pore morphology affects gas transportation and diffusion (Chen et al., 2012; Qi et al., 2017; Gao et al., 2019). In the study of microporous fractures in coal using low-temperature nitrogen isothermal adsorption, Chen Ping et al. classified microporous pores in coal into three major categories: open permeable pores, a section of closed impermeable pores, and fine-necked bottlenecked pores, based on their permeability properties (Chen and Tang, 2001). In the study of adsorption properties of gas-fertilized coal in the Xinji mine, Zhong Lingwen et al. found that the adsorption capacity of coal for gas was positively correlated with total pore volume, total pore-specific surface area, and micropore-specific surface area, while in the study of Huating coal, it was found that the adsorption capacity was not significantly related to total pore volume but only has a positive correlation with the micropore volume (Zhong et al., 2002a). Liu Aihua and Fu Xuehai et al. conducted pore testing experiments on high-grade coal by the mercury-pressure method and concluded through experimental analysis that high-grade coal has small porosity and abundant “ink bottle”-type pores, which reduce the pore connectivity of the coal; however, the large number of developed micropores greatly improves the adsorption capacity of the coal and is beneficial for gas deposition (Xu et al., 2016). Wang Lingling and Huo Xiaoxiao et al. found that the external conditions of high temperature and high pressure could change the pores of coal; the specific surface area of coal increased, the cumulative pore volume decreased, and the proportion of visible pores and crannies increased (Qi et al., 2017; Wang et al., 2018).
In conclusion, the pore structure directly affects the gas adsorption–desorption characteristics of coal. With the increase of temperature and pressure, while entering deep mining, few people consider the influence of temperature and pressure on pore structure. Under the high temperature and pressure, what will happen to the pore structure of coal and how the change of pore structure will affect the gas adsorption? Therefore, it is necessary to study the influence of high-temperature and high-pressure environment on the pore structure of coking coal.
Materials and Methods
In order to study the gas adsorption characteristics of coking coal under a high-temperature and high-pressure environment, soft and hard coals in Liulin Coalmine, Shanxi Province, were selected in the experiment. In order to facilitate subsequent experimental analysis, the soft and hard coal samples were numbered as “LR” and “LY” successively. The experimental coal samples were coking coal with a particle size of 3–6 mm. Before the isothermal adsorption experiment, the experimental coal samples were dried in a drying oven (105°C) for more than 2 h stored in a drying dish and cooled to room temperature. The Hsorb-2600 high-temperature and high-pressure gas adsorption apparatus (as shown in Figure 1) was used to conduct methane adsorption experiments on soft and hard coals of the Liulin coal mine under high temperature and high pressure under the conditions of maximum adsorption equilibrium pressure of 11 MPa and temperature of 30, 50, 70, and 90°C. According to Langmuir’s monolayer adsorption principle, the methane adsorption capacity of coal was measured by the high-pressure volumetric method. The Langmuir formula is σ = abp/(1+bp), where a is the adsorption constant, cm3/g; b is the adsorption constant, MPa−1. The physical significance of the adsorption constant a means at a given temperature, the coal adsorption the gas to achieve the maximum adsorption capacity, also known as saturated adsorption capacity. The value reflects the adsorption capacity of coal to gas (Wang et al., 2012; Hou et al., 2020a, 2020b).
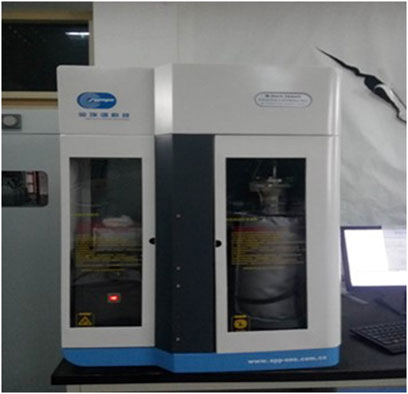
FIGURE 1. Hsorb-2600 high-temperature and high-pressure gas adsorbent instrument.
There are many pore testing methods for coal (Fredrich et al., 1995; Yao et al., 2009), and in this study, the mercury injection method was used to analyze the difference in pore structure between soft and hard coals of the Liulin coalmine in Shanxi Province before and after high-temperature and high-pressure adsorption experiments. For the convenience of experimental analysis, experimental coal samples are numbered as shown in Table 1.
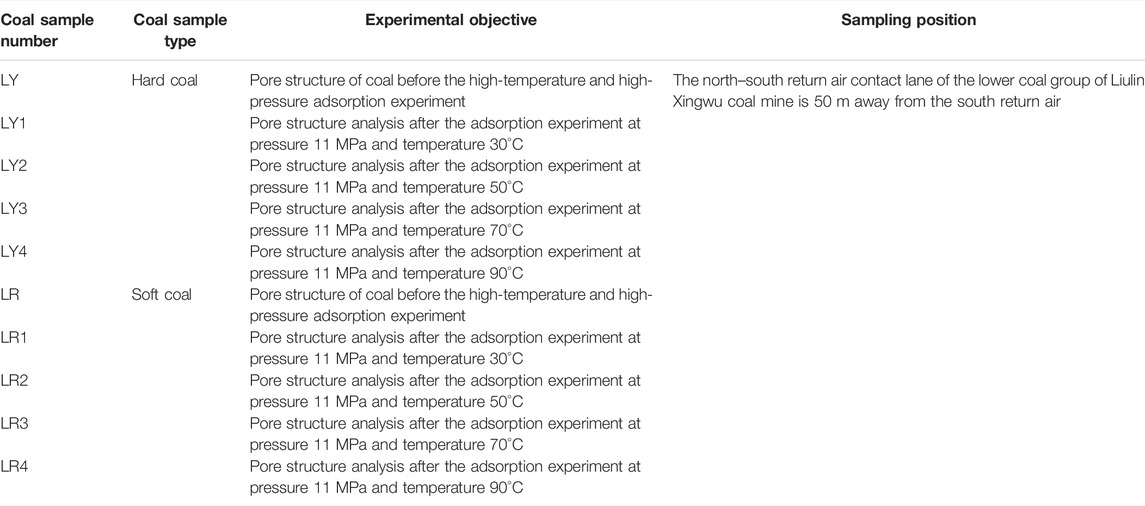
TABLE 1. Serial number of coal samples.
The instrument for the experiment is the AUTO PORE9500 mercury injection instrument (as shown in Figure 2). The instrument is usually operated in a pressure range of 0–228 MPa (33,000 psia) and an aperture measurement range of 5.5 nm–360 μm. The instrument utilizes mercury to measure the pore structure of coal and force mercury into coal samples by external pressure. The required pressure should overcome the capillary force of mercury flowing out of coal pores. The instrument can automatically control the pressure of the mercury inlet and outlet pressure with recording data. According to the Washburn equation, a series of pore characteristic parameters such as pore volume distribution, pore area distribution, porosity, and mercury injection and ejection curve can be obtained to characterize the pore size and pore volume of samples (Wang et al., 2014). There are many pore structure classification methods for coals (Qi, 2013), of which the B.B. XouoT decimal classification is the most widely used in China’s coal industry (Yu, 1992). The Dubinin, IUPAC, H. Gan, and other classification methods are more commonly used in coal physics and coal chemistry (Thommes et al., 2015). In order to study the storage and flow of gas in coal seam, according to B.B. XouoT’s classification method (Yu, 1992), the pores in coal were divided into micropores (D < 10 nm), minipores (10 nm < D < 102 nm), mesopores (102 nm < D < 103nm), macropores (103 nm < D < 105 nm), and visible pores and crannies (D > 105 nm), and the letter D stands for diameter.
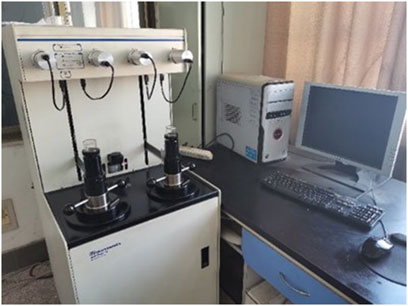
FIGURE 2. Mercury porosimeter.
Results and Discussion
High-Temperature and High-Pressure Response Characteristics of Coking Coal Gas Adsorption
Influence of Temperature on Gas Adsorption Characteristics of Coking Coal
Under the conditions of maximum adsorption equilibrium pressure of 11 MPa and temperature of 30, 50, 70, and 90°C, the influence of temperature single factor on gas adsorption characteristics of coking coal was studied. According to the isothermal adsorption experiment, the variation trend of methane adsorption capacity of coal samples at different temperatures was successively obtained (as shown in Figure 3).
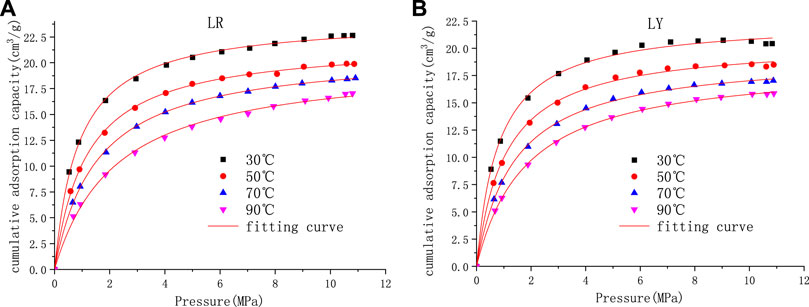
FIGURE 3. Adsorption isotherms of Liulin coal samples at different temperatures. (A) Soft coal adsorption isotherm (B) Hard coal adsorption isotherm.
It can be seen from Figure 3 that under the same pressure condition, with the increase in temperature, the gas adsorption capacity of coking coal shows a downward trend. This is because the adsorption of coal to gas belongs to physical adsorption, and adsorption is an exothermic process (Wang et al., 2012). So, with the rise in temperature, the gas molecules move more violently, and the time they stay on the coal surface becomes shorter. Finally, it is easier to reach equilibrium within the specified time, which causes the limit gas adsorption amount of coal to decrease (Liang, 2000; Li et al., 2021). Figure 4 shows the limited adsorption capacity of soft coal and hard coal at different temperatures under 11 MPa pressure. The adsorption capacity does not decrease linearly with the increase in temperature. In order to intuitively represent the relationship between adsorption capacity and temperature, Origin Software was used to carry out optimal fitting for adsorption capacity and temperature, as shown in Figure 4. According to the relationship between saturated adsorption capacity and temperature, it can be seen that they conform to the exponential relationship. The regression equation between adsorption quantity Q and temperature T was established by fitting using Origin Software and a good fitting result was obtained (Table 2).
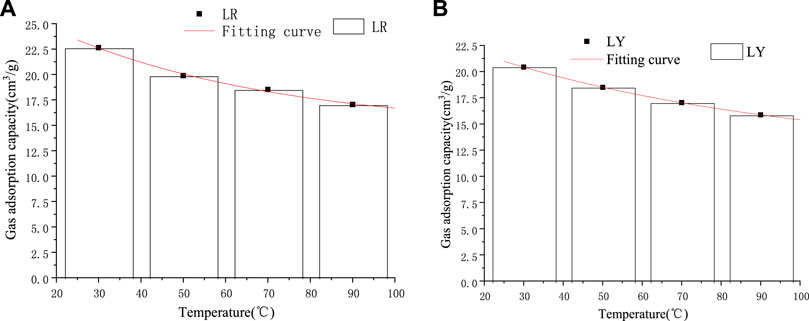
FIGURE 4. Fitting diagram of the relationship between temperature and saturated adsorption capacity under the same pressure (11 MPa). (A) Soft coal (B) Hard coal.
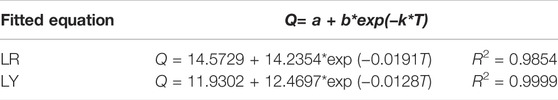
TABLE 2. Fitting results of coal sample adsorption capacity and temperature at 11 MPa equilibrium pressure.
It can be seen from Figure 4 and Table 2 that the adsorption capacity and temperature have a good negative relationship with the increase in temperature. Meanwhile, with the increase in temperature, the adsorption capacity of hard coal in the same mining area decreases less compared to that of soft coal.
Influence of Pressure on Gas Adsorption Characteristics of Coking Coal
With the increase in burial depth, the gas pressure of the coal seam increases in a hydrostatic gradient, and the amount of gas absorbed in the coal reservoir increases. The gas pressure of the coal seam is an important factor affecting the adsorption characteristics of coal. Under the conditions of maximum adsorption equilibrium pressure of 11 MPa and temperature of 30, 50, 70, and 90°C, the influence of pressure single factor on the adsorption characteristics of coking coal gas was studied.
As shown in Figure 3, in certain temperature cases, the adsorption quantity of coalbed methane increases with the increase of pressure, which can be roughly divided into three stages: rapid increase, slow increase, and balance. The reason for the difference between the growth of gas adsorption volume of coal samples in different pressure ranges is that at the initial stage of the isothermal adsorption experiment, there are a lot of adsorption vacancies on the surface of coal, and the probability of gas molecules hitting the pore surface of coal increases, which manifested as the faster adsorption rate. With the increase of gas pressure, the surface of coal is covered more and more with gas molecules, and the density of gas molecules arranged on the pore surface of coal increases; thus, the adsorption amount increases. In addition, the adsorption vacancy decreases and the adsorption rate decreases. When the pore surface that can pass through gas molecules is gradually and fully covered by gas molecules, the adsorption amount does not increase with the increase of pressure, and the adsorption reaches equilibrium (Li et al., 2021).
At different temperatures, with the increase of pressure, the increase of the gas adsorption capacity of each coal sample is slightly different. Under the conditions of 30 and 50°C, the adsorption capacity of each coal sample increases rapidly almost linearly with the increase of pressure in the range of 0–3 MPa. In the range of 3–7 MPa, the adsorption capacity increases with the increase of pressure, but the adsorption rate slows down. After 7 MPa, the adsorption amount shows a variety of changes with the pressure, and the adsorption amount of the soft coal increases slowly and gradually becomes flat with the increase of the pressure. On the other side, for hard coal, under the pressure of more than 10 MPa, with the increase of pressure, the adsorption capacity tends to decrease. Under the condition of 70°C, the adsorption capacity of each coal sample increases rapidly almost linearly with the increase of pressure in the range of 0–4 MPa. In the range of 4–8 MPa, the adsorption capacity increases with the increase of pressure; on the contrary, the adsorption rate slows down. After 8 MPa, the adsorption amount shows a variety of changes with pressure. The adsorption amount of soft coal increases slowly and gradually becomes flat with the increase of pressure. For the hard coal, after exposure to 10 MPa pressure, the adsorption capacity tends to decrease with the increase of pressure. Under the temperature of 90°C, the adsorption capacity of each coal sample increases rapidly almost linearly with the increase of pressure in the range of 0–4 MPa. After 4 MPa, the adsorption isotherm curve increases slowly and will flatten out gradually with the increase of pressure. Under the same pressure, the adsorption capacity of soft coal is greater than that of hard coal.
Effect of High Temperature and High Pressure on Pore Structure
Difference Analysis of Mercury in and out Curves Before and After High-Temperature and High-Pressure Experiment
According to the connectivity of pores in coal, the morphology of pores in coal is divided into open pores (with hysteresis loops), semi-closed pores (with almost no hysteresis loops), and narrow-necked pores (“sudden drop”–type hysteresis loops). The spatial distribution of pores in coal reflects the pore connectivity, and the open pores are most conducive to the migration of coalbed methane due to the large distribution of macropores and crannies. In the case of closed pores and semi-closed pores, the pores are mainly micropores, and the pore channels are not smooth, which complicates the migration of CBM.
According to the experimental results, the mercury injection and ejection curves of all coal samples were drawn, as shown in Figure 5. The differences in pore morphology of coal samples before and after the high-temperature and high-pressure adsorption experiment were studied according to the injection and ejection curves of mercury.
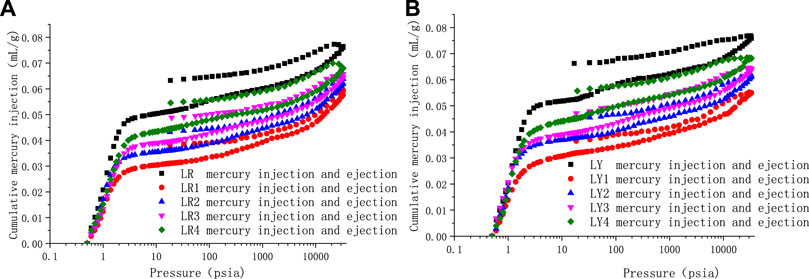
FIGURE 5. Mercury in ejection curves before and after high-temperature and high-pressure adsorption test. (A) Soft coal (B) Hard coal.
From Figure 5, it can be seen that the mercury intrusion curves of both soft and hard coal have the hysteresis loop in the entire pressure range when before or after the high-temperature and high-pressure adsorption experiment, which indicates that there are many open pores in coal samples from the Liulin mining area, and there may be semi-closed pores. Comparing the mercury injection and ejection curves before and after the high-temperature and high-pressure adsorption experiment, it was found that the mercury injection and ejection hysteresis loops of the coal samples after the high-temperature and high-pressure adsorption experiment were smaller than those of the raw coal, indicating that after exposure to high-temperature and high-pressure, the open pores in the coal samples decreased, the semi-closed pores increased, and the connectivity of coals deteriorates, which is not conducive to the flow of gas. Under the same pressure, the hysteresis loop increases gradually, and the connectivity of coal samples is better with the increase in temperature. The total mercury input of Liulin soft coal after the high-temperature and high-pressure experiment is less than that of raw coal. Under the same pressure, with the increase in temperature, the total mercury input increases. The total mercury injection volume of hard coal after the high-temperature and high-pressure experiment is smaller than that of raw coal, and under the same pressure, with the increase in temperature, the total mercury injection volume rises. Comparing the soft and hard coal (both are raw coals) in the Liulin mining area, it is found that there is little difference in the amount of mercury injected between them, but there are differences in morphology. The mercury hysteresis loop of soft coal is smaller than that of hard coal, and the semi-closed pores in soft coal are more than those in hard coal.
Difference in Pore Volume Before and After High-Temperature and High-Pressure Experiments
According to the mercury injection experimental data of soft and hard coal samples of coking coal in the Liulin Mining area before and after the high-temperature and high-pressure experiments, the cumulative pore volume and incremental pore volume distribution of various coal samples are shown in Figures 6, 7 and Table 3.
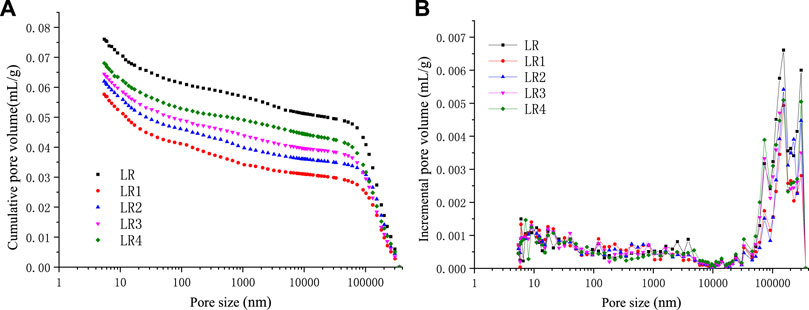
FIGURE 6. Pore volume vs pore size of Liulin mine soft coal after high-temperature and high-pressure adsorption test. (A) Cumulative pore volume of soft coal (B) Incremental pore volume of soft coal.
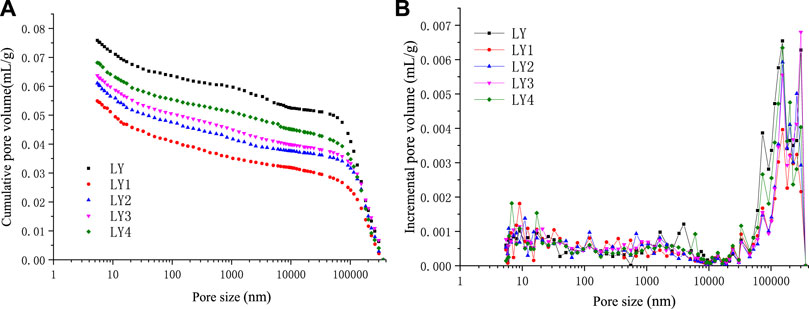
FIGURE 7. Pore volume vs pore size of Liulin mine hard coal after high-temperature and high-pressure adsorption test. (A) Cumulative pore volume of hard coal (B) Incremental pore volume of hard coal.
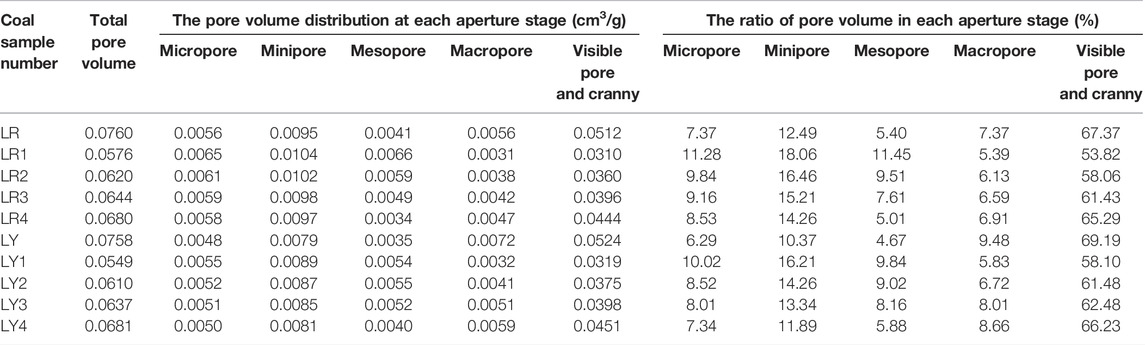
TABLE 3. Pore volume distribution of coal samples with the mercury intrusion method.
It can be seen from Figures 6 and 7 that the total pore volume of coal samples is smaller than that of raw coal after the high-temperature and high-pressure experiment, which is mainly manifested by the decrease of macropores and visible pores volumes in coal samples. The volume of micropores and minipores increases slightly, and the total volume of pores increases with the increase in temperature. This is because under high temperature and high pressure, the macropores, visible pores, and crannies are destroyed, and their volumes decrease. The pores become compact as a whole, and the volume of micropores increases, while the total pore volume decreases. When the temperature rises, the coal body absorbs heat, the coal matrix contracts, the pore structure expands, the semi-closed pore becomes an open pore, the volume of micropore and minipore increases, and the total pore volume increases with the rising temperature. According to Table 3, it can be seen that the visible pores and crannies in coal are the main contributors to total pore volume, and the contributions of the micropore and minipore are smaller. Whether concerning the raw coal or the coals after the high-temperature and high-pressure adsorption experiment, both visible pores and crannies are the largest contributors to pore volume. The visible pores and crannies account for more than 60% of the total pore volume in the Liulin mining area, followed by minipore, and the proportion of mesopores and macropores is less. By comparing soft coal and hard coal, we can find that the proportion of micropores and minipores in soft coal is larger than that in hard coal. Nevertheless, the ratio of micropores, visible pores, and crannies in hard coal is greater than that of soft coal. Micropores and minipores are the main places of adsorption behavior. Because the soft coal contains more micropores, the adsorption capacity of soft coal is greater than that of hard coal in the Liulin mining area.
The Difference in Surface Area of Coal Before and After High-Temperature and High-Pressure Experiments
The accumulative pore area and incremental pore area distribution of soft and hard coal in the Liulin mining area before and after high-temperature and high-pressure experiments were measured by the mercury injection method, as shown in Figures 8 and 9. Table 4 reflects the changes in specific surface area of coal before and after high-temperature and high-pressure experiments.
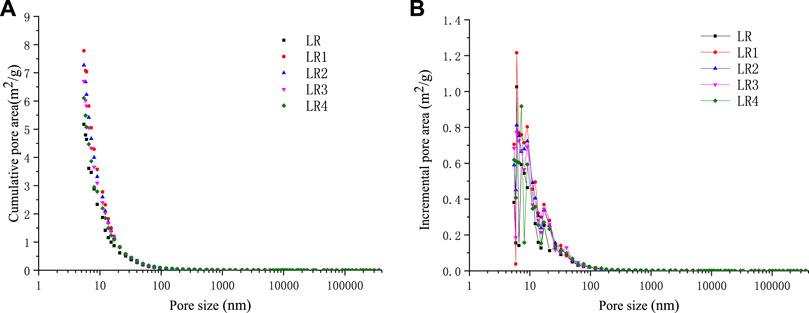
FIGURE 8. Pore area vs pore size of Liulin mine soft coal after high-temperature and high-pressure adsorption test. (A) Cumulative pore area of soft coal (B) Incremental pore area of soft coal.
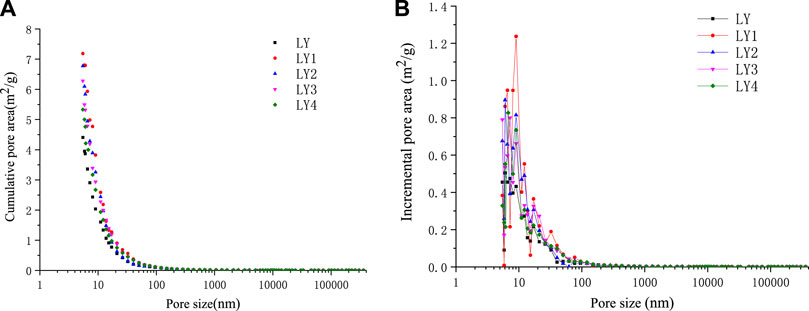
FIGURE 9. Pore area vs pore size of Liulin mine hard coal after high-temperature and high-pressure adsorption test. (A) Cumulative pore area of hard coal (B) Incremental pore area of hard coal.
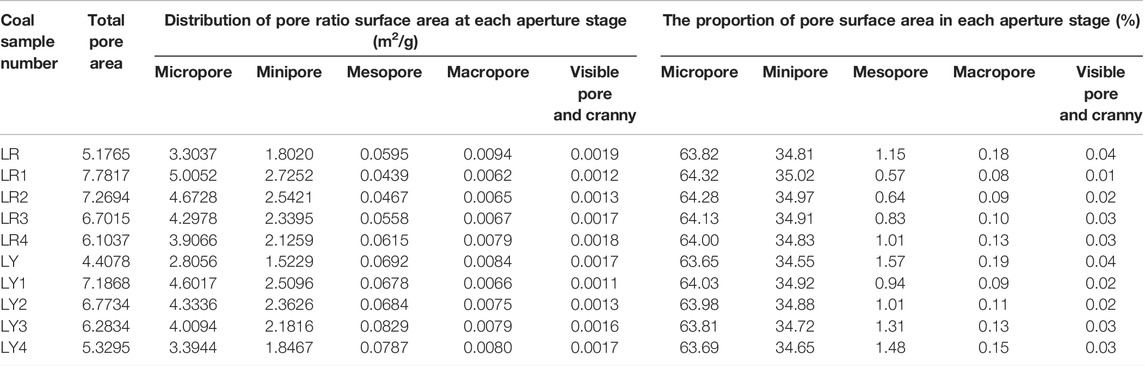
TABLE 4. Pore area distribution of coal samples with the mercury intrusion method.
It can be seen from the aforementioned fact that the surface area of micropores and minipores reaches 98% of the total area, which is the main contributor to the specific surface area of pores, while the visible pores and crannies nearly have little contribution, and the surface area of macropores and mesopores is very small. Compared with raw coal, the pore surface area after the high-temperature and high-pressure experiment increases, that is, because the pore structure of the coal is destroyed, the pore size tends to be smaller, and the number of micropores and minipores in the coal increases, so the specific surface area also increases. Under the same pressure, with the increase in temperature, the specific surface area of the same coal sample showed a decreasing trend. In the experimental range of the pore size test, the pore size of coal samples showed peaks in the micropores ranging from 6 to 10 nm, indicating that the micropores are the main contributors to the total specific pore area of coal samples.
Conclusion
In this study, the coking coal in the Liulin mining area was taken as the research object to analyze the pore structure characteristics of coal before and after the high-temperature and high-pressure adsorption experiment. The following conclusions were obtained:
(1) The pressure is beneficial to gas adsorption, while the temperature has a restraining effect on the gas adsorption of coking coal, and there is a good negative exponential relationship between the adsorption capacity and the temperature of coking coal. At the same temperature, the gas adsorption capacity of soft coal is greater than that of hard coal. When the temperature increases, the reduction of the adsorption capacity of hard coal is less than that of soft coal in the same coalmine. Under the highest equilibrium pressure of 11 MPa, the isothermal adsorption curve of coal samples for methane in the Liulin coalmine still conforms to the Langmuir adsorption curve.
(2) Both before and after the high-temperature and high-pressure adsorption experiment of coking coals in the Liulin coalmine, there exists a hysteresis loop in the whole pressure interval, indicating that there are many open holes in the pores and perhaps semi-closed holes exist. In the process of the mercury injection experiment, the hysteresis loop of coking coal after the high-temperature and high-pressure adsorption experiment is smaller than that of raw coal. This demonstrates that the open pores decrease and the semi-closed pores increase, and then the connectivity of the pores becomes worse, which is not conducive to the gas flow when the coking coals are subjected to high-temperature and high-pressure action.
(3) After the high-temperature and high-pressure adsorption experiment, the volume of macropores, visible pores, and crannies of the coking coal decreases when measured by the mercury intrusion method, and the volume of micropores and minipores increases. However, the total pore volume reduced overall. Under the same pressure, with the increase in temperature, the volume of macropores, visible pores, and crannies increases, while the volume of micropores and minipores decreases, and the total pore volume increases overall.
(4) After the high-temperature and high-pressure adsorption experiment, the proportion of micropores and minipores of coking coal increases, and the specific surface area also increases. There exist plenty of micropores and minipores in soft coal, and the adsorption capacity of soft coal is greater than that of hard coal. Under the same pressure, the surface area of micropores and minipores decreases, and the total specific surface area also decreases with the increase in temperature.
(5) The visible pores and crannies are the main contributors to the total pore volume of coal, and they are the largest components of pore volume either in raw coal or in coal samples after high-temperature and high-pressure adsorption experiments. The micropores and minipores are the main contributors to the specific surface area of pores, and conversely, the contribution to pore volume is minimal.
Data Availability Statement
The original contributions presented in the study are included in the article/Supplementary Material, further inquiries can be directed to the corresponding author.
Author Contributions
QL: Formal analysis and writing—original draft. PX: Data processing and analysis. WZ: Supervision. CX: Formal analysis and supervision. DJ: Crushed coal samples and performed experimental measurement.
Conflict of Interest
The authors declare that the research was conducted in the absence of any commercial or financial relationships that could be construed as a potential conflict of interest.
Publisher’s Note
All claims expressed in this article are solely those of the authors and do not necessarily represent those of their affiliated organizations, or those of the publisher, the editors, and the reviewers. Any product that may be evaluated in this article, or claim that may be made by its manufacturer, is not guaranteed or endorsed by the publisher.
Acknowledgments
This work was supported by the National Natural Science Foundation of China (Nos. 52074107, 51704100, 52074105, and 52074104), Henan Polytechnic University Doctoral Fund Project (B2016-004), the State Key Laboratory Cultivation Base for Gas Geology and Gas Control (Henan Polytechnic University – China) (No. WS 2018B13 and WS 2020B14), the Key Research Program of Higher Education Institution in Henan Department of Education of China (No.15A440007), the Foundation and Advanced Technology Research Project of Henan Province (No. 162300410038), and the 2022 Postdoctoral Science Foundation of Henan Province, China. The authors also gratefully acknowledge the Xingwu Mining Co. LTD., Liulin Mining Area, Shanxi Province, China, for providing the samples and data access. The authors would also like to thank the reviewers for their comments that helped improve the manuscript.
References
Chen, P., and Tang, X. (2001). The Research on Adsorption of Nitrogen in Low Temperature and Micro-pore Properties in Coal. J. China Coal Soc. 26, 552–556. doi:10.13225/j.cnki.jccs.2001.05.023
Chen, S., Zhu, Y., Wang, H., Liu, H., Wei, W., and Fang, J. (2012). Structure Characteristics and Accumulation Significance of Nanopores in Longmaxi Shale Gas Reservoir in the Southern Sichuan Basin. Meitan Xuebao/journal China Coal Soc. 37, 438–444. doi:10.13225/j.cnki.jccs.2012.03.007
Crosdale, P. J., Moore, T. A., and Mares, T. E. (2008). Influence of Moisture Content and Temperature on Methane Adsorption Isotherm Analysis for Coals from a Low-Rank, Biogenically-Sourced Gas Reservoir. Int. J. Coal Geology. 76, 166–174. doi:10.1016/j.coal.2008.04.004
Cui, Y., Yang, X., and Zhang, Q. (2003a). Adsorption Characteristics of Coal on Supercritical Methane. Nat. Gas Ind. 23, 131–133. Available at: http://www.riss.kr/link?id=A99932365. doi:10.3321/j.issn:1000-0976.2003.03.042
Cui, Y., Zhang, Q., and Yang, X. (2003b). Adsorption Properties of Different Coals and the Variation Law of Equivalent Heat of Adsorption. Nat. Gas Ind. 23, 130–131. doi:10.3321/j.issn:1000-0976.2003.04.042
Feng, P. (2018). On the Problems and Countermeasures in Deep Mining of Coal Mine. Energy Energy Conserv, 40–41. doi:10.16643/j.cnki.14-1360/td.2018.02.020
Fredrich, J. T., Menéndez, B., and Wong, T.-F. (1995). Imaging the Pore Structure of Geomaterials. Science 268, 276–279. doi:10.1126/science.268.5208.276
Gao, D., Hong, L., Wang, J., and Zheng, D. (2019). Adsorption Simulation of Methane on Coals with Different Metamorphic Grades. AIP Adv. 9, 095108. doi:10.1063/1.5115457
Gu, Y., Wang, Z., and Qi, L. (2017). Research on Pore Structure of Coal with Low Permeability. Coal Mine Saf. 48, 21–25. doi:10.13347/j.cnki.mkaq.2017.02.006
Hou, C., Zhang, Y., and Zhu, C. (2019). Study on Gas Adsorption Capacity on Coal Surface under High Temperature and Pressure. Saf. Coal Mines 50, 1–5. doi:10.13347/j.cnki.mkaq.2019.02.001
Hou, X., Liu, S., Zhu, Y., and Yang, Y. (2020a). Evaluation of Gas Contents for a Multi-Seam Deep Coalbed Methane Reservoir and Their Geological Controls: In Situ Direct Method versus Indirect Method. Fuel 265, 116917. doi:10.1016/j.fuel.2019.116917
Hou, X., Liu, S., Zhu, Y., and Yang, Y. (2020b). Experimental and Theoretical Investigation on Sorption Kinetics and Hysteresis of Nitrogen, Methane, and Carbon Dioxide in Coals. Fuel 268, 117349. doi:10.1016/j.fuel.2020.117349
Hu, T., Ma, Z., and Yao, H. (2002). Study on High Pressure Adsorption Isotherms of Supercritical Methane. Nat. Gas Chem. Ind 27, 36–40. doi:10.3969/j.issn.1001-9219.2002.02.010
Levy, J. H., Day, S. J., and Killingley, J. S. (1997). Methane Capacities of Bowen Basin Coals Related to Coal Properties. Fuel 76, 813–819. doi:10.1016/S0016-2361(97)00078-1
Li, B., Gao, Z., Li, J., Ren, C., Wang, B., and Zhang, Y. (2021). Adsorption-Thermodynamic Characteristics of Methane at Different Temperatures and Pressures Conditions. J. Saf. Environ. 21, 2479–2488. doi:10.13637/j.issn.1009-6094.2020.1087
Liang, B. (2000). Research on Temperature Effects on the Gas Absorption Performance. J. Heilongjiang Min. Inst. 10, 20–22. doi:10.3969/j.issn.1671-0118.2000.01.006
Liu, G. (2011). Mechanism and Model of Coal Adsorption Gas in High Temperature and Pressure and Three-phase Medium. [dissertation/master’s thesis]. Jiaozuo (Henan): Henan Polytechnic University (China).
Liu, B. (2014). Study on Gas Desorption Characteristics and Influence Factors of Content in Panji Deep Mining Area. [dissertation/master’s thesis]. Jiaozuo (Henan): Henan Polytechnic University (China).
Peng, S. (2008). Present Study and Development Trend of the Deepen Coal Resource Distribution and Mining Geologic Evaluation. Coal 17, 1–11. 27. doi:10.3969/j.issn.1005-2798.2008.02.001
Qi, L. (2013). Research on Coal Gas Adsorption/Desorption Characteristics of No.2-1 Coal Seam in Jiaozuo Coal Field Based on Pore Structure Properties. [dissertation/master’s thesis]. Jiaozuo (Henan): Henan Polytechnic University (China).
Qi, L., Tang, X., Wang, Z., and Peng, X. (2017). Pore Characterization of Different Types of Coal from Coal and Gas Outburst Disaster Sites Using Low Temperature Nitrogen Adsorption Approach. Int. J. Mining Sci. Tech. 27, 371–377. doi:10.1016/j.ijmst.2017.01.005
Qu, Z. (2011). Study of Tectonized Coal Texture and its Controlling Mechanism on Gas Properties. J. China Coal Soc. 36, 533–534. doi:10.13225/j.cnki.jccs.2011.03.032
Thommes, M., Kaneko, K., Neimark, A. V., Olivier, J. P., Rodriguez-Reinoso, F., Rouquerol, J., et al. (2015). Physisorption of Gases, with Special Reference to the Evaluation of Surface Area and Pore Size Distribution (IUPAC Technical Report). Pure Appl. Chem. 87, 1051–1069. doi:10.1515/pac-2014-1117
Wang, G., Cheng, W., and Pan, G. (2012). Influence of Temperature on Coal’ S Adsorbing Capability. J. Saf. Environ. 12, 231–234.
Wang, Z., Kang, B., and Yue, G. (2014). Study on Gas Adsorption Characteristics of Anthracite in Low Temperature Environment. Zhongzhou Coal, 1–4. doi:10.3969/j.issn.1009-6094.2012.05.051
Wang, L., Wang, Z., and Huo, X. (2018). Influence of Pore Structure Change on Gas Adsorption Characteristics of Coal under High Temperature and High Pressure. J. Saf. Sci. Technol. 14, 97–101. doi:10.11731/j.issn.1673-193x.2018.12.015
Xu, B. (2020). Analysis of the Current Situation of Deep Mining and Disaster Prevention and Control in China’s Coal Mines. China Pet. Chem. Stand. Qual. 40, 192–193. doi:10.21455/vis2020.4-6
Xu, Q., Huang, W., and Tang, S. (2016). Pore Structure and Adsorption of Deep Medium-High Rank Coal Reservoirs. Geoscience 30, 413–419. doi:10.3969/j.issn.1000-8527.2016.02.017
Yao, Y., Liu, D., Che, Y., Tang, D., Tang, S., and Huang, W. (2009). Non-destructive Characterization of Coal Samples from China Using Microfocus X-ray Computed Tomography. Int. J. Coal Geology. 80, 113–123. doi:10.1016/j.coal.2009.08.001
Yu, Q. (1992). Gas Prevention and Control in Coalmine. Beijing: China University of Mining and Technology Press.
Zhang, Q. (2008). Adsorption Mechanism of Different Coal Ranks under Variable Temperature and Pressure Conditions. J. China Univ. Mining Tech. 18, 395–400. doi:10.1016/S1006-1266(08)60083-8
Zhang, X., Sang, S., Qin, Y., Zhang, J., and Tang, J. (2005). Isotherm Adsorption of Coal Samples with Different Grain Size. Chinese J. Rock Mech. Eng 34, 427–432. doi:10.3321/j.issn:1000-1964.2005.04.005
Zhao, Y., Sun, Y., Liu, S., Chen, Z., and Yuan, L. (2018). Pore Structure Characterization of Coal by Synchrotron Radiation Nano-CT. Fuel 215, 102–110. doi:10.1016/j.fuel.2017.11.014
Zhao, L., Qin, Y., and Shen, J. (2012). Adsorption Behavior and Abundance Predication Model of Deep Coalbed Methane. Geol. J. China Univ. 18, 553–557. doi:10.16108/j.issn1006-7493.2012.03.028
Zhong, L. (2001). Study of the Relationship between Coal Adsorption Constant the Maximum Pressure Used. Coal Geol. Explor. 29, 25–28. doi:10.3969/j.issn.1001-1986.2001.04.010
Zhong, L., Zhang, H., and Yuan, Z. (2002a). Influence of Specific Pore Area and Pore Volume of Coal on Adsorption Capacity. Coal Geol. Explor. 30, 26–29. doi:10.3969/j.issn.1001-1986.2002.03.008
Keywords: high temperature and high pressure, pore structure, adsorption characteristics, coking coal, deep mining area
Citation: Lingling Q, Xinshan P, Zhaofeng W, Xiangjun C and Juhua D (2022) Study on the Pore Structures and Adsorption Characteristics of Coking Coal of Liulin Mining in China Under the Condition of High Temperature and High Pressure. Front. Earth Sci. 10:877462. doi: 10.3389/feart.2022.877462
Received: 16 February 2022; Accepted: 25 March 2022;
Published: 27 April 2022.
Edited by:
Shimin Liu, The Pennsylvania State University (PSU), United StatesReviewed by:
Xiaowei Hou, Hefei University of Technology, ChinaWei Zhao, China University of Mining and Technology, China
Copyright © 2022 Lingling, Xinshan, Zhaofeng, Xiangjun and Juhua. This is an open-access article distributed under the terms of the Creative Commons Attribution License (CC BY). The use, distribution or reproduction in other forums is permitted, provided the original author(s) and the copyright owner(s) are credited and that the original publication in this journal is cited, in accordance with accepted academic practice. No use, distribution or reproduction is permitted which does not comply with these terms.
*Correspondence: Peng Xinshan, peng5207@126.com