Comprehensive evaluation of vegetation responses to meteorological drought from both linear and nonlinear perspectives
 Zhaoqiang Zhou1,2
  Yibo Ding3 Qiang Fu4 Can Wang1,2
  Yao Wang1,2 Hejiang Cai1,2,5
  Suning Liu6
  Haiyun Shi1,2*
- 1State Environmental Protection Key Laboratory of Integrated Surface Water-Groundwater Pollution Control, School of Environmental Science and Engineering, Southern University of Science and Technology, Shenzhen, Guangdong, China
- 2Guangdong Provincial Key Laboratory of Soil and Groundwater Pollution Control, School of Environmental Science and Engineering, Southern University of Science and Technology, Shenzhen, Guangdong, China
- 3Yellow River Engineering Consulting Co., Ltd., Zhengzhou, China
- 4School of Water Conservancy and Civil Engineering, Northeast Agricultural University, Harbin, China
- 5Department of Civil and Environmental Engineering, National University of Singapore, Singapore, Singapore
- 6Center for Climate Physics, Institute for Basic Science, Daejeon, South Korea
The frequent occurrence of drought events in recent years has caused significant changes in plant biodiversity. Understanding vegetation dynamics and their responses to climate change is of great significance to reveal the behaviour mechanism of terrestrial ecosystems. In this study, NDVI and SIF were used to evaluate the dynamic changes of vegetation in the Pearl River Basin (PRB). The relationship between vegetation and meteorological drought in the PRB was evaluated from both linear and nonlinear perspectives, and the difference of vegetation response to meteorological drought in different land types was revealed. Cross wavelet analysis was used to explore the teleconnection factors (e.g., large-scale climate patterns and solar activity) that may affect the relationship between meteorological drought and vegetation dynamics. The results show that 1) from 2001 to 2019, the vegetation cover and photosynthetic capacity of the PRB both showed increasing trends, with changing rates of 0.055/10a and 0.036/10a, respectively; 2) compared with NDVI, the relationship between SIF and meteorological drought was closer; 3) the vegetation response time (VRT) obtained based on NDVI was mainly 4–5 months, which was slightly longer than that based on SIF (mainly 3–4 months); 4) the VRT of woody vegetation (mainly 3–4 months) was longer than that of herbaceous vegetation (mainly 4–5 months); and 5) vegetation had significant positive correlations with the El Niño Southern Oscillation (ENSO) and sunspots but a significant negative correlation with the Pacific Decadal Oscillation (PDO). Compared with sunspots, the ENSO and the PDO were more closely related to the response relationship between meteorological drought and vegetation. The outcomes of this study can help reveal the relationship between vegetation dynamics and climate change under the background of global warming and provide a new perspective for studying the relationship between drought and vegetation.
1 Introduction
In the context of global warming, the frequency and intensity of droughts will increase (Wang et al., 2021). In many parts of an increasingly globalized world, drought can have devastating agricultural, environmental, and socio-economic impacts (Shi H.Y. et al., 2018; Zhou et al., 2020a; Xu et al., 2020). Therefore, monitoring the impacts of drought on vegetation health will be increasingly important for agricultural production, ecological restoration and water resource planning and management.
Drought is very difficult to observe, and the definition of drought is inconsistent due to different application needs. In general, drought can be divided into four types, i.e., meteorological drought, hydrological drought, agricultural drought, and socio-economic drought (Zhou et al., 2021a). Meteorological drought is usually defined as a long-term shortage of precipitation in an area. Since it is difficult to monitor the onset and termination of drought, many scholars have developed drought indices to evaluate drought characteristics. For example, Shahabfar and Eitzinger (2013) evaluated the temporal and spatial changes in meteorological drought in Iran by using six meteorological drought indices. Rahmat et al. (2015) evaluated meteorological drought characteristics in Australia by using the standardized precipitation index (SPI) and the reconnaissance drought index (RDI). Fu et al. (2018) evaluated the spatiotemporal variation characteristics of meteorological drought in Northeast China by using the SPI. Zhou et al. (2020a) used the standardized precipitation evapotranspiration index (SPEI) to evaluate the relationship between meteorological drought characteristics and maize yield in Northeast China.
Understanding how vegetation responds to drought is a challenge because the effects of drought on vegetation growth are not immediate and linear. Normally, the time required for vegetation to respond to drought is called the vegetation response time (VRT). Previous studies have shown that there is a lag in the response between vegetation and drought (Jiao et al., 2019; Zhao et al., 2020; Zhong et al., 2021). In addition, many studies have demonstrated that there is a nonlinear relationship between drought and vegetation. For instance, Hu et al. (2021) studied the nonlinear changes in climate change, vegetation growth and the coupling between vegetation growth and precipitation during 1982–2015 and showed that the nonlinear response between vegetation and drought became more obvious with the aggravation of drought. Xu et al. (2021) found that differences in vegetation types and their adaptation and vulnerability to drought led to nonlinear responses of vegetation to drought. Ji et al. (2021) found that there was an obvious nonlinear response between the vegetation growing season and drought. Although previous studies on drought have shown the effectiveness of satellite data, they still have inherent limitations in drought monitoring and assessment. Reflectance-based vegetation indices, e.g., the normalized difference vegetation index (NDVI) and the enhanced vegetation index (EVI), have been widely used in dynamic vegetation monitoring (Zhao et al., 2020; Zhou et al., 2020b; De Souza et al., 2022; Li et al., 2022; Yang et al., 2022). When water stress occurs, the spectral characteristics of the vegetation canopy do not change immediately, so the response of vegetation to drought is obviously delayed (Dobrowski et al., 2005). Solar-induced chlorophyll fluorescence (SIF) is different from the traditional vegetation reflectance index and provides an alternative method for global vegetation spatial monitoring. SIF is directly related to photosynthesis of vegetation and may reflect the rapid change in canopy water stress. Recent studies have successfully extracted high-precision global time series of SIF from satellite observations (Li and Xiao, 2019).
The Pearl River Basin (PRB), which is of great significance for socio-economic development of China, has become the major source of carbon dioxide emissions in China (Zhang et al., 2015). As the PRB is located in a humid area, it has a complex vegetation ecosystem, which is of great significance for local biological carbon sequestration to partially offset fossil fuel emissions (Zhou and Zhou, 2021). However, Deng et al. (2018) showed that both drought frequency and severity increased in the PRB, which might weaken the absorption of carbon by vegetation. Therefore, this study evaluated the vegetation changes in the PRB based on NDVI and SIF and assessed the responses of vegetation to meteorological drought from both linear and nonlinear perspectives. The differences in the two indices (NDVI and SIF) in evaluating the relationship between drought and vegetation were compared. Moreover, this study analysed the teleconnection factors that might influence the response relationship between meteorological drought and vegetation. The objectives of this study are to 1) evaluate the dynamic changes in vegetation in the PRB, 2) evaluate the VRT of different vegetation types from both linear and nonlinear perspectives, 3) explore the differences between SIF and NDVI responses to meteorological drought and 4) explore the factors that may influence the relationship between vegetation and drought. The outcomes of this study can help reveal the relationship between vegetation dynamics and climate change under the background of global warming and provide a new perspective for studying the relationship between drought and vegetation. In addition, studying the responses of vegetation to drought at different time scales can aid in identifying ecosystems that are vulnerable to meteorological drought, which can provide a basis for drought mitigation and land planning.
2 Study area and data sources
2.1 Study area
The PRB is located in the tropical and subtropical climate zone of South China (Figure 1). The PRB is the third largest river basin in terms of drainage area and the second largest river in terms of streamflow in China. Water resources in the PRB are relatively abundant. However, precipitation is unevenly distributed in both space and time, which is mainly distributed in the wet season (i.e., from April to September) and accounts for about 80% of the annual total. Therefore, drought and flood events occur frequently in the PRB. The land cover types in the PRB mainly include evergreen broadleaf forest (EBF), mixed forest (MF), cropland (CP) and woody savannas (WS) (see Figure 1).
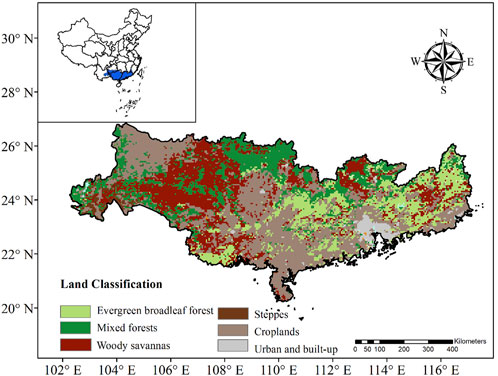
FIGURE 1. The land cover types of the Pearl River Basin (PRB) in China.
2.2 Data sources
The precipitation data (2001–2019) used to calculate the SPI are derived from the ERA-5 Land Reanalysis Dataset provided by the European Center for Medium Range Weather Forecasts (ECMWF), with a spatial resolution of 0.1° and a temporal resolution of 1°month. Several studies have evaluated the applicability of ERA-5 Land Reanalysis precipitation data in China. Jiang et al. (2021) compared the ERA-5 reanalysis precipitation data and the precipitation data of satellites and observation stations in mainland China. They found that the spatial patterns of annual precipitation were consistent with the gauge observations, and ERA-5 reanalysis precipitation data performs better than other satellites products (e.g., Tropical Rainfall Measurement Mission and Climate Prediction Center Morphing technique bias-corrected product). Xu et al. (2022) showed that the spatial patterns of annual precipitation of ERA-5-Land and ERA-5 in mainland China were similar, but their statistical indicators (e.g., correlation coefficient, root mean square error, probability of detection, and false alarm ratio) of ERA-5-Land reanalysis precipitation data were superior to ERA-5. Xin et al. (2021) explored the applicability of ERA-5-Land reanalysis data in the Greater Bay Area based on precipitation, and the results showed that ERA-5-Land reanalysis precipitation data could better describe the spatial distribution and temporal variation trend of monthly precipitation. Zhang et al. (2021) showed that although ERA-5 reanalysis precipitation data overestimated precipitation, it had high simulation accuracy in the monitoring of drought and heat wave events in South China. Zhou et al. (2021a) showed that the meteorological drought events based on ERA-5-Land reanalysis precipitation data were basically consistent with the historical observed drought events, and could well represent the drought events in the PRB. Therefore, ERA-5-Land reanalysis precipitation data was selected in this study.
Both the NDVI and land use data were derived from the Model Resolution Imaging Spectroradiometer (MODIS). The NDVI product (MOD13C2) has a spatial resolution of 0.05° and a temporal resolution of 1 month, while the land cover type product (MCD12C1) has a spatial resolution of 0.05°. In this study, the MCD12C1 product in 2019 was selected to classify different land use types without considering the land cover change during the study period. Combining the Orbiting Carbon Observatory (OCO-2) SIF with machine learning and other higher resolution data, Li and Xiao (2019) constructed the global OCO-2 SIF (GOSIF) dataset. For this dataset, the spatial resolution is 0.05°, and the time resolution is 1 month. To match data with different spatial resolutions, this study resampled both the NDVI and SIF to 0.1°. The 0.1° land cover data were derived from the 0.05° land cover map based on the main land cover types in the 0.05° pixels in each 0.1° grid cell (Zhou et al., 2022). Moreover, this study analysed the effects of large-scale circulation patterns and solar activity on vegetation in the PRB. The monthly El Niño Southern Oscillation (ENSO) and the Pacific Decadal Oscillation (PDO) data are provided by the National Oceanic and Atmospheric Administration. The monthly sunspot data are provided by the International Council of Scientific Unions (ICSU) world data system (WDS).
3 Methodology
3.1 Drought indices
In recent decades, an increasing number of drought indicators have been developed to meet different application needs. This study chose the SPI to represent meteorological drought. The SPI is a widely used drought index recommended by the World Meteorological Organization. It is widely used in drought monitoring and impact assessment (Fu et al., 2018; Fang et al., 2020; Shi et al., 2022). The main advantages of SPI include low data requirements, simple calculation, time and space comparability and multi scalar characteristics, which can study the impacts of drought at different time scales (Patel et al., 2007; Fang et al., 2019, 2020; Zhou et al., 2021a). The main purpose of this study is to explore the relationship between meteorological drought and vegetation. Drought indices at multiple time scales are useful for evaluating vegetation responses to short-, medium-, and long-term drought. Therefore, the SPI was chosen to represent meteorological drought in this study. The SPI series over cumulation periods varying from 1 to 12°months were calculated to access the vegetation responses to meteorological drought. For the specific calculation process, please refer to McKee et al. (1993) and Fu et al. (2018).
3.2 Trend analysis method
In this study, Mann-Kendall trend analysis method and Sen’s slope method were used to analyze the changes of vegetation. These two methods are usually used together to evaluate the variation characteristics of hydrometeorological time series (Fu et al., 2018; Zhou et al., 2020a; Zhou et al., 2021a). Mann-Kendall trend analysis method can be used to evaluate the change trend and significance of time series, and Sen’s slope method is usually used to evaluate the change magnitude of time series. The specific calculation process of SPI can be found in the studies of Fu et al. (2018).
3.3 Pearson correlation coefficient(PCC)
The PCC has been widely used to test the linear correlation between two random variables. The use of the PCC requires the basic assumption that the random variables under investigation are linearly dependent. In this study, the PCC was used to calculate the correlation coefficients between meteorological drought (SPI1-SPI12) and vegetation (NDVI and SIF). The specific calculation process is shown as follows:
where RN,i and RS,i represent the PCC between NDVI/SIF and SPI, i is the accumulated time from one-month to twelve-month SPI (SPI1-SPI12). The time scale of meteorological drought (e.g., i) corresponding to the maximum PCC (MPCC) was considered as the VRT.
3.4 Directed information transfer index
The assumption of linear correlation is often challenged in hydrological systems. Due to the effects of climate change and human activities, there is not only a linear relationship but also a nonlinear relationship between vegetation and meteorological drought (Papagiannopoulou et al., 2017; Hu et al., 2021). Ignoring the nonlinear relationship between meteorological drought and vegetation may not obtain the accurate VRT. The limitations of linear correlation analysis have driven the development of another dependency measure. Mutual information is an important method in information theory and is commonly used to test the nonlinear relationship between two sequences (Shi B. et al., 2018; Fang et al., 2020). The DITI is used to represent the directional information transfer quantity of a specific information source by information entropy based on mutual information and is used to characterize the relationship between the information source and information function points (Zhou et al., 2021b). In this study, meteorological drought and vegetation change were taken as the information source and the information function point, respectively. The accumulation period of the SPI corresponding to the maximum value of the DITI is taken as the VRT from a nonlinear perspective.
For two time series X and Y, their domain of definition is S. The information entropy of X and Y can be defined as follows:
where fX(x) and fY(y) are the marginal distributions of X and Y, respectively.
Mutual information (MI) can be defined as follows:
where fX,Y (x, y) is the joint distribution of X and Y.
Therefore, the DITI from information source X to information function point Y can be defined as follows:
3.5 Cross wavelet transform
XWT is an effective tool to study the correlation between two correlation time series. It combines wavelet transform and cross spectrum analysis, which can show the correlation between two time series in the time domain (Han et al., 2019; Zhou et al., 2021a). In this study, XWT is used to analyse the relationship between vegetation and drought. Moreover, XWT is also used to explore the relationship between large-scale climatic patterns (ENSO and PDO) and solar activity (sunspot) and vegetation. For two time series x(t) and y(t), the cross wavelet power spectrum can be defined as follows:
where
4 Results
4.1 Spatiotemporal variations in meteorological drought and vegetation
Figure 2 shows the variation characteristics of meteorological drought at different time scales. Known from Figure 2, severe drought events occurred in 2004, 2007, 2009, and 2011. Drought statistics of the Pearl River Water Resources Commission (https://www.pearlwater.gov.cn/xxcx/szygg) showed that, in 2003, 2004, 2007, 2009, and 2010, severe drought events occurred in the PRB, and our research results are basically consistent with them.
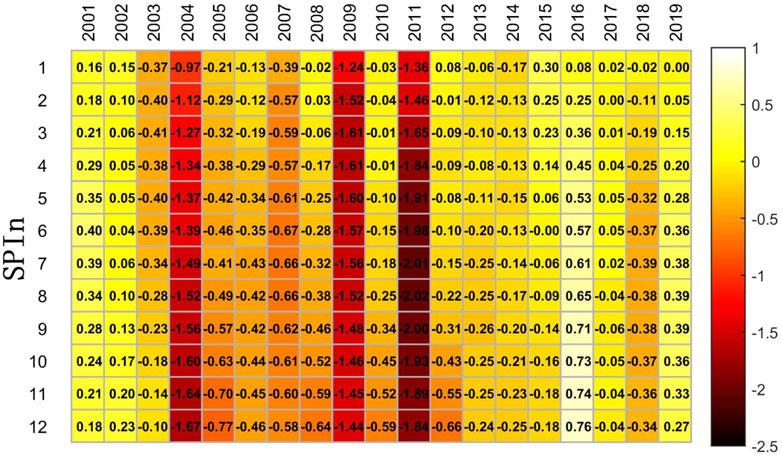
FIGURE 2. The changing characteristics of meteorological drought (SPI1-SPI12) in the PRB.
Figures 3A,B shows the spatial distributions of the annual mean NDVI and SIF in the PRB from 2001 to 2019. The spatial distribution characteristics of vegetation cover and photosynthetic capacity in the PRB were similar, with low spatial characteristics in the west and high spatial characteristics in the east. The western PRB has a higher elevation and is dominated by karst topography. Compared with the central and eastern plain regions, the vegetation coverage and photosynthetic capacity were lower. In particular, compared with the vegetation coverage and photosynthetic capacity in the western PRB, the vegetation coverage and photosynthetic capacity in the Guangdong-Hong Kong-Macao Greater Bay Area were lower, which may be due to the rapid economic development, rapid urbanization and human activities affecting the change in vegetation. Figures 3C,D shows the spatial distributions of the trend of NDVI and SIF in the PRB from 2001 to 2019 after performing a 95% significance test. Known from Figure 3A that the change trend of NDVI in the middle of the PRB was relatively large, and only 4.6% of the regions do not exceed the significance test. In the regions exceeding the significance test, the NDVI of 99.87% of the PRB showed an increasing trend, and that of 0.13% of the PRB showed a decreasing trend. The maximum and minimum trends were 15.9*10–3/yr and −4.8*10–3/yr, respectively. For the trend of SIF, only 2.2% of the regions do not exceed the significance test. In the regions exceeding the significance test, the SIF of 99.85% of the PRB showed an increasing trend, and that of 0.15% of the PRB showed a decreasing trend. The maximum and minimum trends were 8.6*10–3/yr and −2.7*10–3/yr, respectively.
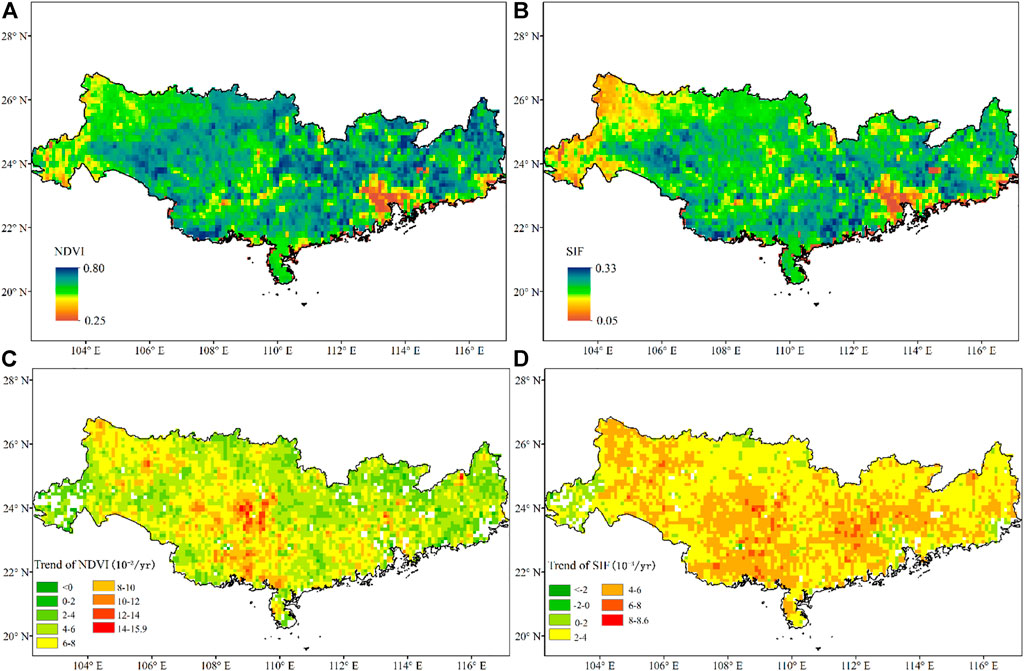
FIGURE 3. Spatial distributions of annual mean (A) NDVI and (B) SIF and trend in (C) NDVI and (D) SIF in the PRB from 2001 to 2019.
Figure 4 shows the trends of annual vegetation cover and photosynthetic capacity in the PRB from 2001 to 2019. As shown in Figure 4, the NDVI showed a slow increasing trend from 2001 to 2019, with a change rate of 0.055/10a. The maximum NDVI value (0.69) appeared in 2017, the minimum NDVI value (0.60) appeared in 2004, and the annual average value of NDVI was 0.64. The SIF also showed a slow increasing trend from 2001 to 2019, with a change rate of 0.036/10a. The maximum SIF value (0.26) appeared in 2017, the minimum SIF value (0.19) appeared in 2004, and the annual average value of SIF was 0.22. In general, the vegetation cover and photosynthetic capacity of the PRB showed an increasing trend from 2001 to 2019.
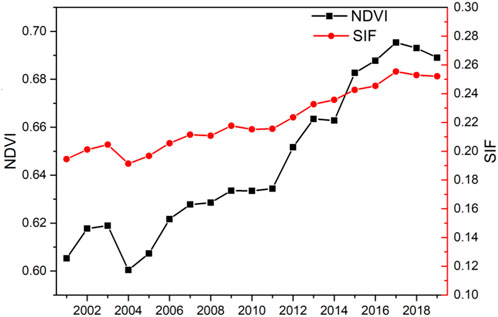
FIGURE 4. Trends in annual vegetation cover and photosynthetic capacity in the PRB from 2001 to 2019.
It is worth noting that both NDVI and SIF have shown increasing trends since 2011. Due to the severe drought events in 2009 and 2011, the annual precipitation was less than 1,200 mm, so the continuous recovery of precipitation since 2011 led to the rapid growth of vegetation. However, the increase of NDVI was much larger than that of SIF, which might be caused by the seasonal characteristics of NDVI and SIF. Solar radiation has obvious seasonal characteristics, increasing in spring and summer and decreasing in autumn and winter. SIF represents the photosynthetic capacity of vegetation, and thus, is closely related to solar radiation (Ma et al., 2020) and also has similar seasonal characteristics (Liu et al., 2019; Wu et al., 2021). The study of Jeong et al. (2017) showed that the phenological time determined based on NDVI was longer than that based on SIF, and the change of vegetation greenness may be decoupled from seasonality. Xie et al. (2016) showed that the air temperature in the PRB showed an increasing trend. The increase of temperature in winter and spring will lead to an earlier onset of greenness, while the increase of temperature in autumn will delay the decrease of greenness (Jeong et al., 2011). This may result in a high level of vegetation greenness variation in the inter-annual variation. Therefore, the increase of NDVI was greater than that of SIF.
4.2 Spatial distribution of the meteorological drought-vegetation correlation
To explore the response of vegetation dynamic changes to meteorological drought, the PCC and the DITI were used to determine the response relationship and VRT from linear and nonlinear perspectives, respectively. The values of the PCC and the DITI between the NDVI or SIF and the SPI at different scales were calculated. The time scale corresponding to the maximum SPI-NDVI and SPI-SIF relationship characteristics was defined as the VRT. Figure 5 shows the spatial distribution of the MPCC and DITI and the corresponding VRT based on the NDVI.
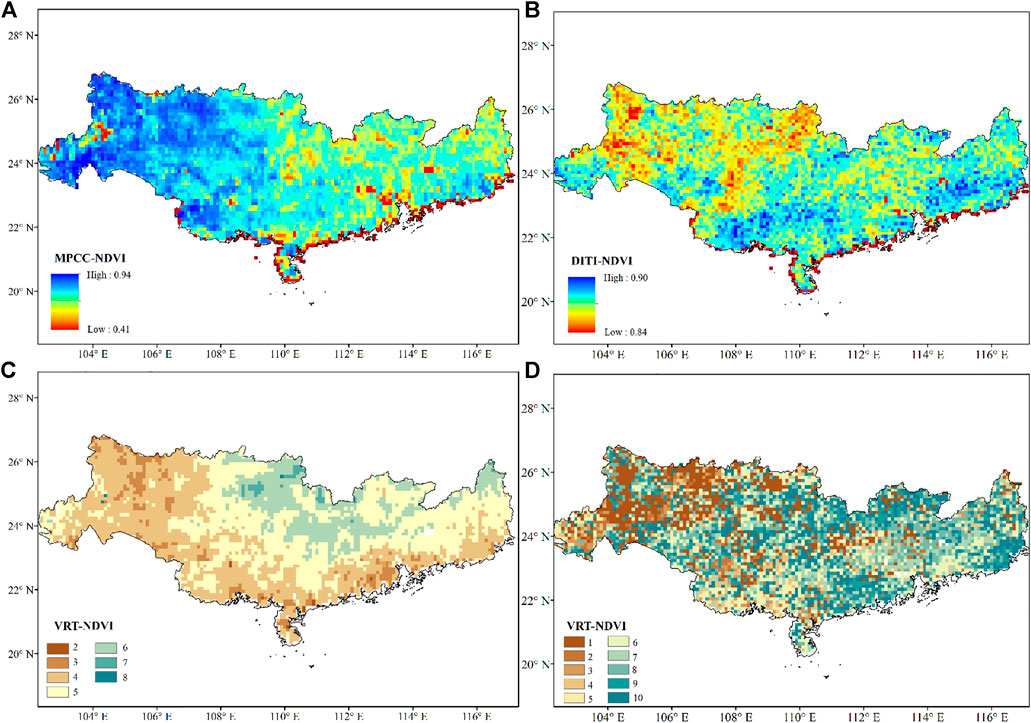
FIGURE 5. Spatial distributions of the MPCC (A) and the DITI (B) and corresponding VRT (C,D) are based on the NDVI.
As shown in Figure 5A, there was a close relationship between meteorological drought and the NDVI in the PRB, with the MPCC ranging from 0.41 to 0.94 and passing the significance test at 95%. The MPCC was larger in the western PRB. The spatial distribution characteristics of VRT were similar from the linear perspective (Figure 5C). The VRT was larger in the middle of the PRB and decreased from the middle of the PRB to other directions. The VRT based on the NDVI from linear perspectives ranged from 2 to 8 months, and the VRT in most (93.2%) areas ranged from 4 to 6 months, accounting for 36.5% (4 months), 40.4% (5 months) and 16.3% (6 months), respectively. As shown in Figure 5B, there was also a close nonlinear relationship between meteorological drought and the NDVI in the PRB, with the DITI ranging from 0.83–0.90. Figure 5D shows that the VRT determined from nonlinear perspectives was relatively discrete, among which the VRT at 1 month accounted for the largest proportion (17.17%).
Figure 6 shows the spatial distribution of the MPCC and the DITI and the corresponding VRT based on SIF. Compared with the NDVI, there was a closer relationship between meteorological drought and SIF, with the MPCC ranging from 0.41 to 0.94 and passing the significance test at 95%. The MPCC was also larger in the western PRB (Figure 6A). The VRT based on SIF from linear perspectives (ranging from 2 to 6 months) was shorter than that based on the NDVI, and the VRT in most areas (89.4%) ranged from 2 to 4 months (Figure 6C), accounting for 15.3% (2 months), 42% (3 months) and 32.1% (4 months), respectively. As shown in Figure 6B, there was also a close nonlinear relationship between meteorological drought and SIF in the PRB, with the DITI ranging from 0.82–0.90. Figure 6D shows that the VRT determined from nonlinear perspectives was also relatively discrete, among which the VRT at 1 month accounted for the largest proportion (16.57%).
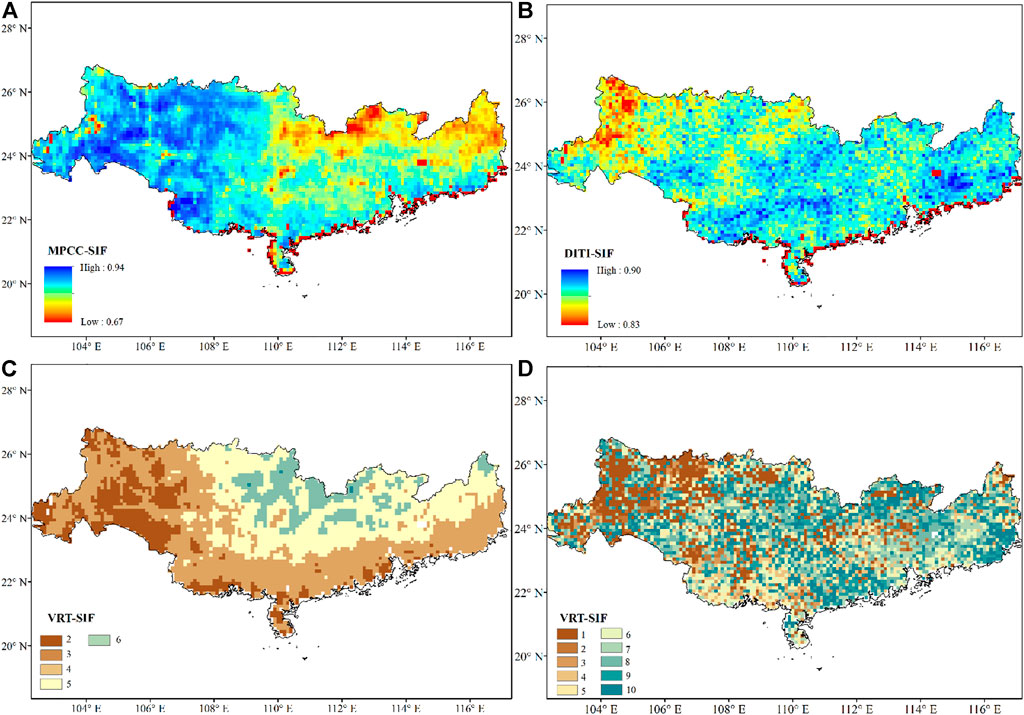
FIGURE 6. Spatial distributions of the MPCC (A) and the DITI (B) and corresponding VRT (C,D) are based on SIF.
4.3 Spatial distribution of the final vegetation response time
The SPI-SRI correlation quantified above represents the dependence of runoff anomalies on precipitation anomalies. Two candidate VRT can be obtained from linear and nonlinear perspectives. To determine the VRT more reasonably, the water deficit of meteorological drought corresponding to the linear and nonlinear VRT of each grid was calculated. In general, a precipitation deficit is an important factor that causes vegetation dynamic changes (Khosravi et al., 2017; Fang et al., 2019; Wu et al., 2019). Therefore, this study takes the accumulation period corresponding to meteorological drought with a greater deficit as the VRT of this grid. Figure 7 shows the spatial distributions of the final VRT based on the NDVI and SIF. As shown in Figure 7, the VRT based on the NDVI in most areas ranged from 4 to 5 months, accounting for 36.41% (4 months) and 39.95% (5 months), respectively. The VRT based on SIF in most areas ranged from 3 to 4 months, accounting for 36.58% (3 months) and 30.75% (4 months), respectively.
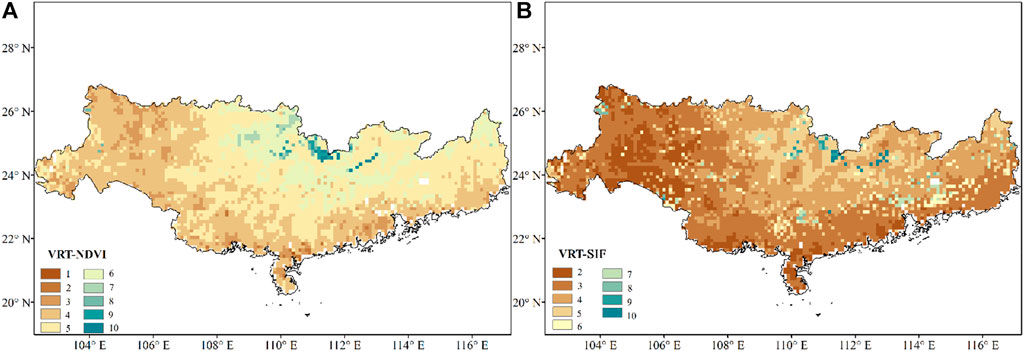
FIGURE 7. Spatial distributions of the final VRT based on (A) the NDVI and (B) SIF.
To reveal the link between vegetation and meteorological drought, XWT was used to analyse the relationship between meteorological drought and vegetation. According to the results of subsection 4.2, the VRT with the largest proportion of grids (5 months for the NDVI and 3 months for SIF) was selected to analyse the relationship between meteorological drought and vegetation (Figure 8). The darker and lighter colours indicate higher and lower energy densities, respectively. The solid black line represents the wavelet influence cone, and the area within the cone line represents more than 95% in the significance test. The direction of the arrow represents the phase change in the two variables. The arrow to the right indicates that the two variables show a positive correlation, and the arrow to the left indicates that the two variables show a negative correlation. The arrow pointing up indicates that the change in variable 1 lags variable 2, and the arrow pointing down indicates that the change in variable 1 leads variable 2 (Chang et al., 2017). Figure 8A shows that the SPI5 and the NDVI had an obvious positive phase relationship in the 8–16 months resonance period from 2001 to 2019. Similarly, Figure 8B shows that SPI3 and SIF had an obvious positive phase relationship during 8–16 months of the resonance period from 2001 to 2019. In general, there was a stable relationship between meteorological drought and vegetation in the PRB. In addition, the phase angle is almost 0°, the arrow direction points horizontally to the right, the two variables are in the same phase, and there is no lag phenomenon; thus, the VRT determined in this study is reasonable.
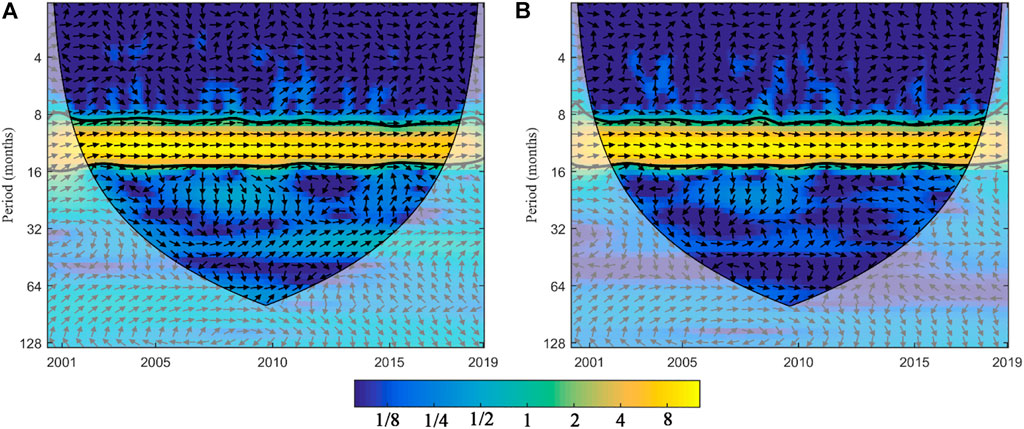
FIGURE 8. The cross wavelet transforms between meteorological and vegetation factors in the PRB: (A) NDVI and SPI5; (B) SIF and SPI3.
To further study the response of vegetation dynamic changes to meteorological drought, the VRT corresponding to different vegetation types was counted. For the VRT-NDVI, the VRT of different vegetation types decreased from MF (5.25 ± 1.21 months), EBF (5.11 ± 0.76 months), WS (4.51 ± 0.75 months), and CP (4.47 ± 0.95 months). For VRT-SIF, the VRT of different vegetation types decreased from MF (4.13 ± 1.42 months), EBF (4.05 ± 1.07 months), WS (3.44 ± 1.13 months), and CP (3.58 ± 1.18 months). Xu et al. (2020) showed that herbaceous plants had a shorter response time to drought than woody plants, and our results were consistent with those results. In general, SIF was more responsive to meteorological drought than the NDVI. In practical applications, according to the different responses of SIF and the NDVI to meteorological drought, SIF is more suitable for early drought monitoring and vegetation management, while the NDVI is more suitable for regional long-term disaster prevention and vegetation management.
4.4 The influences of teleconnection factors on the response relationship
The XWT was used to investigate the impacts of large-scale climate patterns and solar activity on vegetation. Figures 8A–C shows the influences of the ENSO, PDO and sunspots on the NDVI, and Figures 8D–F shows the influences of the ENSO, PDO and sunspots on SIF. As shown in Figure 9A, there was a significant positive correlation between the NDVI and ENSO in the period of 8–16 months during the whole study period. During 2001–2007 and 2008–2017, there was a significant negative correlation between the NDVI and PDO in the period of 8–16 months (Figure 9B). There was a significant positive correlation between the NDVI and sunspots in the period of 8–16 months during 2001–2005 and 2010–2014 (Figure 9C). The influences of the ENSO, PDO and sunspots on SIF were similar to those of the NDVI. SIF had a significant positive correlation with the ENSO and sunspots and a significant negative correlation with the PDO.
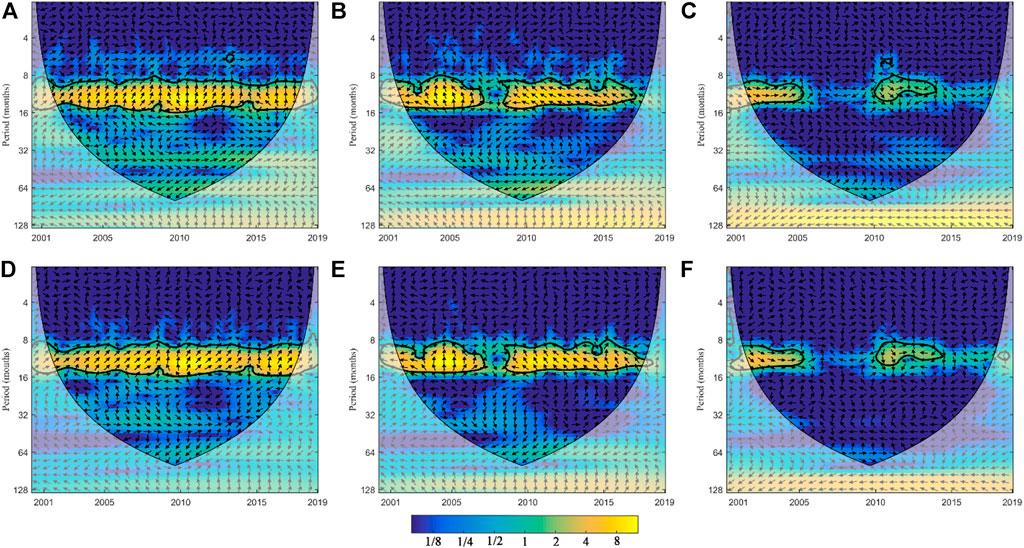
FIGURE 9. The XWT between monthly NDVI series (A–C)/SIF series (D–F) and large-scale climate patterns and solar activity in the PRB.
According to the VRT determined by the NDVI and SIF in subsection 4.3, the VRT with the largest proportion of grids (5 months for the NDVI and 3 months for SIF) was selected. Figure 10 shows the XWT between the monthly SPI5 (a-c)/SPI3 series (d-f) and large-scale climate patterns and solar activity in the PRB. As shown in Figure 10, meteorological drought had a significant positive correlation with the ENSO and sunspots and a significant negative correlation with the PDO. Therefore, large-scale climate patterns and solar activity can affect vegetation growth in the PRB by influencing meteorological drought. In addition, the ENSO and PDO were more closely related to meteorological drought and vegetation growth in the PRB.
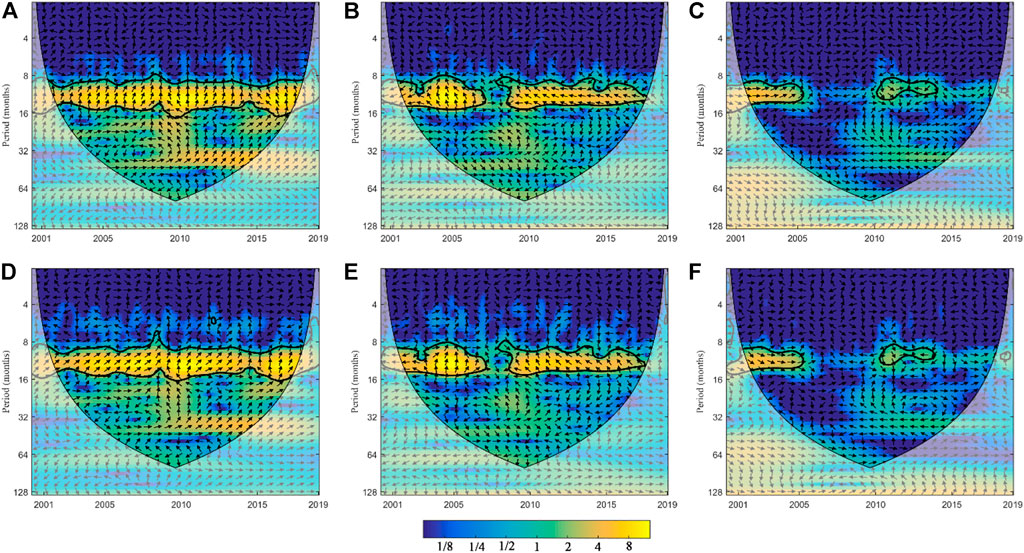
FIGURE 10. The XWT between the monthly SPI5 (A–C)/SPI3 series (D–F) and large-scale climate patterns and solar activity in the PRB.
5 Discussion
5.1 Possible reason for the difference in the response relationship
From subsections 4.2, it is found that the linear relationship was larger in the western part of the PRB and smaller in the eastern part of the PRB; on the contrary, the nonlinear relationship was smaller in the western part of the PRB and larger in the eastern part of the PRB. Some studies have proved that the spatial distribution characteristics of linear relationship between meteorological drought and vegetation are mainly related to land cover types. Zhou et al. (2022) showed that the response relationship between meteorological drought and vegetation was larger on WS and CP than on EBF and MF. Xu et al. (2020) showed that herbaceous plants responded faster to drought than woody plants. Known from Figure 1, WS and CP are the main land use types in the western part of the PRB, so the MPCC was relatively larger in the western part of the PRB. The EBF and MF have complex vertical structures (mainly in the eastern part of the PRB), and EBF and MF have deeper roots and stronger water storage capacity (Wang et al., 2014; Tania and Irma, 2020; Kilic, 2021), so the nonlinear relationship was relatively larger in the eastern part of the PRB. In addition, some studies have proved that climate change (such as changes in precipitation and temperature) and human activities (such as irrigation) are also important factors affecting the relationship between meteorological drought and vegetation response (Fang et al., 2005; Hennekam et al., 2016; Papagiannopoulou et al., 2017; Ding et al., 2021), which can be further explored in future studies.
From subsections 4.2, and 4.3, the VRTs that were determined based on the NDVI and SIF were different, and the VRT determined based on SIF was shorter than that based on the NDVI, which might be caused by the different monitoring principles of the NDVI and SIF. The NDVI and SIF monitor vegetation based on the reflectance of vegetation leaves to radiation and the intensity of vegetation photosynthesis, respectively. Drought can affect vegetation photosynthesis and leaf area (Xie et al., 2020). When a short-term drought occurs, the NDVI can still maintain a high level, while SIF is directly related to vegetation photosynthesis and can reflect the rapid change in canopy water stress (Wang et al., 2016). When a long-term drought occurs, the water deficit makes the stomata of vegetation leaves close, leading to water loss and contraction of vegetation leaves. The photosynthetic capacity of leaves is also weakened, which leads to the contraction of leaves due to water shortage. Leaf atrophy of vegetation will lead to a decrease in the vertical projection area of vegetation, so the NDVI will also decrease (Gitelson et al., 2021). Therefore, different VRTs may reflect the physiological performance of leaves during a drought event, and the change in photosynthetic capacity occurs earlier than the change in leaf area, so the VRT based on the NDVI is larger than that based on SIF. In practical applications, according to the different responses of SIF and the NDVI to meteorological drought, SIF is more suitable for early drought monitoring and vegetation management, while the NDVI is more suitable for regional long-term disaster prevention and vegetation management.
As shown in subsection 4.3, there were differences in the VRT among the different vegetation types. In general, when a drought event occurs, vegetation can absorb water from the soil to help it grow. The reason why the VRT of woody vegetation was longer than that of herbaceous vegetation might be due to the higher drought tolerance of woody vegetation. The ability of trees to resist drought comes from their deep root and xylem systems for water storage and long life (McDowell et al., 2008). The roots and stems of woody vegetation can utilize more soil water content (Xu et al., 2020). Due to the complex vertical structure, the performance of MFs in water and soil conservation was better than that of pure forests (Kilic, 2021), and their drought resistance may be stronger. Therefore, the VRT in the MF was greater than that in the evergreen broad-leaved forest.
5.2 Possible physical mechanisms for the correlation between vegetation and teleconnection factors
ENSO was closely correlated with precipitation, temperature, and meteorological drought in the PRB (Huang et al., 2017; Li et al., 2019). In general, large-scale climatic patterns influence vegetation growth by influencing water vapour and heat conditions. The ENSO can influence vegetation growth by redistributing water vapour and heat (Yeh et al., 2014). The PDO is also an important factor affecting drought in the PRB, and different types of droughts in the PRB are closely related to large-scale climate patterns (Han et al., 2019). The phase change in the PDO (cold and warm) was closely related to regional temperature and precipitation changes and significantly affected the interannual and seasonal changes in vegetation growth by controlling the regional climate (Zhang et al., 2017).
Vegetation cannot grow without the Sun, and the activity of sunspots has periodic characteristics and will change the solar radiation intensity (Balasubramaniam and Henry, 2016). Solar radiation also provides necessary energy for evapotranspiration, and the change in evapotranspiration intensity can affect precipitation by influencing the content of water vapour in the atmosphere and then indirectly affecting the growth of vegetation (Dong et al., 2017). Zhou et al. (2013) showed that solar energy can influence regional climate (such as precipitation and temperature) and then affect vegetation growth by influencing circulation movement.
In general, ENSO and PDO affect vegetation dynamics by influencing regional climate characteristics. The process of solar activity affecting vegetation dynamics is indirect. Solar activity first affects circulation, then affects regional climate characteristics, and finally affects vegetation. The process is more indirect, which may be the reason why the ENSO and PDO are more closely related to drought and vegetation in the PRB.
5.3 Limitations and extensions
In general, different definitions of drought will lead to different drought characteristics. Previous studies have shown that when calculating the drought index, if more variables are considered, such as temperature, evaporation and soil moisture, the trend in drought will change (Sohrabi et al., 2015; Liu et al., 2021). In this study, the SPI, with multiple time scales and easy calculation, was selected to represent meteorological drought. In future studies, meteorological drought indices with multiple factors could be selected to evaluate the relationship between meteorological drought and vegetation. The effect of drought on vegetation is a complex process. This paper only studied the response between meteorological drought and vegetation. Agricultural drought is closely related to soil moisture, and hydrological drought is closely related to watershed hydrological conditions and may also affect the dynamic change in vegetation. Previous studies have shown that vegetation growth is closely related to soil water content and runoff (Peel, 2009; Zhang et al., 2016). Therefore, future studies on the relationship between drought and vegetation should fully consider the impact of different types of droughts on vegetation. Notably, the feedback between different types of droughts and vegetation would be an interesting study. Causal analysis has been applied in environmental science in recent years. Wei et al. (2022) used the Granger causality test to analyse the feedback relationship between vegetation and soil moisture on the Loess Plateau. Shi et al. (2022) used convergent cross mapping to study the causal relationship between meteorological drought and hydrological drought. Wang et al. (2018) used convergent cross mapping to study the feedback relationship between precipitation and soil moisture. Therefore, future studies on the feedback relationship between vegetation and drought based on causal analysis can be carried out. In addition, due to the impacts of climate change and human activities, more people have begun to pay attention to the nonlinear impacts caused by climate change. This study introduces the DITI in information theory to study the relationship between meteorological drought and vegetation. Some studies have explored the effects of drought on vegetation using machine learning methods (Ribeiro et al., 2019; Lees et al., 2022). However, these methods are used to explore the relationship between drought and vegetation from the perspective of statistical algorithms. The impacts of drought on vegetation can be further explored based on plant physical models in the future.
6 Conclusion
In this study, the relationship between meteorological drought and the dynamics of vegetation was evaluated from both linear and nonlinear perspectives in the PRB, and the differences between the VRT based on the NDVI and SIF were compared. Moreover, the influences of teleconnection factors on the response relationship were analysed. The results can aid in understanding the mechanism of vegetation dynamic response to meteorological drought and provide a good reference for regional drought prevention. The main conclusions are summarized as follows:
(1) The spatial distribution characteristics of vegetation cover and photosynthetic capacity in the PRB were similar, with low spatial characteristics in the west and high spatial characteristics in the east. The vegetation cover and photosynthetic capacity in the PRB showed an increasing trend from 2001 to 2019.
(2) Compared with the NDVI, SIF was more closely related to meteorological drought. The VRT based on the NDVI was typically 4–5 months, accounting for 36.41% (4 months) and 39.95% (5 months), respectively. The VRT based on the NDVI was typically 3–4 months, accounting for 36.58% (3 months) and 30.75% (4 months), respectively. The VRT on woody vegetation was longer than that on herbaceous vegetation.
(3) Large-scale climatic patterns and solar activity can affect vegetation growth by influencing meteorological drought in the PRB. Compared with sunspots, the ENSO and PDO were more closely related to the response relationship between meteorological drought and vegetation in the PRB.
Data availability statement
The original contributions presented in the study are included in the article/supplementary material, further inquiries can be directed to the corresponding author.
Author contributions
Conceptualization: HS. Data curation: ZZ. Formal analysis: ZZ. Funding acquisition: HS. Methodology: ZZ, HS. Supervision: HS, QF, and SL. Validation: ZZ, YD, CW, YW, and HC. Writing—original draft: ZZ. Writing—Reviewing and Editing: HS, SL.
Funding
This study was supported by the National Natural Science Foundation of China funded projects (51909117 and 51825901), Natural Science Foundation of Shenzhen funded project (JCYJ20210324105014039), Heilongjiang Provincial Science Fund for Distinguished Young Scholars (YQ 2020E002), Guangdong Provincial Key Laboratory of Soil and Groundwater Pollution Control (2017B030301012), and State Environmental Protection Key Laboratory of Integrated Surface Water-Groundwater Pollution Control.
Conflicts of interest
Author YD is employed by Yellow River Engineering Consulting Co., Ltd.
The remaining authors declare that the research was conducted in the absence of any commercial or financial relationships that could be construed as a potential conflict of interest.
Publisher’s note
All claims expressed in this article are solely those of the authors and do not necessarily represent those of their affiliated organizations, or those of the publisher, the editors and the reviewers. Any product that may be evaluated in this article, or claim that may be made by its manufacturer, is not guaranteed or endorsed by the publisher.
References
Balasubramaniam, K. S., and Henry, T. W. (2016). Sunspot numbers from ISOON: A ten-year data analysis. Sol. Phys. 291 (9–10), 3123–3138. doi:10.1007/s11207-016-0874-5
Chang, T. P., Liu, F. J., Ko, H. H., and Huang, M. C. (2017). Oscillation characteristic study of wind speed, global solar radiation and air temperature using wavelet analysis. Appl. Energy 190, 650–657. doi:10.1016/j.apenergy.2016.12.149
De Souza, R. D., Moura, V., Paloschi, R. A., Aguiar, R. G., Webler, A. D., Borma, L. D., et al. (2022). Assessing drought response in the Southwestern Amazon Forest by remote sensing and in situ measurements. Remote Sens. 14 (7), 1733. doi:10.3390/rs14071733
Deng, S. L., Chen, T., Yang, N., Qiu, L., Li, M. C., Chen, D., et al. (2018). Spatial and temporal distribution of rainfall and drought characteristics across the Pearl River Basin. Sci. Total Environ. 619, 28–41. doi:10.1016/j.scitotenv.2017.10.339
Ding, Y. B., Wang, F. Z., Mu, Q., Sun, Y., Cai, H. J., Xu, J. T., et al. (2021). Estimating land use/land cover change impacts on vegetation response to drought under ‘Grain for Green’ in the Loess plateau. Land Degrad. Dev. 32 (17), 5083–5098. doi:10.1002/ldr.4093
Dobrowski, S., Pushnik, J., Zarcotejada, P., and Ustin, S. (2005). Simple reflectance indices track heat and water stress-induced changes in steady-state chlorophyll fluorescence at the canopy scale. Remote Sens. Environ. 97, 403–414. doi:10.1016/j.rse.2005.05.006
Dong, L., Zhang, P., Liu, J., Tong, X., and Xie, H. (2017). Combined influence of solar activity and ENSO on hydrological processes in Yoshino River basin, Japan. Adv. Water Sci. 28 (5), 671–680.
Fang, J. Y., Piao, S. L., Zhou, L. M., He, J. S., Wei, F. Y., Myneni, R. B., et al. (2005). Precipitation patterns alter growth of temperate vegetation. Geophys. Res. Lett. 32 (21), L21411. doi:10.1029/2005gl024231
Fang, W., Huang, S. Z., Huang, Q., Huang, G. H., Wang, H., Leng, G. Y., et al. (2019). Probabilistic assessment of remote sensing-based terrestrial vegetation vulnerability to drought stress of the Loess Plateau in China. Remote Sens. Environ. 232, 111290. doi:10.1016/j.rse.2019.111290
Fang, W., Huang, S. Z., Huang, Q., Huang, G. H., Wang, H., Leng, G. Y., et al. (2020). Identifying drought propagation by simultaneously considering linear and nonlinear dependence in the Wei River basin of the Loess Plateau, China. J. Hydrology 591, 125287. doi:10.1016/j.jhydrol.2020.125287
Fu, Q., Zhou, Z. Q., Li, T. X., Liu, D., Hou, R. J., Cui, S., et al. (2018). Spatiotemporal characteristics of droughts and floods in northeastern China and their impacts on agriculture. Stoch. Environ. Res. Risk Assess. 30 (10), 2913–2931. doi:10.1007/s00477-018-1543-z
Gitelson, A., Arkebauer, T., Viña, A., Skakun, S., and Inoue, Y. (2021). Evaluating plant photosynthetic traits via absorption coefficient in the photosynthetically active radiation region. Remote Sens. Environ. 258, 112401. doi:10.1016/j.rse.2021.112401
Han, Z. M., Huang, S. Z., Huang, Q., Leng, G. Y., Wang, H., Bai, Q. J., et al. (2019). Propagation dynamics from meteorological to groundwater drought and their possible influence factors. J. Hydrology 578, 124102. doi:10.1016/j.jhydrol.2019.124102
Hennekam, R., Donders, T. H., Zwiep, K., and de Lange, G. J. (2016). Integral view of Holocene precipitation and vegetation changes in the Nile catchment area as inferred from its delta sediments. Quat. Sci. Rev. 130 (SI), 189–199. doi:10.1016/j.quascirev.2015.05.031
Hu, X., Jiang, L. B., Shi, F. Z., Li, X. Y., Zhang, S. L., Zhao, Y. D., et al. (2021). Intensified drought enhances coupling between vegetation growth and pregrowing season precipitation in the drylands of the Silk Road Economic Belt. JGR. Biogeosciences 126 (3), e2020JG005914. doi:10.1029/2020jg005914
Huang, C., Zhang, Q., Singh, V. P., Gu, X. H., and Shi, P. J. (2017). Spatio-temporal variation of dryness/wetness across the Pearl River basin, China, and relation to climate indices. Int. J. Climatol. 37, 318–332. doi:10.1002/joc.5005
Jeong, S. J., Ho, C. H., Gim, H. J., and Brown, M. E. (2011). Phenology shifts at start vs. end of growing season in temperate vegetation over the Northern Hemisphere for the period 1982–2008. Glob. Change Biol. 17, 2385–2399. doi:10.1111/j.1365-2486.2011.02397.x
Jeong, S. J., Schimel, D., Frankenberg, C., Drewry, D. T., Fisher, J. B., Verma, M., et al. (2017). Application of satellite solar-induced chlorophyll fluorescence to understanding large-scale variations in vegetation phenology and function over northern high latitude forests. Remote Sens. Environ. 190, 178–187. doi:10.1016/j.rse.2016.11.021
Ji, S. P., Ren, S. L., Li, Y. R., Dong, Y. J., Wang, L. F., Quan, Q., et al. (2021). Diverse responses of spring phenology to preseason drought and warming under different biomes in the North China Plain. Sci. Total Environ. 706, 144437. doi:10.1016/j.scitotenv.2020.144437
Jiang, Q., Li, W. Y., Fan, Z. D., He, X. G., Sun, W. W., Chen, S., et al. (2021). Evaluation of the ERA5 reanalysis precipitation dataset over Chinese Mainland. J. Hydrology 595, 125660. doi:10.1016/j.jhydrol.2020.125660
Jiao, W. Z., Chang, Q., and Wang, L. Q. (2019). The sensitivity of satellite solar‐induced chlorophyll fluorescence to meteorological drought. Earth's. Future 7, 558–573. doi:10.1029/2018ef001087
Khosravi, I., Haydari, E., Shekoohizadegan, S., and Zareie, S. (2017). Assessment the effect of drought on vegetation in desert area using Landsat data. Egypt. J. Remote Sens. Space Sci. 20, S3–S12. doi:10.1016/j.ejrs.2016.11.007
Kilic, O. M. (2021). Effects of land use and land cover changes on soil erosion in semi-arid regions of Turkey; A case study in Almus lake watershed. Carpath. J. Earth Environ. Sci. 16 (1), 129–138. Tokat Gaziosmanpasa University, Arts and Science Faculty, Department of Geography, Tokat, Turkey. doi:10.26471/cjees/2021/016/161
Lees, T., Tseng, T., Atzberger, C., Reece, S., and Dadson, S. (2022). Deep learning for vegetation health forecasting: A case study in Kenya. Remote Sens. 14 (3), 698. doi:10.3390/rs14030698
Li, J. C., Pang, G. J., Wang, X. J., Liu, F., and Zhang, Y. T. (2022). Spatiotemporal dynamics of land surface albedo and its influencing factors in the Qilian Mountains, Northeastern Tibetan Plateau. Remote Sens. 14 (8), 1922. doi:10.3390/rs14081922
Li, X., and Xiao, J. F. (2019). A global 0.05-degree product of solar-induced chlorophyll fluorescence derived from OCO-2, MODIS, and Reanalysis Data. Remote Sens. 11 (5), 517. doi:10.3390/rs11050517
Li, Y., Ma, B. S., and Yang, X. (2019). Impact of two types of ENSO events on the extreme precipitation in Eastern China. Resour. Environ. Yangtze Basin 28 (2), 469–482. (in Chinese). doi:10.11870/cjlyzyyhj201902023
Liu, L. Y., Yang, X. Q., Gong, F. X., Su, Y. X., Huang, G. Q., Chen, X. Z., et al. (2021). The novel microwave temperature vegetation drought index (MTVDI) captures canopy seasonality across Amazonian tropical evergreen forests. Remote Sens. 13 (3), 339. doi:10.3390/rs13030339
Liu, L. Z., Zhao, W. H., Wu, J. J., Liu, S. S., Teng, Y. G., Yang, J. H., et al. (2019). The impacts of growth and environmental parameters on solar-induced chlorophyll fluorescence at seasonal and diurnal scales. Remote Sens. 11, 2002. doi:10.3390/rs11172002
Ma, Y., Liu, L. Y., Chen, R. N., Du, S. S., and Liu, X. J. (2020). Generation of a global spatially continuous TanSat solar-induced chlorophyll fluorescence product by considering the impact of the solar radiation intensity. Remote Sens. 12, 2167. doi:10.3390/rs12132167
McDowell, N., Pockman, W. T., Allen, C. D., Breshears, D. D., Cobb, N., Kolb, T., et al. (2008). Mechanisms of plant survival and mortality during drought: Why do some plants survive while others succumb to drought? New Phytol. 178, 719–739. doi:10.1111/j.1469-8137.2008.02436.x
McKee, T. B., Doesken, N. J., and Kleist, J. (1993). “The relationship of drought frequency and duration to time scales. No. 22,” in Proceedings of the 8th Conference on Applied Climatology (Boston, MA: American Meteorological Society), 179–183.
Papagiannopoulou, C., Miralles, D. G., Dorigo, W. A., Verhoest, N. E. C., Depoorter, M., Waegeman, W., et al. (2017). Vegetation anomalies caused by antecedent precipitation in most of the world. Environ. Res. Lett. 12 (7), 074016. doi:10.1088/1748-9326/aa7145
Patel, N. R., Chopra, P., and Dadhwal, V. K. (2007). Analyzing spatial patterns of meteorological drought using standardized precipitation index. Met. Apps. 14 (4), 329–336. doi:10.1002/met.33
Peel, M. C. (2009). Hydrology: Catchment vegetation and runoff. Prog. Phys. Geogr. Earth Environ. 33 (6), 837–844. doi:10.1177/0309133309350122
Rahmat, S. N., Jayasuriya, N., and Bhuiyan, M. (2015). Assessing droughts using meteorological drought indices in Victoria, Australia. Hydrology Res. 46 (3), 463–476. doi:10.2166/nh.2014.105
Ribeiro, A. F. S., Russo, A., Gouveia, C. M., and Pascoa, P. (2019). Modelling drought-related yield losses in Iberia using remote sensing and multiscalar indices. Theor. Appl. Climatol. 136 (1-2), 203–220. doi:10.1007/s00704-018-2478-5
Shahabfar, A., and Eitzinger, J. (2013). Spatio-temporal analysis of droughts in semi-arid regions by using meteorological drought indices. Atmosphere 4 (2), 94–112. doi:10.3390/atmos4020094
Shi, B., Jiang, J. P., Sivakumar, B., Zheng, Y., and Wang, P. (2018). Quantitative design of emergency monitoring network for river chemical spills based on discrete entropy theory. Water Res. 134, 140–152. doi:10.1016/j.watres.2018.01.057
Shi, H. Y., Chen, J., Wang, K. Y., and Niu, J. (2018). A new method and a new index for identifying socioeconomic drought events under climate change: A case study of the east river Basin in China. Sci. Total Environ. 616-617, 363–375. doi:10.1016/j.scitotenv.2017.10.321
Shi, H. Y., Zhao, Y. Y., Liu, S. N., Cai, H. J., and Zhou, Z. Q. (2022). A new perspective on drought propagation: Causality. Geophys. Res. Lett. 49, e2021GL096758. doi:10.1029/2021gl096758
Sohrabi, M. M., Ryu, J. H., Abatzoglou, J., and Tracy, J. (2015). Development of soil moisture drought index to characterize droughts. J. Hydrol. Eng. 20 (11), 04015025. doi:10.1061/(asce)he.1943-5584.0001213
Tania, F., and Irma, T. (2020). Rainfall interception based on indirect methods: A case study in temperate forests in oaxaca, Mexico. J. Am. Water Resour. Assoc. 56 (4), 712–723. doi:10.1111/1752-1688.12844
Wang, B., Zhang, G. H., Shi, Y. Y., and Zhang, X. C. (2014). Soil detachment by overland flow under different vegetation restoration models in the Loess Plateau of China. Catena 116, 51–59. doi:10.1016/j.catena.2013.12.010
Wang, S. H., Huang, C. P., Zhang, L. F., Lin, Y., Cen, Y., Wu, T. X., et al. (2016). Monitoring and assessing the 2012 drought in the great plains: Analyzing satellite-retrieved solar-induced chlorophyll fluorescence, drought indices, and gross primary production. Remote Sens. 8 (2), 61. doi:10.3390/rs8020061
Wang, T., Tu, X. J., Singh, V. P., Chen, X. H., and Lin, K. R. (2021). Global data assessment and analysis of drought characteristics based on CMIP6. J. Hydrology 596, 126091. doi:10.1016/j.jhydrol.2021.126091
Wang, Y. Q., Yang, J., Chen, Y. N., Maeyer, P. D., Li, Z., Duan, W. L., et al. (2018). Detecting the causal effect of soil moisture on precipitation using convergent cross mapping. Sci. Rep. 8, 12171. doi:10.1038/s41598-018-30669-2
Wei, X. T., Huang, Q., Huang, S. Z., Leng, G. Y., Qu, Y. P., Deng, M. J., et al. (2022). Assessing the feedback relationship between vegetation and soil moisture over the Loess Plateau, China. Ecol. Indic. 134, 108493. doi:10.1016/j.ecolind.2021.108493
Wu, J. P., Liu, L. Y., Sun, C. H., Su, Y. X., Wang, C. J., Yang, J., et al. (2019). Estimating rainfall interception of vegetation canopy from MODIS imageries in Southern China. Remote Sens. 11 (21), 2468. doi:10.3390/rs11212468
Wu, J. P., Su, Y., Chen, X., Liu, L., Yang, X., Gong, F., et al. (2021). Leaf shedding of Pan-Asian tropical evergreen forests depends on the synchrony of seasonal variations of rainfall and incoming solar radiation. Agric. For. Meteorology 311, 108691. doi:10.1016/j.agrformet.2021.108691
Xie, X. Y., Li, A. N., Tan, J. B., Lei, G. B., and Zhang, Z. J. (2020). Uncertainty analysis of multiple global GPP datasets in characterizing the lagged effect of drought on photosynthesis. Ecol. Indic. 113, 106224. doi:10.1016/j.ecolind.2020.106224
Xie, Y. W., Li, J., Chen, W. R., and Luo, S. H. (2016). Spatio-temporal variation of average temperature over the Pearl River basin during 1959-2013. ACTA Sci. Nat. Univ. SunYatseni 55 (3), 31–38.
Xin, Y., Lu, N., Jiang, H., Liu, Y. X. Y., and Yao, L. (2021). Performance of ERA5 reanalysis precipitation products in the Guangdong-Hong Kong-Macao greater Bay Area, China. J. Hydrology 602, 126791. doi:10.1016/j.jhydrol.2021.126791
Xu, H. J., Wang, X. P., and Zhao, C. Y. (2021). Drought sensitivity of vegetation photosynthesis along the aridity gradient in northern China. Int. J. Appl. Earth Observation Geoinformation 102, 102418. doi:10.1016/j.jag.2021.102418
Xu, H. J., Wang, X. P., Zhao, C. Y., and Yang, X. M. (2020). Assessing the response of vegetation photosynthesis to meteorological drought across northern China. Land Degrad. Dev. 32 (1), 20–34. doi:10.1002/ldr.3701
Xu, J. T., Ma, Z. Q., Yan, S. K., and Peng, J. (2022). Do ERA5 and ERA5-land precipitation estimates outperform satellite-based precipitation products? A comprehensive comparison between state-of-the-art model-based and satellite-based precipitation products over mainland China. J. Hydrology 605, 127353. doi:10.1016/j.jhydrol.2021.127353
Yang, Z., Shen, Y. Y., Li, J., Jiang, H. W., and Zhao, L. K. (2022). Unsupervised monitoring of vegetation in a surface coal mining region based on NDVI time series. Environ. Sci. Pollut. Res. 29 (18), 26539–26548. doi:10.1007/s11356-021-17696-9
Yeh, S. W., Kug, J. S., Dewitte, B., Kwon, M. H., and Jin, F. F. (2014). El Niño in a changing climate. Nature 461, 511–514. doi:10.1038/nature08316
Zhang, L. K., Qiu, X. Q., Liu, P. Y., Huang, Q. B., Lan, F. N., Li, H. B., et al. (2015). Estimation of carbon sink fluxes in the Pearl River basin (China) based on a water–rock–gas–organism interaction model. Environ. Earth Sci. 74, 945–952. doi:10.1007/s12665-014-3788-2
Zhang, W., Zhou, T., and Zhang, L. (2017). Wetting and greening Tibetan plateau in early summer in recent decades: Wetting and greening Tibetan plateau. J. Geophys. Res. Atmos. 122 (11), 5808–5822. doi:10.1002/2017jd026468
Zhang, Y. Q., Mao, G. X., Chen, C. C., Shen, L. C., and Xiao, B. Y. (2021). Population exposure to compound droughts and heatwaves in the observations and ERA5 Reanalysis Data in the Gan River Basin, China. Land 10, 1021. doi:10.3390/land10101021
Zhang, Y. W., Deng, L., Yan, W. M., and Shangguan, Z. P. (2016). Interaction of soil water storage dynamics and long-term natural vegetation succession on the Loess Plateau, China. Catena 137, 52–60. doi:10.1016/j.catena.2015.08.016
Zhao, A. Z., Yu, Q. Y., Feng, L. L., Zhang, A. B., and Pei, T. (2020a). Evaluating the cumulative and time-lag effects of drought on grassland vegetation: A case study in the Chinese loess plateau. J. Environ. Manag. 261, 110214. doi:10.1016/j.jenvman.2020.110214
Zhao, J., Huang, S. Z., Huang, Q., Wang, H., Leng, G. Y., Fang, W., et al. (2020b). Time-lagged response of vegetation dynamics to climatic and teleconnection Factors. Catena 189, 104474. doi:10.1016/j.catena.2020.104474
Zhong, S. B., Sun, Z. H., and Di, L. P. (2021). Characteristics of vegetation response to drought in the CONUS based on long-term remote sensing and meteorological data. Ecol. Indic. 127, 107767. doi:10.1016/j.ecolind.2021.107767
Zhou, Q., Chen, W., and Zhou, W. (2013). Solar cycle modulation of the ENSO impact on the winter climate of East Asia. J. Geophys. Res. Atmos. 118, 5111–5119. doi:10.1002/jgrd.50453
Zhou, Y. L., and Zhou, P. (2021). Decline in net primary productivity caused by severe droughts: Evidence from the Pearl River basin in China. Hydrology Res. 52 (6), 1559–1576. doi:10.2166/nh.2021.061
Zhou, Z. Q., Ding, Y. B., Shi, H. Y., Cai, H. J., Fu, Q., Liu, S. N., et al. (2020b). Analysis and prediction of vegetation dynamic changes in China: Past, present and future. Ecol. Indic. 117, 106642. doi:10.1016/j.ecolind.2020.106642
Zhou, Z. Q., Liu, S. N., Ding, Y. B., Fu, Q., Wang, Y., Cai, H. J., et al. (2022). Assessing the responses of vegetation to meteorological drought and its influencing factors with partial wavelet coherence analysis. J. Environ. Manag. 311, 114879. doi:10.1016/j.jenvman.2022.114879
Zhou, Z. Q., Shi, H. Y., Fu, Q., Ding, Y. B., Li, T. X., Liu, S. N., et al. (2021b). Investigating the propagation from meteorological to hydrological drought by introducing the nonlinear dependence with directed information transfer index. Water Resour. Res. 57, e2021WR030028. doi:10.1029/2021wr030028
Zhou, Z. Q., Shi, H. Y., Fu, Q., Ding, Y. B., Li, T. X., Wang, Y., et al. (2021a). Characteristics of propagation from meteorological drought to hydrological drought in the Pearl River Basin. JGR. Atmos. 126, e2020JD033959. doi:10.1029/2020jd033959
Keywords: meteorological drought, normalized difference vegetation index, solar-induced chlorophyll fluorescence, vegetation response time, linear, nonlinear
Citation: Zhou Z, Ding Y, Fu Q, Wang C, Wang Y, Cai H, Liu S and Shi H (2022) Comprehensive evaluation of vegetation responses to meteorological drought from both linear and nonlinear perspectives. Front. Earth Sci. 10:953805. doi: 10.3389/feart.2022.953805
Received: 26 May 2022; Accepted: 11 July 2022;
Published: 11 August 2022.
Edited by:
Qiang Liu, Beijing Normal University, ChinaReviewed by:
Pengnian Huang, Nanjing University of Information Science and Technology, ChinaBaoqing Zhang, Lanzhou University, China
Copyright © 2022 Zhou, Ding, Fu, Wang, Wang, Cai, Liu and Shi. This is an open-access article distributed under the terms of the Creative Commons Attribution License (CC BY). The use, distribution or reproduction in other forums is permitted, provided the original author(s) and the copyright owner(s) are credited and that the original publication in this journal is cited, in accordance with accepted academic practice. No use, distribution or reproduction is permitted which does not comply with these terms.
*Correspondence: Haiyun Shi, shihy@sustech.edu.cn