Analogical model tests on repeated surficial failure of dry granular slopes confined by retaining walls
 Hufeng Yang
 Bencong Xing
 Hu Jiang2
  Qiangong Cheng
- 1Faculty of Geosciences and Environmental Engineering, Southwest Jiaotong University, Chengdu, China
- 2Kunming Survey, Design and Research Institute Co, Ltd of CREEC, Kunming, China
In alpine and gorge regions, surficial failure of granular slopes has seriously affected infrastructure construction and the safe operation of transportation networks. This research focuses on dry granular slopes confined by retaining walls. Repeated surficial failure of granular slopes has been explored through indoor physical model tests. The results show that surficial failure presents low frequency and large scale for granular slopes dominated by coarse particles. The mass of debris that crosses retaining walls indicates activity level of granular slopes. When this mass for each surficial failure gradually decreases, it is highly likely that large-scale surficial failure will occur. As the amount of debris deposited on the slope increases, it is probable that the debris mass falling during a massive sliding event will be many times that of the previous sliding event. In engineering practice, it is necessary during road cleaning processes to record the volume of debris accumulated on the road. A continuous increase in the slope angle indicates a high probability of large-scale surficial failure. For each granular slope with a unique particle composition, there is a critical change rate for early warning of surficial failure, which can be determined by long-term monitoring.
Introduction
Granular slopes are widespread in dry-hot valleys, high altitude environments, high latitude regions, and high seismic activity zones (Gerber and Scheidegger, 1974; Statham, 1976; Curry and Morris, 2004; Pudasaini and Hutter, 2007; Sass and Krautblatter, 2007; Davies and McSaveney, 2009; Otto et al., 2009; Takagi et al., 2011; Luckman, 2013; Ye et al., 2019; de Sanjosé-Blasco et al., 2020; Xue et al., 2021). In a natural granular slope, with continual debris supply from the source area, volume of the granular slope will continue to increase during the extension phase (Figure 1). When debris accumulation reaches the source area, the slope is in the consolidation-and-stabilization phase (Figure 1A). In contrast to the natural granular slope, granular slope evolution leads to repeated surficial failure, due to the slope toe being confined by a retaining wall (Figure 1B). Generally, the mass of a single surficial failure is not very large. However, repeated surficial failure threatens construction and operation of roads and railways (Luo et al., 2018; Xing and Wang, 2019).
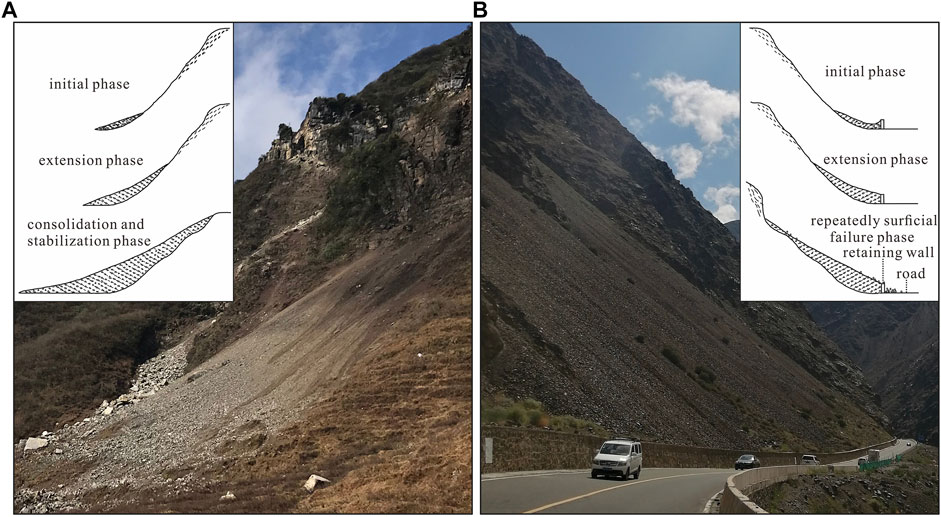
FIGURE 1. Natural granular slope (A) and granular slope confined by the retaining wall (B).
Generally, the granular slope remains mostly stable with the natural angle of repose (Curry and Morris, 2004; Bu et al., 2016; Zheng et al., 2019). The angle of repose is a key parameter for describing the motion state of granular systems and can be used as the boundary angle to distinguish the dynamic and static transformations of granular systems (Carson, 1977; Mehta and Barker, 1994; Liu et al., 2005). Surficial failure occurs when the slope angle of granular material accumulation is greater than the angle of repose (Kleinhans et al., 2011; Beakawi Al-Hashemi and Baghabra Al-Amoudi, 2018).
A model test is the main research method for studies on the process of granular slope failure (De Blasio and Sӕter, 2009; Chen et al., 2011; Takagi et al., 2011). Generally, model test research on granular slopes does not conform to a strict geometric similarity with the prototype of slope in the field. However, an analogical model test is appropriate for the study of the evolution and failure process of granular slopes (De Blasio and Sæter, 2015). Most of the physical tests carried out in laboratories are simplified scale simulations, so the real failure characteristics cannot be reflected in terms of volume (Iverson et al., 2011; Bryant et al., 2015; Kesseler et al., 2018). However, the model test results can establish a close relationship between the experimental scale and realistic disaster behavior characteristics. According to the failure process emerging from analogical model tests, many failure models were proposed, such as retrogressive failure, progressive failure, and translational failure (Que et al., 2003; Wang et al., 2007; Zhang et al., 2008). Some failure models were proposed after considering inducing factors. These include the progressive supply-induced failure model, slope excavation-induced failure model, rockfall impact-induced failure model, and surface erosion-induced failure model (Zhang and Shu, 2017).
Activity level and surficial failure scale of granular slopes are the main factors in geo-disaster susceptibility and risk assessment. Therefore, this research focuses on granular slope confined by retaining walls. Based on the simulation of continuous debris supply from the source area as the result of physical weathering, accumulation processes of granular slopes were explored through indoor physical model tests. Repeated surficial failures of granular slopes composed of different particles were compared and analyzed to determine risk assessment and early warning ability for active granular slopes.
Model tests
Equipment design
The model test equipment was designed based on the general accumulation phases of granular slopes confined by retaining walls (Figure 1B), and followed previous model tests for granular slopes (De Blasio and Sæter, 2009; Takagi et al., 2011; He et al., 2012). The equipment included the following: debris supply hopper, inclined flume, horizontal flume, and debris collection plate (Figure 2). The debris supply hopper is designed to simulate the debris supply from the source area. A debris collection plate is used to collect debris across the retaining wall during surficial failure. The length of the horizontal flume and the height of the retaining wall are adjustable, in order to obtain different volumes of granular slopes. Based on the general geological model of granular slopes confined by a retaining wall in the field (Figure 1), a slope scale was designed with a 5-cm high retaining wall and a 20-cm long horizontal flume (Figure 2B).
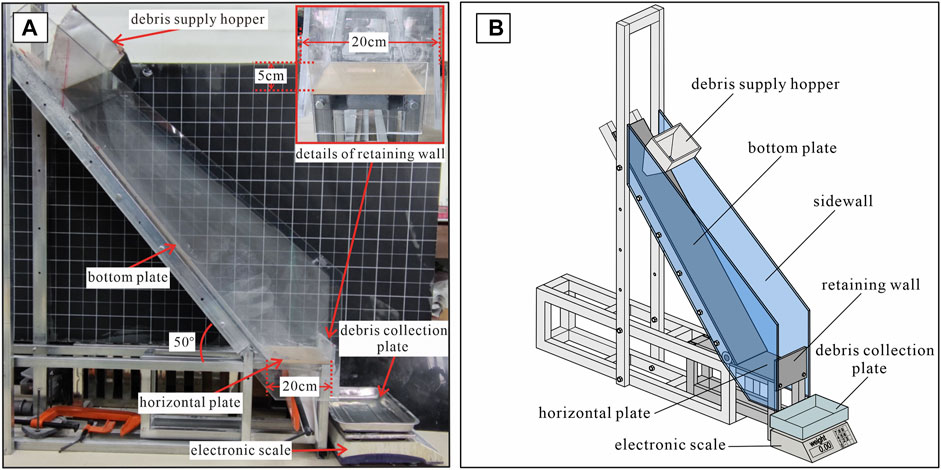
FIGURE 2. Model test equipment (A) photograph; (B) schematic diagram.
Granular material
For preparation of the granular material for model tests, previous studies attempted to collect original granular material from the field to simulate the actual granular slope by conducting large-scale model tests (Wang et al., 2007; Zhang et al., 2008; He et al., 2012). However, a limited amount of granular materials cannot adequately replicate characteristics of the entire slope in the field. The process of rock weathering involves fractal dynamics. The defect structure of rock presents fractal characteristics (Bagde et al., 2002; Tu et al., 2005; Crosta et al., 2007). The evolution of rock fragmentation and weathering is essentially a fractal development process of rock damage and fragmentation. Therefore, fractal dimensions can be used to characterize the degree of rock damage and fracture (Tu et al., 2005). In the field, granules always present fractal features as weathering products from the source area of the granular slope (He et al., 2012). Therefore, in this research, the grain composition of the granule material used for the model test is based on the characteristics of the fractal self-similarity law.
Based on the mass-frequency fractal analysis of granular materials, the empirical relationship between grain size and frequency obeys the Weibull distribution (Turcotte, 1986) as shown in Eq. 1.
where m (<r) is mass of grain size<r, mt is the total mass of granules, δ is a constant related to the mean size of grain, and n is an exponential constant.
Based on the description of δ by maximum limit particle size rl, Tyler and Wheatcraft (1992) obtained the relation between m and r, with the introduction of fractal dimension (D).
With the same density of the granule, the m (<r) can be calculated under different fractal dimensions (D) as shown below:
Usually, the fractal dimension of granules for landslides or granular slopes is between 0 and 3. For example, Crosta et al. (2007) described the fractal dimension as between 1.3 and 3.2. He et al. (2012) observed that the fractal dimension of granular slopes is between 2 and 3 in Wenchuan County, Sichuan Provence, China. Therefore, model tests in this study focused on four values of fractal dimensions: D =1.5, 1.9, 2.3 and 2.7.
Quartz sand was selected for the granular material of the model test for the following reasons: (1) The irregular shape of calcium sand produced by mechanical crushing is generally similar to debris resulting from physical weathering. (2) Physical properties of calcium sand, such as density and natural angle of repose, are similar to debris originating from calcareous sandstone and granite in the field. According to the size of slope model, there are six kinds of grain size: <0.25 mm, 0.25–0.5 mm, 0.5–1 mm, 1–2 mm, 2–5 mm, and 5–7 mm (Figure 3).
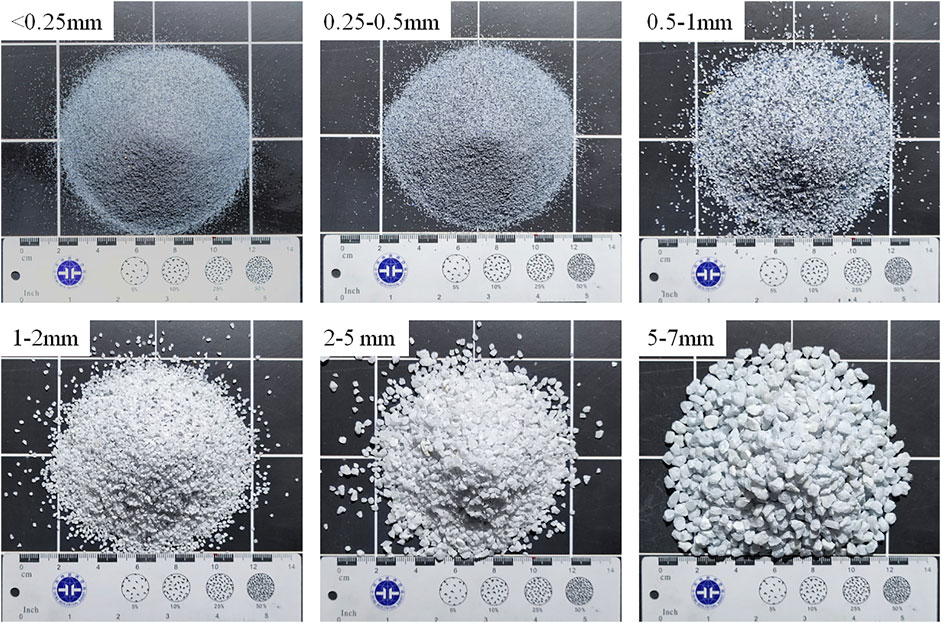
FIGURE 3. Different grain sizes of granular materials.
For the preparation of granular material with different fractal dimensions, the grain mass of each grain size (<0.25 mm, 0.25–0.5 mm, 0.5–1 mm, 1–2 mm, 2–5 mm, and 5–7 mm) was calculated according to Eq. 3. Table 1 shows the mass of each grain size per 40 kg of granular material with different fractal dimensions. The grain size distribution curves of the different fractal dimensions are shown in Figure 4. The fractal dimension represents the power law relationship between number-size and mass-size in granular systems (Bak et al., 1987, 1988; Tyler and Wheatcraft, 1992). A small fractal dimension means a high coarse particle size content and a low fine particle content in the system. On the other hand, when the fractal dimension is large, the content of coarse particles is low, and that of fine particles is high. Fundamentally, the fractal dimension controls the degree of self-similarity of the system through particle size. The purpose for this element of material preparation is to apply the new findings to the granular slope with similar fractal features.
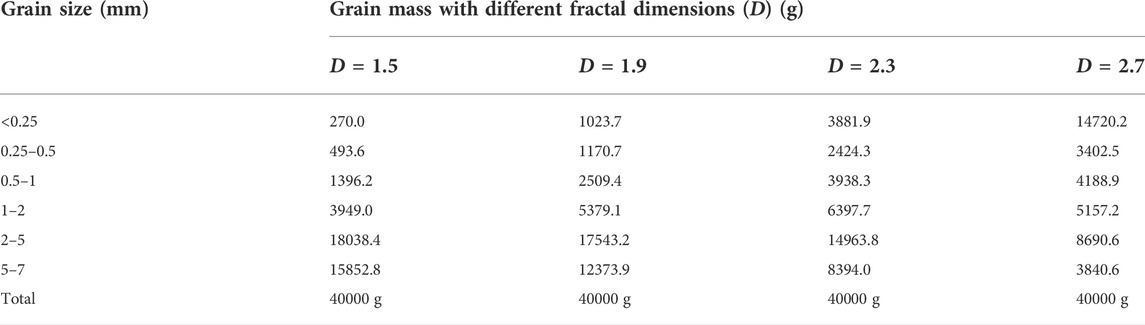
TABLE 1. Grain mass of each grain size with different fractal dimensions.
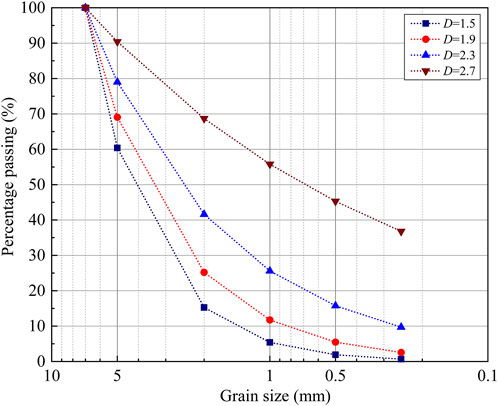
FIGURE 4. Grain size distribution curve of different fractal dimensions.
Test procedure
This study focuses on the surficial failure of dry granular slopes with different fractal dimensions. First, the model test equipment was fixed as the design of the slope scale (Figure 2A). Then, fully blended grains with designed fractal dimensions (D) were supplied through a hopper at the top of the slope to simulate debris supply by rock weathering at the source area. Debris accumulated at the toe of the inclined flume, and then the space behind the retaining wall was filled with granules. With a continuous supply of debris, the granular slope will extend upward until the slope angle reaches the natural angle of repose (Figure 5). The purpose of the accumulation process was to simulate the formation of a granular slope in the field.
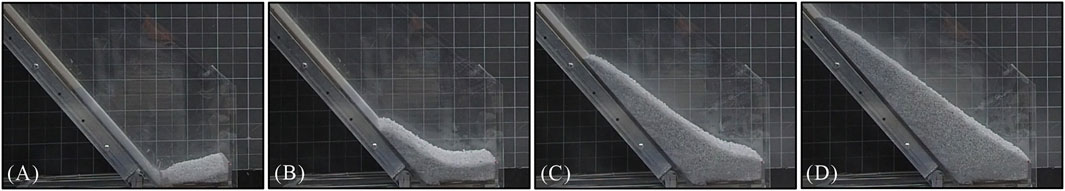
FIGURE 5. Development processes of a granular slope confined by a retaining wall (A) debris accumulation behind the wall; (B) debris accumulation on the slope; (C) granular slope extension; (D) critical slope angle.
The granular slope will be in a critical state when the slope angle reaches the natural angle of repose. The continuous supply of granules triggered surficial failure. The first obvious surficial failure was defined as the initial state for model tests. Then, the mass of the debris supply was measured during continuous debris supply through the hopper. Surficial failure was recorded using a camera.
To compare the geometric features of granular slopes before and after surficial failure, the 3D slope surface was built based on the oblique photogrammetry method for representative model tests of four types of slope grain composition (D = 1.5, 1.9, 2.3, and 2.7). First, photographs of slope surface from multiple orientations were taken with a single CCD camera. Then, these photos were imported into the automatic 3D photogrammetry software ContextCapture 4.0 for aerial triangulation to reconstruct the 3D topography of the slope surface. Various data formats, such as digital surface models (DSMs) and 3D point clouds, were generated from the reconstructed 3D models, allowing the acquisition of surface morphologies, isopach maps, and geometric parameters (Li et al., 2021). With its high resolution at the subpixel level, the accuracy of this method in all tests was within 2 mm. Debris running over the retaining wall was collected during each surficial failure using a pallet placed on an electronic scale. The mass of the granular material was recorded at the end of the surficial failure when the reading was stable. The measurements and observations were repeated more than 60 times in order to reveal the general features of repeated surficial failure of the granular slope. It is important to emphasize that the measurements and observations were repeated more than 90 times for the granular slope with D = 1.5, due to the longer interval period of large-scale surficial failure.
Results
Features of surficial failure
Figure 6 shows the 3D slope surface was built based on the oblique photogrammetry method for representative model tests of four kinds of slope grain composition (D = 1.5, 1.9, 2.3, and 2.7). For the granular slopes with a small fractal dimension (D = 1.5 and 1.9), most of the remaining debris accumulated at the upper part of the slope. In contrast, the spatial distribution of grains was relatively uniform on the entire slope surface for the granular slopes with large fractal dimensions (D = 2.3 and 2.7) (Figure 7). The locations of the longitudinal sections (A-A’) are presented in Figure 6. The continuous increase of top load for the granular slopes with small fractal dimensions (D = 1.5 and 1.9) induced sudden surficial failure. The translational failure is more general for granular slopes with large fractal dimensions (D = 2.3 and 2.7).
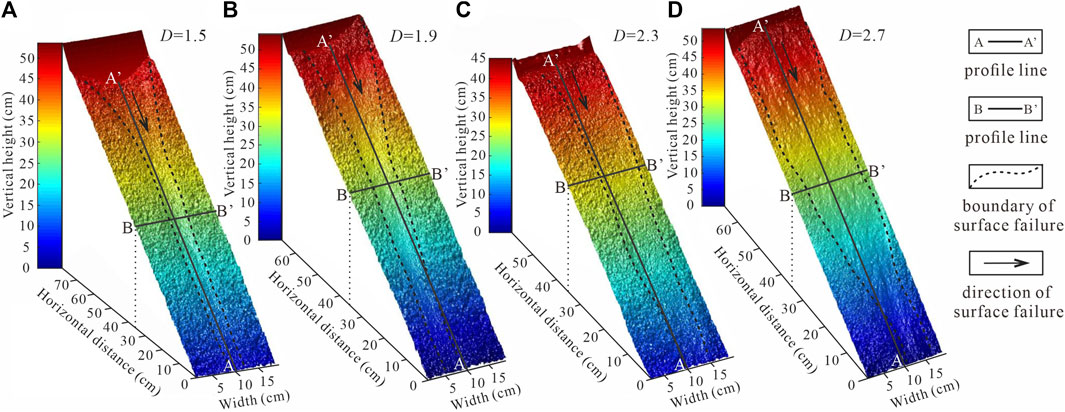
FIGURE 6. Surficial failure of granular slopes with different fractal dimensions (A) D = 1.5; (B) D = 1.9; (C) D =2.3; (D) D = 2.7.
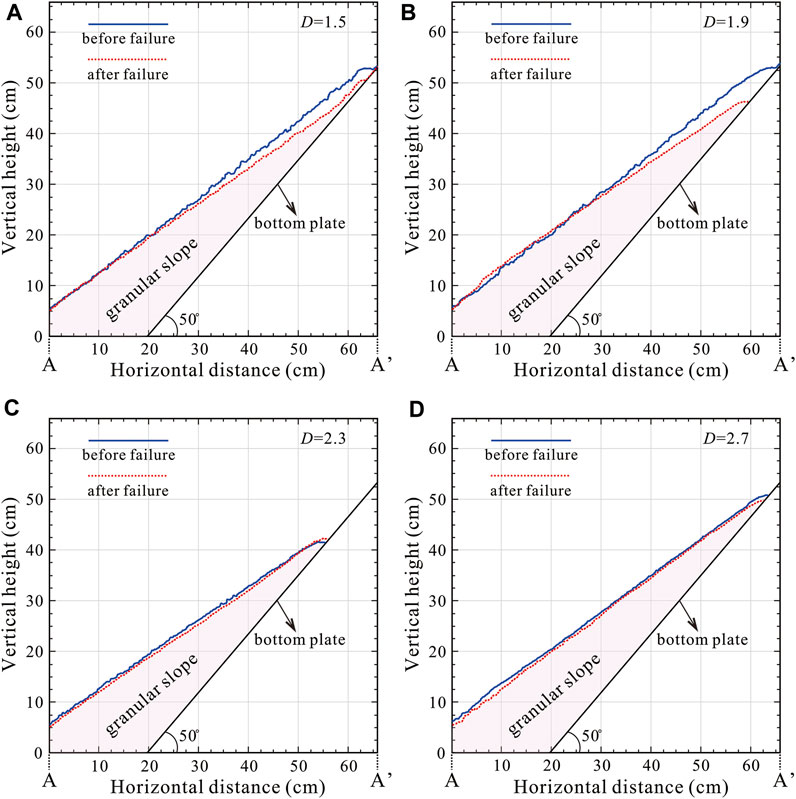
FIGURE 7. Longitudinal sections for granular slopes with different fractal dimensions before and after surficial failure (A) D = 1.5; (B) D = 1.9; (C) D =2.3; (D) D = 2.7.
After the sudden occurrence of surficial failure, sliding channels appeared on the slope surface for the granular slopes with small fractal dimensions (D = 1.5 and 1.9) (Figure 6). The morphological characteristic of channels presented as funnel shapes with wide tops and narrow bottoms. The width of the channel also increased gradually with an increase in fractal dimension. The surficial failure of granular slopes with large fractal dimensions (D = 2.3 and 2.7) resulted in a shallow sliding of the entire slope surface. Figure 8 shows the transverse sections (B-B’) for granular slopes with different fractal dimensions, which were located at a horizontal distance of 35 cm behind the retaining wall. Generally, the roughness of the granular slope decreases with an increase in fractal dimension. This result is related to the proportion of fine particles. Since fine particles are the main part of the granular slope with large fractal dimensions, they can fill and level the jagged surface to reduce roughness.
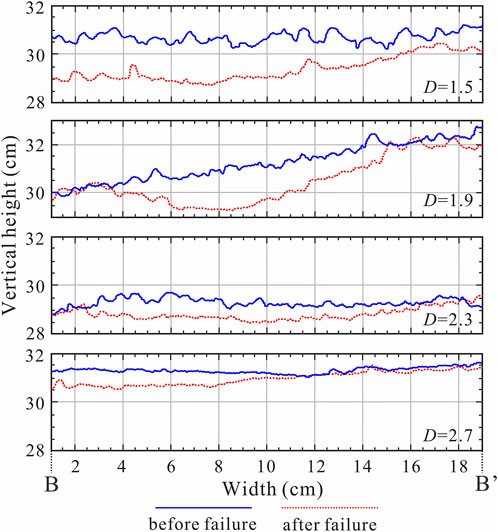
FIGURE 8. Transverse sections for granular slopes with different fractal dimensions before and after surficial failure.
The roughness of the channel bottom significantly decreased after surficial failure (Figure 8). Therefore, debris supplied for the source area easily slid downward along the channel. In the beginning, the slope was without accumulation ability. During the channel flow of grains, the width and depth of the channel continued to increase due to lateral and vertical erosion. Finally, granular flow fingering appeared on the slope surface, due to its low roughness. In this phase, more and more debris accumulated on the slope surface, resulting in changes in slope topography. Surficial failure of the granular slope was the result of the evolution process of slopes, with continuous accumulation of debris on the slope surface. When the slope angle reached the repose of the angle, the slope reached a critical state. In that condition, even a small amount of continuous debris accumulation will trigger surficial failure. Numerous particles flowed downward and the slope angle decreased by 1–3°.
Surficial failure mass
Surficial failure of the granular slope will suddenly occur with continuous debris supply from the source area. Figure 9 shows the mass of the surficial failure of granular slopes with different fractal dimensions. The horizontal axis indicates the sequence of surficial failures. Each number presents one obvious surficial failure during an entire test process. The vertical axis indicates the mass of grains that crossed the retaining wall during surficial failure. Material sliding during surficial failure of the granular slope leads to different areas of collapse, which can be expressed by scale or area, both of which are related to the mass of surficial failure. Large scale, or large area, usually corresponds to a greater mass of surficial failure. In Figure 9, peak values represent relatively large-scale surficial failures of the granular slope. Meanwhile, low values at the bottom of the curve represent the small-scale surficial failures. Therefore, repeated surficial failures can be observed based on fluctuation of the curve.
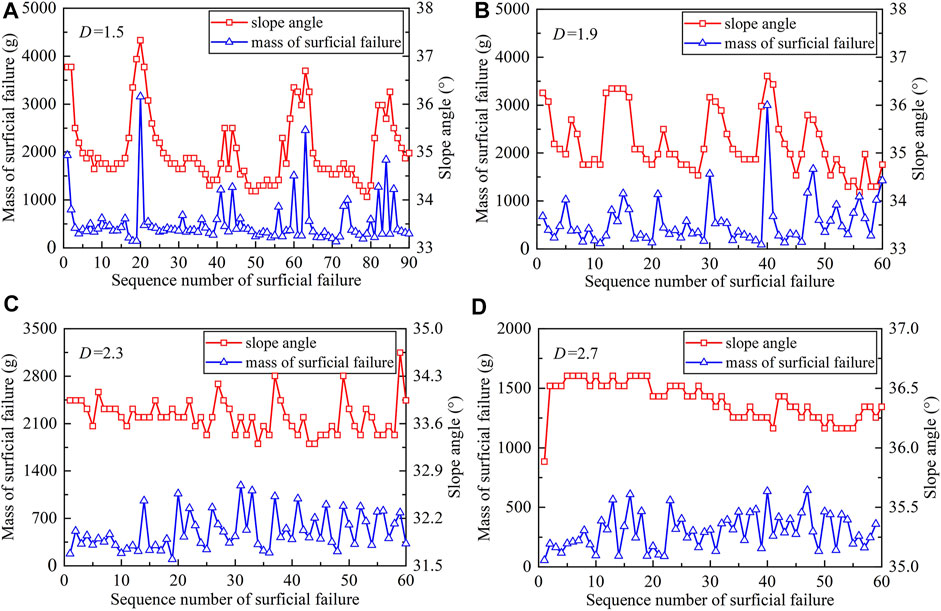
FIGURE 9. Mass of surficial failure and fluctuation of the slope angle for granular slopes with different fractal dimensions (A) D = 1.5; (B) D = 1.9; (C) D =2.3; (D) D = 2.7.
For the granular slope with D = 1.5, there were several large-scale surficial failures. The maximum mass of surficial failure reached 3150 g. After a large-scale surficial failure, the granular slope is mainly dominated by a small-scale surficial failure. Small-scale surficial failure occurs approximately 20 times between two occurrences of relatively large-scale surficial failure.
For the granular slope with D = 1.9, the frequency of relatively large-scale surficial failures increased compared with the granular slope with D = 1.5. However, the peak values were smaller; that is, the sliding scale of surficial failure became smaller. Small-scale surficial failure occurred approximately 10 times between two incidents of relatively large-scale surficial failure.
For granular slopes with D = 2.3 and 2.7, the frequency of surficial failures demonstrably increased compared with the granular slopes with D = 1.5 and 1.9. Granular slopes were mainly dominated by small-scale surficial failures (peak values were less than 1260 and 630 g, respectively).
Slope angle
Fluctuation of the slope angle of granular slopes with different fractal dimensions is shown in Figure 9. For the granular slopes with D = 1.5 and 1.9, the fluctuation of the slope angle is consistent with the mass of surficial failure. The slope angle continuously increased before the occurrence of large-scale surficial failure. After surficial failure, the slope angle became smaller. When the slope angle began to increase again, it indicated that the next large-scale slope failure would occur soon. The fluctuation range of the granular slope with D = 1.5 was larger than the slope with D = 1.9. The fluctuation ranges of the slope angle were 3.3° and 2.1°, respectively.
However, for the granular slopes with D = 2.3 and 2.7, the fluctuation of the slope angle did not consistently correspond to the mass of surficial failure. The fluctuation range of the slope angle was significantly less than the granular slopes with small fractal dimensions. The fluctuation ranges of the slope angle for granular slopes with D = 2.3 and 2.7 were 1.3° and 0.7°, respectively.
Mass accumulation
The mass of accumulation is defined as the mass of the debris supply minus the mass of surficial failure, that is, the net mass of debris accumulation on the slope surface. When the mass of accumulation is a positive value, it means that more granules deposit on the slope surface; that is, the total volume of granular slope increases. Conversely, a negative value means that more granules cross over the retaining wall, that is, the total volume of the granular slope decreases.
When the mass of accumulation becomes a negative value, the value is less than –100 g, and it is defined as one occurrence of surficial failure. For the granular slope with D = 1.5, a relatively large-scale surficial failure occurred five times out of 90 total surficial failures. The interval mass of grain supply between these five times of relatively large-scale surficial failure was 10247.5, 10143.5, 10801.5, and 11232.5 g, respectively. For the granular slope with D = 1.9, relatively large-scale surficial failure occurred seven times during 60 total surficial failures. The interval mass of grain supply for these seven times of relatively large-scale surficial failure were 2278.0, 5111.0, 2688.5, 5146.5, 4853.0, 4288.5, and 7292.5 g, respectively. For the granular slopes with D = 2.3 and 2.7, the interval mass of grain supply was significantly reduced. Generally, the interval mass of the grain supply decreased with the increase of fractal dimensions (Figure 10). This indicates that the capacity of grain accumulation for the granular slope with a large fractal dimension is limited, resulting in a high frequency of small-volume surficial failure.
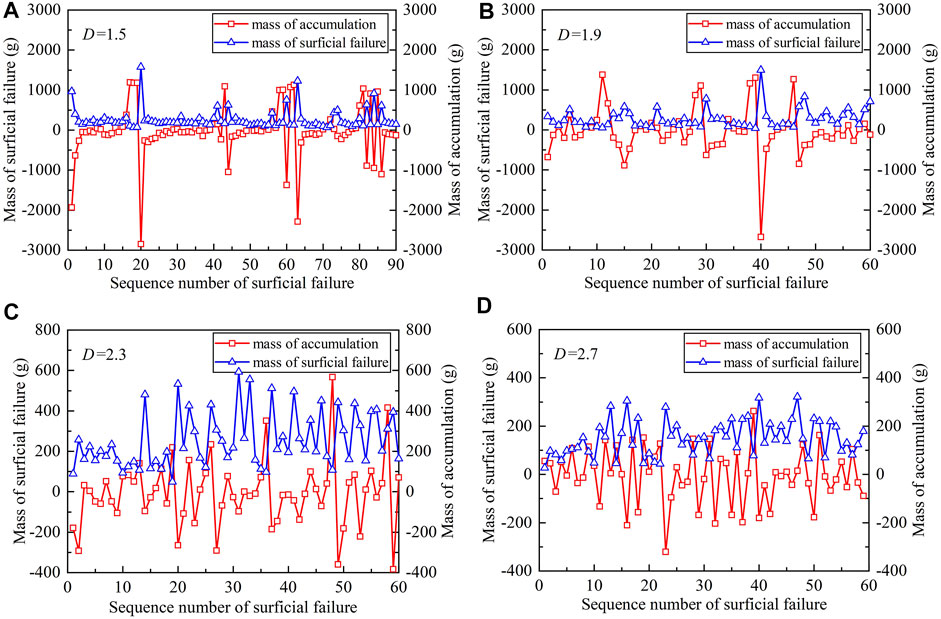
FIGURE 10. Mass of accumulation and surficial failure for granular slopes with different fractal dimensions (A) D = 1.5; (B) D = 1.9; (C) D =2.3; (D) D = 2.7.
Discussion
Correlation between particle size and surficial failure mass
The cumulative distribution probability of a mass of surficial failure presents the variation of debris mass during surficial failure and the probability of surficial failure for various granular slope debris compositions (Figure 11). The minimum mass in surficial failure was about 100 g for four kinds of granular slopes (D = 1.5, 1.9, 2.3, and 2.7). As seen, the difference in debris composition did not affect the debris mass of small-scale surficial failure. However, the maximum debris mass of surficial failure decreased from 3155.3 to 643.4 g, which was negatively correlated with the increase in fractal dimension. In addition, when slope fractal dimension D is 1.5, 1.9, 2.3, and 2.7, the mass range of surficial failure was 3020.1, 2903.2, 1088.1, and 588.0 g, respectively. The fractal dimension obviously controls the dispersion degree of slip failure. With the increase in slope fractal dimension, the dispersion degree of slip mass decreased significantly, and the probability of a mass collapse event also decreased.
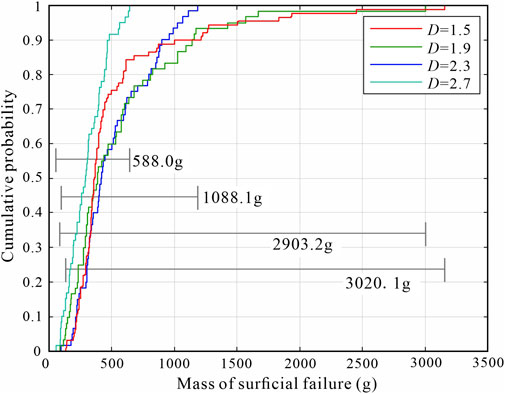
FIGURE 11. Cumulative distribution probability of the mass of surficial failure.
Energy is transferred and consumed by friction and collision between granular particles (Drake, 1990; Campbell, 2006; Forterre and Pouliquen, 2008). Surficial failure is the accumulation and release process of particles on the slope surface. Therefore, based on the change in particle size, the reason for the difference in surficial failure mass can be explained from the perspective of energy dissipation. Particle size obviously controls particle flow behavior, such as shear rate, flow velocity, and vibration state (Iverson, 1997; Hsu et al., 2014; Dai et al., 2022). In these mode tests, the change in particle size significantly changed the range of transverse failure of the slope body in the sliding process, and the width of the sliding groove expanded laterally with the increase in fine particle content (Figure 6). This shows that particle size is an important factor in determining failure mode. The smaller the particle size, the smaller the vibration of the particles in the vertical direction when flow occurs. In the particle contact process, because the oscillation penetrates fewer particles inside the flow layer, less energy is consumed when moving the same distance, so fine particle flow has higher mobility (Cagnoli and Romano, 2010, 2012; Li et al., 2021). The experimental results are in line with the theoretical explanation. When the slope fractal dimension is large, fine particles dominate the failure mode of the slope body. In this state, particles have better fluidity and higher mobility. The high frequency of surficial failure leads to the slope being unable to accumulate the debris-bearing large mass, resulting in a small mass of surficial failure. With the decrease in fractal dimension, the main composition of the granular slope changes from fine particles to coarse particles. The fluidity and mobility of particles decrease gradually, so that the slope can carry more mass debris, the surficial failure mass range can be continuously expanded, and the probability of mass failure increases.
The reason for the mass difference in surficial failure can also be explained from a mechanics viewpoint. When the fractal dimension D is 1.5, 1.9, 2.3, and 2.7, the corresponding maximum load mass was 3155.3, 2995.5, 1186.4, and 643.4 g, respectively. With the increase in fractal dimension, the maximum debris mass that the slope can carry decreases; that is, the maximum shear strength of the slope decreases gradually with the increase in the composition of fine particles. This means that the increase of fine particles reduces the contact shear behavior between particles, so that the shear strength in the slope decreases with the increase of fractal dimension, resulting in a decrease in the mass range of slippage debris on the slope surface. According to studies by scholars in the field, the shear strength inside particles decreases with the increase in fractal dimension (Lai et al., 2021), which accounts for the difference in slip quality from the variation characteristics of shear strength.
Evaluation of the activity level of granular slopes based on the mass of surficial failure
The accumulation curve is obtained by adding the mass of each surficial failure (Figure 12). Fluctuation in the accumulation curve presents three different characteristics: steady increasing stage, slowdown increasing stage, and sudden increasing stage.
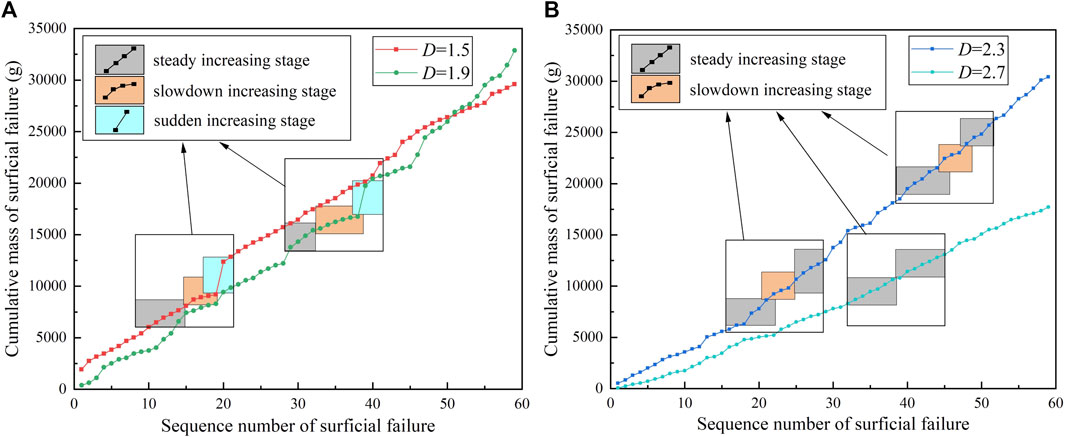
FIGURE 12. Cumulative curve of the mass of surficial failure (A) D = 1.5 and 1.9; (B) D =2.3 and 2.7.
The steady increasing stage presents a similar mass of debris crossing the retaining wall for each surficial failure. The slope of the accumulative curve is basically unchanged. This phenomenon is reflected in the actual slope, as the volume of debris accumulated on the road does not change significantly for each surficial failure.
The slowdown increasing stage shows that debris crossing the retaining wall in each surficial failure gradually decreased, and the slope of the accumulative curve decreased and presented a convex shape. At this stage, the particles on the slope surface have a relative movement trend under the force of gravity, which led the particles to closely occlude. Granular debris aggregated on the slope surface to form an arch bulge. The slope angle exceeded the natural angle of repose. In the process of an arch forming on the slope surface, surficial failure occurred in the non-arch part or part of the arch body due to reaching critical stress. However, the scale of failure and the mass of slippery debris on the slope surface are usually smaller than before because the arching effect bears part of the stress. This indicates that debris was increasingly deposited on the slope surface. Corresponding to the continuous negative process of slip debris in Figure 10, it is also an indication of large-scale surficial failure on the granular slope.
The sudden increasing stage led to a large-scale surficial failure of the granular slope. The accumulative curve is characterized by a sudden increase in debris mass (Figure 12A). In the process of large-scale surficial failure, there will be strong collision and shear between particles, which will increase vertical vibration (Cruden and Hungr, 1986; Chen et al., 2014; Wang et al., 2015). This vibration action also provides space for particle migration. In the vertical direction, slope particles are sorted to form the reverse grain sequence of the accumulation body. After the sliding event, a slippage groove formed by a layer of fine particles can be observed in the middle of the slope surface (Figure 6). Due to the vertical sorting of particles, the fine particles formed in the middle of the slope become the soft surface on the slope, which reduces the shear strength of the slope as a whole and promotes the occurrence of a large-scale sliding phenomenon.
The failure mode of the granular slope dominated by fine particles obviously differs from that of the one dominated by coarse particles. In the failure process, the events in the large-scale surficial failure disappear, the slip weakening stage is gradually shortened, and the slip stage gradually changes from the original three stages to the steady increasing stage (Figure 12B). Symptoms of the destruction phenomenon gradually disappeared, and the slip gradually turned into a high-frequency event.
Therefore, the mass of debris crossing the retaining wall indicates the activity level of the granular slope, especially for one with a small fractal dimension. In engineering practice, recording the volume date of debris accumulated on the road during the road-cleaning process is required. When the mass of debris for each surficial failure gradually decreases, it is highly likely that large-scale surficial failure will occur. As the amount of debris deposited on the slope increases, it is highly likely that the mass of debris falling during massive slides will be many times that of the previous slide.
Evaluation of activity level of granular slopes based on slope angle
Slope angle increases gradually in successive small-scale slides before large-scale surficial failure of the granular slope occurs. After surficial failure, the slope surface is in an unstable, easily disturbable state, and the slope angle gradually decreases. As seen if Figure 9A, slope angle was continuous (Figure 9A). Therefore, the increase in slope angle means that the probability of the next large-scale surficial failure is greater, and the continuous increase in the slope angle indicates that the mass of surficial failure from the slip event is also larger. Here, the variation characteristics of the slope angle behavior can be studied by analyzing the rate of slope angle change, which is defined as the change value of the slope angle in two adjacent slip failure events (Figure 13).
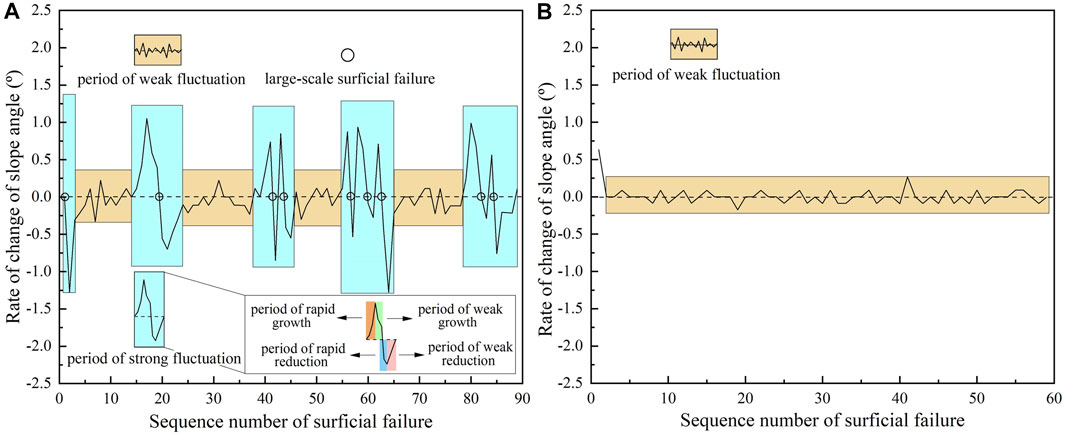
FIGURE 13. Rate of slope angle change (A) D = 1.5; (B) D = 2.7.
When coarse particles dominate the slope surface sliding failure mode, such as fractal dimension D = 1.5, the rate of slope angle change has obvious periodicity, showing the alternating characteristics of weak and strong fluctuation periods (Figure 13A). In the weak fluctuation period, the rate of slope angle change fluctuated slightly up and down around zero, slope was relatively stable, the scale of surface slides was small, and there was not significantly different in debris quality each time. The strong fluctuation period was composed of single or multiple abrupt fluctuation periods, in which the fluctuation range of the rate of slope angle change increased several times that of the weak fluctuation period, and slope angle activity increased greatly. The entire process was accompanied by the occurrence of large-scale slides, which is the most dangerous stage of slope surficial failure.
The single strong fluctuation cycle of the slope angle can be divided into four stages: rapid growth period, growth-and-decline period, rapid decrease period, and decrease-and-decline period. The rapid growth period corresponds to the rapid increase in the slope angle during the early formation of slope surface arch. In the weak growth period, the increasing speed of the slope angle gradually decreases, and the accumulation state of the slope surface gradually approaches the critical state. When the rate of slope angle change drops to zero, it reaches the limit state of the slope surface, which is usually the node where large-scale slip events occur. After large-scale surficial failure, the rate of slope angle change enters a period of rapid decrease, which is also related to the fine particle layer generated on the slope surface due to sorting. From the foregoing discussion, we know that fine particles increase with the decrease in the shearing strength of the surface of the particle layer of the particle migration rate. The fine particle layer disappeared gradually with the addition of debris at the top of the slope, and the sliding stage entered the weakening stage. The rate of slope angle change increases with a negative value, and the decreasing rate of slope angle slows to zero. Then, the slope surface reaches a stable state and starts to accumulate particles again, and the rate of slope angle change repeats into the next weak fluctuation cycle.
Compared with the slope surface slide failure dominated by coarse particles, the one dominated by fine particles had only a weak fluctuation period, and the rate of slope angle change only fluctuated around the zero value, without a sudden increase or decrease (Figure 13B). The decrease in coarse particles in the slope structure is the main reason for the disappearance of a strong fluctuation period, which causes the bearing capacity of the slope to decrease and leads to the accumulation of large debris, and a small amount of debris will lead to slip failure. Therefore, surficial failure dominated by fine particles occur most frequently.
The aforementioned analysis demonstrates that the change rate of the slope angle for the granular slope has a natural periodic law. Monitoring the slope angle can determine the state of the granular slope and help prevent and/or provide early warning of surface failure. For example, in the slope structure composed mainly of coarse particles, it can be inferred that the slope of coarse particles is in a period of strong fluctuation, according to the change in slope angle. Growth and weakness periods during strong fluctuation predict the occurrence of large-scale events, and corresponding inducing measures can be taken in advance to avoid or reduce the disastrous impact of slides.
Conclusion
This research focuses on dry granular slopes confined by retaining walls. Based on the simulation of continuous debris supply from the source area as a result of physical weathering, repeated surficial failure of granular slopes with different fractal dimensions was compared and analyzed to understand failure features and evaluate their activity level, which can be summarized as follows:
1) Repeated surficial failure showed different features for granular slopes with different particle compositions. When fine particles dominated the granular slope, surficial failure presented high frequency and small scale. On the other hand, surficial failure presented low frequency, and large scale, for granular slopes dominated by coarse particles.
2) Mass of debris crossing the retaining wall indicated activity level of the granular slope, especially for the one dominated by coarse particles. When mass of debris for each surficial failure gradually decrease, it is highly likely that large-scale surficial failure will occur. As the amount of debris deposited on the slope increases, it is highly probable that the mass of debris falling during a massive slide will be many times that of the previous slide. In engineering practice, it is necessary to record the volume of debris accumulated on the road during road cleaning.
3) It is possible to have early warning of repeated surficial failures of granular slopes, based on monitoring the change rate of the slope angle, especially for granular slopes dominated by coarse particles. Continuous increase in slope angle indicates a high probability of large-scale surficial failure. For each granular slope with a unique particle composition, there is a critical change rate for early warning of surficial failure, which can be obtained by long-term monitoring.
Data availability statement
The original contributions presented in the study are included in the article/supplementary material. Further inquiries can be directed to the corresponding author.
Author contributions
HY: conceptualization, methodology, data curation, writing—original draft, and formal analysis. BX: conceptualization, methodology, and formal analysis. HJ: conceptualization, methodology, and formal analysis. QC: conceptualization, methodology, and formal analysis.
Funding
This work was supported by the Second Tibetan Plateau Scientific Expedition and Research (STEP) program (Grant No. 2019QZKK0905) and the National Natural Science Foundation of China (Grant Nos. 41941017, 41877226, and 41807248).
Conflict of interest
Author HJ is employed by Kunming Survey, Design and Research Institute Co., Ltd. of CREEC.
The remaining authors declare that the research was conducted in the absence of any commercial or financial relationships that could be construed as a potential conflict of interest.
Publisher’s note
All claims expressed in this article are solely those of the authors and do not necessarily represent those of their affiliated organizations, or those of the publisher, the editors, and the reviewers. Any product that may be evaluated in this article, or claim that may be made by its manufacturer, is not guaranteed or endorsed by the publisher.
References
Bagde, M. N., Raina, A. K., Chakraborty, A. K., and Jethwa, J. L. (2002). Rock mass characterization by fractal dimension. Eng. Geol. 63 (1–2), 141–155. doi:10.1016/S0013-7952(01)00078-3
Bak, P., Tang, C., and Wiesenfeld, K. (1988). Self-organized criticality. Phys. Rev. A 38 (1), 364–374. doi:10.1103/physreva.38.364
Bak, P., Tang, C., and Wiesenfeld, K. (1987). Self-organized criticality: An explanation of the 1/f noise. Phys. Rev. Lett. 59 (4), 381–384. doi:10.1103/physrevlett.59.381
Beakawi Al-Hashemi, H. M., and Baghabra Al-Amoudi, O. S. (2018). A review on the angle of repose of granular materials. Powder Technol. 330, 397–417. doi:10.1016/j.powtec.2018.02.003
Bryant, S. K., Take, W. A., and Bowman, E. T. (2015). Observations of grain-scale interactions and simulation of dry granular flows in a large-scale flume. Can. Geotech. J. 52 (5), 638–655. doi:10.1139/cgj-2013-0425
Bu, X. H., Fu, R. H., Li, J. D., and Huang, Y. (2016). Internal factors of the failure of granular mixtures slope. J. Yangtze River Sci. Res. Inst. 33 (9), 116–120. doi:10.11988/ckyyb.20150606
Cagnoli, B., and Romano, G. P. (2010). Effect of grain size on mobility of dry granular flows of angular rock fragments: An experimental determination. J. Volcanol. Geotherm. Res. 193 (1–2), 18–24. doi:10.1016/j.jvolgeores.2010.03.003
Cagnoli, B., and Romano, G. P. (2012). Granular pressure at the base of dry flows of angular rock fragments as a function of grain size and flow volume: A relationship from laboratory experiments. J. Geophys. Res. 117, B10202. doi:10.1029/2012JB009374
Campbell, C. S. (2006). Granular material flows – an overview. Powder Technol. 162 (3), 208–229. doi:10.1016/j.powtec.2005.12.008
Carson, M. A. (1977). Angles of repose, angles of shearing resistance and angles of talus slopes. Earth Surf. Process. 2, 363–380. doi:10.1002/esp.3290020408
Chen, R. H., Kuo, K. J., Chen, Y. N., and Ku, C. W. (2011). Model tests for studying the failure mechanism of dry granular soil slopes. Eng. Geol. 119 (1-2), 51–63. doi:10.1016/j.enggeo.2011.02.001
Chen, T. C., Lin, M. L., and Wang, K. L. (2014). Landslide seismic signal recognition and mobility for an earthquake-induced rockslide in tsaoling, taiwan. Eng. Geol. 171, 31–44. doi:10.1016/j.enggeo.2013.11.018
Crosta, G. B., Frattini, P., and Fusi, N. (2007). Fragmentation in the val pola rock avalanche, Italian alps. J. Geophys. Res. 112, F01006. doi:10.1029/2005JF000455
Cruden, D. M., and Hungr, O. (1986). The debris of the frank slide and theories of rockslide–avalanche mobility. Can. J. Earth Sci. 23 (3), 425–432. doi:10.1139/e86-044
Curry, A. M., and Morris, C. J. (2004). Lateglacial and holocene talus slope development and rockwall retreat on mynydd du, UK. Geomorphology 58 (1–4), 85–106. doi:10.1016/S0169-555X(03)00226-5
Dai, B. B., Wu, F. Y., Zhong, W. T., Shi, Y. H., Qin, J. T., Yang, J. J., et al. (2022). Particle sorting in scree slopes: Characterization and interpretation from the micromechanical perspective. JGR. Earth Surf. 127 (5), e2021JF006372. doi:10.1029/2021JF006372
Davies, T. R., and McSaveney, M. J. (2009). The role of rock fragmentation in the motion of large landslides. Eng. Geol. 109 (1–2), 67–79. doi:10.1016/j.enggeo.2008.11.004
De Blasio, F. V., and Sӕter, M. B. (2009). Small-scale experimental simulation of talus evolution. Earth Surf. Process. Landforms 34, 1685–1692. doi:10.1002/esp.1861
De Blasio, F. V., and Sӕter, M. B. (2015). Dynamics of grains falling on a sloping granular medium: Application to the evolution of a talus. Earth Surf. Process. Landforms 40 (5), 599–609. doi:10.1002/esp.3655
de Sanjosé-Blasco, J. J., López-González, M., Alonso-Pérez, E., and Serrano, E. (2020). Modelling and terrestrial laser scanning methodology (2009–2018) on debris cones in temperate high mountains. Remote Sens. (Basel). 12, 632. doi:10.3390/rs12040632
Drake, T. G. (1990). Structural features in granular flows. J. Geophys. Res. 95 (B6), 8681. doi:10.1029/JB095iB06p08681
Forterre, Y., and Pouliquen, O. (2008). Flows of dense granular media. Annu. Rev. Fluid Mech. 40 (1), 1–24. doi:10.1146/annurev.fluid.40.111406.102142
Gerber, E., and Scheidegger, A. E. (1974). On the dynamics of scree slopes. Rock Mech. 6 (1), 25–38. doi:10.1007/bf01238051
He, N., Fu, R. H., Bu, X. H., Wang, L. Y., Li, C., Deng, M. W., et al. (2012). An experimental study on movement and accumulation characteristics of the sand-sliding slope. J. Geol. Hazard. Environ. Preserv. 23 (1), 50–53. doi:10.3969/j.issn.1006-4362.2012.01.010
Hsu, L., Dietrich, W. E., and Sklar, L. S. (2014). Mean and fluctuating basal forces generated by granular flows: Laboratory observations in A large vertically rotating drum. J. Geophys. Res. Earth Surf. 119 (6), 1283–1309. doi:10.1002/2013JF003078
Iverson, R. M., Reid, M. E., Logan, M., LaHusen, R. G., Godt, J. W., Griswold, J. P., et al. (2011). Positive feedback and momentum growth during debris-flow entrainment of wet bed sediment. Nat. Geosci. 4 (2), 116–121. doi:10.1038/ngeo1040
Iverson, R. M. (1997). The physics of debris flows. Rev. Geophys. 35 (3), 245–296. doi:10.1029/97RG00426
Kesseler, M., Heller, V., and Turnbull, B. (2018). A laboratory-numerical approach for modelling scale effects in dry granular slides. Landslides 15 (11), 2145–2159. doi:10.1007/s10346-018-1023-z
Kleinhans, M. G., Markies, H., de Vet, S. J., in't Veld, A. C., and Postema, F. N. (2011). Static and dynamic angles of repose in loose granular materials under reduced gravity. J. Geophys. Res. 116, E11004. doi:10.1029/2011JE003865
Lai, Z. Q., Chen, D., Jiang, E. H., Zhao, L. J., Vallejo, L. E., Zhou, W., et al. (2021). Effect of fractal particle size distribution on the mobility of dry granular flows. AIP Adv. 11 (9), 095113. doi:10.1063/5.0065051
Li, K., Wang, Y. F., Lin, Q. W., Cheng, Q. G., and Wu, Y. (2021). Experiments on granular flow behavior and deposit characteristics: Implications for rock avalanche kinematics. Landslides 18 (5), 1779–1799. doi:10.1007/s10346-020-01607-z
Liu, X. Y., Specht, E., and Mellmann, J. (2005). Experimental study of the lower and upper angles of repose of granular materials in rotating drums. Powder Technol. 154 (2-3), 125–131. doi:10.1016/j.powtec.2005.04.040
Luckman, B. (2013). “Talus slopes,” in The encyclopedia of quaternary science (Elsevier), 3, 566–573.
Luo, L. G., Pei, X. J., Pei, Z., Yang, B., and Jing, X. (2018). Distribution characteristics and susceptibility of talus slopes in the northern piedmont of tian-Shan mountain. J. Catastrophol. 33 (2), 200–205. doi:10.3969/j.issn.1000-811X.2018.02.035
Mehta, A., and Barker, G. C. (1994). The dynamics of sand. Rep. Prog. Phys. 57 (4), 383–416. doi:10.1088/0034-4885/57/4/002
Otto, J., Schrott, L., Jaboyedoff, M., and Dikau, R. (2009). Quantifying sediment storage in a high alpine valley (turtmanntal, Switzerland). Earth Surf. Process. Landf. 34, 1726–1742. doi:10.1002/esp.1856
Pudasaini, S. P., and Hutter, K. (2007). Avalanche dynamics: Dynamics of rapid flows of dense granular avalanches. Berlin: Springer. doi:10.1007/978-3-540-32687-8
Que, Y., Wang, C. H., and Zhang, X. G. (2003). Formative mechanism and control of typical sand-sliding slope along sichuan-tibet highway. Mt. Res. 21 (5), 595–598. doi:10.3969/j.issn.1008-2786.2003.05.012
Sass, O., and Krautblatter, M. (2007). Debris flow-dominated and rockfall-dominated talus slopes: Genetic models derived from GPR measurements. Geomorphology 86, 176–192. doi:10.1016/j.geomorph.2006.08.012
Statham, I. (1976). A scree slope rockfall model. Earth Surf. Process. 1 (1), 43–62. doi:10.1002/esp.3290010106
Takagi, D., McElwaine, J. N., and Huppert, H. E. (2011). Shallow granular flows. Phys. Rev. E 83, 031306. doi:10.1103/PhysRevE.83.031306
Tu, X. B., Wang, S. J., and Yue, Z. Q. (2005). Fractal fragmentation of weathered rock and its application in engineering geology. Chin. J. Rock Mech. Eng. 24 (4), 587–595. doi:10.3321/j.issn:1000-6915.2005.04.008
Turcotte, D. L. (1986). Fractals and fragmentation. J. Geophys. Res. 91 (B2), 1921. doi:10.1029/JB091iB02p01921
Tyler, S. W., and Wheatcraft, S. W. (1992). Fractal scaling of soil particle-size distributions: Analysis and limitations. Soil Sci. Soc. Am. J. 56 (2), 362–369. doi:10.2136/sssaj1992.03615995005600020005x
Wang, C. H., Zhang, X. G., Que, Y., and He, S. M. (2007). Formation and basic characteristics of sand-sliding slope composed of granular clasts: Part I of sand-sliding slope series. Rock Soil Mech. 28 (1), 29–35. doi:10.16285/j.rsm.2007.01.006
Wang, Y. F., Cheng, Q. G., and Zhu, Q. (2015). Surface microscopic examination of quartz grains from rock avalanche basal facies. Can. Geotech. J. 52 (2), 167–181. doi:10.1139/cgj-2013-0284
Xing, J., and Wang, J. B. (2019). Development mechanism of the sand-sliding slope at a tunnel exit in qinghai-tibet expressway. Chin. J. Geol. Hazard. Control. 30 (2), 1–8. doi:10.16031/j.cnki.issn.1003-8035.2019.02.01
Xue, Y. G., Kong, F. M., Li, S. C., Zhang, Q. S., Qiu, D. H., Su, M. X., et al. (2021). China starts the world’s hardest “Sky-High Road” project: Challenges and countermeasures for Sichuan-Tibet railway. Innovation 2 (2), 100105. doi:10.1016/j.xinn.2021.100105
Ye, T. J., Xie, Q., and Wang, Y. (2019). Stability evaluation and classification of debris slopes in eastern tibet section of G318 highway. J. Eng. Geol. 27 (4), 914–922. doi:10.13544/j.cnki.jeg.2018-058
Zhang, J., and Shu, Z. P. (2017). Research on failure mode of sand-sliding slope by progressive replenishment and countermeasure. J. Chengdu Univ. 36 (4), 434–437. doi:10.3969/j.issn.1004-5422.2017.04.025
Zhang, Y. C., Fu, R. H., and Huang, R. Q. (2008). Experimental study on dynamical and fractal characteristic of sand-sliding slope on Tianshan Highway. J. Disaster Prev. Mitig. Eng. 28 (2), 219–222. doi:10.3969/j.issn.1672-2132.2008.02.016
Keywords: analogical model test, surficial failure, granular slope, fractal dimension, activity level
Citation: Yang H, Xing B, Jiang H and Cheng Q (2022) Analogical model tests on repeated surficial failure of dry granular slopes confined by retaining walls. Front. Earth Sci. 10:973205. doi: 10.3389/feart.2022.973205
Received: 19 June 2022; Accepted: 12 July 2022;
Published: 26 August 2022.
Edited by:
Xiaojun Guo, Institute of Mountain Hazards and Environment (CAS), ChinaReviewed by:
Aiguo Xing, Shanghai Jiao Tong University, ChinaJiewei Zhan, Chang’an University, China
Copyright © 2022 Yang, Xing, Jiang and Cheng. This is an open-access article distributed under the terms of the Creative Commons Attribution License (CC BY). The use, distribution or reproduction in other forums is permitted, provided the original author(s) and the copyright owner(s) are credited and that the original publication in this journal is cited, in accordance with accepted academic practice. No use, distribution or reproduction is permitted which does not comply with these terms.
*Correspondence: Qiangong Cheng, chengqiangong@swjtu.edu.cn