Impacts of the COVID-19 Pandemic on Elementary School Teachers’ Practices and Perceptions Across the Spring and Fall 2020 Semesters
 J. Marc Goodrich
 Michael Hebert
 Jessica M. Namkung
- 1Department of Teaching, Learning, and Culture, Texas A&M University, College Station, TX, United States
- 2Department of Special Education and Communication Disorders, University of Nebraska-Lincoln, Lincoln, NE, United States
Following the closure of schools in the spring 2020 semester due to the COVID-19 pandemic, we developed two surveys to understand how the pandemic affected elementary education in the U.S. First, we distributed a survey at the end of the spring 2020 semester to understand how school closures impacted delivery of instruction. Second, we conducted a follow up survey in November 2020 to determine the nature of instruction provided to students when schools did or did not re-open in Fall 2020 and understand teachers’ perceptions of student learning and achievement during the pandemic. Each survey was sent to a sample of over 9,000 teachers who were randomly selected to be representative of the population of the U.S. Results indicated that many students did not receive direct instruction in academic skills during the spring 2020 semester. Although by late fall 2020 teachers reported broad use of some form of in-person instructional model, teachers indicated that many of their students were not ready to transition to the next grade level and that achievement gaps were larger in fall 2020 than in typical years. These findings have important implications for practices during potential school closures in the future.
1 Introduction
The current COVID-19 crisis has presented unique challenges to education professionals across the U.S. for identifying optimal strategies to promote student achievement. It is well-documented that school attendance is associated with achievement (Morrissey et al., 2014), and periods of time during which students do not attend school (e.g., summer) result in minimal progress or declines in achievement. Such declines are often greater for children from vulnerable groups, such as students with disabilities, English language learners, and students from low-income backgrounds (Quinn and Polikoff, 2017). In the current crisis, state departments of education and school districts temporarily closed schools in spring 2020 and some districts made substantial modifications to the 2020–2021 school year, such as in-person/remote hybrid instruction or 100% remote instruction (Hobbs, 2020).
Projections of how such closures and changes in delivery of instruction would impact student achievement suggested that students would have significantly lower reading and mathematics abilities when beginning the fall 2020 academic year compared with previous years, (Kuhfeld et al., 2020). In addition to having lower overall achievement in mathematics and reading at the beginning of fall 2020, Kuhfeld et al. reported that students would demonstrate greater variability in reading achievement at the beginning of fall 2020. This means that, in addition to addressing the monumental task of helping students catch up to where they would be at the beginning of a typical school year, teachers may have to differentiate instruction more than they typically would, as students in their classroom would have a wider range of abilities. Moreover, Kuhfeld et al. reported that loss of progress or declines in achievement related to spring 2020 school closures would not be universal. Rather, in a model that addressed the likely scenario that students from high socioeconomic status (SES) schools would receive more remote instruction than would students from low SES schools, SES-based achievement gaps in mathematics and reading were projected to be larger at the beginning of fall 2020 than they would be in a typical school year.
Data supporting some of the projections made by Kuhfeld et al. are beginning to emerge. For example, one report of Fairfax County Public Schools (one of the largest school districts in the U.S.) that was published in the Washington Post indicated that students are failing classes at a higher rate than they were prior to the onset of the COVID-19 pandemic (Natanson, 2020). The report highlights similar patterns of failure rates in other large school districts across the country, and even larger increases in failure rates among students with disabilities and English language learners. Students with disabilities in U.S. schools who receive special education services [i.e., have an individualized education plan (IEP)] and students who are non-native English speakers and have limited English proficiency (i.e., English language learners) may be at risk of experiencing greater impacts of school closures. These students often receive small-group or individualized instruction and may have less access to those services during the pandemic. Moreover, there may be barriers to communication for students with disabilities or students with limited English proficiency that hinder their access to remote instruction.
In addition to evidence of larger impacts of the pandemic for special populations, data are consistent with the notion that students from higher SES schools would likely receive more remote instruction than would students from lower SES schools. Specifically, one national survey reported that 97% of children in households with annual incomes over $75,000 have regular internet access, whereas only 84% of children in households with annual incomes less than $25,000 have regular internet access (University of Southern California, 2020). Evidence also suggests that districts who serve larger numbers of students of color were slower to establish procedures for providing remote instruction, highlighting and potentially magnifying opportunity gaps for students from minoritized backgrounds (Preciado et al., 2020). Such opportunity gaps also exist along geographic lines, as the opportunity gap between rural and urban students in access to live instruction is even larger than the gap for SES (Gross and Opalka, 2020). Even in countries with relatively short lockdown periods, remote instruction resulted in minimal progress, and students from marginalized backgrounds were impacted the most by school closures (Engzell et al., 2021). Taken together, emerging data on how COVID-19 results in opportunity gaps highlights a critical need to document how teachers’ specific practices for delivering instruction have changed, as well as how teachers perceive the effectiveness of those instructional practices for promoting student achievement.
Some research has been published examining teachers’ perspectives on the impact of the pandemic on instructional practices and student achievement. For example, Education Week (EdWeek Research Center, 2020) provides an ongoing survey tracker to monitor how K-12 educators are responding to COVID-19 that is updated every 2 weeks. Results of this survey indicated that in spring 2020, more than 75% of students had lower engagement levels in remote instruction compared to in-person instruction, and approximately 20% of students were “essentially truant.” Other surveys of teachers have corroborated concerns regarding student engagement in remote instruction, as well as other concerns such as lack of access to appropriate technology needed for remote instruction (Educators for Educators for Excellence, 2020). Moreover, teachers have expressed concerns with lack of ability to hold students accountable, as many students were not required to complete work, and often feedback was not provided on completed work (Hamilton et al., 2020). Teachers have also reported feeling unprepared to teach online when schools unexpectedly moved to remote instruction in spring 2020 (Marshall et al., 2020).
Addressing complex issues such as large learning losses that occurred when schools closed early in spring 2020, potential greater need for individualized instruction, and navigating novel learning environments (e.g., hybrid classrooms, remote instruction) represents a monumental challenge for teachers. Therefore, more research is needed to characterize how teachers’ academic instruction has changed because of the pandemic, how these changes differentially impact students from diverse or minoritized backgrounds, and what practices teachers believe are effective for maximizing student learning in a remote learning environment. Although another pandemic of this scale is unlikely to occur soon, understanding how to best deliver remote or hybrid instruction has important implications for continuing to promote student learning in other times of crisis (e.g., natural disasters).
To understand and describe how the COVID-19 pandemic has affected delivery of instruction, we conducted two surveys of elementary school teachers across the U.S. The purpose of the first survey was to examine the academic instructional opportunities (i.e., reading, writing, and mathematics) provided to elementary school students during school closures in the spring 2020 semester due to the COVID-19 pandemic. Questions centered on instructional opportunities provided by schools, student participation and access, feedback and evaluation, and teacher beliefs about instructional effectiveness and student readiness. The purpose of the second survey was to understand the nature of instruction provided and teachers’ perceptions of effectiveness of instruction and student achievement during the fall 2020 semester when schools re-opened during the COVID-19 pandemic. Questions focused on the instructional models used, teacher perceptions of preparedness for and effectiveness of remote instruction, specific practices used for academic skill instruction, and parent involvement for in-person and remote learners.
We asked the following research questions
1 What was the nature of remote instruction in the spring 2020 semester? How did remote instruction change from spring 2020 to fall 2020?
2 How were the needs of students in special education and English language learners addressed?
3 Are characteristics of schools (e.g., rural vs. urban) and students (e.g., SES) associated with teacher responses to questions about students’ access to instructional opportunities?
4 What differences did teachers observe between students entering their classes in the fall 2020 semester when compared with prior cohorts of students?
2 Materials and Methods
2.1 Participants
This research project was approved by the Institutional Review Board of the University of Nebraska-Lincoln. We obtained a representative random sample of educator email addresses for survey distribution from Market Data Retrieval, a company focused exclusively on data services related to education. The company collects demographic information for elementary school teachers in public and private schools across the U.S. There were 857,148 teachers in the MDR database in April 2020. We requested a random sample of e-mail addresses that was proportionally reflective of the number of teachers in each grade (K-5), as well as representative of the distribution of the U.S. population across different geographic regions: Pacific, Mountain, North Central, South Central, South Atlantic, Mid-Atlantic, and New England.
Using the margin of error formula proposed by Dillman (2000), we determined we would need approximately 384 respondents to achieve a margin of error of 3.5%, with a 95% confidence interval, assuming an expected 50/50 split in the proportion of participants answering yes or no to a particular question. According to Dillman (2000), a 50/50 split represents maximum heterogeneity of a sample. Market Data Retrieval provided us with a random sample of teacher 9,468 email addresses. E-mail addresses for 364 teachers were invalid, resulting in a final total of 9,104 teachers who may have received the invitation to complete both surveys.
For the first survey, 428 teachers began the survey, and 390 teachers completed the last question on the survey. For the second survey, 340 teachers began the survey, and 285 teachers completed the last question on the survey. This was a lower than anticipated response rate (4.7% and 3.7% response for the first and second survey, respectively). To evaluate how this impacted the generalizability of our findings, we compared teachers who did and did not respond to the survey, as well as comparing our sample to national data on teacher demographics reported by the National Center for Education Statistics (NCES; Hussar et al., 2020). These comparisons are reported in Tables 1 and 2. When comparing responders and non-responders, after correcting for Type I error rate, there were some statistically significant differences by geographic region for both Surveys 1 and 2. The only other statistically significant difference was that teachers from medium-high SES schools were over-represented in Survey 1. Given that teachers who did and did not respond to the survey were similar with respect to school setting, school type, SES, and grade level taught, we believe that despite the low response rates our results are generalizable to the broader population of elementary school teachers in the MDR database. When comparing to national averages, our samples over-represented female teachers, white teachers (Survey 2 only), and teachers with over 20 years of teaching experience. Our samples under-represented teachers with less than 3 years of teaching experience, teachers with between 10 and 20 years of experience, and Hispanic/Latinx teachers. We discuss the implications of our low response rate and generalizability of the results in the Limitations. Demographics of participating teachers’ classrooms are reported in Table 3.
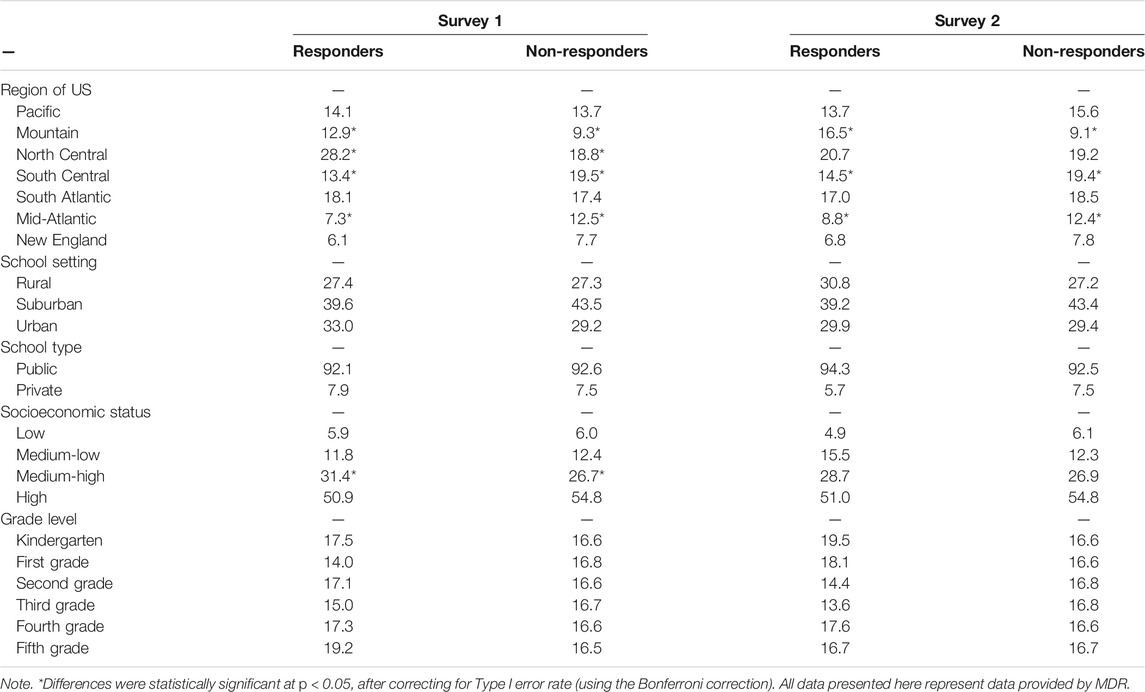
TABLE 1. Demographic percentages for responders and non-responders.
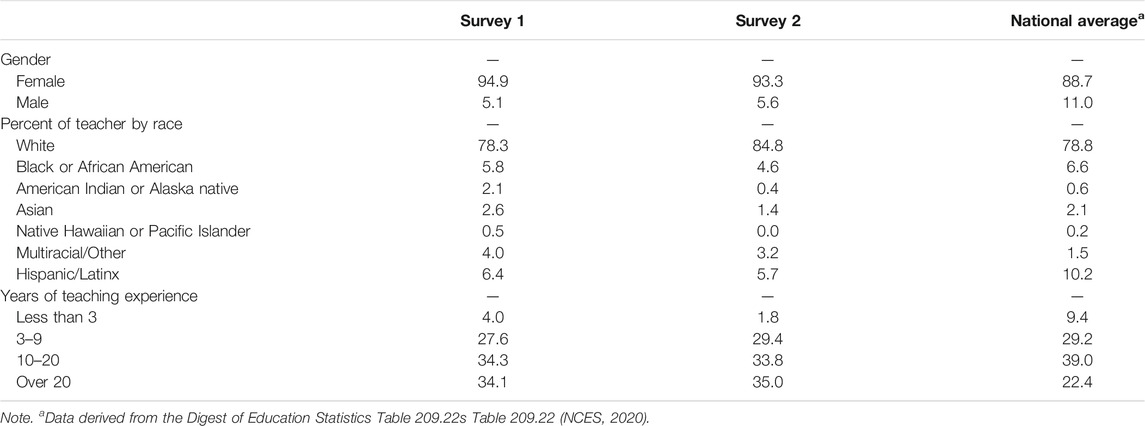
TABLE 2. Demographic percentages for teachers in surveys 1 and 2 and national averages.
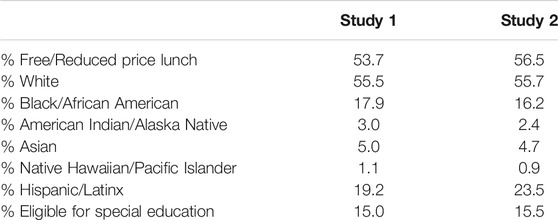
TABLE 3. Classroom demographics for teachers completing survey 1 and survey 2.
2.2 Survey Questions
We asked similar types of questions across both surveys (Table 4 for a comparison of the categories of questions asked). We elaborate on the questions for each survey in the following subsections.
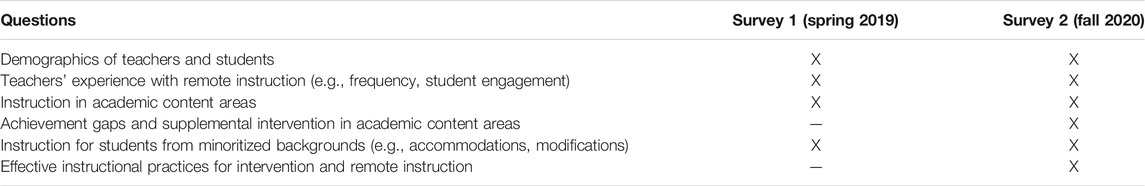
TABLE 4. Survey 1 and survey 2 questions.
2.2.1 Survey 1
Survey 1 first included questions related to demographics of the teachers and students in their classrooms, such as questions about the number of students in their classrooms, student eligibility for free or reduced-price lunch, ethnicity, special education status, and English language learner status. Additionally, Survey 1 included 20 questions about teachers’ experience with remote instruction, including questions about whether and how often they provided remote instructional opportunities for students, as well as students’ participation and engagement in those remote learning experiences. We also asked questions related to instruction in reading, mathematics, and writing. Our questions distinguished between academic instruction provided by teachers and academic activities assigned for students to complete without instruction. Finally, we asked questions about students receiving special education or English learner services in their classrooms, including questions about the number of students with an Individualized Education Plan (IEP), whether instruction was provided only in English, the percent of non-English instruction (if any), and the accommodations and modifications made for students with disabilities and English language learners.
2.2.2 Survey 2
Survey 2 was structured similarly to Survey 1, in that it began with questions about demographics of teachers and the students in their classrooms. Then, teachers were asked questions about the instructional model that their school used for the fall 2020 semester, including whether this model has changed since the beginning of the school year. Teachers also were asked questions about remote instruction, if they indicated remote instruction was part of their school’s instructional model. These questions included information about student engagement in remote instruction, frequency and nature of remote instruction, assignments and grading for remote instruction, and preparedness for and effectiveness of delivery of remote instruction. The questions then shifted to a focus on specific academic skills, including questions about reading, writing, and mathematics instruction. These questions focused on the frequency and nature of academic skills instruction, whether students were screened on academic skills at the beginning of the school year, supplemental intervention for academic skills, and achievement gaps in academic skills. Teachers were asked specific questions regarding achievement gaps and supplemental intervention for academic skills relative to previous cohorts of students. Teachers answered open-ended questions that asked about their opinions on instructional practices most effective for improving academic skills for remote learners and students who may have fallen behind due to the pandemic. Teachers then answered questions about special populations in their classroom, including students with disabilities and English language learners. Teachers were asked about inclusive practices, accommodations and modifications, and opportunity gaps for special populations.
2.3 Survey Design
Survey 1 included a traditional approach to survey design, in which all participants were asked to complete all survey items. However, because of the large number of questions included in Survey 2, we implemented a planned missing data design. This approach minimizes the number of survey questions an individual participant responds to, cutting down on the overall time it takes each participant to complete the survey. We used a 10-form planned missing design. For this type of design, 10 separate forms of the survey were created, with each form having a different pattern of missing questions. Participants were randomly assigned to one of the 10 forms of the survey. Therefore, because the data for individual questions were missing due to random assignment to survey form, they were missing completely at random and standard procedures for handling missing data were employed. One set of questions was designated as the “X” set of questions that all participants received, regardless of the form to which they were assigned. The X set of questions was made up of the questions deemed to be most important for the survey (Little and Rhemtulla, 2013). The X set included the block on teacher and student demographics, as well as the questions about the school’s instructional model for the fall 2020 semester, a question about whether teachers believed their students had skills needed to transition into their new grade level, and a question about whether teachers were spending more time reviewing material in the fall of 2020. For example, in one of the planned missing forms, participants received the X set of questions, as well as questions about reading and writing instruction, but not questions about math instruction, special populations, or parent involvement.
2.4 Missing Data
All missing data attributable to the planned missing design in Survey 2 were imputed using multiple imputation. For both Surveys 1 and 2, some teachers began but did not complete the survey. We compared teachers who did and did not complete the survey on key variables to determine whether the data were missing at random. We first conducted chi-square tests based on data provided by MDR [geographic region, school type (rural, urban, suburban), public vs. private schools, grade level taught, and SES]. Results indicated some significant differences in geographic region across teachers who did and did not complete the survey (e.g., for Survey 2, teachers who completed the survey were more likely to come from the north central region of the U.S. than were teachers who did not complete the survey); however, no other differences were observed that could plausibly explain differences across teachers who did and did not complete the survey.
We then conducted Little’s test (Little, 1988) to confirm that our planned missing variables were missing completely at random (MCAR). After confirming this, we also used Little’s test to evaluate whether other key variables were also MCAR, including grade level, years of experience, percentage of students on free or reduced-price lunch, percent of students in special education, time spent reviewing material, school’s current instructional model, and change in instructional model; because these data were also determined to be missing completely at random, we used multiple imputation to impute the missing values for teachers who did not complete the survey.
There were also rare instances of missing data for questions that participants skipped and some participant responses were considered invalid (e.g., when describing race/ethnicity of students in their class, one teacher reported that 100% of students were white, 70% of students were black/African-American, 94% of students were Native American, 97% of students were Asian, and 89% of students were Hawaiian; although it is possible there are multiracial students in the class, it is unlikely that such large numbers for all race/ethnicity categories represented valid responses). We conducted Little’s test after dropping invalid responses, and these ethnicity variables were not found to be MCAR. However, such instances of missing data were assumed to be missing at random (e.g., data entry errors, accidentally skipping questions) and were also imputed.
3 Results
3.1 Survey 1 (Spring 2020)
Teachers completed Survey 1 at the end of the Spring 2020 semester during school closures following the onset of the COVID-19 pandemic. Given that this was the beginning of the pandemic and the first time many teachers engaged in remote instruction, our research questions for Survey 1 focused on characterizing the nature of remote instruction at that time, including how it varied across student populations and demographics. The following sections are organized based on the types of questions included in Survey 1.
3.1.1 Teacher Responses to Questions About Remote Learning Experiences (Spring 2020)
Data on remote learning experiences indicated that nearly all teachers provided some form of remote instruction (Table 5). Approximately three out of four teachers (76%) were expected to provide remote instruction only for the remainder of the school year, and just under one out of four (23%) teachers were expected to provide remote instruction for the school year and summer. Teachers reported having an average of 25 students in their classroom (M = 25.0, SD = 13.1), and, on average, approximately 72% of students regularly participated in remote instruction.
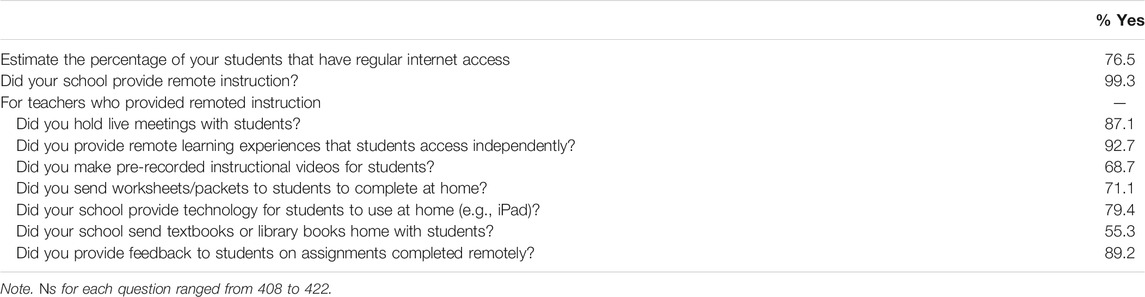
TABLE 5. Nature of remote instruction during spring 2020 semester.
Despite the somewhat high percentage of teachers providing remote instruction, only 31% of teachers reported that they believed remote learning experiences were effective at promoting student achievement (Figure 1). Over 80% of teachers held both live meetings with students and provided remote learning experiences that students accessed independently. However, only 33% of teachers reported holding daily live meetings with students, with an additional 39% reporting holding live meetings with students once per week. There was a significant, negative correlation between whether teachers held live meetings and the percentage of students eligible for free or reduced-price lunch (r = −0.19, p < 0.001), indicating that teachers who served larger numbers of students from low-income backgrounds were less likely to hold live meetings with their students. This is consistent with a negative correlation between the percentage of students eligible for free or reduced-price lunch and the teacher-reported percentage of students who have regular internet access (r = −0.41, p < 0.001).
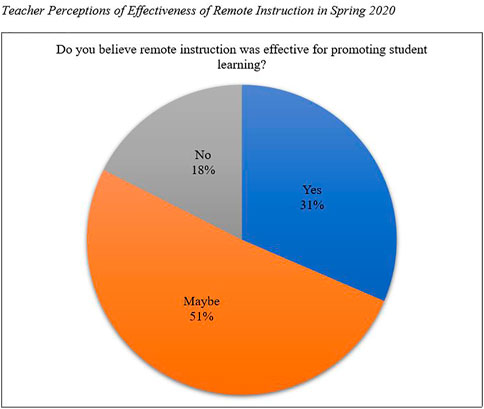
FIGURE 1. Teacher perceptions of effectiveness of remote instruction in spring 2020.
A much larger percentage of teachers reported providing activities that students could complete independently at home (93%). On average, teachers reported providing 3.1 (SD = 1.9) assignments per day. However, a large proportion of teachers reported that the assignments were not graded (48%).
3.1.2 Teacher Responses to Questions About Academic Skills Instruction (Spring 2020)
Teachers reported that, on average, only three out of five of their students (M = 60.5%; SD = 27.4) were prepared to advance to the next grade level at the time their school closed in spring 2020. Results of multiple regression analyses predicting which students had the skills needed to transition to the next grade level and frequency of academic skills instruction are reported in Table 6. Multiple regression analysis indicated that greater percentages of students eligible for free/reduced price lunch and special education were associated with smaller percentages of students ready to advance to the next grade level. In contrast, larger percentages of white students in the classroom were associated with larger teacher estimates of the percent of students ready to advance to the next grade level.
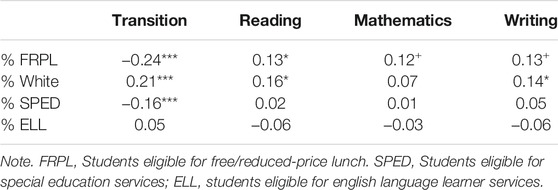
TABLE 6. Standardized regression coefficients for links between classroom demographic composition, percentage of students ready to transition to the next grade level, and frequency of academic skills instruction.
Of the teachers who were providing remote instruction, 67% of teachers reported providing some form of reading instruction daily (i.e., direct instruction in reading skills or independent reading activities). Approximately 25% of teachers provided direct instruction in reading skills daily whereas 25% of teachers reported never providing direct instruction in reading skills. Over 90% of teachers provided independent reading activities for students to complete on their own more than once per week. Multiple regression analyses indicated that teachers who reported having larger numbers of students eligible for free/reduced price lunch and larger numbers of white students also reported providing more direct instruction in reading skills.
This pattern of findings was similar for mathematics, in which 70% of teachers reported providing some form of remote instruction daily. About 28% of teachers reported providing direct instruction in mathematics skills daily whereas 22% of teachers reported never providing direct instruction. In addition, approximately 94% of teachers reported providing independent mathematics activities more than once per week. No classroom demographic variables were significant predictors of teacher reports of frequency of direct instruction in mathematics, although the association between percent of students eligible for free/reduced-price lunch and amount of direct instruction in mathematics was positive and marginally significant.
In contrast, fewer teachers (36%) reported providing some form of remote instruction in writing daily. Teachers were also less likely to provide daily direct instruction in writing skills (13%) compared to that of reading and mathematics, whereas the percentage of teachers not providing any direct instruction in writing were comparable (22%) to those in reading and mathematics. Furthermore, 76% of teachers reported providing independent writing activities more than once per week. There was a positive, statistically significant association between percent of white students in the classroom and the amount of direct instruction in writing skills. The association between percent of students eligible for free/reduced-price lunch and frequency of writing instruction was positive and marginally significant.
3.1.3 Teacher Responses to Questions About Special Populations (Spring 2020)
Data pertaining to remote instruction for students with disabilities indicated that teachers had an average of three students with an IEP in their classroom (M = 3.8, SD = 3.5). Teachers reported that more than 55% of students with an IEP participated in remote instruction. Approximately 38% of teachers expected students with an IEP to complete the same remote assignments as general education students in their class, whereas 47% of teachers expected students with an IEP to complete the same remote assignments as general education students only sometimes, followed by 16% of teachers not expecting the same remote assignments from students with an IEP. Approximately 77% of teachers provided special accommodations for students with disabilities themselves, and 82% of teachers indicated that other teachers, such as paraprofessionals or resource teachers, provided services to students with disabilities in their class. In addition, 79% of teachers indicated that either they or another teacher (e.g., resource teachers) were holding a small group or one-to-one meeting with students with disabilities to provide individualized supports.
Eighty-five percent of teachers reported having English language learners in their classroom, with an average of 6 English language learners in the classroom (M = 5.7, SD = 7.5). The language spoken by English language learners varied (e.g., Spanish, Chinese, Portuguese, French, Arabic, Vietnamese, Russian), but Spanish was predominant. Instruction was provided mostly in English with only 11% of teachers reporting providing instruction in another language. Approximately 43% of teachers indicated providing no instructional accommodations for English language learners during school closures.
3.2 Survey 2 (Fall 2020)
Teachers completed Survey 2 during the Fall 2020 semester, after having some experience providing remote and/or hybrid instruction. Therefore, we expected that teachers would be more prepared for providing remote instruction. Additionally, in the U.S. some teachers provided 100% in-person instruction for at least part of the Fall 2020 semester. Our research questions for Survey 2 focused on how delivery of remote instruction changed from Spring to Fall 2020, as well as whether there were differences in achievement between students entering the Fall 2020 semester and prior cohorts of students. The following sections are organized based on the types of questions teachers responded to for Survey 2.
Although results of Survey 1 indicated that teachers believed approximately 60% of students were ready to transition to the next grade level, teachers who completed Survey 2 reported that, on average, 49.0% of their students were ready to transition to their classroom at the beginning of the fall 2020 semester. This indicates that in spring 2020 teachers may have underestimated the impact of the pandemic on student learning, to some degree. Additionally, 75.3% of teachers reported spending more time reviewing material from the previous grade, compared to typical years.
3.2.1 Teacher Responses to Questions About Instructional Models (Fall 2020)
Teacher data on instructional models is reported in Figure 2. Although approximately 53% of schools were using an in-person or hybrid instructional model to begin the fall 2020 semester, by November 2020 approximately 68% of teachers reported their schools used an in-person or hybrid instructional model. This represents a positive trend, as many elementary schools that were initially hesitant to begin the year with in-person instruction ended up transitioning to in-person instruction by the middle of the 2020–2021 school year.
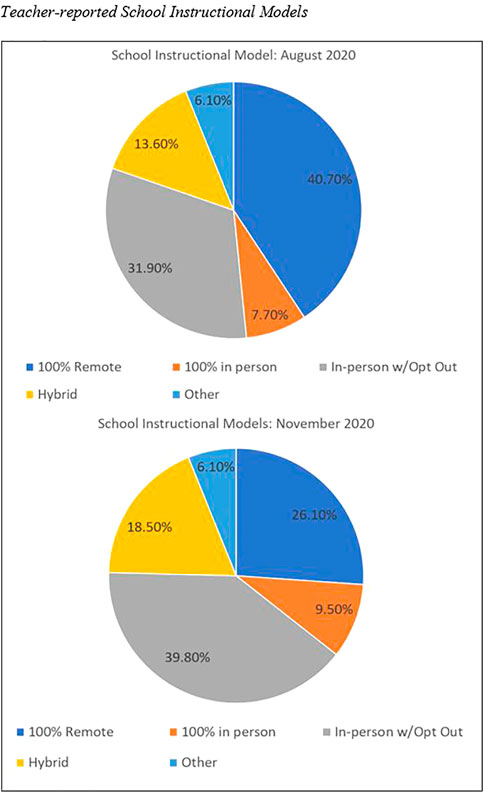
FIGURE 2. Teacher-reported school insctructional models.
3.2.2 Teacher Responses to Questions About Remote Instruction (Fall 2020)
Among teaches who provided remote instruction, approximately two thirds (67.1%) reported that their school or district provided some form of training in delivery of remote instruction, and 88.0% of teachers believed that their delivery of remote instruction was more effective in fall 2020 than it was in spring 2020. In contrast, 95.5% of teachers believed that remote instruction was less effective than in-person instruction, with 67.6% indicating it was “much less effective” than in-person instruction. Internet access may contribute to relative ineffectiveness of remote instruction as teachers reported that, on average, 21.3% of remote learners did not have reliable internet access. Similarly, a large majority of teachers (91.5%) whose schools used some form of remote instruction reported that remote learners were less engaged in instruction than were in-person students. Additional information characterizing the nature of remote instruction is provided in Table 7.
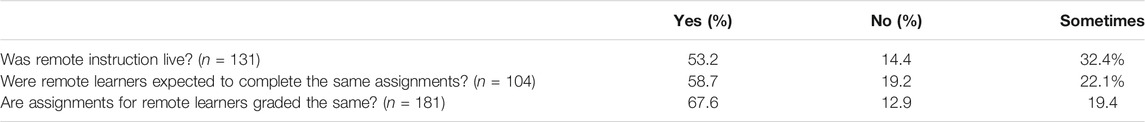
TABLE 7. Nature of remote instruction during fall 2020 semester.
3.2.3 Teacher Responses to Questions About Academic Skills Instruction (Fall 2020)
A summary of the frequency with which teachers provided direct instruction in academic skills in the Spring and Fall 2020 semesters is reported in Table 8. Across all academic domains, although a substantial number of teachers reported providing no direct instruction in academic skills in the Spring 2020 semester, almost all teachers reported providing direct instruction in academic skills daily or a few times per week during Fall 2020. After correcting for multiple comparisons, frequency of direct instruction in academic skills was not correlated with percentage of students eligible for free or reduced-price lunch.
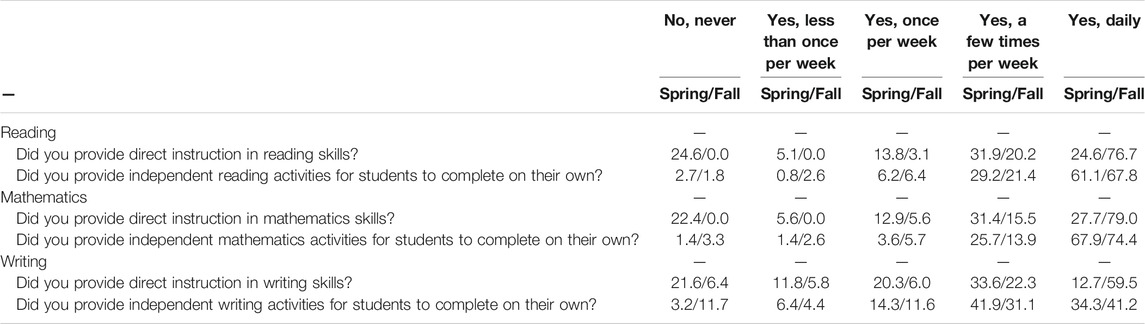
TABLE 8. Percentage of teachers providing instruction in academic skills.
Approximately 82.1% of teachers indicated that students were screened for reading difficulty at the beginning of the 2020–2021 school year, and 80.9% of teachers reported providing supplemental reading intervention to low performing students. Although 73.9% of teachers indicated that achievement gaps in reading were larger than they were in typical years, only 32.0% of teachers reported providing supplemental reading intervention to more students than they would in a typical year. In addition to examining data descriptively, we used multiple regression analysis to examine whether classroom demographic variables (i.e., percent of students eligible for free/reduced-price lunch, percent of students eligible for special education, percent of students who were white), instructional model, and percent of students ready to transition to the new grade at the beginning of the year were associated with magnitude of teacher-reported achievement gaps in academic skills. For reading, there were no significant predictors of teacher-reported achievement gaps in reading.
When asked about the instructional practices that were most effective for improving reading outcomes for remote learners, the most common responses supported the use of small group instruction, specific online platforms/apps that helped keep students engaged, and repeated practice. Other teachers reported miscellaneous activities that helped improve reading (e.g., phonics, combining independent work with live instruction, parent support) and a small number of teachers (about 6% of all responses) reported that there were no instructional practices that were effective at promoting reading skills for remote learners. There was a similar pattern of responses when teachers were asked about what worked best for students who may have fallen behind during the pandemic, with the most common responses supporting use of small group instruction, one-on-one instruction, and daily practice.
Although fewer teachers (69.7%) reported screening students for mathematics difficulties at the beginning of the 2020–2021 school year, a similar number of teachers (81.8%) reported providing supplemental mathematics intervention as reported providing supplemental reading intervention. Similar to results for reading, 65.6% of teachers indicate achievement gaps in mathematics were larger in fall 2020 than they are at the beginning of a typical school year, but only 29.2% of teachers reported providing supplemental mathematics intervention to more students than they would in a typical school year. As with reading, no identified predictor variables (classroom demographics, instructional model, and student readiness for transitioning at the beginning of the year) were associated with teacher-reported achievement gaps in mathematics in our multiple regression model.
When asked about instructional practices that were most effective for improving mathematics outcomes of remote learners, the most common practices identified for supporting mathematics skills in remote learners were use of specific online math learning platforms that included tools such as digital manipulatives, as well as small groups, daily practice, and explicit instruction. Other teachers gave miscellaneous responses or indicated that they did not believe anything was effective for teaching mathematics remotely. When asked about what worked best for students who may have fallen behind during the pandemic, the most common responses indicated that small-group or one-on-one instruction in specific math skills was effective. Other teachers reported miscellaneous responses (e.g., having parent support, review/re-teaching basic skills), and approximately 10% of teachers indicated they did not believe any practices were sufficient to help students who fell behind during the pandemic catch up to their peers.
In contrast to results for reading and mathematics, only 20.3% of teachers reported that their students were screened for writing difficulties at the beginning of the 2020–2021 school year, and only 51.2% of teachers reported providing supplemental writing intervention to low-performing students. A majority of teachers (56.8%) believed that achievement gaps in writing were comparable to typical years. Only 25.8% of teachers reported providing supplemental writing intervention to more students than they would in a typical year. Multiple regression analyses indicated that teachers who reported having more students who were ready to transition to their class at the beginning of Fall 2020 observed smaller changes in achievement gaps in writing due to the pandemic (β = −0.15, p < 0.05). No other effects were statistically significant.
When asked what instructional practices supported development of writing skills for remote learners, the most common responses were practicing specific writing skills (e.g., handwriting, spelling, punctuation) and explicit instruction. Other less common responses included use of technology, and opportunities for independent writing. A substantial number of teachers (approximately 18.8%) indicated they did not believe any specific practices were effective for teaching writing skills remotely. When asked what could support writing skills among students who may have fallen behind due to the pandemic, the most common responses were daily practice and small group or one-on-one instruction. Other responses included parent support, live instruction, explicit instruction, and re-teaching basic skills. Approximately 14% of teachers indicated that they were concerned nothing would help catch up students who had fallen behind.
3.2.4 Teacher Responses to Questions About Special Populations (Fall 2020)
Regarding students with disabilities, approximately 25% of teachers reported that students with disabilities were spending less time in the general education class than they would in typical years; however, an additional 25% of teachers reported that students with disabilities were spending more time in the general education class than they would in typical years. In contrast, the majority of teachers (58.5%) reported that achievement gaps for students with disabilities were larger than they were in previous years. This pattern of results indicates that although the pandemic disproportionately affected achievement for students with disabilities, it did not appear to have a dramatic effect on inclusion in general education classrooms for students with disabilities in the Fall 2020 semester.
4 Discussion
The purpose of this study was to characterize how the COVID-19 pandemic impacted instruction delivered to students in the spring and fall 2020 semesters, as well as teachers’ perceptions of the pandemic’s impact on student achievement. Our results suggested that although many students were not receiving daily direct instruction in academic skills during school closures in spring 2020, schools and districts were able to shift remarkably quickly to provide elementary school teachers with the supports needed to be prepared to deliver both remote and in-person instruction in an altered instructional environment during the 2020–2021 academic year. According to teachers’ perspectives, district and school efforts to shift the way instruction was delivered during the 2020–2021 academic year were successful at improving the overall quality of remote instruction and mitigating opportunity gaps.
Despite the tremendous efforts of teachers and schools, there is cause for alarm about the number of students who participated in academic instruction during the Spring 2020 semester. Based on our survey results, we estimated that between 7.2 million and 11.6 million elementary school students in grades K-5 may not have received any live remote instruction (e.g., video conference) during the pandemic in spring 2020. We estimated this range using a combination of U.S. Census data from 2018 and our current survey results, with margin of error calculations. According to our estimations of U.S. Census data (United States Census Bureau, 2018), there were more than 24 million students in grades K-5 in 2018 (ranging from 24.0 million to 24.2 million), which provides a conservative estimate for the number of students in grades K-5 in 2020. We then considered that 0.71% of teachers reported that their schools did not provide any remote instruction or learning activities for students. Next, we considered that 12.9% of teachers reported that they did not provide any live instruction, and of those that did, teachers reported that nearly a quarter of their students (24%) never attended remote learning. We used our margin of error estimates of ± 3.5% on each of these percentages to calculate our ranges. Our estimate of teachers was similar to an estimate from Education Week that approximately 23% of students were essentially “truant” during COVID-19-related school closures (EdWeek Research Center, 2020). Even if we consider that our sample may have overestimated the percentage of students who missed instruction, and use 23% as an estimate instead, we would still estimate approximately 6.9 million students did not access live remote instruction during spring 2020 at the low end of the range.
The large impacts of school closures and associated remote instruction are seen through teacher report that only 50% of students were ready to transition to their class at the beginning of the 2020–2021 school year. Regression analyses from fall 2020 indicated that low-income students, students with disabilities, and non-white students were those who were more likely to not have the skills needed to transition to the next grade level when school closures happened in Spring 2020, indicating disproportionate impacts of the pandemic on the most vulnerable students. However, it appears that teachers may have been aware of these disproportionate impacts, as analyses also indicated that teachers with greater percentages of students from low-income backgrounds were more likely to provide frequent direct instruction in academic skills.
Most teachers indicated that achievement gaps in reading and mathematics were larger in fall 2020 than they would be in typical years; however, these changes were not associated with instructional model, classroom demographics, and student readiness to begin the Fall 2020 semester. This is consistent with projections made by researchers (Kuhfeld et al., 2020) as well as our findings that many teachers were unable to provide daily instruction in mathematics skills during school closures in spring 2020. Research from other countries on impacts of the COVID pandemic corroborate our findings, as Engzell et al. (2021) reported that the amount of learning loss that occurred in the Netherlands corresponded directly to the amount of time schools were closed, indicating little to no learning during school closure and remote instruction.
Although teachers who completed our survey in fall 2020 reported that achievement gaps were larger than in prior years, most teachers did not report providing supplemental intervention in academic skills to more students than in previous years. There are several possible explanations for this pattern of results. First, it is possible that larger achievement gaps do not necessarily correspond to more students being behind, but instead reflect some students falling further behind than they would have been in a typical year. Alternatively, it is possible that there are more students who are struggling with academic skills, but that teachers do not have the time or resources to provide intervention to additional students. Regardless of the circumstances, it is alarming that many students struggling in academic content areas are not receiving appropriate support. Kuhfeld et al. (2020) projected that there would be greater variability in students’ academic skills at the beginning of the Fall 2020 semester than there would in typical years. If this is indeed the case, addressing such variability represents an additional challenge for teachers with limited resources, and teachers may choose to allocate resources to those students with the most significant educational need.
Given prior evidence that summer loss is greater for the most vulnerable students (Quinn and Polikoff, 2017), we expected that effects of school closures would disproportionately affect those students (e.g., students from low-income backgrounds, students with disabilities, English language learners). Findings from Engzell et al. (2021) and our surveys suggest this was the case. For example, teachers who responded to our surveys indicated that achievement gaps for students with disabilities were larger in fall 2020 than they would be in typical years. Although approximately 93% of teachers reported that they or another teacher at their school were providing accommodations for students with disabilities in spring 2020, one particularly surprising finding was that approximately 4% of teachers reported that neither they nor other teachers at their school were providing accommodations for students with disabilities. The remaining 3% of teachers reported that it was unknown whether anyone was providing accommodations for their students with disabilities. Similarly, less than 60% of teachers reported providing accommodations for English language learners in spring 2020. Many teachers are not prepared to meet the needs of English language learners (García et al., 2010), and lack of access to instruction may have dire consequences for these students.
Although data from the spring 2020 survey indicated that students from low-income backgrounds were less likely to receive live instruction, data from the fall 2020 survey suggest that teachers and schools may have been able to mitigate these opportunity gaps during the fall 2020 semester, to some degree. For example, although there was a negative correlation between the percentage of students eligible for free/reduced price lunch and the frequency of live meetings in spring 2020, in fall 2020 there was no association between the percentage of students eligible for free/reduced price lunch and teacher perceptions of how achievement gaps in fall 2020 differed from previous years. In other words, teachers with larger numbers of low-income students were not more likely to report observing larger achievement gaps in fall 2020 compared to prior years. Similarly, there was not a consistent pattern of responses to suggest that service delivery models in fall 2020 differed substantially for students with disabilities when compared to previous years.
Efforts that schools made to prepare teachers for delivery of remote instruction appear to have been effective, according to teacher report. Although most teachers (69%) reported that they believed remote instruction delivered in spring 2020 was ineffective or they were uncertain of its effectiveness, a large majority of teachers reported they believed their remote instruction in fall 2020 was more effective than it was in spring 2020. It is possible that increases in teacher perceptions of remote instruction are due to greater experience delivering remote instruction, but it is also worth noting that most teachers reported receiving professional development opportunities on delivery of remote instruction. Of 57 teachers who completed an open-ended question about the nature of training they were provided, 60% indicated they had access to online workshops, conferences, etc., or completed one or more full day professional development workshops to improve delivery of remote instruction. Despite these efforts, several teachers provided information about what could potentially make instruction more effective. Several ideas were brought up by multiple teachers, such as increased access to online resources, more small-group or one-on-one instruction, more delivery of materials to students, a well-developed online curriculum, or a dedicated virtual/remote teacher.
4.1 Limitations
The samples of teachers who completed our surveys were generally representative of the population of teachers in the U.S. However, a large percentage of teachers did not respond to the surveys. Although responders and non-responders were similar in key demographic variables (e.g., SES, school setting, school type, grade level taught), our low response rate could result in selection bias, if teachers who responded to the surveys differed from other teachers in ways that we were unable to quantify (e.g., political beliefs, personal investment in how the COVID pandemic impacted students).
Additionally, Survey 1 was conducted when teachers may not have had access to their student records. In many cases, we asked teachers to estimate numbers that they may have been able to provide more accurately under other circumstances. For example, three teachers emailed us to indicate that they did not know the free or reduced-price lunch status of the students in their classrooms. It is also possible that the teachers may have under- or over-estimated other descriptive variables for their classrooms or were unaware of some of the school services provided by resource and special education teachers. Although all surveys require some level of estimation, and we expect any errors would be randomly distributed and potentially balanced across the sample, there is the potential for some mis-estimation in our findings.
A third limitation relates to the wording in some of our survey questions. For example, although teachers reported whether achievement gaps were larger or smaller than prior years, we do not have a baseline estimate of the magnitude of achievement gaps for each teacher in a typical year. For example, a teacher who works in a school district that is relatively segregated across SES lines may always observe large achievement gaps between students from low- and high-income backgrounds, leaving little opportunity for the pandemic to alter the magnitude of the achievement gaps.
4.2 Implications and Conclusions
The results of our surveys have important implications for future delivery of remote instruction. Although another pandemic of the same magnitude as the COVID-19 pandemic may not emerge soon, we do not know how the current pandemic will continue to evolve and affect student learning. Moreover, knowledge of how remote learning and school closures impact delivery of instruction and achievement has important implications for other emergency situations, in which schools may need to temporarily close (e.g., following natural disasters). Some teachers reported that combining independent work with live instruction was most effective for promoting academic achievement during remote instruction, and several teachers stressed the importance of evidence-based instructional practices, such as explicit instruction, for supporting students who fall behind during school closures. For example, when describing what would be effective for helping struggling students catch up, one teacher stated that “We need time to diagnose … deficiencies and set up instruction that fills in the gaps. Just pushing forward will not eliminate the gap, we have an opportunity to really do something for kids that can help. This is a question we should be discussing at each (meeting) instead of what is next in the pacing guide.” These types of comments from teachers, alongside other responses, highlight the need for screening and individualized or small group supports that are tailored to students’ individual instructional needs. Although such an approach is always advisable to help struggling students, careful attention to students’ needs and aligning instruction with students’ strengths and weaknesses may be particularly important to reduce educational inequities caused by the pandemic.
Data Availability Statement
The raw data supporting the conclusion of this article will be made available by the authors, without undue reservation.
Ethics Statement
The studies involving human participants were reviewed and approved by the University of Nebraska-Lincoln Human Subjects Committee. The patients/participants provided their written informed consent to participate in this study.
Author Contributions
JG, MH, and JN) were equally responsible for the conduct of this research. All authors helped formulate the research questions to be included in surveys, assisted with survey distribution, data cleaning and analysis, and writing survey results for publication.
Conflict of Interest
The authors declare that the research was conducted in the absence of any commercial or financial relationships that could be construed as a potential conflict of interest.
Publisher’s Note
All claims expressed in this article are solely those of the authors and do not necessarily represent those of their affiliated organizations, or those of the publisher, the editors and the reviewers. Any product that may be evaluated in this article, or claim that may be made by its manufacturer, is not guaranteed or endorsed by the publisher.
References
Dillman, D. A. (2000). Mail and Internet Surveys: The Tailored Design Method. New York, NY: Wiley and Sons.
Educators for Excellence, (2020). Voices from the Virtual Classroom. Retrieved from https://e4e.org/sites/default/files/voices_from_the_virtual_classroom_2020.pdf.
EdWeek Research Center (2020). Survey Tracker: Monitoring How K-12 Educators Are Responding to Coronavirus. Education Week. Available at: https://www.edweek.org/ew/articles/2020/04/27/survey-tracker-k-12-coronavirus-response.html.
Engzell, P., Frey, A., and Verhagen, M. D. (2021). Learning Loss Due to School Closures during the COVID-19 Pandemic. Proc. Natl. Acad. Sci. U S A. 118, e2022376118. doi:10.1073/pnas.2022376118
García, E., Arias, M. B., Harris Murri, N. J., and Serna, C. (2010). Developing Responsive Teachers: A challenge for a Demographic Reality. J. Teach. Education 61, 132–142. doi:10.1177/0022487109347878
Gross, B., and Opalka, A. (2020). Too many Schools Leave Learning to Chance during the Pandemic. Seattle, WA: Center for reinventing public education. Technical Report https://www.crpe.org/sites/default/files/final_national_sample_brief_2020.pdf.
Hamilton, L. S., Kaufman, J. H., and Diliberti, M. (2020). Teaching And Learning through a Pandemic: Key Findings from the American Educator Panels Spring 2020 COVID-19 Surveys. Data Note. Rand Corporation. Retrieved from https://www.rand.org/pubs/research_reports/RRA168-2.html.
Hobbs, T. D. (2020). Some School Districts Plan to End the Year Early, Call Remote Learning Too Tough. New York, NY: The Wall Street Journal. Retrieved from https://wsj.com/.
Hussar, B., Zhang, J., Hein, S., Wang, K., Roberts, A., Cui, J., et al. (2020). The Condition of Education 2020 (NCES2020-144). Washington, DC: U.S. Department of EducationNational Center for Education Statistics. Retrieved from https://nces.ed.gov/pubs2020/2020144.pdf.
Kuhfeld, M., Soland, J., Tarasawa, B., Johnson, A., Ruzek, E., and Liu, J. (2020). Projecting the Potential Impact of COVID-19 School Closures on Academic Achievement. Educ. Res. 49, 549–565. doi:10.3102/0013189x20965918
Little, R. J. A. (1988). A Test of Missing Completely at Random for Multivariate Data with Missing Values. J. Am. Stat. Assoc. 83, 1198–1202. doi:10.1080/01621459.1988.10478722
Little, T. D., and Rhemtulla, M. (2013). Planned Missing Data Designs for Developmental Researchers. Child. Dev. Perspect. 7, 199–204. doi:10.1111/cdep.12043
Marshall, D. T., Shannon, D. M., and Love, S. M. (2020). How Teachers Experienced the COVID-19 Transition to Remote Instruction. Phi Delta Kappan 102, 46–50. doi:10.1177/0031721720970702
Morrissey, T. W., Hutchison, L., and Winsler, A. (2014). Family Income, School Attendance, and Academic Achievement in Elementary School. Dev. Psychol. 50, 741–753. doi:10.1037/a0033848
Natanson, H. (2020). Failing Grades Spike in Virginia’s Largest School System as Online Learning gap Emerges Nationwide. Washington Post. Available at: https://www.washingtonpost.com/local/education/fairfax-schools-more-failing-grades/2020/11/24/1ac2412e-2e34-11eb-96c2-aac3f162215d_story.html.
Preciado, M., Velasquez, I., and Ward, M. (2020). What We’re Learning: COVID 19 and Education: Notable Findings and Data Sources. Seattle, WA: Gates Foundation. Available at: https://gpp.gatesfoundation.org/news-and-insights/articles/what-we-re-learning-covid-19-and-education-notable-findings-and-data-sources.
Quinn, D. M., and Polikoff, M. (2017). Summer Learning Loss: What Is it, and what Can We Do about it? Washington, DC: Brookings Institution.
University of Southern California (2020). Understanding America Study. Available at: https://covid19pulse.usc.edu (Retrieved on December 10, 2020).
Keywords: COVID-19, survey research, elementary school, academic instruction, remote instruction
Citation: Goodrich JM, Hebert M and Namkung JM (2022) Impacts of the COVID-19 Pandemic on Elementary School Teachers’ Practices and Perceptions Across the Spring and Fall 2020 Semesters. Front. Educ. 6:793285. doi: 10.3389/feduc.2021.793285
Received: 11 October 2021; Accepted: 31 December 2021;
Published: 18 January 2022.
Edited by:
Itab Shuayb, Lebanese American University, LebanonReviewed by:
Ken Reimer, University of Winnipeg, CanadaBasma Frangieh, Université Clermont Auvergne, France
Copyright © 2022 Goodrich, Hebert and Namkung. This is an open-access article distributed under the terms of the Creative Commons Attribution License (CC BY). The use, distribution or reproduction in other forums is permitted, provided the original author(s) and the copyright owner(s) are credited and that the original publication in this journal is cited, in accordance with accepted academic practice. No use, distribution or reproduction is permitted which does not comply with these terms.
*Correspondence: J. Marc Goodrich, marcgoodrich@tamu.edu