Predicting attribution of letter writing performance in secondary school: A machine learning approach
 Monique Boekaerts1
  Mariel F. Musso
 Eduardo C. Cascallar
- 1Faculty of Social and Behavioural Sciences, Leiden University, Leiden, Netherlands
- 2Department of Experimental Psychology, University of Granada, Granada, Spain
- 3Interdisciplinary Center for Research in Mathematical and Experimental Psychology (CIIPME), National Council for Scientific and Technical Research (CONICET), Buenos Aires, Argentina
- 4Faculty of Psychology and Educational Sciences, KU Leuven, Leuven, Belgium
The learning research literature has identified the complex and multidimensional nature of learning tasks, involving not only (meta) cognitive processes but also affective, linguistic, and behavioral contextualized aspects. The present study aims to analyze the interactions among activated domain-specific information, context-sensitive appraisals, and emotions, and their impact on task engagement as well as task satisfaction and attribution of the perceived learning outcome, using a machine learning approach. Data was collected from 1130 vocational high-school students of both genders, between 15 and 20 years of age. Prospective questionnaires were used to collect information about the students’ home environment and domain-specific variables. Motivation processes activated during the learning episode were measured with Boekaerts’ on-line motivation questionnaire. The traces that students left behind were also inspected (e.g., time spent, use of provided tools, content, and technical aspects of writing). Artificial neural networks (ANN) were used to provide information on the multiple interactions between the measured domain-specific variables, situation-specific appraisals and emotions, trace data, and background variables. ANN could identify with high precision students who used a writing skill, affect, and self-regulation strategies attribution on the basis of domain variables, appraisals, emotions, and performance indicators. ANN detected important differences in the factors that seem to underlie the students’ causal attributions.
Introduction
Self-regulation plays a key role in learning and studies have shown that the level of self-regulation exhibited by students of varying ages is correlated with their learning performance (Efklides, 2011). The term self-regulated learning (SRL) is made up of three interrelated components, namely the Self, regulation, and learning. These three components refer to three large bodies of knowledge that together describe the cognitive processes that make up learning; the metacognitive knowledge and strategies that regulate the learning process, and the self-related motivational processes that control the allocation of resources across on-task and off-task activities during task engagement.
Although several research groups proposed complex, integrated models to understand and research aspects of SRL (Boekaerts and Niemivirta, 2005; Zimmerman and Schunk, 2011; Schunk and Zimmerman, 1998), they have downplayed the effect that cognitions and emotions have on task engagement and on the students’ perception and interpretation of the learning outcome (Boekaerts and Pekrun, 2016). The Dual Processing SRL model was an attempt to fill that gap (e.g., Boekaerts and Niemivirta, 2005). This dynamic and situated, holistic framework allows researchers to explore the interactions between multiple intertwined aspects of SRL. However, the complexity of the processes involved in SRL needs a more robust and accurate methodological approach which has been successful in addressing problems in education and the social sciences (e.g., Fong et al., 2009; Kanakana and Olanrewaju, 2011; Abu Naser, 2012; Boekaerts et al., 2012; Musso et al., 2012, 2013, 2020; Rodriguez-Hernandez et al., 2021). A machine-learning method, artificial neural networks (ANN), has been shown to be very effective in the study of problems consisting of a large number of variables in complex, non-linear, and poorly understood interactions (Cascallar et al., 2015). These ANN are powerful classifiers which build plausible architectures to explore the participation of variables involved in the modeling of a problem (Neal and Wurst, 2001; White and Racine, 2001; Detienne et al., 2003). They accomplish this by constructing a mathematical relationship by “learning” the patterns of all inputs from each of the individual cases used in training the network, while more traditional approaches assume a particular form of relationship between explanatory and outcome variables and then use a variety of fitting procedures to adjust the values of the parameters in the model. This methodological approach allowed us to analyze a large number of factors without the usual parametric constraints and helped to understand the effect of individual differences in cognitive and self-regulation variables on the factors being studied, taking into account all their complex interactions.
The critical feature of Dual Processing Self-Regulated Learning model are the non-stop cognitive appraisals and their concomitant emotions. The model posits that cognitive appraisals – based on activated metacognitive and motivational beliefs in interaction with situation-specific perceptions of cues in the environment – are triggered when students are confronted with a learning activity. These non-stop appraisals direct and re-direct the focus of attention in the SR system. When appraisals and emotions are dominantly positive (e.g., students feel self-efficacious, value the task), a learning intention is formed and attention is directed to the learning activity itself: i.e., students are then on the mastery pathway, meaning that working memory (WM) capacity as well as (meta) cognitive strategies are used to improve learning outcome and they are mindfully engaged in the learning task. On the other hand, when appraisals and emotions with respect to the task are mainly negative (e.g., students experience low control, feel anxious, bored, or irritated), attention is directed away from the task, because they are more concerned with their well-being than with learning. Task-irrelevant scenarios are then dominant: students are on the wellbeing pathway. Boekaerts and Corno (2005) described two different self-regulation strategies that students may use to get back to the mastery pathway, namely emotion regulation and volition. Emotion regulation may dampen the emotional arousal and make switches to the mastery pathway more probable (see also Boekaerts, 2011; Boekaerts and Pekrun, 2016), while volitional strategies (also called good work habits), help students to protect their learning intention when difficult work must be completed, thus re-routing activities from the well-being to the mastery pathway (Wolters et al., 2013).
Arguing that motivation is contextualized, Boekaerts (1999, 2011) clarified that stored general and domain-specific motivational beliefs are activated by situational cues and brought into WM where they influence the students’ current cognitions and feelings. For example, when a student is faced with a new math task, prior domain knowledge will be activated including a self-efficacy judgment and this will give rise to a situation-specific competence appraisal. In other words, Boekaerts (1999) differentiated between domain-specific variables (in this study: self-efficacy) and situational appraisals generated during a learning episode (in this study: competence appraisal). She identified several types of appraisals, including value appraisal, competence appraisal, perceived difficulty appraisal, effort appraisal pre and post, perceived difficulty appraisal, and satisfaction appraisal. Seegers and Boekaerts (1993) hypothesized and found that situational appraisals mediated the influence of domain-specific motivational beliefs on students’ emotional state and on their intended task engagement at the start of a math task. Crombach et al. (2003) substantiated these findings. They showed that an identical appraisal model fitted the data collected with respect to gender and different school subjects, and that this model was stable over a 6-month period. Hence, results with the Online Motivation Questionnaire (Boekaerts, 2002) (OMQ) demonstrated that the effort that students are prepared to invest in a learning activity and their emotional state at the start of a learning episode are largely dependent on the way they appraise the task in situ. In a similar vein, Boekaerts et al. (2003) showed that domain-specific (trait-like) motivation beliefs – measured separately from the task – interacted with their cognitive appraisals (measured during the task) and jointly affected the students’ attribution of the perceived learning outcome.
Beliefs about the Self in relation to specific content or subject-matter are motivational in nature. These motivational beliefs have been studied extensively, including the students’ basic attitudes and motives in relation to tasks in a specific domain, their epistemic beliefs, self-efficacy judgments, and outcome expectations, their value and interest beliefs, attributions, goal orientation, control beliefs, and perceived availability of social support. To date there is a vast body of literature documenting that domain-specific motivational beliefs are significantly linked to the level and quality of students’ information processing and their metacognitive strategy use (Pintrich, 2000; Volet, 2001; Hofer and Pintrich, 2002; Efklides, 2011; Pekrun and Perry, 2014) as well as to their use of volitional strategies (Boekaerts and Corno, 2005; Wolters et al., 2013).
Attributions refer to knowledge structures that help students to interpret the cause of a successful or unsuccessful learning outcome. Although we fully acknowledge the importance of the three causal dimensions advocated by Weiner and his colleagues (see Zimmerman and Kitsantas, 2002; Graham and Taylor, 2014; Weiner, 2018) and we value the insights gained from studying ability and effort attributions as part of a student’s attributional style, we applauded Zimmerman and Kitsantas’ (2002) contextualized approach to study students’ attributions. Since the turn of the century, researchers in Educational Psychology have placed greater emphasis on strategy use as a reason for success and failure in academics. They explained that a strategy attribution differs from both an ability (internal, stable, uncontrollable) and effort (internal, variable, controllable) attribution in the sense that it prompts students to reflect on the reasons why a perceived poor outcome was not controllable and on whether this is seen as a persistent shortcoming or as fluctuating over time. For example, Chan and Moore (2006) clarified that students who explain failure in terms of low ability do not seem to be aware that they used ineffective strategies and that different strategies may exist to achieve a better result. In a similar vein, students who use an effort attribution (e.g., I did poorly because I did not put in a lot of effort) may not be able to differentiate between ‘some effort,’ ‘a lot of effort,’ and ‘great effort’ and they may not have a clue what exactly they need to do differently next time to improve their performance. By contrast, students who refer to a specific strategy to explain their result on a recent exam (e.g., ‘I did poorly because I did not read the instruction twice’; or, ‘I did well, because I checked all my answers twice before handing in the exam’) realize that they can improve their performance next time by choosing more effective strategies, or by requesting help in the use of specific skills before taking the exam.
Importantly, students who use a strategy attribution to explain failure on an exam do not feel loss of control as do students who use a low ability attribution or a ‘the domain is too difficult for me’ attribution. Zimmerman and Kitsantas (2002) and Zimmerman and Cleary (2009) reported that an attribution to effort that explicitly involved the use of SR strategies that the students had intended to use – and hence perceived as controllable – is more motivating because it helps learners to sustain perceptions of efficacy and invest effort to succeed during periods of suboptimal performance. It also protects them against getting entwined in negative emotion spirals as well as from negative reactions from others (see also Wolters et al., 2013).
Given that Weiner’s attribution theory was modeled on the basis of trait-like measures, it captures the regularities in students’ characteristic causal attributions and is largely blind to the interaction of activated attributional beliefs with perceived contextual constraints and affordances. Yet, considerable literature from mainstream psychology has revealed that discrete emotions, grounded in cognitive appraisals, influence many different cognitive processes, such as content and depth of information processing, evaluative judgments, causal thinking and decision making (Keltner et al., 2013). This leads to the inevitable conclusion that traditional attribution research does not provide sufficient information on the impact of situational appraisals and emotions on students’ causal explanation of the learning outcome.
In this respect it was interesting to note in a recent review of Weiner’s attribution framework that Graham (2020) described the attribution process as a sequence that begins with a perceived outcome which is interpreted as a success or a failure. These cognitions may trigger outcome-dependent emotions, such as happiness, sadness, pride, shame, regret, or guilt. Our way of conceptualizing the attribution process is somewhat different. Based on the Dual Processing SR model, we propose that the attribution process begins as soon as students are faced with a learning task. More specifically, their perception of the learning outcome and its concomitant causal attribution begins to take shape during the learning episode and is affected by the multiple cognitive appraisals and emotions – and their interactions – that take place while the learning episode is unfolding.
The present study
Research questions
Two main sets of questions were raised at the start of the study. First, how does the quality of the internal environment that students create in the goal setting and striving stage, influence their causal ascription of the perceived writing outcome? The second question pertains to the prediction and determination of the specific contribution of motivational variables, at the domain level and at the situation-specific level, to students’ causal ascriptions. The third question is: can we predict with high precision who will use/will not use a specific attribution using neural network (ANN) models?
We hypothesized that students who perceive their writing outcome as ‘good’ are more likely to endorse items that describe specific writing skill (WS) as an explanation of their self-perceived successful performance than students who perceive their writing outcome as ‘poor.’ We also hypothesized that the students’ scores on the metacognitive and motivation beliefs scales – measured independently from the writing episode – would interact with their appraisals and emotions during the learning episode and would make a significant contribution in the prediction of their attributions. More specifically, our hypotheses were:
(1) Students who perceive their writing outcome as poor (the poor group) will endorse less WS attribution items to explain their writing outcome compared to students who perceive their writing outcome as good (the good group).
(2) The poor group will also endorse less SR strategy attributions than the good group.
(3) The poor group will endorse more affect related attributions than the good group.
(4) The poor group will score significantly lower on reported domain-specific beliefs (self-efficacy, metacognitive skills, epistemic beliefs, and will be more dependent on external regulation) than the good group.
(5) Compared with the good group, the poor group will score significantly lower on competence, value, and effort appraisal when starting the writing task. Also, their scores will be significantly lower on effort, difficulty, and satisfaction appraisal after doing the task than those of the good group.
(6) The poor group will display significantly lower scores than the good group on positive emotions and higher scores on negative emotions, both pre and post letter writing.
(7) Both domain variables and context-sensitive appraisals and emotions will contribute significantly to the prediction of vocational students’ attribution of the perceived writing outcome.
(8) Neural network (ANN) classificatory analysis can identify with a high degree of accuracy students who endorse/do not endorse a specific attribution on the basis of the predictive weights assigned to the inputs.
(9) The pattern of these weights will expose the primary indicators of the quality of the internal model (QIM) that lead to an attribution to adequate/inadequate WS, adequate/inadequate self-regulation strategies, and experienced positive or negative affect.
Measuring the quality of the internal affective model
In order to study the quality of the internal environment that students create during the learning episode we modeled the numerous factors that constitute the students’ mental framework during a learning episode. Based on the Dual Processing Self-Regulation Model, we hypothesized that students have access to and activate relevant domain information from long-term memory (e.g., the motivation and metacognitive beliefs and strategies described in section “Materials and methods”) and bring it into WM. This activated information interacts with the students’ non-stop cognitive appraisals of the task and the concomitant emotions (see Theoretical Framework section). Based on these interactions the students make (un)conscious decisions about their expectancies, targets, and the type of engagement that they are willing to commit themselves to. They also judge their progress, evaluate the learning outcome, and make attributional judgments.
Measuring the students’ attributions in a context-sensitive way
Drawing on Zimmerman’s empirical findings we reasoned that the attribution items should not only be contextualized; the items should also be formulated in the students’ own words so that they would truly understand what they were asked to endorse and perceive the attribution items as relevant to the current learning activity. This would encourage them to reflect on the concrete and functional aspects of the rather abstract effort and ability causal judgments proposed by Weiner. Both effort and ability are in fact umbrella terms that leave a lot of room to be interpreted in a questionnaire. For example, effort may be interpreted as a sign of involvement and engagement, but also as a sign of low ability in response to perceived difficulty, low self-efficacy, and anxiety. Hence, we revised the attribution items of the OMQ in terms of the concrete skills and SR strategies that the students had supposedly mastered in the classroom (according to the teacher group [Tgroup]), and therefore could draw on during the learning episode. For example, we theorized that students who endorsed the attribution item “I did poorly on this writing task, because I cannot formulate correct sentences in Dutch” communicate three things. First, that they are aware that this skill is relevant and important to do the task, second that they currently (still) lack that skill, and third that it is possible to acquire that skill.
Materials and methods
Participants
Participants in this research were 1,130 secondary vocational school students in four schools across the Netherlands (Females = 65.9%). The students’ age ranged from 15 to 22 years old. Secondary vocational education is a 4-year vocationally orientated (high school) stream providing a practical orientation to higher vocational studies or to vocational training. Students followed different study programs, including commerce, care and welfare, nursing, administration, and educational assistant. As part of an obligatory Dutch language course, they had received training in writing for communication. A week before the actual study began; students were told by their native language teacher that their class would participate in a nation-wide writing session to assess the quality of their Dutch WSs on-line. All students were native speakers and agreed that their writing products would be sent automatically to the server of the university, where researchers would examine the quality of the writing process and product. They were informed, however, that this was not a high-stake national assessment, that the data would be analyzed anonymously, but that feedback would be provided to the participating teachers at the class level so that they could improve the writing performance of their students.
Instruments and measures
On advice from a teacher group that helped us to set up and monitor the study (TGroup) a specific authentic learning activity was selected for two reasons. First, students in vocational school had been trained to write letters, such as an application letter for a holiday job, as part of the curriculum and they also had training in the use of metacognitive strategies to regulate their own learning. Hence, we hypothesized that the students would be able to mentally represent a writing activity in WM in terms of its controllability and value (competence and value appraisal) and would have a good idea about the effort involved to obtain a good writing outcome. Second, a letter writing task has a clear beginning and end so that the OMQ could be embedded around the letter writing activity. This would allow us to observe the unfolding learning process, record their appraisals and emotions, and examine trace data. Because students’ appraisals and emotions may change during the writing episode due to increasing or decreasing task demands or disturbing processing burdens, the OMQ measures appraisals and emotions in the beginning of the learning episode (here: after briefly inspecting the task and listening to the instructions), and again at the end of the learning activity (here: just before reporting on the quality of the writing outcome and endorsing the different causal attributions).
Four different types of variables were measured in this study, namely (1) background variables, (2) motivation beliefs and metacognitive strategies, (3) on-line appraisal and emotions, and (4) performance indicators.
Background variables
They included gender, highest education of mother/father, perceived quality of mother’s and father’s WSs, number of friends in school, daily writing habits (frequency of using cell phone, emails to friends, dairy use), feeling comfortable in class, and frequency doing homework with friends). These variables were measured with 5-point Likert-type scales.
Motivation beliefs and metacognitive strategies
They were measured with conventional trait-type scales, independently of the letter writing session. The scales captured (1) students’ self-efficacy judgment, (2) goal orientation, (3) epistemological beliefs, (4) access to and use of meta-cognitive strategies, and (5) (in) dependence on external regulation. Since most of these scales are context-insensitive, which leaves us blind as to how the students interpret the items, we encouraged students to key into familiar clusters of learning activities they had participated in as part of the Dutch language course, such as reading and text processing lessons, writing lessons, and Dutch correspondence. They had to answer sets of 5-point Likert items on-line focusing on these familiar parts of the course. The items were translated from existing questionnaires. Self-efficacy was assessed with the validated self-efficacy scale of the MSLQ (Pintrich and De Groot, 1990). The scale consists of Likert items with anchor points 1 = totally disagree, 5 = totally agree (a high score means agreement that the variable is present). An example item is ‘Compared to others in this class, I expect to do well.’ Goal orientation and Metacognitive strategies were assessed with the Goal Orientation and Learning Strategy Survey (GOALS-S), developed and validated by Dowson and McInerney (2004). All items were 5-point Likert scales with 1 = strongly disagree to 5 = strongly agree. The items that assessed goal orientation split up into mastery goal orientation (e.g., I want to understand what I learn at school), performance orientation (e.g., I want to impress others with my performance), well-being goal orientation (e.g., I want to get on with my classmates) and career orientation goals (e.g., I want to get a good job). Metacognitive strategies included elaboration (e.g., I try to understand how the things I learn in school fit together), planning (e.g., I always think beforehand what I want to say), and monitoring (e.g., I often stop to see what part of my work is not satisfactory yet). Dependency on External regulation was measured with a subscale of Vermunt’s (1998) validated Inventory of Learning Styles (ILS). An example item is: If I do not understand the instructions, I wait for the teacher to explain what I have to do). Epistemological beliefs were measured with Schommer’s (1990) validated test. An example item is: ‘I think that knowledge is stable.’ A high score on this scale implies that the students view knowledge as certain, fixed, and objective.
Cognitive appraisals and emotions
After presenting the writing task and its instructions but before starting on the task several appraisals were measured with Boekaerts’ on-line motivation questionnaire (OMQ: Boekaerts, 2002). This fine-grained measurement technique was validated by Boekaerts and her colleagues (see section “Introduction”) and includes: competence appraisal (n = 4; alpha = 0.84; e.g., ‘I can do this writing task well’), value appraisal (task attraction, n = 1; e.g., ‘this writing task is interesting’ and perceived utility, n = 3; alpha = 0.79; e.g., ‘I consider this writing task relevant for me’), and effort appraisal pre (n = 3; alpha = 0.82; e.g., ‘I will do the writing task attentively’). At the same time their positive emotions pre (N = 3; alpha = 0.83; e.g., I feel good, at ease, pleasant) and negative emotions pre (n = 3; alpha = 0.69; e.g., I feel bored, irritated, tired) as well as anxiety pre (n = 1; I feel nervous) were assessed. At task completion, students again reported on the same emotions [positive emotions post (n = 3; alpha = 0.87); negative emotions post (n = 3; alpha = 0.74) and anxiety post (n = 1), effort appraisal post (n = 1; e.g., ‘I wrote this letter attentively’), difficulty level appraisal (n = 1, e.g., ‘I found it hard to write this letter’), satisfaction appraisal (n = 1; e.g., ‘I feel satisfied about the writing activity’), and outcome appraisal (n = 1; e.g., ‘What is the quality of the letter you wrote?’: very poor, poor, good or very good)]. Finally, they causally attributed the perceived writing outcome (e.g., I did poorly because I did not know what to say in the letter/I did well because I can structure a letter well). A three-step procedure was used to design the contextualized attribution items. We first asked the TGroup to list the possible reasons that their students give for a poor and good writing performance, focusing especially on their use of WSs and self-regulation strategies. Second, we tested these formulations with students in vocational school, asking them to help us reformulate the items in their own words and extend the list if they thought that important reasons for explaining success and failure in learning outcomes were missing. Third, we extended Boekaerts’ OMQ with these items, incorporating them into the software program. Students who perceived their learning outcome as ‘good’ reflected on whether they agreed or disagreed that access and use of specific WSs, self-regulation strategies, and/or affect-related variables were the reason why they did well on the task. By contrast, students who perceived their writing outcome as ‘poor’ judged whether they agreed or disagreed that lack of specific WS, failure to use effective Self-regulation, and/or affect-related variables were the reason why they did not do well on the task. All appraisals, emotions, and attributions were measured on 5-point Likert scales with 1 = strongly disagree to 5 = strongly agree. Results of the exploratory factor analyses (EFA) of the attribution items carried out in the present sample, resulted in a three-factor model for both types of outcome appraisals (poor and good writing): WSs (α = 0.82/0.85, respectively); Self-regulation Strategies (α = 0.65/0.74), and Experienced Affect (α = 0.60/0.66). This structure was confirmed by a confirmatory factor analysis (CFA) providing construct validity to these ad-hoc attribution scales (for good outcome: CFI = 0.895; NFI = 0.883; RMSEA = 0.09; for poor outcome: CFI = 0.968; NFI = 0.965; RMSEA = 0.09). The internal consistency of the three scales was satisfactory in the good as well as in the poor group, even though there were few items in the Affect and Self-regulation Strategies1.
Performance indicators
They refer to the traces left behind by the students: the time spent writing the letter was recorded automatically in seconds (LAG) and an automatic count of the number of times students pushed any of the tool buttons provided the tool use score. Tools were available for word count, dictionary use, spelling checker, recall of instructions, recall of the newspaper article, request for model example of a letter to the editor (N = 6; alpha = 0.71). In order to establish levels of writing performance, two Angoff standard setting sessions were carried out (Cizek, 2006). First, Technical Score standards were established, followed by the Content Score standards. Next, performance level descriptions were written for highly competent/ competent/ and marginally competent letter writers, separately for technical writing and content aspects and a scoring key was designed, specifying what should be scored as well as the attached weights. The content score was based on whether students directed the letter at an audience, wrote a short introduction, referred explicitly to the article in the newspaper, mentioned the toilet seat, glue on the seat, compensation money, and gave their opinion on whether compensation should be given (conclusion). The number of arguments used and the correctness of the arguments, as well as the consistency in the direction of writing were also scored. The technical score was based on frequency of errors in spelling, conjugation, capitalization, punctuation, and choice of wrong words. Two teachers volunteered to complete the scoring sheet for all the letters. They were freed from teaching responsibilities and trained in using the scoring key until the inter-rater reliability was satisfactory (>0.80). Technical aspects were summarized in Z-score Technical and content aspect in the Z-score Content. A subset of student productions (25%) was double rated by both teachers in order to check overall interrater agreement (Content: Cohen’s κ = 0.69; Technical: Cohen’s κ = 0.75). However, the original score was maintained for the analyses.
Procedure
Ethical approval was obtained from the Research Ethics Committee of the Leiden University. The treatment of participants was in accordance with established ethical standards of the Ethical Principles of Psychologists and Code of Conduct (American Psychological Association, 2017). Parents were informed about the purpose of the study, and they gave written consent to participate in the study.
Students took part in three separate sessions, which took place in the computer room in their own school. Two of these sessions are important for the present study, namely the questionnaire session and the letter writing session. Each of these sessions lasted a maximum of 50 min. Students logged on to the Internet site of our research group and their responses and activities were automatically recorded. They could log off as soon as they were ready with the questionnaires or with the letter and were allowed to engage quietly in other activities in the same room. The questionnaire session consisted of completing several on-line questionnaires, including motivation beliefs and metacognitive strategies, and background variables. In the letter writing session students were presented on-line with a short article that had appeared in a local newspaper a few weeks before the study began (127 words). They were requested to read the story and write a letter to the editor of a local newspaper in the space provided, explaining in their own words why they thought the main character in the story was (or was not) eligible for financial compensation. They were informed that they should aim for approximately 100 words. The provided tool buttons were also explained, and they were encouraged to use them. The frequency of the students’ use of the different tools was recorded automatically. As soon as the writing task was introduced, on-line task probes appeared on screen and promptly rated the students’ appraisals and emotions. After finishing the letter, students appraised the result of the letter writing activity as very poor or poor (poor learning outcome appraisal) or as good/very good (good learning outcome appraisal). A poor outcome appraisal immediately produced a set of negatively formulated attribution items on screen (e.g., ‘I did poorly on this task, because I cannot formulate correct sentences’). A good outcome appraisal produced the equivalent set of positively formulated items (e.g., ‘I did well on this task, because I can formulate correct sentences’).
Analyses
One of the aims of our study was to explore how attributions take shape during the actual writing process. More specifically, we reasoned that the QIM that students create during the writing process may differ fundamentally and that this quality influences the type of attributions they make. We measured relevant background variables, motivation beliefs and metacognition pertaining to the language domain as well as situation-specific variables and obtained trace data. As several researchers have pointed out (see Cascallar et al., 2006) more traditional techniques such as multiple regression lose a lot of information due to multi-co-linearity and missing data.
The method chosen for the analysis was a multilayer perceptron neural network with a backpropagation algorithm. The aim of these ANN models is to maximize classification accuracy and work through the data in an iterative process until maximum accuracy is achieved, automatically modeling all interactions among variables (49 in our study). They are very robust general function estimators consisting of a multilayer network composed of nonlinear units, which computes its activation level by summing all the weighted activations it receives and which then transforms its activation into a response via a nonlinear transfer function, which establishes a relationship between the inputs and the weights they are assigned. A systematic framework proposed by Alyahyan and Düştegör (2020) was followed in order to implement and evaluate the models. Two development phases for each predictive classification model were carried out: training of the network and testing of the network that had been developed in the testing phase. During the training phase, the system evaluates the effect of the weight patterns on the precision of their classification of outputs, and then, through backpropagation, it adjusts those weights in a recursive fashion. It makes adjustments to the weights of the inter-correlations between the input variables in order to decrease the error with the known outcomes. Information is passed back through the network in many iterations, gradually changing the weights. As training progresses, the network becomes increasingly accurate in replicating the known outcomes. This process is repeated many times, and the network continues to improve its predictions until one or more of the stopping criteria have been met. A minimum level of accuracy can be set as stopping criterion, although additional stopping criteria may be used as well (e.g., number of iterations, amount of time) (Musso et al., 2012, 2013). During this training phase several models were attempted, and several modifications of the neural network hyperparameters were explored, such as: learning persistence (controlling the continuation of training after no significant change in weights), learning rate (the rate at which the ANN “learns” by controlling the size of weight and bias changes during learning), momentum (adds a fraction of the previous weight update to the current one, and is used to prevent the system from converging to a local minimum), number of hidden layers, stopping rules (when the network should stop “learning” to avoid over-fitting the current sample), activation functions (which define the output of a node given an input or set of inputs to that node or unit), and number of nodes. This modeling process continued until the desired levels of accuracy in the classifications were achieved, maximizing the accuracy of the final model. Once trained, the network can be applied, with its structure and parameters, to future cases (validation or holdout sample) for further validation studies and program implementation (Lippmann, 1987). As long as the basic assumptions of the population of persons or events that the ANN used for training is constant or varies slightly and/or gradually, it can adapt and improve its pattern recognition algorithms the more data it is exposed to in the implementations. The architecture of ANN models used in this study are presented in Table 1.
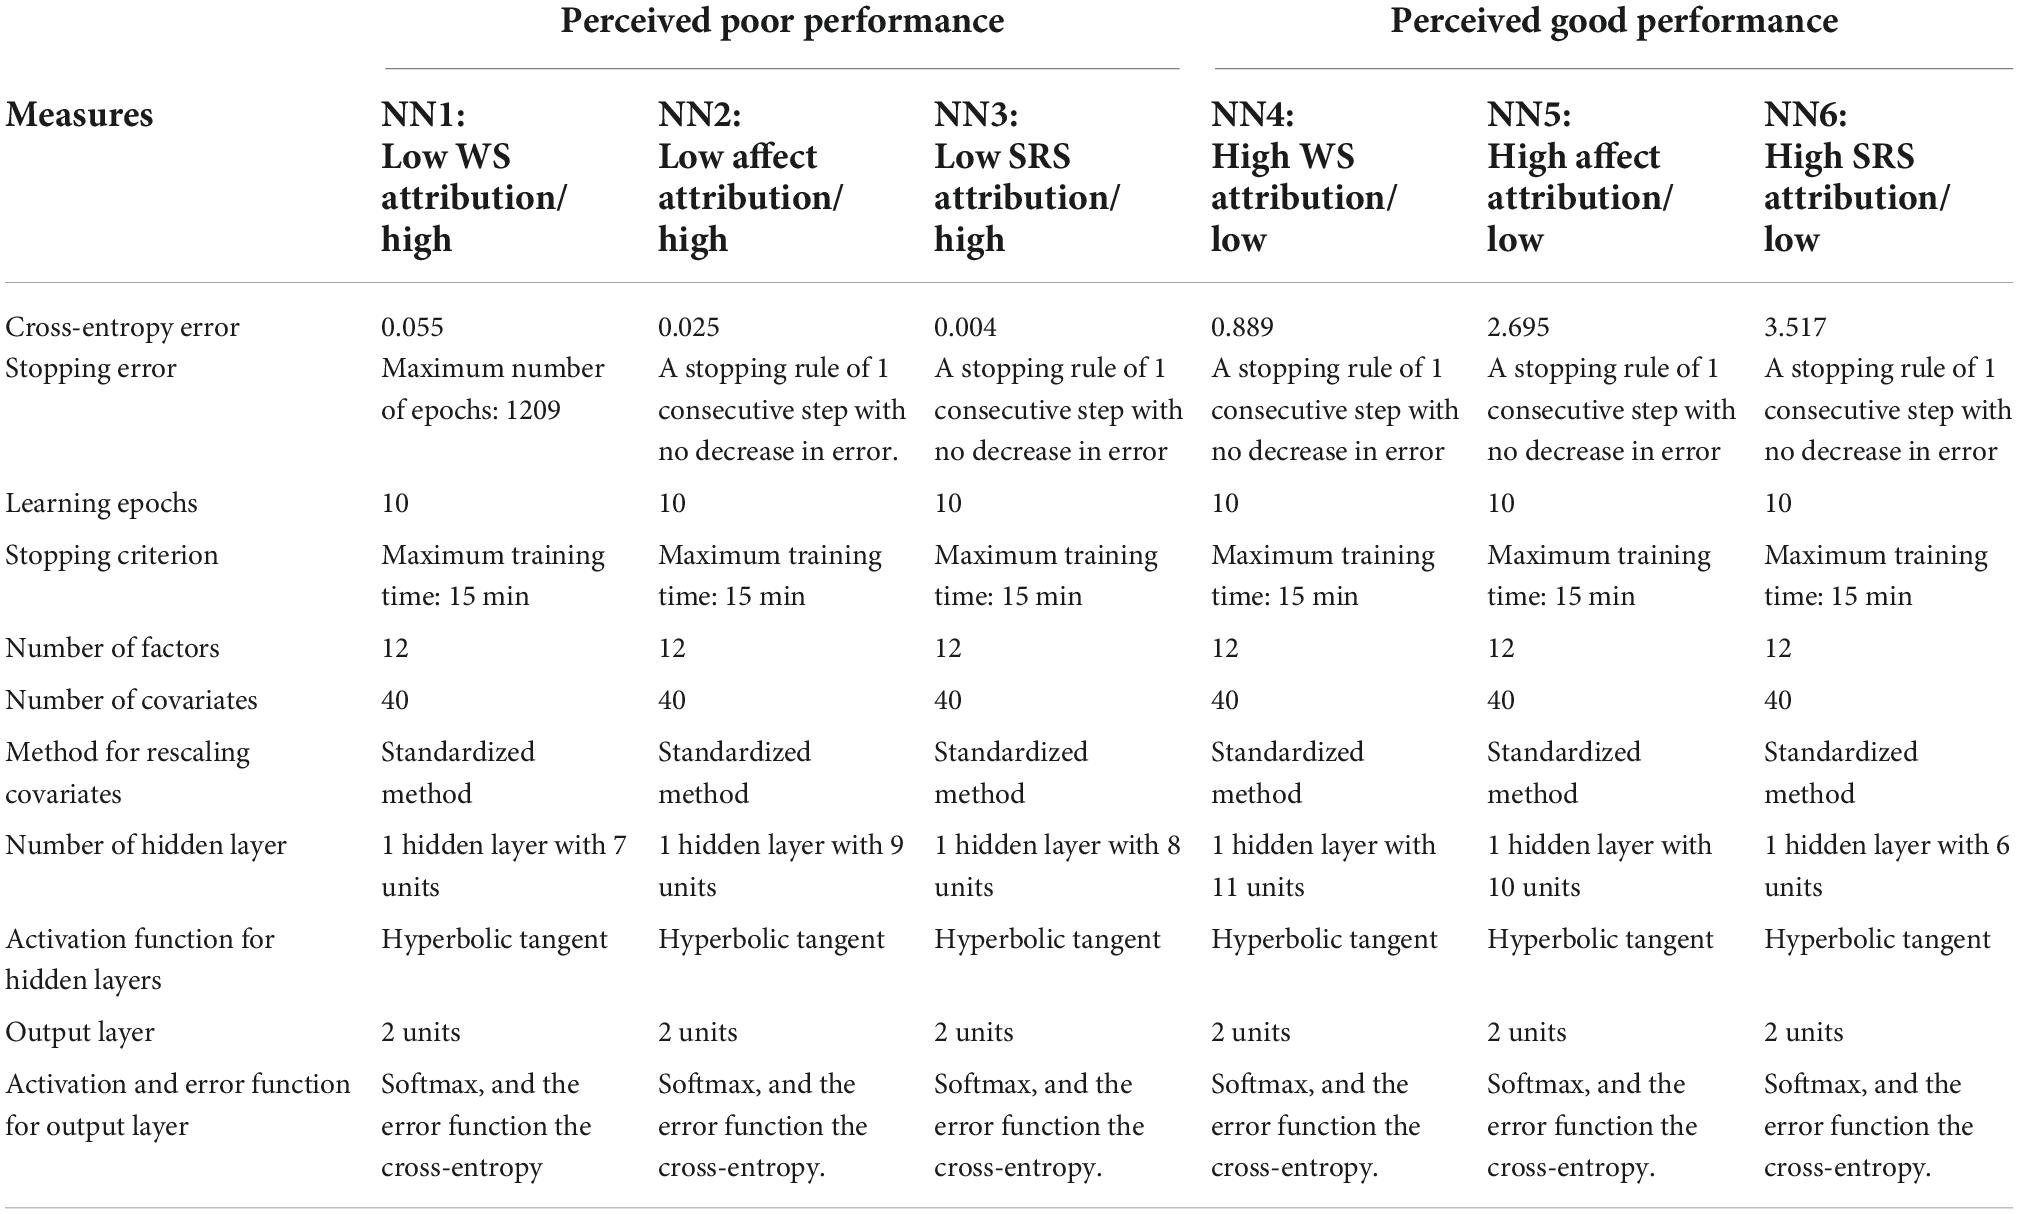
Table 1. Architecture of NN models.
Other machine learning algorithms (i.e., random forest, naïve Bayes, and gradient boosted trees) as well as more traditional statistical techniques (i.e., general linear model and logistic regression) were implemented using RapidMiner Studio Educational 9.10.011. Thus, the evaluation metrics of the ANNs could be compared against the other predictive methodologies.
Results
Attributions
A total of 886 students assessed their writing performance as ‘good’ (good group), and 244 assessed it as ‘poor’ (poor group). Given students were distributed into different groups according to their perceived writing outcome and attribution, principal component analyses were performed, separately for the poor and the good group. As can be seen in Tables 2, 3, three main factors emerged in the good as well as in the poor group. The first component grouped items that explain writing outcome in terms of technical WSs, such as ‘I did well (poorly) because I can (not) formulate correct sentences’ and ‘…because I (do not) know how to structure a letter.’ Hence, this component groups the six items that refer to the students’ writing ability in terms of the specific rules and regulations that are needed to write a good letter. This component was labeled WS. The second component consist of the three items that refer to the use of self-regulation strategies learned in class (SRS) to structure one’s own learning process, such as ‘… because I checked (did not check) the instructions’ and ‘… because I made / did not make use of the tools provided.’ Finally, the third component is made up of the two items that refer to the affective (or mood) state the student was in during the task, for example ‘…. because the task was (not) interesting’ and ‘… because I like (do not like) writing letters.’ This component was labeled ‘Experienced Affect’ (Aff). The inter-correlations between the three attribution components were low to modest, except for the correlation between Component 1 and Component 2, which was moderately strong for the good and the poor group (r = 0.43/0.36 respectively). This finding suggests that students who endorse a WS attribution may also use an SRS attribution to explain their writing outcome. The former attribution may be more stable than the latter, because it groups items that represent concrete and functional WSs that are used by the classroom teacher to communicate about their writing ability and lost marks. A high score on these components by students in the good group may inform us that they attribute their writing outcome to internal, stable, and controllable factors. On the other hand, a high score on this component by students of the poor group may reveal that they consider their current WSs as (still) inadequate to write a good letter (internal, variable, controllable attribution), whereas a low score by members of the latter group informs us that they may be unaware that they lack these essential skills.
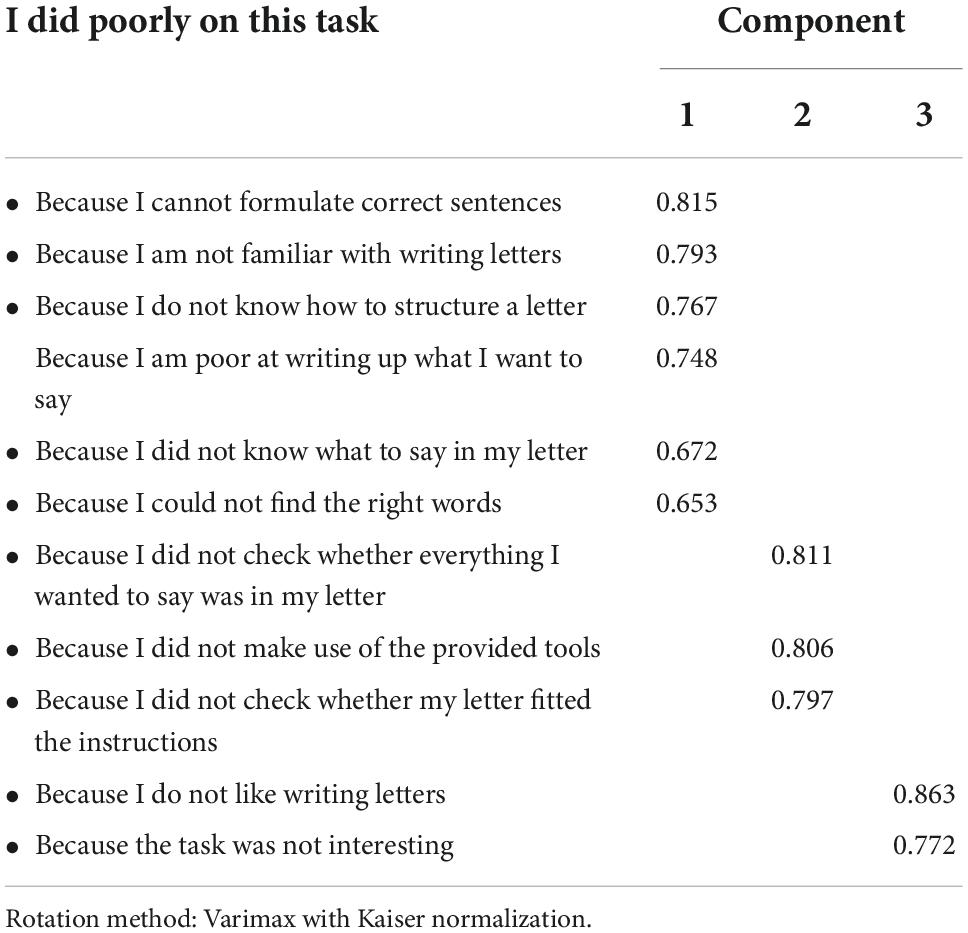
Table 2. Principal component analysis of the attribution items of students who perceived their writing outcome as ‘poor’.
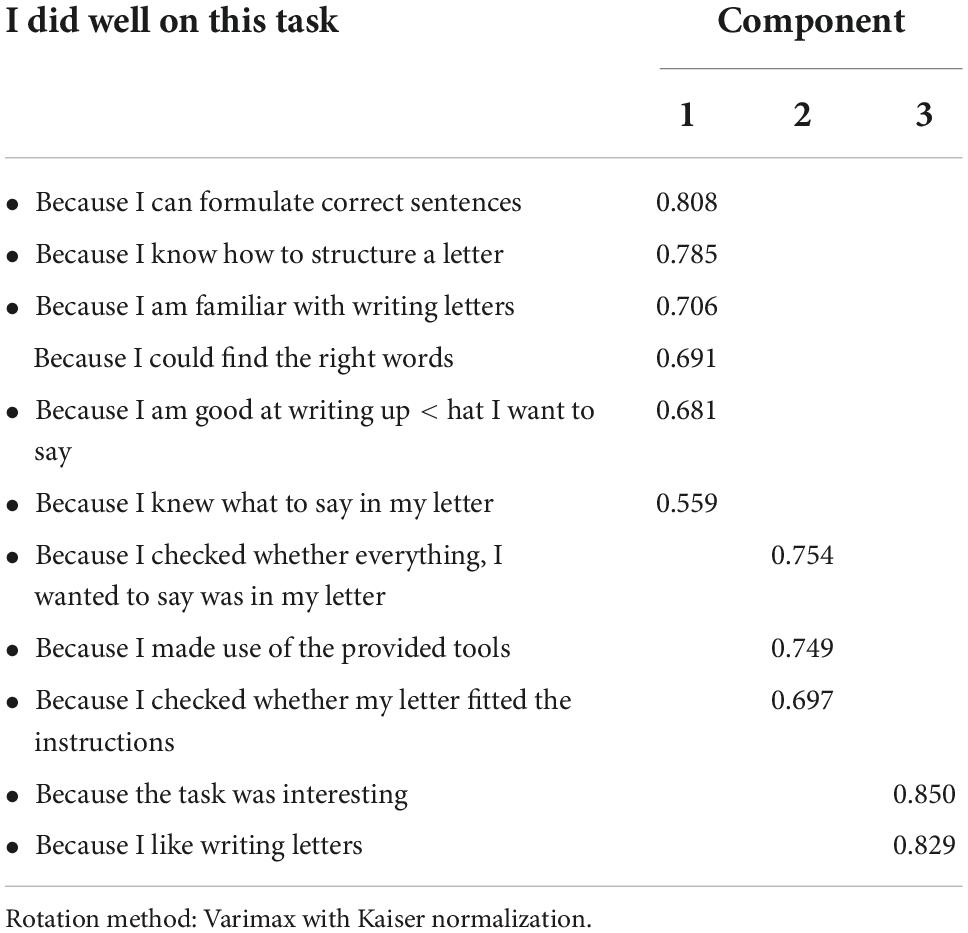
Table 3. Principal component analysis of the attribution items of students who perceived their writing outcome as ‘good’.
Quality of the internal model
Table 4 (the left half) presents the descriptive statistics for each one of the three attributions, and for all domain and situation-specific variables, along with the t-tests and Chi square tests, separately for the ‘good’ and the ‘poor’ group.
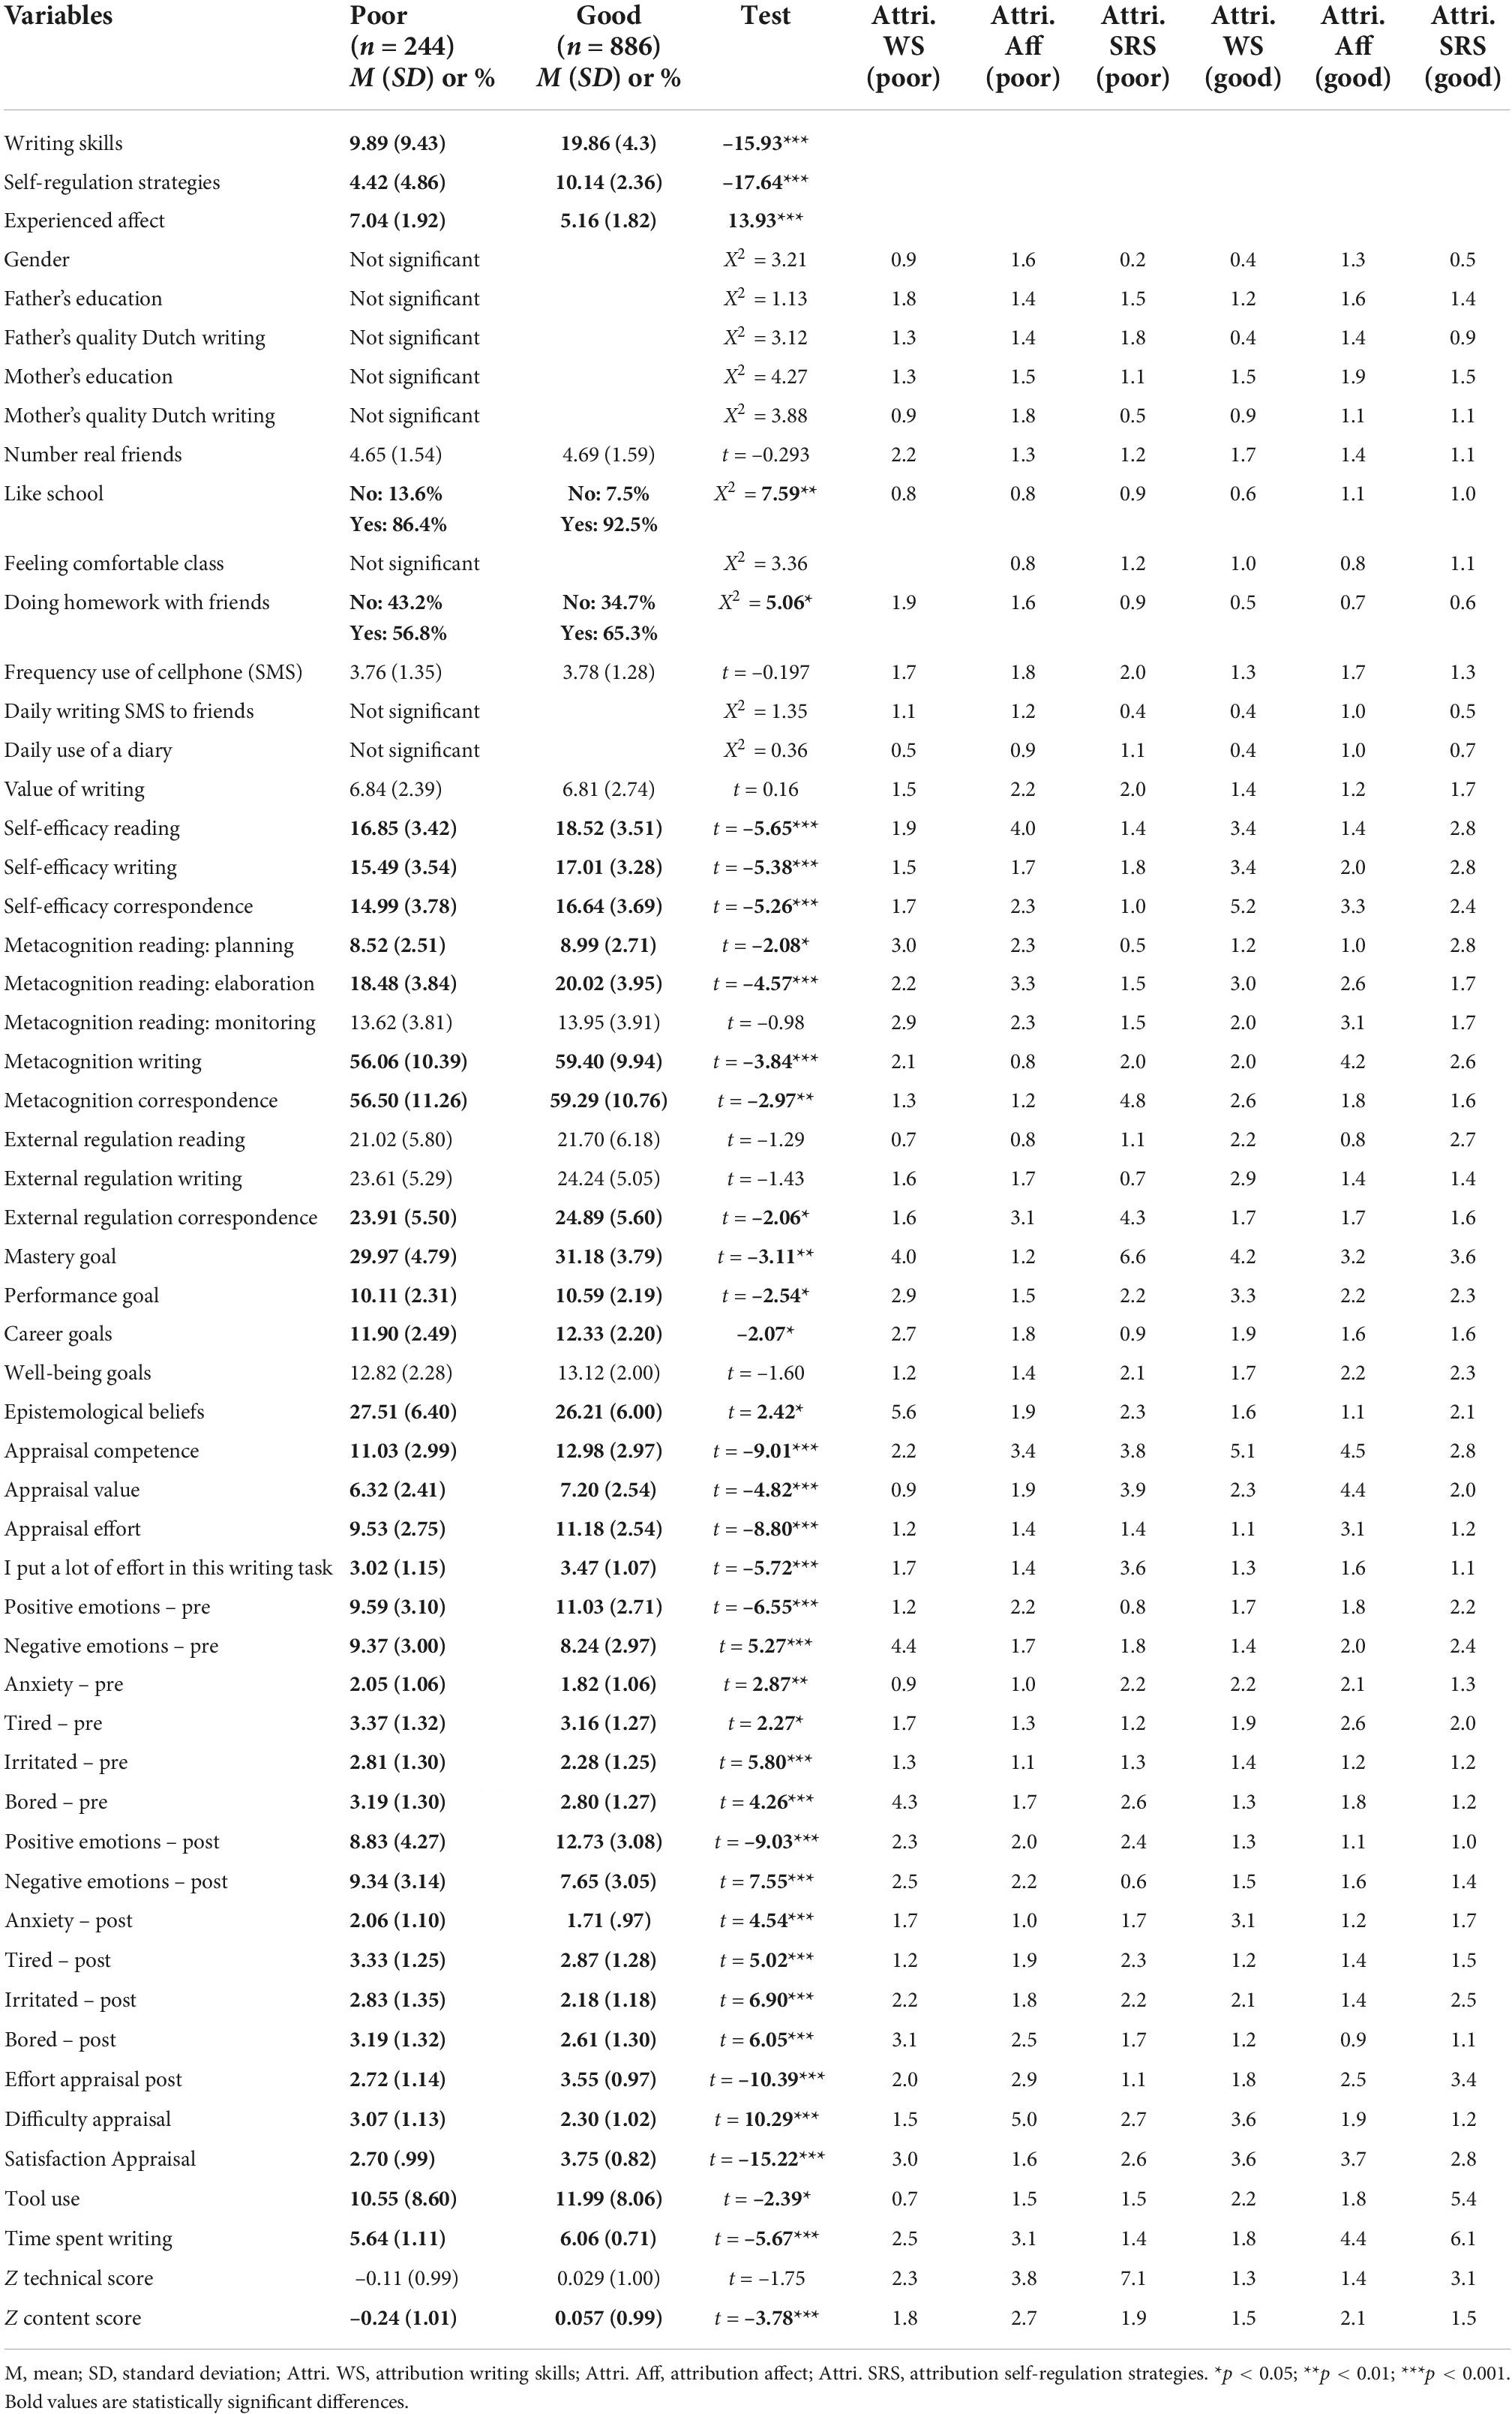
Table 4. Descriptive statistics and T-tests for all variables (left half), and predictive weights of the predictor variables in the six neural networks separately for the three good and the three poor groups (last six columns).
As hypothesized, students in the good groups endorsed significantly more WS attributions (M = 19.86; SD = 4.3/M = 9.89; SD = 9.43; t = –15.932; p < 0.001) and SRS attributions (M = 10.14; SD = 2.36/M = 4.42; SD = 4.86; t = –17.64; p < 0.001) than students in the poor group. Also, in line with our expectations, the poor group endorsed significantly more affect-related attributions (M = 5.16; SD = 1.82/M = 7.04; SD = 1.92; t = 13.938; p < 0.001). These findings suggest that students in the poor group are less aware that deficiency in specific WSs and/or in specific SR strategies may be the cause of an inadequate writing performance than students in the good group. We conclude that hypotheses 1–3 were confirmed.
In line with hypothesis 4 – students in the poor group score significantly lower than the good group on four important domain variables, namely self-efficacy, metacognition, mastery orientation, and epistemic beliefs. No significant differences were found for external regulation. Hypotheses 5 and 6 were also confirmed: the scores of the poor group differed significantly from the good group in the predicted direction.
Pearson product-moment correlations between the variables show moderate positive correlations between metacognition and mastery orientation goals in both groups (r = 0.40/0.44) and between metacognition and self-efficacy in the good group (r = 0.44/0.23). Self-efficacy (measured independently from the actual writing task) correlates only moderately with competence appraisal (r = 0.38/0.42) and weakly with the other appraisals. Effort appraisal before doing the task correlates moderately with value appraisal (r = 0.45/0.49) and with effort appraisal after doing the task (r = 0.48/0.47). Positive emotions before and after doing the task are strongly correlated (r = 0.72/0.75) and so are negative emotions (r = 0.60/0.59). Only in the poor group do negative emotions before starting on the task show a moderate inverse relationship with metacognition (r = –0.12/–0.40). This is also the case for negative emotions experienced after doing the task (r = –0.10/–0.40). Negative emotions reported when starting on the writing task coincided with a negative value appraisal (r = –0.33/–0.40), and with low effort appraisal before (r = –0.35/–0.41) and after the task (r = –0.25/–0.46). Noteworthy, satisfaction appraisal after doing the task shows a positive association with positive emotions experienced after the task in both groups (r = 0.33/0.38), whereas negative emotions experienced after the task are not associated with satisfaction appraisal in the poor group (r = –0.15/0.02).
In sum, the correlations between domain variables and appraisals and emotions assessed in situ are more pronounced in the poor group. Findings suggest that domain variables may differentially influence the “quality of internal model” that students in the poor and the good group create during a learning activity, and that this may influence how they perceive the learning outcome and explain it.
Predicting students’ causal ascription
A series of stepwise multiple regression analyses was conducted in order to examine the independent and joint effects of domain variables and situation-specific variables on reported attributions. As can be viewed from Table 5, 50% of the variance could be explained in WSg (adj. 49%), 35% (adj. 31%) in WSp, 28% (adj. 27%) in Affg, 22% (adj. 20%) in Affp, and 19% (adj. 18%) in SRSg. It is important to note that as many as 11–13 variables were excluded from the equation in the respective models due to multicollinearity and missing data. On inspecting the first columns, a four variable model proved to be the best solution to explain endorsement of having adequate WSs in the good group (WSg). Competence appraisal yielded the highest beta (β = 0.49), followed by satisfaction appraisal (β = 0.29), self-efficacy (β = 0.12) and presence of positive emotions during the task (β = 0.10). On inspecting the second column, we note again that a four-variable model best predicted the outcome. Value appraisal yielded de highest beta (β = 0.40), followed by satisfaction appraisal (β = 0.15), self-efficacy (β = 0.13), and negative emotions post (β = –0.12). Only 19% (adj. 18%) of the variance could be explained in SRSg and a four-variable model offered the best solution, with effort appraisal post (β = 0.22) as the best predictor, followed by effort appraisal pre (β = 0.18), metacognitive strategies (β = 0.18), and satisfaction appraisal (β = 0.12). Distinguishing features of the WSg attribution group are beliefs and appraisals about competence and positive emotions. In the Affg attribution group prominent predictors pointed to the significance of value appraisals jointly with self-confidence and low negative emotions. By contrast, in the SRSg attribution group invested effort was the dominant predictor together with access to metacognition. Hence, key words for predictive power are for WSg ‘feeling confident’ and experiencing positive emotions, for Affg value and absence of negative emotions, and for SRSg willingness to engage actively into the task in combination with having access to the relevant metacognitive strategies.
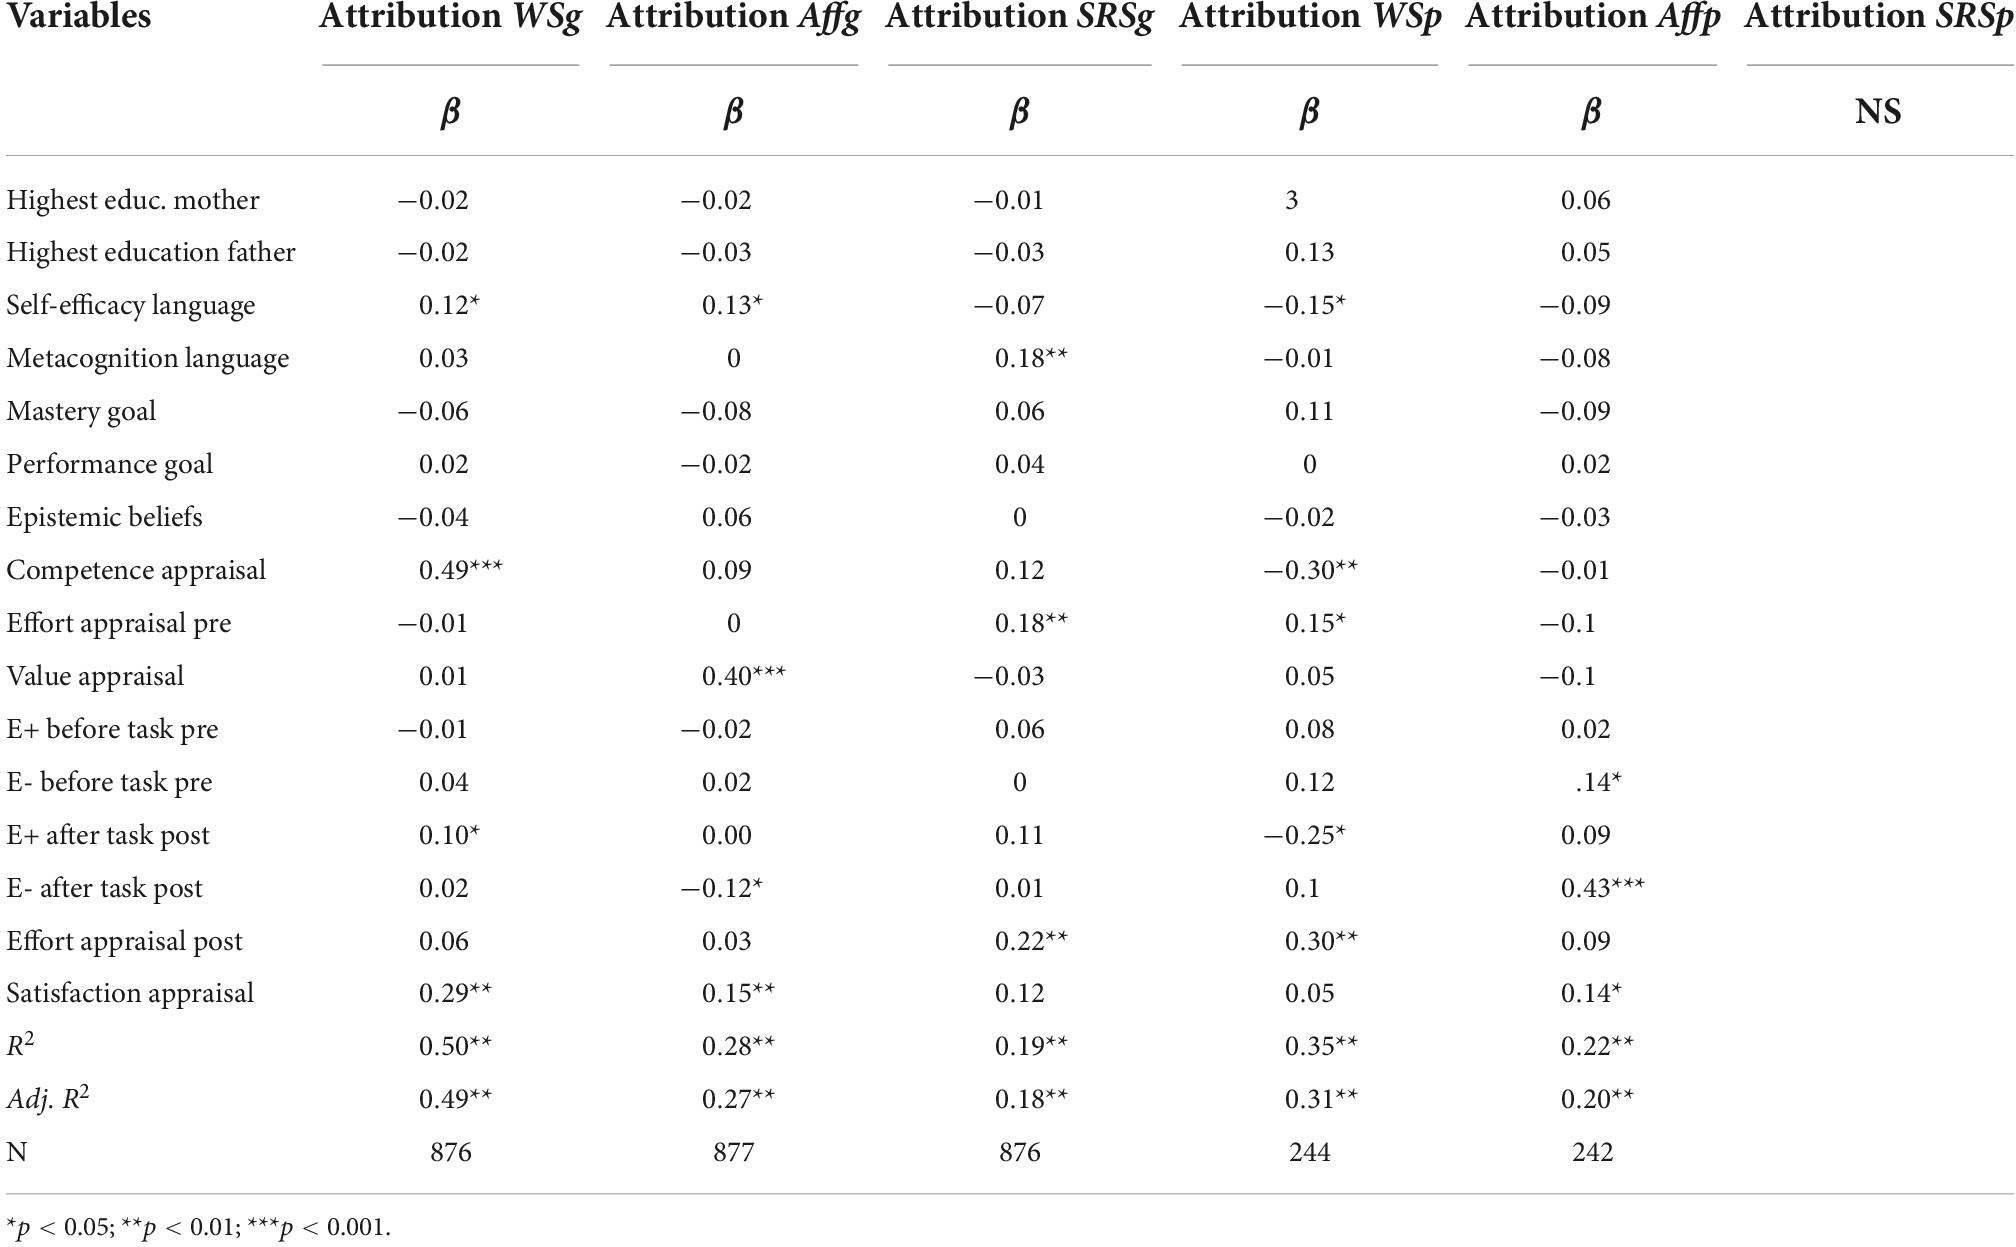
Table 5. Summary of stepwise multiple regressions predicting the three attributions for the Good (G) and the Poor (P) groups.
The fourth column of Table 5 reveals that 35% of the variance was explained in WSp with a five-variable model. Competence appraisal (β = –0.30), effort appraisal (β = 0.30), and positive emotions post (β = –0.25) were the prominent predictors. Meaningful betas were noted for self-efficacy (β = –0.15), effort appraisal pre (β = 0.15). Hence, it seems that the same predictors are involved in WSp as in WSg, but with opposite signs. Interestingly, effort post is also a prominent predictor in WSp signaling that these students perceive a poor outcome despite effort investment. Finally, notice that in the 5th column there is only one prominent predictor of Affp, namely negative emotions reported after doing the task (β = 0.43). Noteworthy is that metacognition reached significance in a model without negative emotions (β = –0.25). This implies that students who have low access to metacognitive strategies and experience negative emotions favor this type of attribution. There were no results for SRSp, because the regression analysis did not run. We conclude that hypothesis 7 was confirmed; both domain variables and situation variables contributed to the prediction of the students’ attribution in four out of six multiple regressions.
Using artificial neural networks methodology to predict students’ causal attributions based on multiple indicators of the quality of the internal model
Recall, that in the introduction, we proposed that both the perception of the learning writing outcome and its concomitant causal attribution come about through multiple cognitive and affective variables that are triggered during the learning episode. The results of the multiple regression analyses already revealed that interactions between domain variables and different appraisals and emotions differentially predict students’ attributions to WS, SRS, and Aff. Unfortunately, this technique loses a lot of information due to multi-co-linearity and missing data. Therefore, we used Neural Network methodology (ANN) to detect different patterns in the complex interactions between the variables. This technique is quite robust to missing data and can automatically model a large number of inputs, in a nonlinear way in a highly interconnected structure of variables.
Six ANNs models were developed as predictive systems, one for each of the three causal attributions in the poor group (ANN1, ANN2, and ANN3) and the good group (ANN4, ANN5, and ANN6). First, a training set was randomly selected from the data of all participants for each of the ANNs. During the training phase, the ANN was given the score on all the predictors as well as information on the outcome that we wished to predict (one of the respective causal attribution models) of roughly 60–70% of the students. In training, the ANN set out to develop a model of parameter weights using the predictor variables that could minimize the error with the output as specified in the model and provided to the analysis. It utilizes the vector matrix containing all predictor variables for each student and by recalculating the parameter weights between the predictors in the group who used the specific attribution; it develops a model that minimizes the error with the expected outcome. These patterns are modified as the data from each student is introduced into the analysis. The model therefore “learns” to distinguish between those patterns which characterize the group who endorsed the respective attribution (HIGH group) as contrasted to students who do not belong to this group (LOW group). Each ANN contained the same input predictors, some of them collapsed into subscales to maximize predictive classification.
Each ANN gives preliminary weights to each predictor and its interactions and changes these weights as its training progresses. Once the ANN model has reached a predetermined stopping criteria (e.g., desired level of accuracy), it runs the same model on a randomly selected sample of cases that was not in the training set. This is the testing phase, in which the same parameters obtained during training are applied to the new data set, not previously used. This testing set (30–40% of the total sample), randomly selected from the whole group (including both Poor and Good group members) is analyzed using the same model obtained in training of the ANN. In this step, though, the ANN is not supplied with information on the students’ attribution score. It considers the full pattern of inputs for each student and classifies the students by their type of attribution (yes belongs to the target attribution group or no does not belong to that group) based on the weights given to the predictors in the final version of the training stage. Thus, each ANN attempts to classify the whole testing sample into a HIGH and a LOW group, indicating the degree of certainty of each decision made for each student, only utilizing the predictive model generated during training. Finally, the ANN compares who belongs to each of the target groups in the testing sample and who does not, from the data that is known to the researchers, but not used in the testing phase. It calculates percentages of hits and misses and computes accuracy of classification for the target groups.
Table 6 presents several measures calculated in order to evaluate the quality of the solutions achieved by each ANN for the training and testing phases. Accuracy measures refer to the percentages of correct classifications in each ‘target’ group and the ‘other’ group (Low/High for each attribution type in the poor performance group; High/Low for each attribution type in the good performance group). As Table 6 shows, the six ANN models achieved high accuracy for each of the outputs (100% for the target groups, except for High Self-regulation Strategies group in the good performance students that achieved 87.5% of accuracy). Therefore, all the models have excellent “precision” and “recall” (or sensitivity) measures. Precision is the proportion of correctly identified targets, out of all elements identified as targets by the model. Sensitivity refers to the proportion of correctly identified targets, out of all targets actually presented in the set. Other quality measures are shown in the Table 6. Specificity is the proportion of correctly identified non-targets, out of all true-non-targets presented in the set, and this measure also achieved excellent levels for all the ANN. The F1-Score is the harmonic mean of Precision and Recall, taking both false positives and false negatives into account, and it was very good for all the models. F1 is a more comparable measure across studies with different proportions of cases in each class. The area under the ROC curve represents the true-positive rate (sensitivity) plotted as a function of the false-positive rate (100 – specificity) for different cut-off points and it can be viewed as a measure of the overall model performance across all possible thresholds, that is, how well it distinguishes between two groups.
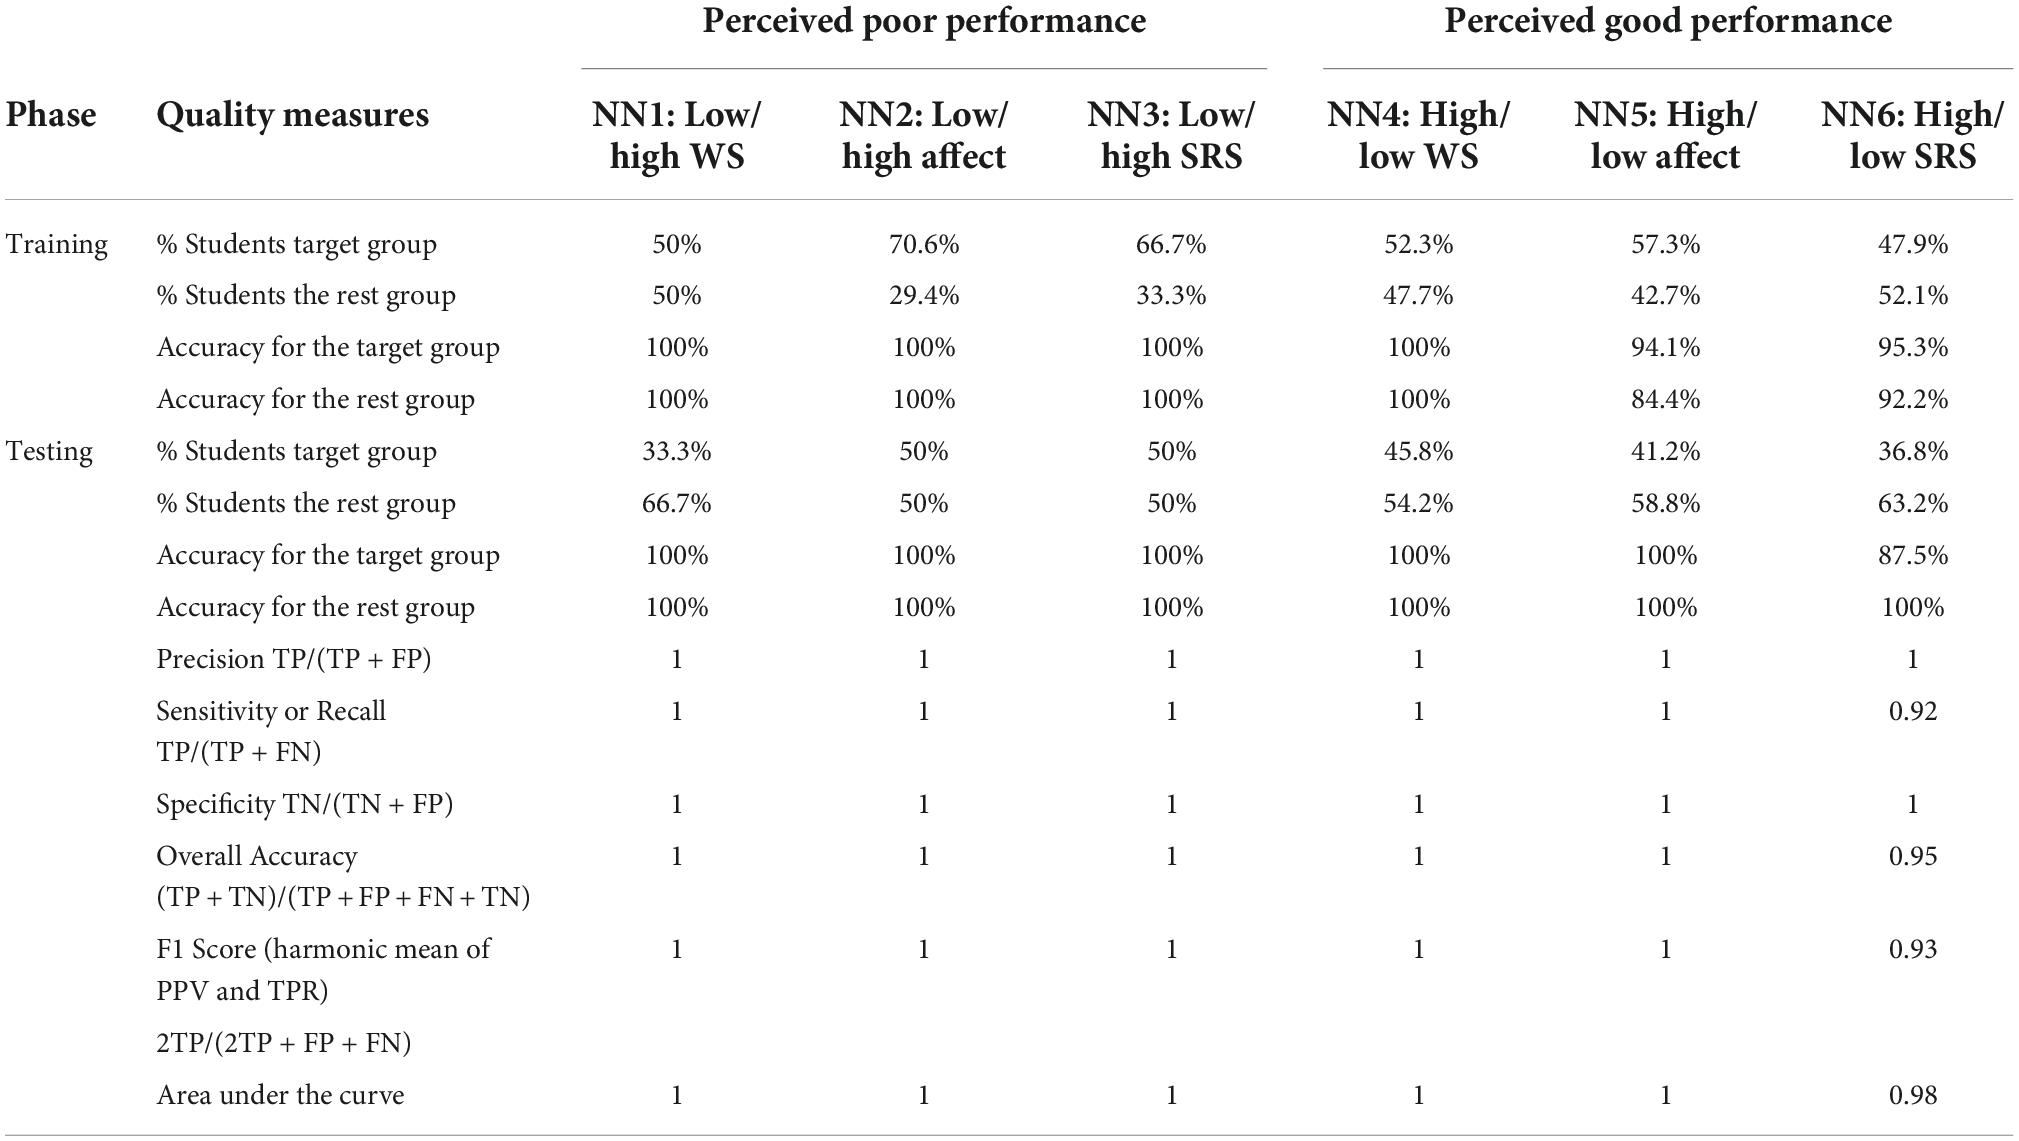
Table 6. Measures for ANN models.
Each ANN assigns weights to the predictors. The final solution also estimates the predictive weights in the model that results in the best classification. We examined the normalized weights for each ANN as well as the actual predictive weights, the latter being comparable across attributions. The actual weights are visually represented in Table 4, separately for the three Poor and the three Good groups. On comparing the weights that ANN assigned to the inputs in each model, we noted that the weights assigned to the background variables were rather low and also that students seemed to be classified on the basis of a different pattern of prominent predictors in each model. In the Supplementary Appendix, we present the results of the T-tests between the respective HIGH and LOW attribution groups. For example, between the students who perceived their writing outcome as poor and endorsed a WS attribution (target group; N = 78) and the students that ANN1 identified as ‘does not belong to the target group’ (contrast group; N = 64).
The quality measures of each machine learning model are shown in Table 7. Although the values for other machine learning algorithms classifying Low vs. High Attribution of Good WSs are acceptable, ANN outperforms all the other machine learning’s methods.
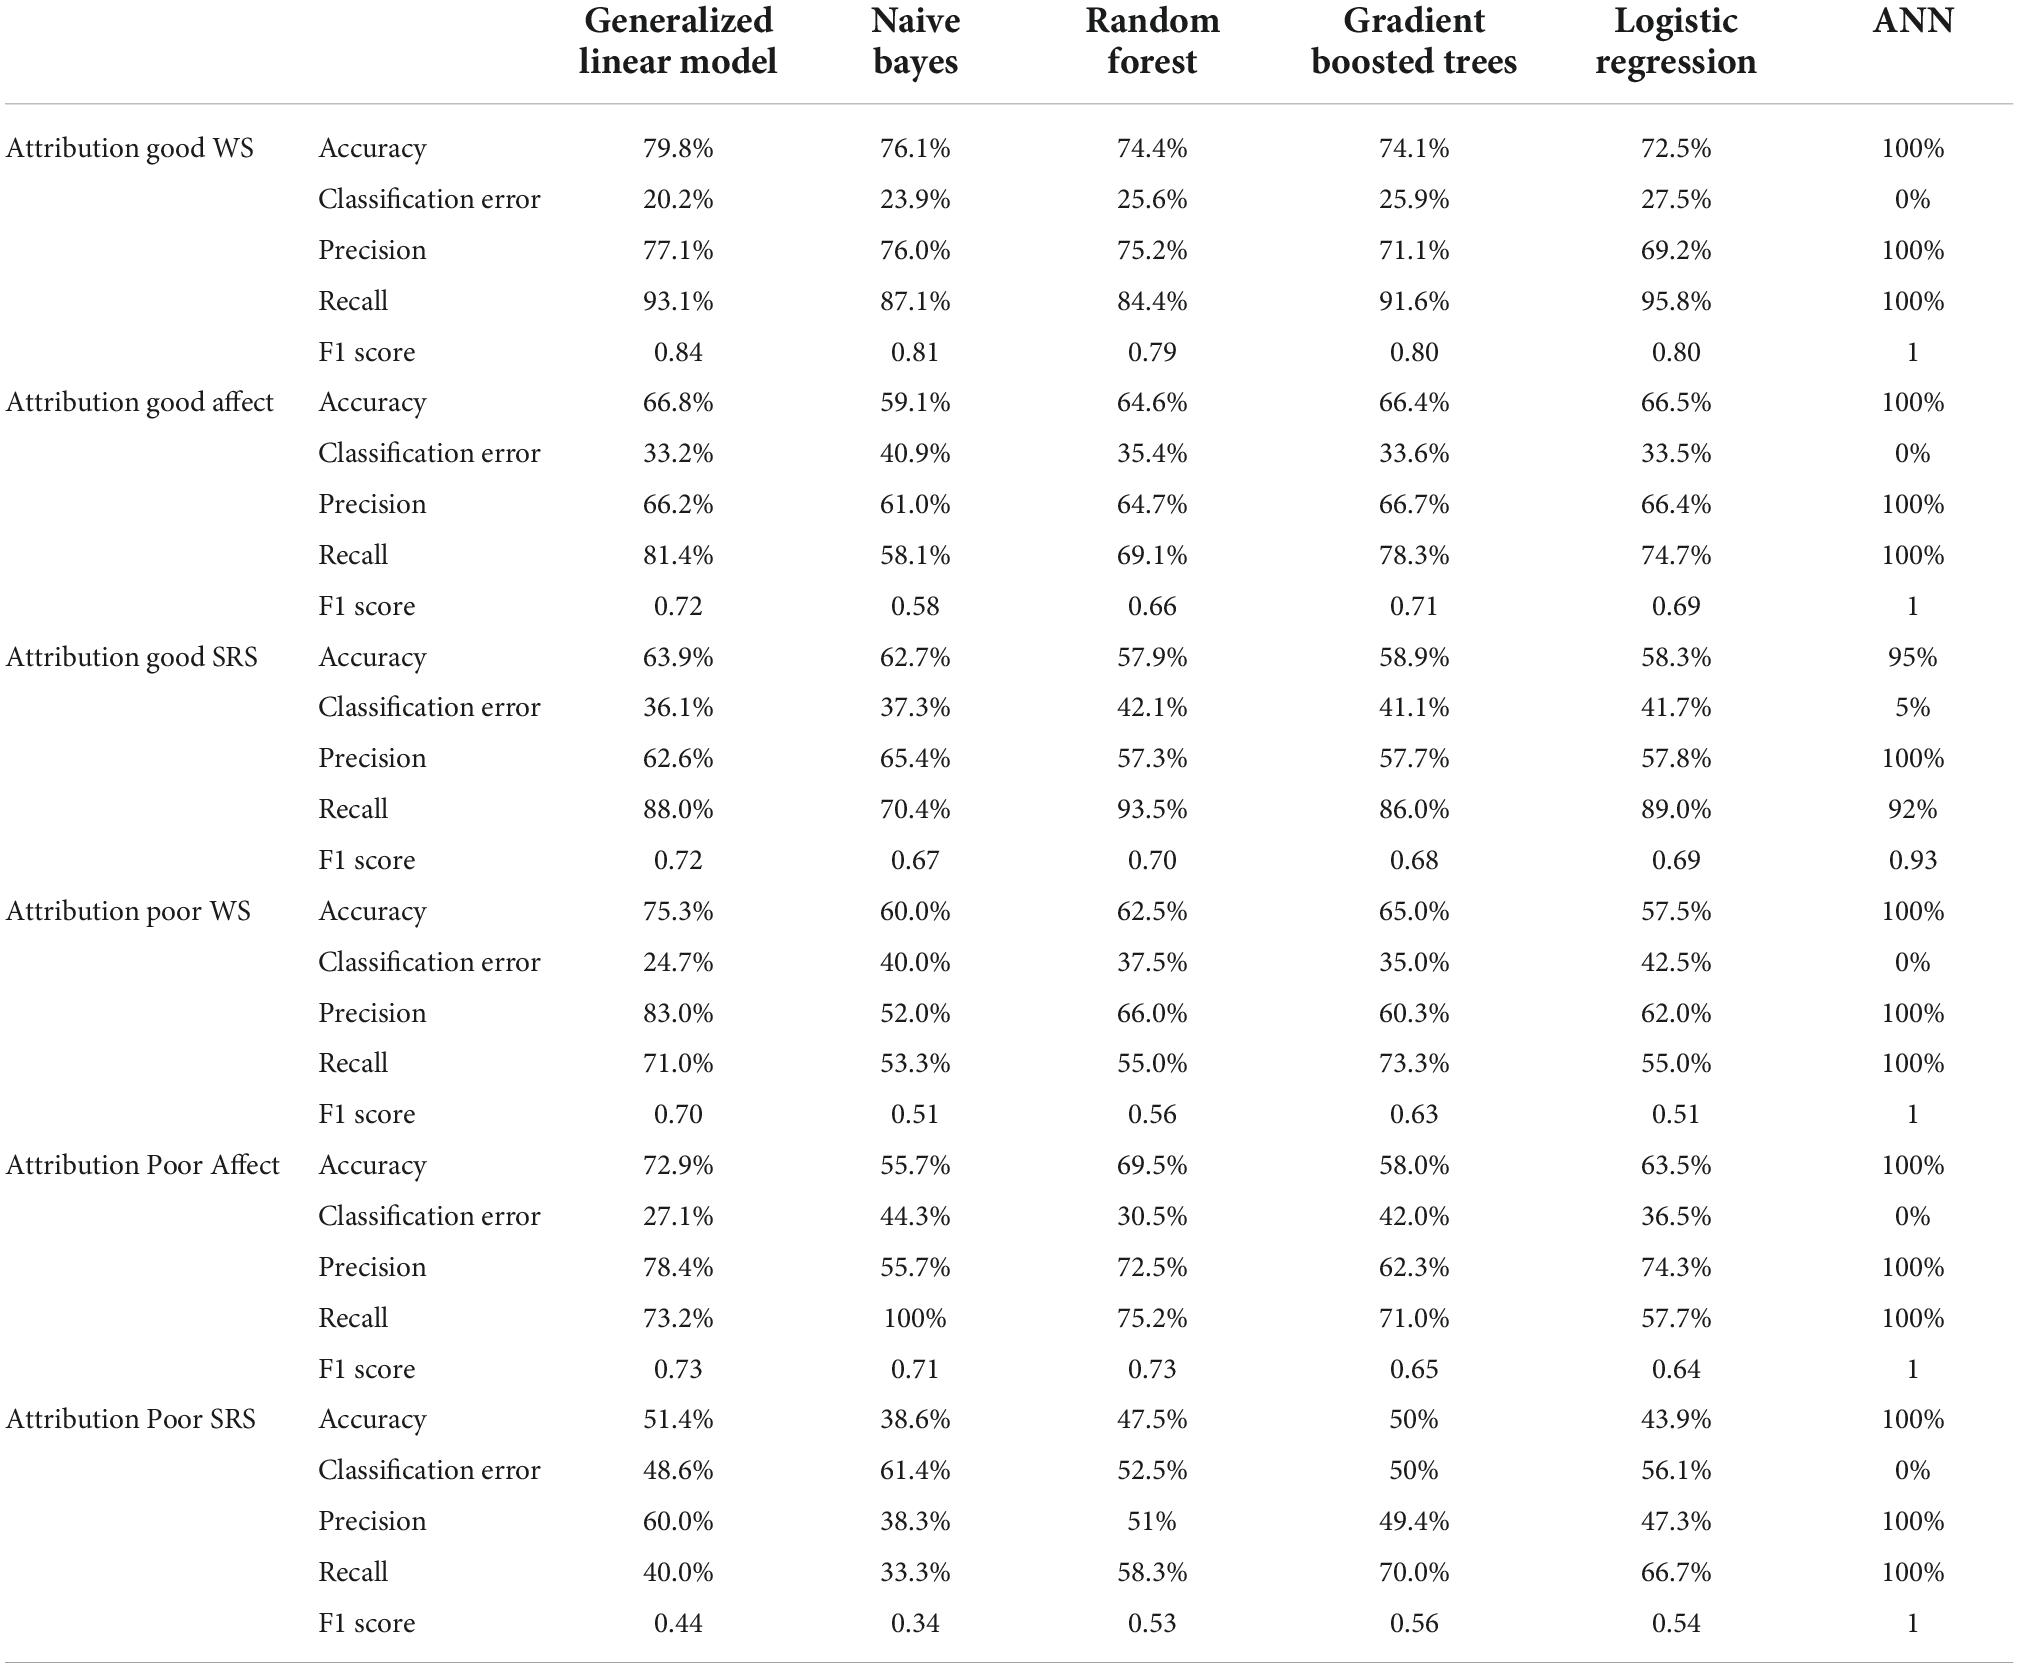
Table 7. Evaluation metrics for all machine learning models.
What do the weights that artificial neural networks assigned to the inputs tell us?
The values in each of the six ANNs shown in Table 4 represent the predictive weights of each variable as a percentage of the total predictive weights of all predictors. It is worth noting that given the effectiveness of this approach; seemingly small percentage differences create significantly different patterns and consequently different outcome classifications.
ANN1 determined which students belong to the first target group (i.e., which students attributed their perceived poor learning outcome to lack of specific WSs = WSp). Prominent domain variables are epistemic beliefs (5.6), mastery goal orientation (4.0), metacognitive strategies (planning: 3.0; monitoring: 2.9), performance goal orientation (2.9), alongside six variables measured during the actual learning episode, namely negative emotions pre (4.4) being bored pre (4.3) and post (3.1), satisfaction appraisal (3.0), and time spent writing (2.5). In an attempt to further characterize the HIGH group, we examined the results of the T-tests between the respective HIGH and LOW groups (see Supplementary Appendix) and found that the HIGH group scored significantly lower than the LOW group on self-efficacy, competence appraisal, and positive emotions (both pre and post), and significantly higher on reported effort, difficulty appraisal, tool use, and anxiety after completing the task. Clearly, ANN1 detected an interesting pattern of interactions in which the students’ epistemic beliefs was the most important variable for the prediction, in interaction with goal orientation, metacognitive strategies, and boredom. This implies that these students’ understanding of the knowledge they learn in school is interconnected with the goals they pursue in class and their access to metacognitive strategies. T-tests suggest that students in the HIGH group are aware that they have less competence in the language domain but are nevertheless prepared to engage actively in the learning activity as evidenced by the significantly higher reported effort and higher tool use.
ANN2 provided information on those predictors that best explained the Affp attribution. As can be seen in the second column, nine variables yielded predictive weights 2.5 and higher. Difficulty level appraisal (5.0) was the most prominent predictor, followed by self-efficacy reading (4.0), technical z-score (3.8), competence appraisal (3.4), metacognitive strategies: elaboration (3.3), dependency on external regulation (3.1) time spent writing the letter (3.1), reported effort post (2.9), z content score (2.7), and bored post (2.5). T-tests disclosed that students in the HIGH group scored significantly lower than the LOW group on metacognitive strategies (planning and monitoring), and were more dependent on external regulation. Their mean scores on value and effort appraisal before the task and on effort appraisal and difficulty appraisal after the task were also significantly lower than the contrast group, as well as their actual tool use and anxiety score pre and post. On the other hand, students who endorsed an Affp attribution scored significantly higher than the LOW group on all other negative emotions before and after the task, including on feeling tired, bored, and irritated. ANN2 identified difficulty appraisal as the most prominent predictor of endorsing an Affp attribution (I did not find the task hard to do) in interaction with indicators of native language proficiency (access to metacognitive strategies, and technical and content z-scores), and unfavorable appraisals. It seems odd that the HIGH group scored significantly lower on difficulty appraisal and anxiety pre and post despite their significantly lower scores on metacognitive strategies. This pattern characterizes the target group as either not aware that there is a problem with their WSs or that they were trying to cover it up.
ANN3 addressed the prediction of a SRSp attribution (see column 7). Results revealed that students’ level of technical WS (7.1) and their mastery goal orientation had the highest participation in the predictive model (6.6). Other key predictive weights were 2 domain measures, namely metacognitive strategies: correspondence (4.8), and dependency on external regulation: correspondence (4.3), together with five appraisals, mainly value (3.9), competence (3.8), effort pre (3.6), difficulty level (2.7), and satisfaction appraisal (2.6) and one emotion: boredom pre (2.6). Unfortunately, only one T-test reached significance. The HIGH group differed significantly from the LOW group on epistemic beliefs, implying that they viewed knowledge learned in school as more stable, certain, and absolute than students in the contrast group. The fact that none of the other T-tests were significant makes it difficult to interpret the results, especially since the Multiple Regression did not run either. Awaiting further research, we conclude that technical z-score and mastery goal orientation were certainly implicated, in attributing the learning outcome, but we are left blind as to how these variables interacted with the students’ appraisals and emotions during the learning episode.
Inspection of column 8 in Table 4 shows that ANN4 identified 9 prominent weights to predict WSg, including six domain measures, namely self-efficacy reading (3.4), writing (3.4), correspondence (5.2), mastery goal orientation (4.2), performance goal orientation (3.3), and metacognitive strategies (3.0). The dominant appraisals were competence appraisal (5.1), difficulty appraisal (3.6), and satisfaction appraisal (3.6), and the most predictive emotion was anxiety post (3.1). T-tests revealed further that scores on self-efficacy and metacognitive strategies were significantly higher in the HIGH group and that their epistemic beliefs were significantly more complex, subjective, and relative. Also, the HIGH group scored significantly higher than the LOW group on competence and value appraisal, effort appraisal pre and post, satisfaction appraisal as well as on positive emotions pre and post. Interestingly, the HIGH group showed significantly lower scores on tool use and negative emotions, especially anxiety. Inspection of the prominent predictive weights in combination with the results of the T-tests suggests that students who attribute their perceived good learning outcome to adequate WSs feel self-efficacious in the language domain, strive for mastery, and view knowledge learned in school as complex, subjective and relative. These favorable domain beliefs are translated into a high competence appraisal, feeling comfortable during the task and being satisfied with their learning outcome.
The variables with the highest impact on the students’ Affg attribution that ANN5 identified (see column 9) were their competence (4.5) and value appraisal (4.4) before the task and effort appraisals (3.1) and satisfaction appraisal post (3.7), in combination with the time spent writing the letter (4.4). Three domain measures were also important for ANN5, namely metacognitive strategies (4.2), self-efficacy (3.3) and mastery goal orientation (3.2). T-test revealed that the HIGH group scored significantly higher than the LOW group on self-efficacy, mastery goal orientation, and metacognitive strategies and reported more favorable appraisals compared to students in the contrast group, specifically significantly higher competence, value, effort (both pre and post), and satisfaction appraisal. In addition, students in the HIGH group expressed higher positive emotions and lower negative emotions before and after doing the task. Together these results tell us that students who looked back on a successful learning outcome and endorsed the affect-related attribution items felt self-efficacious in the language domain, had a mastery goal orientation, and experienced favorable appraisals and emotions.
ANN6 identified the performance indicators as the most prominent predictors of SRSg (see column 10). These include the time students spent writing the letter (6.1), the tools they used (5.4), and the level of their technical WSs (3.1). Apart from these performance indicators, ANN6 listed the students’ score on mastery goal orientation (3.6), self-efficacy (2.8), metacognition (2.8) as well as effort appraisal post (3.4) as important contributing predictors. Significant T-tests informed us further that the HIGH group scored significantly higher than the LOW group on mastery orientation, self-efficacy, and metacognitive strategies, positive emotions (pre and post) and on all appraisals. They scored significantly lower than the contrast group on all negative emotions, except anxiety pre and post. We conclude that – similar to students in the other two good groups, students who endorsed the SRSg attribution items tend to adopt a mastery goal orientation, feel self-efficacious in the language domain, and report having access to meta-cognitive strategies, however, they are uniquely characterized by their score on invested effort, time spent on task, and use of the provided tools.
Predictive contribution by categories of variables
In the previous pages we mainly focused on the predictive power of individual variables that the respective ANNs used to classify the students into the HIGH and LOW groups. On analyzing the most prominent predictive weights for the six different attribution groups, we noticed specific patterns involving different sets of variables. To investigate these patterns further, we examined which of the six categories of variables outlined in the Dual Processing Self-Regulation Model carried most predictive weights in the six ANNs (i.e. background variables, domain variables, context-sensitive variables, and performance indicators). We compared the sources of the predictive weights and their value for each of the attribution groups, separately for the good and poor groups. Results are summarized in Table 8.
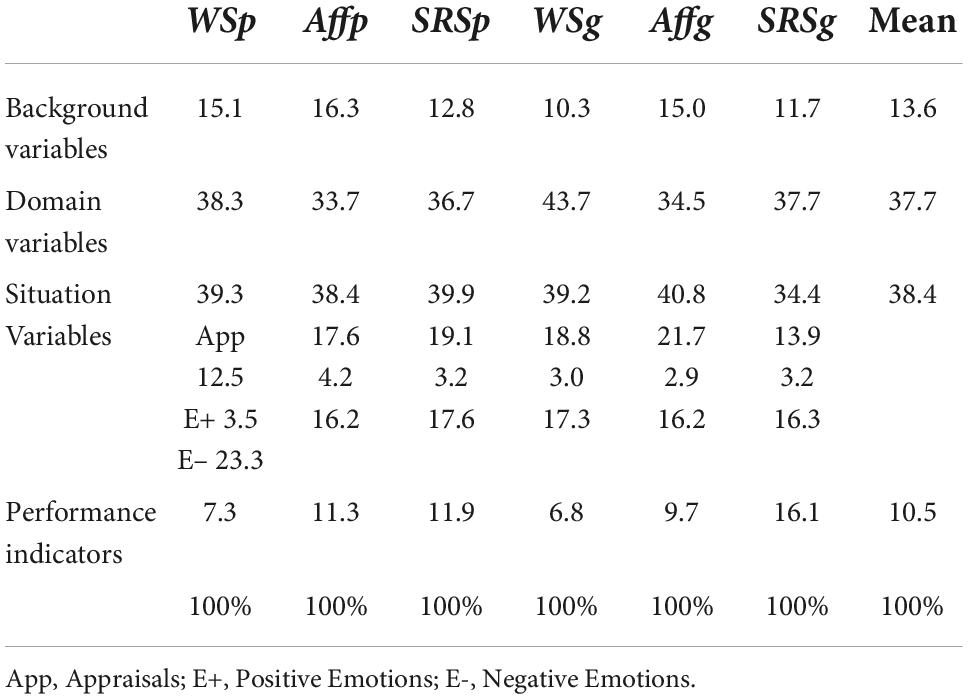
Table 8. Comparative predictive weight contribution for the six attributions by each of the categories of predictor variables.
As can be seen, background variables had the greatest impact on Affp (16.3), domain variables had the highest participation in the predictive model of WSg (43.7), context-sensitive variables were carrying the most predictive weight for the Affg (40.8), emotions played an important role in the prediction of Affp (26.8), especially negative emotions (23.3). Finally, performance indicators were a salient source to classify students into the target group for SRSg (16.1).
Discussion
This article started with a re-conceptualization of aspects of Weiner’s attribution theory. We theorized that the attribution process begins as soon as students are faced with a learning episode and hypothesized that both the perception of the learning outcome and its concomitant causal attribution come about through multiple cognitive and affective variables that are triggered during the learning episode. Following the guidelines specified in the Dual Processing Self-regulation Model, we proposed that at the beginning of a learning episode domain variables are activated and brought into WM. This evokes multiple cognitive appraisals and emotions and determines the QIM that students create at that moment in time. We investigated the hypothesis that the quality of the variables that are brought into WM during the learning process contribute significantly to the prediction of vocational students’ perceived learning outcome and its attribution. We used an authentic writing activity and recorded the students’ appraisals and emotions during the learning episode, including their perception of the learning outcome and their attribution of that outcome. We found that students endorse any of three types of attributions, namely explaining the perceived outcome in terms of their own adequate or deficient WSs, in terms of their use or misuse of self-regulation strategies, and / or in terms of the presence or absence of affect-related variables. Using traditional methodologies as well as predictive systems methodologies we examined the effect of multiple sets of variables on these causal attributions. As predicted, multiple regression analyses gave us some insight into the appraisals and emotions that may play an important role in the attribution process, but only ANN methodology could detect important differences in the pattern of variables that underlies the attribution process. We will first comment on the detected patterns in the good group.
Patterns of domain-specific information, context-sensitive appraisals, and emotions in the good groups
The QIM of students in each of the good groups is characterized by three shared domain variables, namely their self-efficacy beliefs, mastery goal orientation and access to metacognitive strategies and two shared appraisals, namely a favorable competence appraisal and satisfaction appraisal. This characterization implies that students in the three good groups bring robust capacity beliefs in the language domain and metacognitive strategies into WM, as well as a mastery goal orientation (i.e., a focus on the development of competence and improvement, Pintrich, 2005). These constructive, activated beliefs trigger favorable competence appraisals as well as a feeling of satisfaction, which Harter (1999) referred to with the term ‘competence motivation.’
Apart from these shared predictors, each ANN listed predictors that uniquely defined students in that attribution group. Typical for good students who endorsed the WSg attribution items is their reported difficulty appraisal, reported anxiety post, and tool use. T-tests revealed that students who endorsed this attribution scored significantly lower on these three variables than the contrast group, but significantly higher on intended and reported effort and on positive emotions pre and post. Given the nature of the students’ QIM, we view a WSg attribution as a causal judgment that informs us that these students’ perception of the learning outcome is attributed to stable, domain-dependent beliefs in the language domain and that cues in the task environment are interpreted in accordance with these beliefs. They are task-focused and prepared to invest effort when the learning activity is considered ‘manageable’ (i.e., when they feel that they have the ability to use the rules and procedures of technical writing) and the current learning activity is embedded in positive emotions. Unfortunately, these students may be prone to cues that signal an increase in task difficulty and processing burdens.
Students who endorsed the Affg attribution items also brought constructive domain beliefs to bear on the task, which in turn evoked competence and satisfaction appraisals, together with value and effort appraisal pre and post, all of which influenced the amount of time spent on task. This suggests that these students are inclined to invest time and effort into learning activities in the language domain, provided that they truly value and enjoy these activities and experience few negative emotions. Unfortunately, this may imply that these students are sensitive to cues that signal a decrease of intrinsic value of the learning task, which may erode their task involvement.
In correspondence with the two other good groups, the QIM of the students who endorsed the SRSg items uncovered that their interpretation of the learning outcome is based on solid domain beliefs in the language domain, but also that they seem to be less affected by environmental cues that signal intrinsic value and less disturbed by cues that signal increased difficulty level. The distinctive pattern of predictors that emerged showed the performance indicators in pole position, in interaction with reported effort. These students’ mindful engagement seems to be characterized by their active use of self-regulation strategies and the tools provided by the teacher. Boekaerts and Corno (2005) called this ‘effortful accomplishment due to volitional control’ and explained that volitional strategies – or good work habits – help students to commit themselves to engage mindfully in the learning task and protect their learning intention when difficult work must be completed. Rozendaal et al. (2003) showed that working attentively on learning tasks and protecting one’s learning intention from competing action tendencies may depend on the quality of the implementation plans that students have access to and are willing to use. Vocational students who had been trained to implement self-regulation strategies in a specific domain were more motivated to use these strategies and reported less anxiety six months after the training program (see also Boekaerts and Rozendaal, 2006).
Patterns of domain-specific information, context-sensitive appraisals, and emotions in poor groups
The Dual Processing SR model predicts that students, who have unfavorable motivation beliefs and appraisals of a learning activity and experience concomitant negative emotions move onto the well-being route, mainly because the QIM that they create fosters a concern for well-being (self-focus) rather than for learning (task-focus). Examining the QIM of the three poor attribution groups shows that these students are not satisfied with their learning outcome and may blame this on controllable or uncontrollable factors. The three poor groups seem to deal differently with the turbulence created by the learning activity in their self-regulation system.
The QIM of students who reported a poor writing outcome and endorsed the WSp attribution items is characterized by the nature of their epistemic beliefs, goal orientation, metacognition and negative emotions reported at the end of the learning episode. They expressed significantly lower confidence that they could do the current task, scored lower on metacognition, reported more anxiety, and admitted that the task had been hard to do. They also reported higher effort investment and tool use than the contrast group. Untrained observers may falsely conclude that they had been more task-focused than the contrast group. However, as Pekrun and Perry (2014) showed, low self-efficacy in combination with anxiety may induce either feelings of hopelessness or hope. Experiencing loss of control creates hopelessness and makes students resort to defensive strategies, such as procrastination, task avoidance, and disengagement. On the other hand, feelings of hope will prevail when students are uncertain about control. In the latter case they may increase effort (Goetz et al., 2010). Boekaerts and Niemivirta (2005) explained that students who report low self-efficacy beliefs and experience anxiety interpret this as a danger signal or a threat to the self and this prompts them to reallocate resources. This may lead to an increase in effort, for example by working faster, producing more output, or repeating answers randomly in an attempt to prevent negative learning outcomes from occurring. However, this increased effort is largely undirected and should be considered as an emotion regulation strategy. Baumeister et al. (2007) confirmed that anxiety associated with a task may shift people’s priorities, forcing them to focus on immediate urgent needs, namely to escape the aversive emotional state. Vermeer et al. (2000) demonstrated that using danger control (undirected effort) as a coping strategy to escape the aversive emotional state produced more rather than less errors as well as rumination. This self-focus interfered with the task and kept the level of anxiety (i.e., the danger signal) high. Using danger control as an emotion regulation strategy may temporarily protect these students from teacher blame, because the perceived negative outcome is not due to lack of effort. However, admitting that learning activities in the language domain are not one’s strength and that the current learning activity was too difficult for them may also harbor some risks. If peers interpret it as a sign of low ability it may make these students extra vulnerable for bullying and therefore sensitive to cues in the task environment that signal loss of face. On the other hand, a WSp attribution may prove to be beneficial to learning, provided the students truly believe that the teacher treats their attribution as a form of feedback and uses it to create practice sessions that help them acquire the rules and procedures of technical writing that they have not yet mastered.
An Affp attribution differs fundamentally from a WSp attribution as the pattern detected by ANN2 clearly shows. As discussed in the result section, the QIM of the students who attributed their perceived poor performance to low Affp is dominated by their difficulty appraisal in combination with their scores on self-efficacy, technical writing, and metacognition. Dissimilar to the WSp group, the Affp group scored significantly lower than the contrast group on difficulty appraisal, anxiety pre and post, effort investment, and tool use, despite their significantly lower scores on metacognition. This suggests that these students are either unaware that they have failing skills in the language domain or that they were trying to cover it up. Inspection of their QIM hints at a deliberate attempt to withhold effort in order to avoid loss of face. Covington (2000) labeled this emotion regulation strategy ‘self-handicapping’ and described it as an attempt to maintain self-worth. Using this strategy helps students to lower their level of anxiety, probably because it allows them to externalize the source of failure. It gives them the illusion of control over the situation.
To summarize, the different patterns between the variables that were uncovered by ANN4–6 opened a window on the students’ QIM and how it is related to their perceived learning outcome and its attribution. It seems that students who can rely on stable, domain-dependent motivation beliefs are inclined to consider themselves competent to start the learning activity and are willing to invest effort. Custers and Aarts (2005) showed that goals and tasks that have been infused with positive affect in the past automatically evoke effort directed at attaining similar goals. In other words, students who engage in learning activities directed by their own favorable beliefs work attentively on learning activities that have become habitual, because of the positive affect that they generate (routinization of mindful engagement; Gyurak et al., 2011).
The patterns between the predictors uncovered by ANN1-3 tell a divergent story. It appears that students in both poor groups score significantly lower on metacognition and bring unfavorable beliefs to bear on the learning activity, but their appraisals and emotions differ fundamentally. Students who attributed a poor learning outcome to failing WSs seemed to be aware (1) that the task was difficult, and that extra effort was in order to succeed, but (2) that their effort was not good enough to succeed, because (3) their WSs are (still) deficient. Cleary (2011) reported in this respect that such adaptive inferencing led to improved strategic planning and better use of provided instruction and tools. By contrast, students who attribute a perceived poor outcome to Affp may also be aware that effort is in order to avoid losing face, but they make a deliberate attempt to withhold effort, thus misleading teacher and peers – and even themselves – by referring to the learning task as tedious and not worth the effort.
Implications and limitations
Although extensive research has been conducted to examine students’ attributions and recommendations have been formulated to change maladaptive causal attributions into adaptive ones, little is known about the effect of task demands and conditions – and students’ interpretation thereof – on their attribution of learning outcomes in different domains. Yet, we think that it is theoretically important to investigate to what extent the mental representation that students make of a domain and of the different types of learning activities within that domain are linked to specific types of attributions.
The critical question in our study was whether differences in the QIM are reflected in students’ self-reported attributions about the outcome of a specific learning activity. We showed in this article that describing students’ attributions exclusively in terms of Weiner’s three-dimensional taxonomic space is not doing justice to the complex message that may be encoded in the students’ attribution of a learning outcome. We hope that we have convinced attribution researchers that it is necessary to contextualize attribution items so that they better represent the labels that teachers use in class to communicate with students about the what’s, why’s and how’s of perceived learning outcomes. In our opinion, the main contribution of the present study concerns the method of data collection and the methodological tools used to analyze the data. We designed a questionnaire that tapped into the students’ situation-specific attributions. We also collected a wide array of data, including background variables and metacognitive, motivational, and behavioral variables. Apart from self-reports, which may not reflect the actual level of motivation, we used on-line measures of motivation and emotion, as well as objectively measured aspects of performance, such as tool use, time spent, level of technical WS, and fluency in letter writing. We used traditional analyses, such as multiple regressions and the predictive systems approach and showed that traditional, linear models encounter difficulties when the object of the research is to study the impact of a wide range of inputs on the outcome variable. In the past, several researchers complained that the assumed relation between attributions and motivation variables, such as mastery and performance goals, remained scarce and inconclusive (see e.g., Wolters et al., 2013). We think that the reason for these inconclusive findings is that most of the methods of analyses that were used lacked the power to examine the effect of different types of variables on attributions, considering them all simultaneously. When we analyzed our findings using multiple regression analysis, we noted that a great number of variables were excluded from the analyses. Our study demonstrated convincingly that ANN analysis is a more robust method to predict and classify different types of attributions, compared with more traditional methodologies.
We found that ANN methodology could identify with high precision students who used a WS, Aff, and SRS attribution on the basis of domain variables, appraisals, emotions, and performance indicators. Due to its overall precision and the wide scope of variables that were considered to classify the expected attribution, ANN detected important differences in the factors that seem to underlie the students’ causal attributions. Granted, our results need additional testing, but what they show us is that students who attribute a perceived poor writing outcome to low Affp and those who attribute it to poor WSp may have created a different mind-set that guided their coping attempts.
The findings of this study have important pedagogical and practical implications in secondary education. On the one hand, it is crucial that teachers recognize the difference between a WSp and an Affp attribution, because – As Cleary and Zimmerman advocated – the former causal explanation will help students to sustain perceptions of efficacy in the domain and invest effort to succeed, when processing burdens are (temporarily) increasing. The latter ascription may prompt students to re-define learning activities in that domain, which may change their motivation beliefs and chronically embed similar learning activities in a network of negative emotions and appraisals. On the other hand, the possibility of identifying with high level of precision which students would have different attribution patterns, provides an opportunity for early, positive, and targeted pedagogical interventions.
There are also a number of limitations to this study. First of all, the data were collected in a single measurement wave and concerned only one learning activity. Such an approach is not a solid basis for ruling out alternative explanations for the observed relations. Also, the age range (students from upper secondary education) limits the possibility of generalization. Further empirical evidence is needed from students of different age groups regarding their attributions of learning outcomes in the language domain.
Conclusion
Attribution is more than an individual difference variable. These causal judgments are an intricate part of the SR system and should be studied in a context-sensitive way. Conceptualizing students’ attributions as an unfolding process that takes shape during a learning episode and is highly influenced by contextual features provides the opportunity to better understand students’ epistemic beliefs about effort and ability as the cause of (un) successful learning outcomes. Boekaerts (2006) explained that effort is a confusing concept. For example, low effort may be interpreted as a sign of little interest in the learning activity, as a signal of low ability, as a reaction to perceived difficulty level of the task, low self-efficacy, and anxiety. A system approach has the potential to bring together large bodies of research that have the potential to unfold these complex processes. Moreover, it is evident that changes in the students’ perception of task demands during a learning episode may impact on the students’ QIM because cognitive and affective states influence each other over time. Therefore, it is advisable that in future research on the prediction of attributions the sequential and temporal aspects of the students’ engagement in the learning episode are taken into account. This would allow researchers to examine where exactly in the learning episode attributions begin to take shape, in close connection with contextualized cues that students pick up during the learning episode and the SR strategies they use to counteract the negative impact of an anticipated poor learning outcome (for further discussion of these types of analyses see Azevedo et al., 2011; Molenaar, 2014; Azevedo, 2015; Cleary et al., 2016; Panadero et al., 2016; Molenaar et al., 2021). In sum, future research needs to use the findings from this study in the design of longitudinal studies that can capture the dynamic aspects of self-regulation, including unfolding attribution processes.
Data availability statement
The raw data supporting the conclusions of this article will be made available by the authors, without undue reservation.
Ethics statement
The studies involving human participants were reviewed and approved by Research Ethics Committee of the Leiden University. Written informed consent to participate in this study was provided by the participants’ parents or legal guardian/next of kin.
Author contributions
MB contributed to the conceptualization of the research and the design of the study, wrote the first draft of the theoretical section, and results and discussion. MM carried out some of the classical statistical analyses and some part of the neural networks, wrote some part of the introduction, method section, tables, and contributed to the manuscript review. EC contributed to the conceptualization of the research and the design of the study, carried out the neural network models, wrote some part of the methodological section, and reviewed the manuscript. All authors read and approved the submitted version.
Funding
This study was funded by the Penvoerder Self – Regulated Writing Project (PSRWP) - Koning Willem I College from Netherlands. Contract number: AGI-1802-2006/7 and date: May 15, 2007.
Conflict of interest
The authors declare that the research was conducted in the absence of any commercial or financial relationships that could be construed as a potential conflict of interest.
Publisher’s note
All claims expressed in this article are solely those of the authors and do not necessarily represent those of their affiliated organizations, or those of the publisher, the editors and the reviewers. Any product that may be evaluated in this article, or claim that may be made by its manufacturer, is not guaranteed or endorsed by the publisher.
Supplementary material
The Supplementary Material for this article can be found online at: https://www.frontiersin.org/articles/10.3389/feduc.2022.1007803/full#supplementary-material
Footnotes
- ^ The ecological validity of our attribution measures is high because we used a clearly defined learning activity with a definite beginning and end. The fine-grained questions that we designed were explicitly linked to the learning activity, thus reducing the ambiguity and vagueness that is so typical of de-contextualized types of attribution items. As Cleary (2011) convincingly showed the use of context and task-specific questions have the potential to generate highly reliable and valid information, mainly because the items measure thoughts, beliefs, and feelings that occur in real time, therefore minimizing the effects of memory or other retrieval problems (p. 338).
References
Abu Naser, S. S. (2012). Predicting learners performance using artificial neural networks in linear programming intelligent tutoring system. Int. J. Artif. Intell. Appl. 3, 65–74. doi: 10.5121/ijaia.2012.3206
Alyahyan, E., and Düştegör, D. (2020). Predicting academic success in higher education: Literature review and best practices. Int. J. Educ. Technol. High. Educ. 17, 1–21. doi: 10.1186/s41239-020-0177-7
American Psychological Association (2017). Ethical principles of psychologists and code of conduct (2002, amended effective June 1, 2010, and January 1, 2017). Washington, DC: American Psychological Association.
Azevedo, R. (2015). Defining and measuring engagement and learning in science: Conceptual, theoretical, methodological, and analytical issues. Educ. Psychol. 50, 84–94. doi: 10.1080/00461520.2015.1004069
Azevedo, R., Johnson, A., Chauncey, A., and Graessen, A. (2011). “Use of hypermedia to assess and convey self-regulated learning,” in Handbook of self-regulated learning performance, eds B. Zimmerman and D. Schunk (New York, NY: Routledge), 102–121.
Baumeister, R. F., Zell, A. L., and Tice, D. M. (2007). “How emotions facilitate and impair self-regulation,” in Handbook of emotion regulation, ed. J. J. Gross (New York: The Guildford Press), 408–427.
Boekaerts, M. (1999). Self-regulated learning: Where we are today. Int. J. Educ. Res. 31, 445–457. doi: 10.1016/S0883-0355(99)00014-2
Boekaerts, M. (2002). “The on-line motivation questionnaire: A self-report instrument to assess students’ context sensitivity,” in Advances in motivation and achievement, Vol. 12, eds P. R. Pintrich and M. L. Maehr (New York: JAI / Elsevier Science), 77–120.
Boekaerts, M. (2006). “Self-regulation and effort investment,” in Handbook of child psychology, Vol. 4, eds E. Sigel and K. A. Renninger (New York: Wiley), 345–377. doi: 10.1002/9780470147658.chpsy0409
Boekaerts, M. (2011). “Emotions, emotion regulation, and self-regulation of learning,” in Handbook of self-regulation of learning and performance, eds B. J. Zimmerman and D. H. Schunk (London: Routledge/Taylor & Francis Group), 408–425.
Boekaerts, M., and Corno, L. (2005). Self-regulation in the classroom: A perspective on assessment and intervention. Appl. Psychol. Int. Rev. 54, 199–231. doi: 10.1111/j.1464-0597.2005.00205.x
Boekaerts, M., and Niemivirta, M. (2005). “Self-regulated learning: Finding a balance between learning goals and ego-protective goals,” in Handbook of self-regulation, eds M. Boekaerts, P. R. Pintrich, and M. Zeidner (San Diego, CA: Academic Press), 417–450. doi: 10.1016/B978-012109890-2/50042-1
Boekaerts, M., and Pekrun, R. (2016). “Emotion and emotion regulation in academic settings,” in Handbook of educational psychology, eds L. Corno and E. M. Anderman (New York: Routledge), 76–90.
Boekaerts, M., and Rozendaal, J. S. (2006). Self-regulation in Dutch secondary vocational education: Need for a more systematic approach to the assessment of self-regulation. Zeitschrift Berufs Wirtschaftspädagogik Beiheft 20, 49–77.
Boekaerts, M., Musso, M., and Cascallar, E. (2012). Self-regulated learning and the understanding of complex outcomes, advances in educational psychology and assessment, Vol. 2012. London: Hindawi Publishing Corporation, 1–3. doi: 10.1155/2012/686385
Boekaerts, M., Otten, R., and Voeten, R. (2003). Examination performance: Are student’s causal attributions school-subject specific? Anxiety Stress Coping 16, 331–342. doi: 10.1080/1061580031000095470
Cascallar, E., Boekaerts, M., and Costigan, T. E. (2006). Assessment in the evaluation of self-regulation as a process. Educ. Psychol. Rev. 18, 297–306. doi: 10.1007/s10648-006-9023-2
Cascallar, E., Musso, M. F., Kyndt, E., and Dochy, F. (2015). Modelling for understanding and for prediction/classification – the power of neural networks in research. Front. Learn. Res. 2, 67–81.
Chan, L. K. S., and Moore, P. J. (2006). Development of attributional beliefs and strategic knowledge in years 5-9. A longitudinal analysis. Educ. Psychol. 26, 161–185. doi: 10.1080/01443410500344209
Cizek, G. J. (2006). “Standard setting,” in Handbook of test development, eds S. M. Downing and T. M. Haladyna (Mahwah, NJ: Lawrence Erlbaum Associates), 225–260.
Cleary, T. J. (2011). “Emergence of SRI microanalysis,” in Handbook of self-regulated learning performance, eds B. J. Zimmerman and D. H. Schunk (New York, NY: Routledge), 329–345.
Cleary, T. J., Durning, S. J., and Artino, A. R. (2016). Microanalytic assessment of self regulated learning during clinical reasoning tasks: Recent developments and next steps. Acad. Reason. 91, 1516–1521. doi: 10.1097/ACM.0000000000001228
Covington, M. V. (2000). Goal theory, motivation, and school achievement: An integrative review. Ann. Rev. Psychol. 51, 171–200. doi: 10.1146/annurev.psych.51.1.171
Crombach, M. J., Boekaerts, M., and Voeten, M. J. M. (2003). Online measurement of appraisals of students faced with curricular tasks. Educ. Psychol. Measure. 63, 96–111. doi: 10.1177/0013164402239319
Custers, R., and Aarts, H. (2005). Positive affect as implicit motivator: On the nonconscious operation of behavioral goals. J. Pers. Soc. Psychol. 89:129. doi: 10.1037/0022-3514.89.2.129
Detienne, K. B., Detienne, D. H., and Joshi, S. A. (2003). Neural networks as statistical tools for business researchers. Organ. Res. Methods 6, 236–265. doi: 10.1177/1094428103251907
Dowson, M., and McInerney, D. M. (2004). The Goal orientation and learning strategies survey. Educ. Psychol. Measure. 64, 290–310. doi: 10.1177/0013164403251335
Efklides, A. (2011). Interactions of metacognition with motivation and affect in self-regulated learning: The MASRL model. Educ. Psychol. 46, 6–25. doi: 10.1080/00461520.2011.538645
Fong, S., Si, Y.-W., and Biuk-Aghai, R. P. (2009). “Applying a hybrid model of neural network and decision tree classifier for predicting university admission,” in Proceedings of the 7th International Conference on Information, Communication, and Signal Processing (ICICS2009) (Macau: IEEE Press), 1–5. doi: 10.1109/ICICS.2009.5397665
Goetz, T., Frenzel, A. C., Stoeger, H., and Hall, N. C. (2010). Antecedents of everyday positive emotions: An experience sampling analysis. Motiv. Emot. 34, 49–62. doi: 10.1007/s11031-009-9152-2
Graham, S. (2020). An attribution theory of motivation. Contemp. Educ. Psychol. 61, 1–11. doi: 10.1016/j.cedpsych.2020.101861
Graham, S., and Taylor, A. Z. (2014). “An attributional approach to emotional life in the classroom,” in Handbook of emotions in education, eds R. Pekrun and L. Linnenbrink-Garcia (New York: Taylor & Francis), 96–119.
Gyurak, A., Gross, J. J., and Etkin, A. (2011). Explicit and implicit emotion regulation: A dual-process framework. Cogn. Emot. 25, 400–412. doi: 10.1080/02699931.2010.544160
Hofer, B., and Pintrich, P. R. (2002). Personal epistemology: The pyschology of beliefs about knowledge and knowing. New York, NY: Routledge. doi: 10.4324/9781410604316
Kanakana, G., and Olanrewaju, A. (2011). “Predicting student performance in engineering education using an artificial neural network at Tshwane University of Technology,” in Proceedings of the ISEM (Stellenbosch).
Molenaar, I. (2014). Advances in temporal analysis in learning and instruction. Front. Learn. Res. 2, 15–24. doi: 10.14786/flr.v2i4.118
Molenaar, I., Horvers, A., and Baker, R. S. (2021). What can moment-by-moment learning curves tell us about self-regulated learning? Learn. Instr. 72101206. doi: 10.1016/j.learninstruc.2019.05.003
Musso, M. F., Hernández, C. F. R., and Cascallar, E. C. (2020). Predicting key educational outcomes in academic trajectories: A machine-learning approach. High. Educ. 80, 875–894. doi: 10.1007/s10734-020-00520-7
Musso, M. F., Kyndt, E., Cascallar, E. C., and Dochy, F. (2013). Predicting general academic performance and identifying the differential contribution of participating variables using artificial neural networks. Front. Learn. Res. 1, 42–71. doi: 10.14786/flr.v1i1.13
Musso, M., Kyndt, E., Cascallar, E., and Dochy, F. (2012). Predicting mathematical performance: The effect of cognitive processes and self-regulation factors. Educ. Res. Int. 2012, 1–13. doi: 10.1155/2012/250719
Panadero, E., Klug, J., and Jarvela, S. (2016). Third wave of measurement in the self regulated learning field: When measurement and intervention come hand in hand. Scand. J. Educ. Res. 60, 723–735. doi: 10.1080/00313831.2015.1066436
Pekrun, R., and Perry, R. P. (2014). “Control-value theory of achievement emotions,” in Handbook of emotions in education, eds R. Pekrun and L. Linnenbrink-Garcia (New York: Taylor & Francis), 120–141. doi: 10.4324/9780203148211
Pintrich, P. R. (2000). “The role of goal-orientation in self-regulated learning,” in Handbook of self-regulation, eds M. Boekaerts, P. R. Pintrich, and M. Zeidner (San Diego, CA: Academic Press), 451–502. doi: 10.1016/b978-012109890-2/50043-3
Pintrich, P. R. (2005). “The role of goal orientation in self-regulated learning,” in Handbook of Self-regulation, eds M. Boekaerts, P. R. Pintrich, and M. Zeidner (San Diego, C.A: Academic Press), 451–502. doi: 10.1016/B978-012109890-2/50043-3
Pintrich, P. R., and De Groot, E. V. (1990). Motivational and self-regulated learning components in classroom academic performance. J. Educ. Psychol. 82, 33–40. doi: 10.1037/0022-0663.82.1.33
Rodriguez-Hernandez, C. F., Musso, M. F., Kyndt, E., and Cascallar, E. C. (2021). Artificial neural networks in academic performance prediction: Systematic implementation and predictor evaluation. Comput. Educ. Artif. Intell. 2:100018. doi: 10.1016/j.caeai.2021.100018
Rozendaal, J. S., Minnaert, A., and Boekaerts, M. (2003). Motivation and self-regulated learning in secondary vocational education: Information-processing type and gender differences. Learn. Individ. Dif. 13, 273–289.
Schommer, M. (1990). Effects of beliefs about the nature of knowledge on comprehension. J. Educ. Psychol. 82, 498–504. doi: 10.1037/0022-0663.82.3.498
Schunk, D. H., and Zimmerman, B. J. (Eds). (1998). Self-regulated learning: From teaching to self-reflective practice. New York, NY: Guilford Press.
Seegers, G., and Boekaerts, M. (1993). Task motivation and mathematics achievement in actual task situations. Learn. Instr. 3, 133–150. doi: 10.1016/0959-4752(93)90012-O
Vermeer, H., Boekaerts, M., and Seegers, G. (2000). Motivational and gender differences: Sixth-grade students’ mathematical problem-solving behavior. J. Educ. Psychol. 92, 308–315. doi: 10.1037/0022-0663.92.2.308
Vermunt, J. (1998). The regulation of constructive learning processes. Br. J. Educ. Psychol. 68, 49–171. doi: 10.1111/j.2044-8279.1998.tb01281.x
Volet, S. (2001). “Understanding learning and motivation in context: A multi-dimensional and multi-level cognitive-situative perspective,” in Advances in learning and instruction series: Motivation in learning contexts, eds S. Volet and S. Järvelä (Amsterdam: Emerald Group Publishing Limited), 57–82.
Weiner, B. (2018). The legacy of an attribution approach to motivation and emotion: A no-crisis zone. Motiv. Sci. 4, 4–14. doi: 10.1037/mot0000082
White, H., and Racine, J. (2001). Statistical inference, the bootstrap, and neural network modelling with application to foreign exchange rates. IEEE Trans. Neural Netw. 12, 657–673. doi: 10.1109/72.935080
Wolters, A., Fan, W., and Daugherty, S. G. (2013). Examining achievement goals and causal attributions together as predictors of academic functioning. J. Exp. Educ. 81, 295–321. doi: 10.1080/00220973.2012.700498
Zimmerman, B., and Cleary, T. J. (2009). “Motives to self-regulated learning: A social cognitive account,” in Motivation at school, eds K. R. Wentzel and A. Wigfield (NewYork, NY: Routledge), 11–34.
Zimmerman, B., and Kitsantas, A. (2002). Acquiring writing revision and self-regulatory skill through observation and emulation. J. Educ. Psychol. 94, 660–668. doi: 10.1037/0022-0663.94.4.660
Keywords: attribution, appraisals, artificial neural networks, emotions, learning outcome
Citation: Boekaerts M, Musso MF and Cascallar EC (2022) Predicting attribution of letter writing performance in secondary school: A machine learning approach. Front. Educ. 7:1007803. doi: 10.3389/feduc.2022.1007803
Received: 30 July 2022; Accepted: 07 November 2022;
Published: 23 November 2022.
Edited by:
Min Lu, University of Miami, United StatesReviewed by:
Timothy Adeliyi, Durban University of Technology, South AfricaNimrod Delante, James Cook University Singapore, Singapore
Copyright © 2022 Boekaerts, Musso and Cascallar. This is an open-access article distributed under the terms of the Creative Commons Attribution License (CC BY). The use, distribution or reproduction in other forums is permitted, provided the original author(s) and the copyright owner(s) are credited and that the original publication in this journal is cited, in accordance with accepted academic practice. No use, distribution or reproduction is permitted which does not comply with these terms.
*Correspondence: Mariel F. Musso, mariel.musso@hotmail.com