Determining the Adsorption Energetics of 2,3-Butanediol on RuO2(110): Coupling First-Principles Calculations With Global Optimizers
 Carrington Moore1
  Difan Zhang1,2 Roger Rousseau2*
  Vassiliki-Alexandra Glezakou2*
  Jean-Sabin McEwen1,2,3,4,5*
- 1Gene and Linda Voiland School of Chemical Engineering and Bioengineering, Washington State University Pullman, Pullman, WA, United States
- 2Pacific Northwest National Laboratory, Physical Sciences Division, Richland, WA, United States
- 3Department of Physics and Astronomy, Washington State University, Pullman, WA, United States
- 4Department of Chemistry, Washington State University, Pullman, WA, United States
- 5Department of Biological Systems Engineering, Washington State University, Pullman, WA, United States
As climate change continues to pose a threat to the Earth due to the disrupted carbon cycles and fossil fuel resources remain finite, new sources of sustainable hydrocarbons must be explored. 2,3-butanediol is a potential source to produce butene because of its sustainability as a biomass-derived sugar. Butene is an attractive product because it can be used as a precursor to jet fuel, categorizing this work in the alcohol-to-jet pathway. While studies have explored the conversion of 2,3-butanediol to butene, little is understood about the fundamental reaction itself. We quantify the energetics for three pathways that were reported in the literature in the absence of a catalyst. One of these pathways forms a 1,3-butadiene intermediate, which is a highly exothermic process and thus is unlikely to occur since 2,3-butanediol likely gets thermodynamically trapped at this intermediate. We further determined the corresponding energetics of 2,3-butanediol adsorption on an ensemble of predetermined binding sites when it interacts with a defect-free stoichiometric RuO2(110) surface. Within this ensemble of adsorption sites, the most favorable site has 2,3-butanediol covering a Ru 5–coordinated cation. This approach is compared to that obtained using the global optimization algorithm as implemented in the Northwest Potential Energy Surface Search Engine. When using such a global optimization algorithm, we determined a more favorable ground-state structure that was missed during the manual adsorption site testing, with an adsorption energy of −2.61 eV as compared to −2.34 eV when using the ensemble-based approach. We hypothesize that the dehydration reaction requires a stronger chemical bond, which could necessitate the formation of oxygen vacancies. As such, this study has taken the first step toward the utilization of a global optimization algorithm for the rational design of Ru-based catalysts toward the formation of butene from sustainable resources.
1 Introduction
The continual use of fossil fuels is contributing to the disruption of the Earth’s carbon cycle, resulting in global warming. A contributor to this is aviation fuel—a highly refined and strictly regulated product of the petroleum industry. Bio-jet fuel provides an alternative to petroleum-based aviation fuel as it maintains low weight and high-energy content that is necessary for air travel. The aviation industry recognizes the need for implementing renewable fuels and has committed to halving emissions by 2050. Sustainable aviation fuel has been projected to help in this endeavor as it can offer up to 80% reduction in emissions as compared to petroleum-based fuel, and as such it has been touted as the biggest opportunity in emission abatement within the aviation industry (Interational Air Transport Association, 2020).
One way to upgrade biomass to usable aviation fuel is through the alcohol-to-jet pathway. In this pathway, a biomass-derived alcohol is dehydrated to butene. Butene is then able to undergo additional chemical processes such as oligomerization and hydrogenation to achieve the proper alkane conformation that is specified in the ASTM standards (Wang and Tao, 2016). In producing these alcohols, it is important to be cognizant of the biomass used; specifically, lignocellulosic biomass is considered to be more sustainable as it is indigestible by humans and the most abundant form of biomass on the planet (Zhou et al., 2011). Butanediols have been demonstrated to be produced from fermenting sugars obtained from lignocellulosic biomass, making it an ideal choice as the reactant (Guragain and Vadlani, 2017).
Dehydrating diols, such as 2,3-butanediol (BDO), have been demonstrated to be a more complex process than dehydrating alcohols with only one hydroxyl group. Often research exploring the dehydration of diols yields a mono-alcohol (Aihara et al., 2020; Ohtsuka et al., 2019). A first-principles study on dehydrating diols found that during the multistep process of removing the first hydroxyl, an electron hole is created that migrates along the carbon chain that aids in the removal of the second hydroxyl group. This hole migration is an example of an non-adiabatic charge transfer. The catalyst used for this process was TiO2 which requires two oxygen vacancies for the adsorption of both hydroxyl groups (Acharya et al., 2013). In a separate study analyzing water’s behavior on RuO2 and TiO2, it was found that Ru had a higher Lewis acidity than Ti, which results in a strong adsorption energy of water. Therefore, in this research, the chosen catalyst was RuO2 as it is isostructural compared to the already tested TiO2 but more reactive with oxygen (Mu et al., 2014).
In this study, the adsorption mechanism of 2,3-butanediol on the RuO2 surface is tested with two separate methods: an ensemble-based approach with a predetermined set of possible adsorption sites and through a global optimization algorithm using the Northwest Potential Energy Surface Search Engine (NWPEsSe) (Zhang et al., 2020). This comparison highlights the abilities of NWPEsSe software on metal adsorbate calculations—an avenue that has yet to be explored. Demonstrating the capabilities on this system with a defect-free surface provides opportunities to use NWPEsSe software on more complex surfaces, such as those with oxygen vacancies.
2 Tier one Article Type
The study presented is an A-type article and original research.
3 Materials and Methods
3.1 Quantum Calculations
The calculations presented in this study were carried out using the Vienna Ab initio Simulation Package (VASP) (Kresse and Furthmüller, 1996; Kresse and Hafner, 1993), where the latest edition of this software (6.1.2 standard) was used. The core electrons were treated with VASP’s projector augmented waves (PAW), 2017 edition (Lejaeghere et al., 2016), to expedite the calculation of the Kohn–Sham equations with an energy cutoff of 500 eV for all calculations. For the surface calculations the energy tolerance was 1 × 10⁻⁴ eV, while the force tolerance was set to 0.03 eV/Å with Gaussian smearing and a sigma value of 0.1 eV. The k-point mesh was (2 × 1 × 1) for the surface calculations and (7 × 7 × 10) for the bulk structure. The bulk structure, being hexagonal close-packed, had the lattice constants of a = b = 4.479 Å, and c = 3.113 Å (see Supplementary Figure S1 for details) using the Strongly Constrained and Appropriately Normed (SCAN) functional. Electronic exchange and correlation was treated at the generalized gradient approximation level using the Perdew–Burke–Ernzerhof (PBE) functional (Perdew et al., 1996). This level of theory was compared to the more sophisticated meta-GGA functional SCAN (Sun et al., 2015) and the van der Waals–DF functional, optB86b-vdW (Becke, 1986) for the BDO molecule in the gas phase. The SCAN functional has been demonstrated to work effectively with spin-polarized metal oxides (Sun et al., 2015) and therefore was used on all surface calculations presented. While RuO2 has been determined to be antiferromagnetic (Berlijn et al., 2017) as the magnetic ordering of the system delays calculations and is unlikely to significantly affect the adsorption energy calculations presented here. As such, all calculations performed in this study were not spin-polarized.
The rutile structure for RuO2 was chosen as it is the most stable under standard conditions (Haines et al., 1996), where the bulk structure was cut for the (110) facet where an Obridge termination was determined to be the most stable surface termination. To emulate a semi-infinite surface, four tri-layers (the tri-layers being a function of the rutile stacking) were used with a 13 Å vacuum layer, with dipole layer corrections being applied in the
where
where
A density of states analysis was carried out such that the Fermi level was set to zero. For the gas-phase BDO the Fermi level was taken to be halfway between the HOMO and LUMO states as was done by (Mittendorfer and Hafner, 2001). In addition to the density of states a d-band analysis was performed where the center (Eq. 4) and width (Eq. (5) were identified by using the following equation (Kitchin et al., 2004) (Hensley et al., 2016):
where E is the given energy from the DOS analysis,
To determine the most favorable adsorption site with an ensemble of predetermined binding sites, an ensemble-based approach was performed so that “ensemble-based” refers to the process that was conducted without the aid of a global optimization algorithm. As such, it is based on chemical intuition. Within this framework, seven unique possible adsorption sites were determined and tested for two different ways: with the 2,3 C-C bond parallel to the a-axis (horizontal) and with the 2,3 C-C bond parallel to the b-axis (vertical). The conformations of these seven sites are given in Supplementary Figure S2.
3.2 Global Optimizer Calculations
We employed the Northwest Potential Energy Surface Search Engine (NWPEsSe) software (Zhang et al., 2020) coupled with the xTB program (Bannwarth et al., 2021) and the VASP program to identify the energetically favorable adsorption configurations of BDO on RuO2(110). The xTB program provides a semiempirical extended tight-binding package to accurately predict molecular structures and properties without the need to switch to a computationally more expensive model such as the DFT-based method in VASP. In this package, the GFN2-xTB (Bannwarth et al., 2019) method can quickly perform calculations of structures and interactions in molecular structures, and the GFN-FF (Spicher and Grimme, 2020) is a generic force field for even faster evaluation of structures and dynamics for large molecules. Similar to our quantum calculations using VASP, the 110 surface of the rutile structure of RuO2 was used. The surface of our RuO2 for the non-periodic boundary conditions (PBC) model (used in GFN-FF and GFN2-xTB) is around 17 × 17 Å2, and the depth is approximately 12 Å corresponding to four layers of Ru atoms. To accelerate the geometric optimization of the BDO/RuO2(110) adsorption system, all atoms in the RuO2 model were fixed using the input files from the ensemble-based adsorption file and their positions were not changed during the optimization. The geometric search of a favorable BDO/RuO2(110) adsorption configuration was conducted in three steps: 1) BDO was added to the center region of the RuO2(110) surface and a geometry optimization was carried out using GFN-FF (Spicher and Grimme, 2020) with NWPEsSe. A total of 20,000 structures were generated. The last 1,200 optimized structures with the lowest adsorption energies were kept. 2) The obtained structures in the previous step were further optimized by GFN2-xTB (Bannwarth et al., 2019) to achieve more accurate geometries and energies. The last 10 optimized structures with the lowest adsorption energies were kept. 3) The obtained 10 structures were further optimized using the VASP code, which were used to obtain the corresponding ground-state adsorption energies.
4 Results
4.1 2,3-Butanediol-to-Butene Pathway Analysis
The first step in analyzing the dehydration of BDO is to determine the reaction pathways in the absence of a catalyst based on what is known in the literature. Dehydrating BDO can have a variety of different products such as 3-hydroxy-2-butanone and 2,3-butanedione, but there are three distinct products whose pathways lead to butene (Zheng et al., 2015). These products are 1,3-butadiene, 2-butanone (methyl ethyl ketone), and 2-methylpropanal and are denoted by their respective pathways in Figure 1 and the accompanying molecular diagrams in Supplementary Table S1. Beginning with Pathway 1, BDO undergoes a double dehydration where both hydroxyl groups are removed in one step leaving behind carbon-carbon double bonds in 1,3-butadiene. As this structure is more stable than the final product of butene it is likely for the reaction to get stalled here. For Pathway 2, the step from BDO to 2-butanone is the most dependent on the functional choice with the two extremes being endothermic for PBE and exothermic for SCAN; the van der Waals optB86b-vdW functional is only endothermic by 0.06 eV. The energetic hurdle for this pathway is the transition from 2-butanone to 2-butanol, which is accomplished through hydrogenation. Finally, the transition to butene is favorable with the total process being endothermic to varying degrees depending on the functional choice. In the last pathway, Pathway 3, the dehydration process is very similar to Pathway 2, which accounts for the similarity in their energy diagrams. The difference arises from the placement of the double-bonded oxygen. For 2-butanone, the double-bonded oxygen forms a ketone, whereas for 2-methylpropanal the double-bonded oxygen shifts to an end carbon. In both cases the dehydration of one water molecule occurs. Similarly, as in Pathway 2, 2-methylpropanal is then hydrogenated before the final dehydration to butene—the hydrogenation step requiring the greatest amount of energy input.
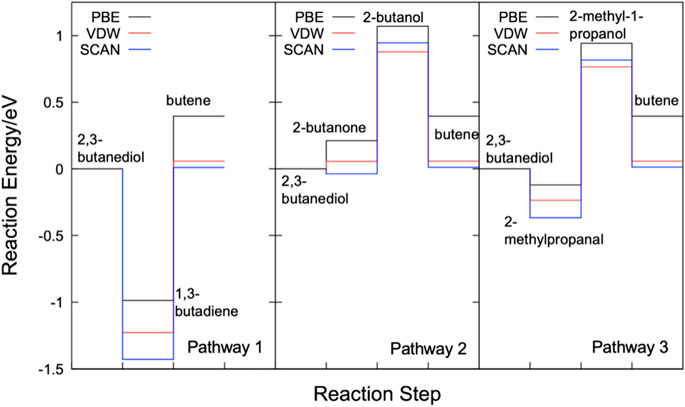
FIGURE 1. Reaction Pathways 1, 2, and 3 for 2,3-butanediol dehydration to butene at three levels of theory: PBE, van der Waals optB86b functional, and SCAN.
Comparing the three pathways, the SCAN functional produced the lowest energies out of the three levels of theory, two exceptions being the intermediary structures in Pathways 2 and 3—2-butanol and 2-methyl-1-propanol. The energetic difference is especially clear when looking at the relative reaction energies for the dehydration process which was 0.395, 0.058, and 0.012 eV for the PBE, VDW, and SCAN functionals, respectively. The SCAN functional improves upon GGA as it has a better capability to distinguish between covalent and metallic bonds, additionally describing them as semi-local (Sun et al., 2015). This distinction should result in less self-interaction error during the DFT calculations.
4.2 Electronic Analysis of 2,3-Butanediol in the Gas Phase
To understand the bonding more accurately between BDO and RuO2(110), the electronic configuration of the gas phase BDO was analyzed through partial density of states (PDOS). We also analyzed the partial charge density distribution of its four highest occupied molecular orbitals (E1–E4) as well as its lowest unoccupied molecular orbital (E5). This information will later be used in the study to identify changes in the electronic configuration upon adsorption to the surface. The PDOS shown in Figure 2 was performed for optimized configurations of BDO in the gas phase. The p-states of each of the oxygens in the hydroxyl group and their bonded carbons were examined. s-states were left out of this plot as they will largely not participate in the bonding to the surface. The partial charge energy intervals that were used for these plots are given in Supplementary Table S2. The Fermi level was calculated to be −3.07 eV away from the HOMO level.
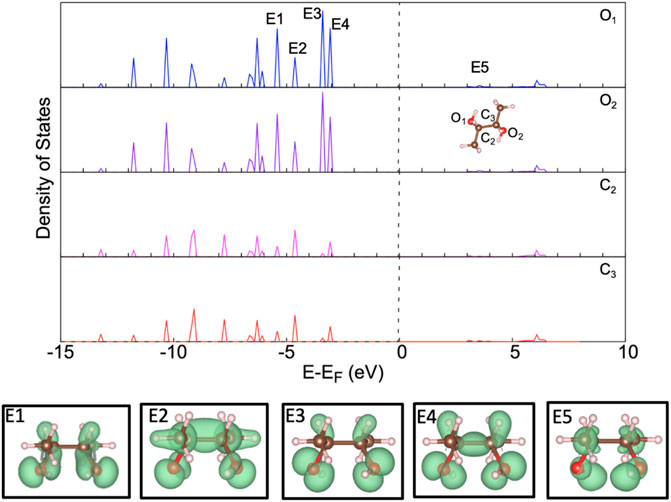
FIGURE 2. Partial density of states for 2,3-butanediol with accompanying partial charge density images; isosurface of 0.0075 electrons/Bohr3. The gray, red, brown, and pink spheres are Ru, O, C, and H atoms, respectively.
Examining the p-states shows that the HOMO, identified as E4, is largely occupied by the two oxygens in the hydroxyl groups. The HOMO having the highest magnitude of states with the hydroxyl oxygens suggests that these oxygens are going to be the main participants in the chemisorption of BDO. This is further evidenced with E3 as well as E4 whose partial charge density distribution shows defined p-orbitals surrounding the oxygen species. Moving lower in energy to the E1 and E2 peaks, the charge density is more clearly including the hydrogen species in the hydroxyl group as well as the hydrogen species bonded to each respective carbon. E2 additionally has a very defined
4.3 2,3-Butanediol Orientation Effects on Adsorption to the Surface
To determine the most favorable adsorption site of 2,3-butanediol, the orientation of the hydroxyl groups relative to the surface—the main interest in the eventual dehydration reaction—needs to be analyzed. Therefore, for 2,3-butanediol, two alternatives were considered: one with hydroxyl groups facing toward the surface (Figure 3A) and the other with hydroxyl groups facing away from the surface (Figure 3B). As anticipated, the hydroxyl groups facing toward the surface was the more favorable configuration, with an adsorption energy of −2.34 eV, classifying it as chemisorbed to the surface. This is evident in Figure 3A, where the charge differential image clearly shows that charge is exchanged from the hydroxyl groups between the oxygen’s p orbital and the Ru 5-coordinated atom’s d orbital. The oxygen acts as an electron acceptor that is donated from Ru. Additionally, stabilization from the subsurface Ru species is also evident as charge is donated to the surface. In the case when the hydroxyl group faces away from the surface, virtually no charge exchange occurs (Figure 3B). This is consistent with the weak adsorption energy of −0.30 eV, which is indicative of physisorption. Therefore, it can be concluded that the difference between chemisorption and physisorption to the surface depends on the hydroxyl group orientation. This orientation of the hydroxyl groups in the diol is also supported in the literature when one attempts to carry out a dehydration reaction (Acharya et al., 2013).
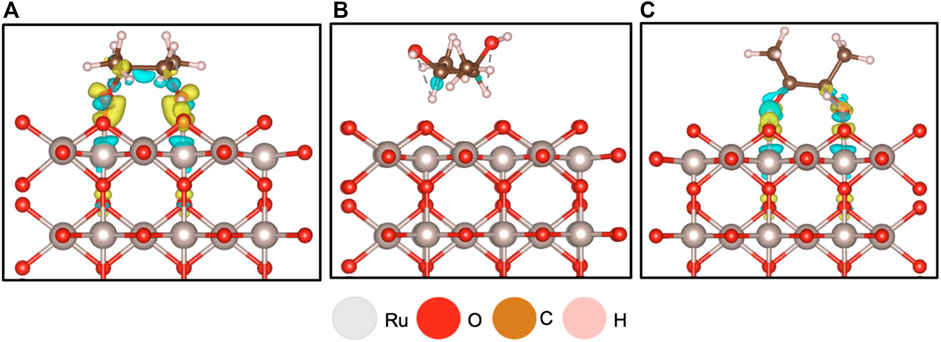
FIGURE 3. Differential charge density analysis for (A) on RuO2(110) having the oxygen functional groups of 2,3-butanediol facing the surface resulting in an adsorption energy −2.34 eV; (B) 2,3-butanediol adsorbed on RuO2 with its functional groups facing away from the surface resulting in an adsorption energy of −0.3 eV; (C) 2,3-butanediol adsorbed on RuO2, structure generated from NWPEsSe surface adsorption energy −2.61 eV; isosurface level for both figures 0.0075 electrons/Bohr3, yellow indicates charge gain, and blue indicates charge loss.
This differential charge analysis was based on placement at Site 1 in Supplementary Figure S2 using the ensemble-based approach. Additionally, the configuration chosen was supported by an NWPEsSe-based analysis. The most favorable structure, determined by the NWPEsSe global optimizer, shows that the hydroxyl group orientation faces the surface (Figure 3C), where, again, charge transfer is observed between the oxygens in the hydroxyl group and the Ru 5-coordinated atom. This results in a more favorable adsorption energy of −2.61 eV.
4.4 Adsorption Analysis
4.4.1 Ensemble-Based Site Testing
Within the framework of the ensemble-based site testing approach, a horizontal and a vertical site were tested at each of the seven sites can be seen in Table 1. As anticipated, the horizontal configurations have lower adsorption energies, attributed to the fact that in the horizontal configuration the hydroxyl groups are parallel to the rows of 5-coordinated Ru (Ru5c) atoms. The most favorable site is above the Ru5c atom, denoted as Site 1 in Supplementary Figure S2. Sites 5 and 6 have comparable energies because the converged structure is isostructural to Site 1, meaning that in all three cases both hydroxyl groups are bonded to Ru5c atoms. For the adsorption energies of the vertical adsorption sites, they are generally weaker as in most cases only one hydroxyl group bonds to the surface. The comparably strong adsorption energy seen for Site 7 can be attributed to the fact that the structure converged to a horizontal configuration, mirroring the structure seen for Site 7 in the horizontal set of adsorption energies. This further demonstrates that the horizontal orientation is more energetically favorable as the favorable orientations for the vertical set of tested configurations converged to a horizontal configuration.

TABLE 1. Ensemble-based adsorption site comparison; the site orientation is given in Supplementary Figure S2; horizontal parallel to the a axis; and vertical parallel to the b axis.
4.4.2 Global Optimization Approach
Figure 4A illustrates the three-step approach that we took to search for the most favorable adsorption configuration of BDO on RuO2(110). The scope of adsorption configurations were successfully narrowed via our approach to ranking these structures based on the adsorption energies. Such an approach enabled us to identify the most energetically favorable adsorption configuration for BDO on RuO2(110). We note that the absolute adsorption energies calculated by GFN-FF and GFN2-xTB are biased since the system we are considering is not taken especially into account in the parameterization of xTB methods (Bannwarth et al., 2021; Bannwarth et al., 2019; Spicher and Grimme, 2020). However, our focus here is to rank the different adsorption structures based on their adsorption energies. Therefore, the absolute accuracy of the adsorption energy in the first two steps only has a minor impact on our approach.
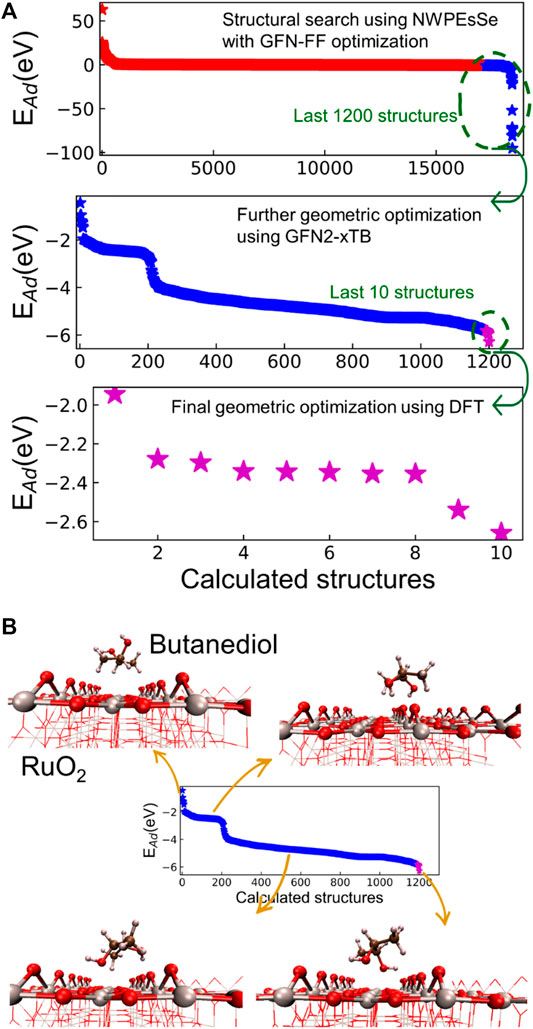
FIGURE 4. (A) Three steps of searching for BDO/RuO2(110) adsorption configuration. The calculated structures have been sorted based on their adsorption energies in each plot. (B) Examples for snapshots of adsorption configurations obtained in the second step. The gray, red, brown, and pink spheres are Ru, O, C, and H atoms, respectively.
Furthermore, we analyzed snapshots of the adsorption configurations during our geometric search. The first step using NWPEsSe and GFN-FF generally screened a variety of BDO/RuO2(110) structures, found a large amount of adsorption configurations, and ruled out unfavorable structures. In the second step involving GFN2-xTB, we were able to refine the obtained structures from the first step and identify several adsorption configurations that were at local minima, as illustrated in Figure 4B. When the hydroxyl groups of BDO face the vacuum layer above the RuO2(110) surface, the adsorption strength is the weakest. When the hydroxyl groups interact with terminal O atoms of RuO2(110), a weak adsorption is achieved. As the hydroxyl groups get closer to the RuO2(110) surface and interact with surface Ru atoms, the adsorption of BDO is strengthened, and the most favorable adsorption configuration occurs when both hydroxyl groups interact with surface Ru5c atoms. The last step uses our DFT-based method using the VASP code, which provides a computationally more expensive but accurate evaluation of several adsorption configurations and their associated adsorption energies.
4.4.3 Comparison of Adsorption Site Testing
Once the final DFT calculations were done on the NWPEsSe-generated structures, we determined which ground-state structure was at the global minimum. Table 2 compares the ensemble-based site testing to the global minimum that was found using NWPEsSe software. The difference in the dihedral angles can be attributed to the methyl groups being perpendicular to the surface for the NWPEsSe-based structure, whereas in the ensemble-based method they are parallel. As a result, the NWPEsSe-based structure is more strongly bonded to the surface, which correlates well with the shorter bond distance between the oxygen of the hydroxyl functional group and the Ru5c site on the surface. The partial charge analysis shown in Figure 3A as obtained using the ensemble-based approach has its methyl groups in the same plane with the carbon-carbon bond suggesting that this configuration would be more favorable than the one that was generated with NWPEsSe software. That is not the case however as the methyl groups of the ensemble-based structure flatten out and interact with the neighboring oxygens (On) causing the bond distance between the hydroxyl functional groups and the surface to elongate, indicating a strain on the surface bonds. On the other hand, the methyl groups in the NWPEsSe-based structure do not interact with the neighboring oxygens, since they are pointing towards the vacuum, allowing for a shorter O-Ru5c bond distance and, as a result, a stronger adsorption energy.
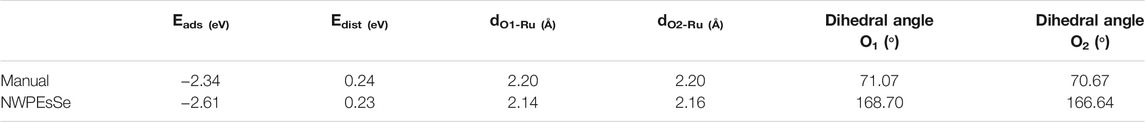
TABLE 2. Comparison of the adsorption energies and specifics of the configurations between ensemble-based approach and the NWPEsSe-based approach in finding the global minimum.
We compare the PDOS analyses of the most favorable adsorption sites resulting from the two methods in Figure 5, with the accompanying partial charge density images of select peaks shown in Figure 6. The energy intervals analyzed for the partial charge density distribution are available in Supplementary Table S3. Comparing Figures 5B,E and Figures 5C,F shows a strong similarity between the two configurations, which is to be expected. This is further supported by Figure 6, which shows almost identical electron cloud distributions around BDO in its respective configurations. The largest difference between the two adsorption configurations is seen in Figures 5B,E with the p-state analysis of the bonded BDO oxygens to the surface identified by F1 and G1. These lower energy states indicate a more stable bond formation, F1 is more peak-like where G1 has more smearing and has shifted to a lower energy. The smearing and shift to lower energy of G1 as compared to F1 indicates a slight increase in stability for the NWPEsSe-based structure.
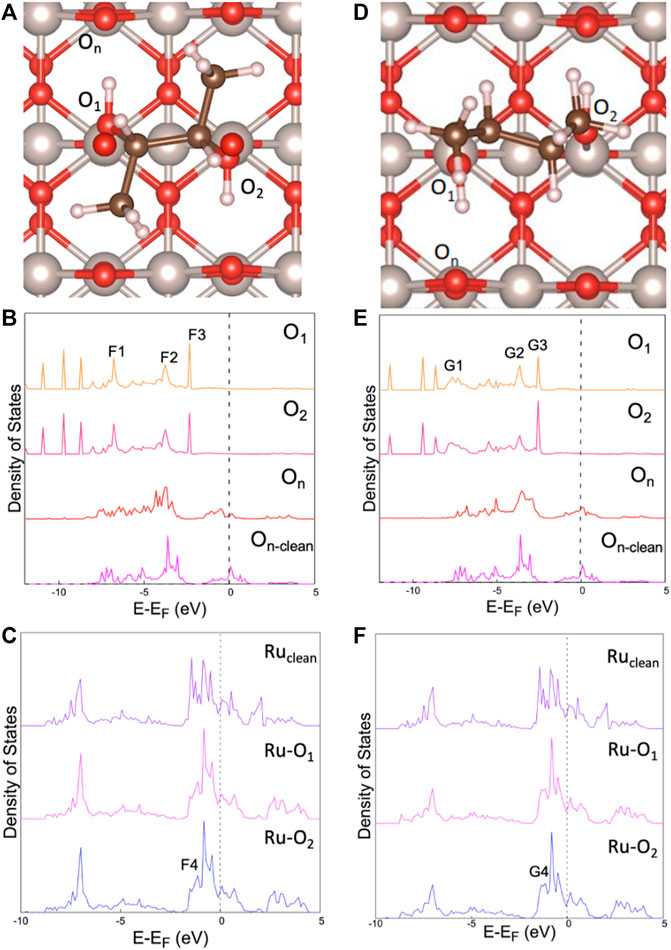
FIGURE 5. PDOS comparing adsorption of BDO on RuO2. (A) diagram of manual adsorption site; (B) p-states of manual site testing; (C) d-states of manual site testing; (D) diagram of NWPEsSe adsorption site; (E) p-states from NWPEsSe generated structure; (F) d-states from NWPEsSe generated structure; O1 and O2 have the same BDO designation shown in Figure 2, On is in reference to the neighboring oxygen bridge atom to BDO, On-clean is the same atom but on the clean surface; Ru-O1 is referring the ruthenium atom adsorbed to O1, same case for Ru-O2; Ruclean is a Ru5c atom without any adsorbates.
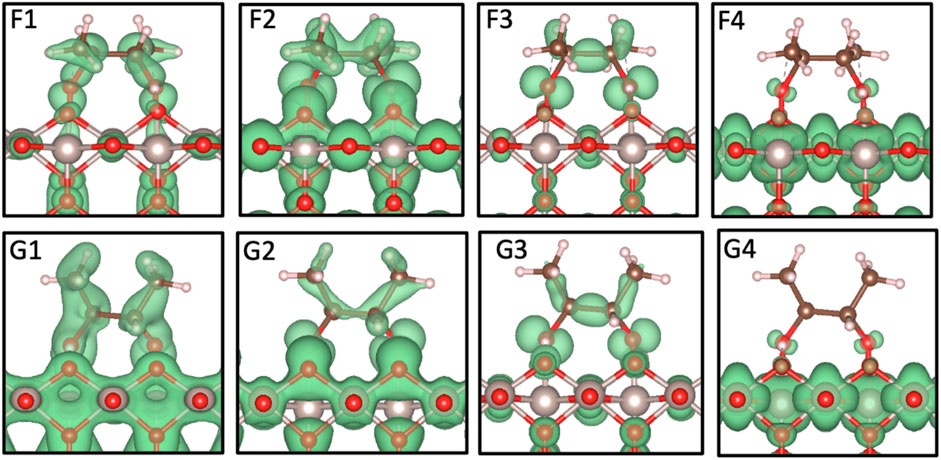
FIGURE 6. Partial charge density distribution images associated with the PDOS peaks in Figure 5; isosurface of 0.0075 electrons/Bohr3. The gray, red, brown, and pink spheres are Ru, O, C, and H atoms, respectively.
The d-states of the two systems are given in Figures 5C,F; as there is only one significant peak that has interactions with the BDO molecule, the partial charge image for each set is included in Figure 6 with the p-state analysis. The peaks being close to the Fermi level show very little interaction with the surface but the distinct peaks across the Fermi level confirm that the system is metallic, which agrees with the literature (Rogers et al., 1958; Berlijn et al., 2017). This is also likely the reason why the PDOS of the On in Figures 5B,E has states around the Fermi level as a part of the bonding within the lattice. Analyzing the F4 and G4 peaks, a small p-shaped orbital can be seen surrounding the hydroxyl oxygens and an accompanying charge distribution can be seen for On (Figure 6); this is likely the result of a very small distribution of states located in the same range. However, most of the charge can clearly be seen in the surface surrounding the Ru cations. The peak isolated by F4 and G4 is more evident in the Ru clean surface PDOS and is noticeably larger in magnitude. The decrease in height for the adsorbed surface is likely the result of the overlap with the hydroxyl oxygen’s p-states.
Looking at the d-band center information seen in Table 3, the clean surface has the highest energy value at −4.10 eV, while the centers are lower in energy at ∼ −4.20 eV and ∼ −4.28 eV for the ensemble-based and NWPEsSe-based structures, respectively. This shift downward is indicative of the surface becoming less reactive once 2,3-butanediol is adsorbed (Kitchin et al., 2004). The d-band width leads to similar conclusions as a decrease in the d-band center energy typically means a broadening of the d-band (Kitchin et al., 2004) as evidenced in Table 3. The ensemble-based d-band center being slightly higher in energy than that of NWPEsSe-based structure also has a correspondingly narrower width. As both are lower in energy than the clean Ru5c atom, they have a broader width, comparatively. The lower d-band center for NWPEsSe-based structure further explains its stronger adsorption energy observed as compared to the ensemble-based structure.
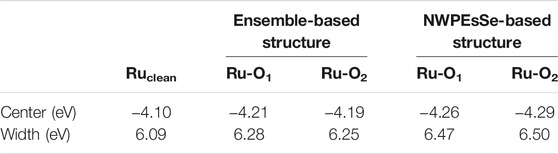
TABLE 3. d-band comparison between the clean Ru5c atom and the Ru5c atoms involved in the adsorption of BDO in the ensemble-based approach and the NWPEsSe-based approach toward obtaining the most favorable ground-state structure.
5 Discussion
5.1 2,3-Butanediol in the Gas Phase
Analyzing the three different reaction pathways toward butene formation, as shown in Figure 1, makes it clear that Pathway 1 is unlikely as it has the highest potential to get stalled in the intermediary product of 1,3-butadiene. This pathway has been explored in the literature as 1,3-butadiene is an important additive in the production of rubber (Sun et al., 2020); it was found to be hard to produce from BDO as 2-butanone was more favorable (Malcolm Winfield, 1945). This is consistent with the reaction energy pathway comparison as seen in Figure 1. Pathways 2 and 3 are more likely as that thermodynamic sink is not present in the same capacity. This has also been found experimentally that both 2-methylpropanal and 2-butanone are the main intermediates in the dehydration of BDO to butene (Zheng et al., 2015).
The HOMO level being primarily occupied by the oxygen p-states indicate that they will mainly determine the reactivity with the surface, as shown in Figure 2. This is later supported by Figure 3, which shows that having the oxygen functional groups face the surface are far more favorable, resulting in chemisorption. This is further supported by the results of the global optimization study. As evidenced by Figure 4B, the least favorable structures obtained through a thorough testing of 1,200 structures were the ones where the BDO functional groups are directed toward the vacuum layer. As the BDO surface-facing orientation is required to promote its eventual dehydration, we expect that this adsorption configuration would be more favorable.
5.2 Adsorption Analysis
The adsorption analysis of BDO on RuO2(110) began by understanding its surface orientation. As is evident by the differential charge analysis (Figure 3) and the global optimization search (Figure 4), having the oxygen functional groups face the surface leads to the most favorable adsorption site. This is an expected result, as the PDOS reveals that the HOMO level was mostly occupied by the oxygen p-states. Additionally, for an optimal chemisorption configuration, the hydroxyl groups need to be parallel with the Ru5c atoms as evidenced by Table 1. While other orientations of the BDO molecule with the surface could have been tested manually, the results from our NWPEsSe-based analysis confirm that the horizontal configuration is the most favorable when BDO adsorbs on a pristine RuO2(110) surface.
Further confirmation of the differential charge analysis at the surface can be obtained through a Bader charge analysis that is given in Table 4, which was completed for both the NWPEsSe-based and ensemble-based determined global minima. In both cases, the Bader charge on the Ru5c atoms decreases with respect to the clean surface indicating a depletion of electrons. On the other hand, the Bader charge analysis of the O1 species, one of the hydroxyl oxygens, increases upon adsorption of BDO as compared to the clean surface indicating an accumulation of electrons. The hydroxyl oxygens Bader net atomic charge doesn’t necessarily indicate a net gain of electrons and that is most likely attributed to how the charge is partitioned in the calculation. Analyzing Figures 3A–C it’s clear that there is both a charge gain and a charge loss occurring around each oxygen species in BDO’s hydroxyl functional groups. Therefore, the Bader analysis is most likely including both in its calculation. Interestingly, in the case of the ensemble-based structure the Bader charge of the O2 species within the adsorbed BDO molecule is unchanged as compared to its gas phase value, while there is slight loss for the O2 species in the NWPEsSe-based structure as compared to the gas phase species. However, these changes are minor as compared to those occurring for the Ru5c species. As such, we conclude that the Ru5c species donates electrons to the hydroxyl oxygen to chemisorb BDO to the metal oxide surface.
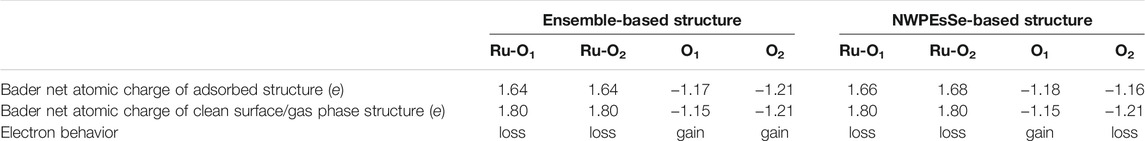
TABLE 4. Bader net atomic charge values for the Ru5c atoms and their respective bonded hydroxyl oxygens for the two ground-state structures in the case of the ensemble-based and the NWPEsSe-based site testing approaches with accompanying clean RuO2(110) surface and gas phase (BDO) Bader net atomic charges for comparison.
The electronic configuration of the two different systems is similar. The PDOS of the main species that are involved in the adsorption of BDO (Figure 5) and the resulting partial charge density distributions (Figure 6) further confirm that both the ensemble-based and the NWPEsSe-based structure chemisorb to the surface. The overlap between the hydroxyl oxygen’s p-states and Ru5c d-states suggest the exchange of electrons. This is evidenced by the distinct partial charge density distributions, specifically between the higher energy peaks shown in Figure 6 (F3, G3, F4, and G4). In these analyses, a p-orbital is clearly seen on the hydroxyl oxygens, and, in the case of F4 and G4, there is significant charge distributed on the Ru cations. The final peak in the p-states, G3 and F3, show the most similarity to the E4 HOMO peak found for the BDO molecule in the gas phase (Figure 2). The corresponding peaks are shifted 0.6 and 0.4 eV lower than the gas phase values for F3 and G3, respectively. The similarity of the partial charge densities is more clearly seen when comparing the F3 and E4 partial charge distributions as the ensemble-based configuration looks more like the converged gas phase structure. In both cases, F3 and G3, the p-orbital cloud is distinct in the hydroxyl oxygens, and the
Between the two analyses, ensemble-based and NWPEsSe-based, the ground-state structure had the same placement on the lattice indicated as Site 1 in Supplementary Figure S2 of the SI. However, the global minimum of the NWPEsSe-based structure has a lower adsorption energy (−2.61 eV) as compared to the ensemble-based local counterpart (−2.34 eV). The lower energy from the NWPEsSe-based structure is likely attributed to the orientation of the methyl groups. With the NWPEsSe-based structure the methyl groups point toward the vacuum layer, making them perpendicular to the surface, as identified by the large dihedral bond angle with the oxygen functional group. This orientation, while having a comparable distortion energy to the ensemble-based structure from the gas-phase BDO, results in shorter bond lengths. Therefore, we hypothesize that in the ensemble-based structure, the flattening of the methyl groups to become parallel with the surface causes a strain on the hydroxyl bond to the surface and the bond lengthens to accommodate it, resulting in a less favorable adsorption energy. This conjecture is supported by the results from the calculations on the 10 lowest structures from the GFN2-xTB program. Their configuration details and adsorption energies are supplied in Supplementary Table S4. Structures 1–3,5, and 6 all have similar dihedral angles, bond lengths, and adsorption energies as compared to the ensemble-based structure. Therefore, we conclude that the ensemble-based structure adsorption site analysis was able to determine one of the lowest energy adsorption configurations but was limited in identifying the global ground-state structure.
We compare the 10 lowest structures from the GFN2-xTB run and their corresponding DFT-based optimizations in Figure 7. The relative adsorption energies are shown as the GFN2-xTB program was not specifically parameterized for metal oxide adsorbate systems and therefore provides unrealistic absolute adsorption energies. As such it highlights the need to further optimize these structures using DFT-based calculations to get more accurate adsorption energies. There is good agreement between the two relative energies (although there are two defined outliers seen in orange and purple, Structures 7 and 9, respectively). Structure 7 has a lower energy as it is closest configuration-wise to the ground-state structure seen in pink, Structure 10. Conversely, Structure 9 has the highest relative energy, making it less favorable. As shown in Figure 7, Structure 9 did not in fact form a strong bond with the surface and instead is flattened out by interacting with the neighboring On’s through hydrogen bonding. The lowest adsorption energy is Structure 10, making it the most favorable conformation and the ground-state structure identified, while Structure 9 is the least favorable. When examining Supplementary Table S4 it is also clear from the bond lengths, dihedral angles, and adsorption energies that Structure 7 is the structure that has the closest conformation to Structure 10. The agreement between the two systems confirms the accuracy of the calculations in determining the ground-state structure.
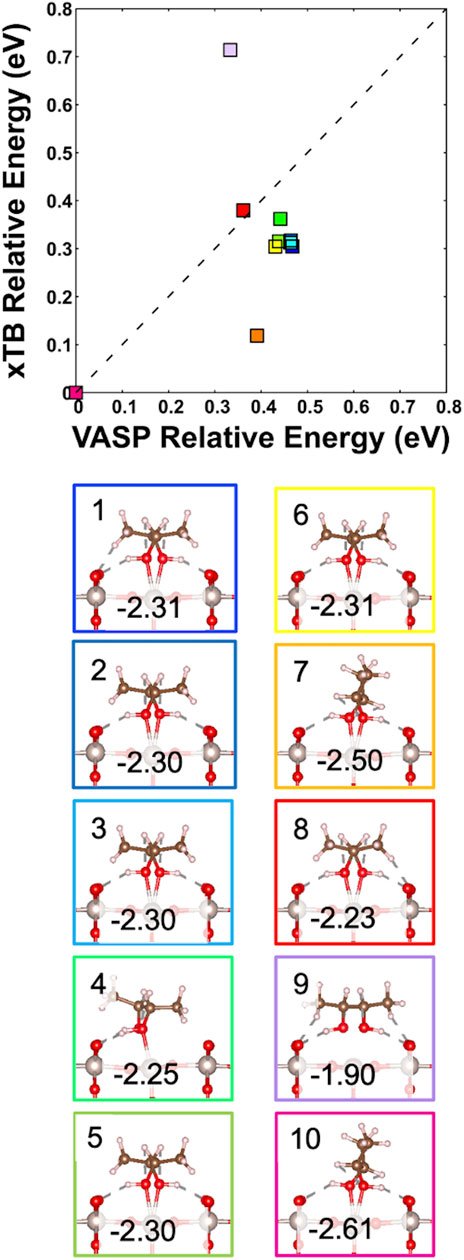
FIGURE 7. Correlation plot between the relative adsorption energies generated from the 10 lowest structures of GFN2-xTB simulation and their corresponding DFT optimized relative adsorption energies (in eV); the color coding in the plot corresponds to the figure images that have their DFT calculated adsorption energies. The gray, red, brown, and pink spheres are Ru, O, C, and H atoms, respectively.
6 Conclusion
Analyzing the energetic pathways of BDO dehydration to butene (Figure 1), it was determined that Pathways 2 and 3 are more favorable since they are less likely to stall in the intermediary phase. By comparing the electronic properties of BDO in the gas phase to when it is adsorbed on the surface, we find that the adsorption of BDO on RuO2(110) is due to the overlap of the hydroxyl oxygens p-states with the Ru5c d-states. A differential charge distribution analysis confirmed the adsorption through a noticeable charge exchange between the hydroxyl groups and the surface. Correlation plots between the GFN2-xTB structures generated using the NWPEsSe software and their corresponding DFT-based optimized adsorption energies show agreement between the systems. Comparison between the ensemble-based approach and the NWPEsSe-based approach for adsorption site testing show that the NWPEsSe-based approach was able to find a more favorable ground-state structure with an adsorption energy of −2.61 eV. The success in using the NWPEsSe software in determining the most favorable ground-state structure opens the possibility of using the global optimizer to be used in more complex adsorption systems. This will be especially beneficial with surfaces that have defects and therefore more nuanced adsorption configurations.
Nomenclature
Resource Identification Initiative
To take part in the Resource Identification Initiative, use the corresponding catalog number and RRID in your current article. For more information about the project and for steps on how to search for an RRID, click here.
Data Availability Statement
The raw data supporting the conclusion of this article will be made available by the authors, without undue reservation.
Author Contributions
All authors listed have made a substantial, direct, and intellectual contribution to the manuscript and approved it for publication.
Funding
This work was funded by the WSU-PNNL Bioproducts Institute, which is a joint research collaboration of Washington State University and the U.S. Department of Energy’s Pacific Northwest National Laboratory. V-AG, RR, and DZ acknowledge funding from U.S. Department of Energy, Office of Basic Energy Sciences, Division of Chemical Sciences, Geosciences and Biosciences project number 47319. This work was also partially funded by the Joint Center for Deployment and Research in Earth Abundant Materials (JCDREAM) in Washington State. This research also used resources of the National Energy Research Scientific Computing Center (NERSC), a U.S. Department of Energy Office of Science User Facility operated under Contract No. DE-AC02-05CH11231. The Pacific Northwest National Laboratory is operated by Battelle for the U.S. DOE.
Conflict of Interest
The authors declare that the research was conducted in the absence of any commercial or financial relationships that could be construed as a potential conflict of interest.
Publisher’s Note
All claims expressed in this article are solely those of the authors and do not necessarily represent those of their affiliated organizations, or those of the publisher, the editors, and the reviewers. Any product that may be evaluated in this article, or claim that may be made by its manufacturer, is not guaranteed or endorsed by the publisher.
Acknowledgments
Part of the computational resources was also provided by the Kamiak HPC under the Center for Institutional Research Computing at Washington State University. We also thank Naseeha Cardwell and Nisa Ulumuddin for fruitful discussions.
Supplementary Material
The Supplementary Material for this article can be found online at: https://www.frontiersin.org/articles/10.3389/fenrg.2021.781001/full#supplementary-material
References
Acharya, D. P., Yoon, Y., Li, Z., Zhang, Z., Lin, X., Mu, R., et al. (2013). Site-specific Imaging of Elemental Steps in Dehydration of Diols on TiO2(110). ACS Nano 7, 10414–10423. doi:10.1021/nn404934q
Aihara, T., Asazuma, K., Miura, H., and Shishido, T. (2020). Highly Active and Durable WO3/Al2O3 Catalysts for Gas-phase Dehydration of Polyols. RSC Adv. 10, 37538–37544. doi:10.1039/D0RA08340B
Bannwarth, C., Caldeweyher, E., Ehlert, S., Hansen, A., Pracht, P., Seibert, J., et al. (2021). Extended Tight‐binding Quantum Chemistry Methods. WIREs Comput. Mol. Sci. 11, e1493. doi:10.1002/WCMS.1493
Bannwarth, C., Ehlert, S., and Grimme, S. (2019). GFN2-xTB-An Accurate and Broadly Parametrized Self-Consistent Tight-Binding Quantum Chemical Method with Multipole Electrostatics and Density-dependent Dispersion Contributions. J. Chem. Theor. Comput. 15, 1652–1671. doi:10.1021/ACS.JCTC.8B01176
Becke, A. D. (1986). Density Functional Calculations of Molecular Bond Energies. J. Chem. Phys. 84, 4524–4529. doi:10.1063/1.450025
Berlijn, T., Snijders, P. C., Delaire, O., Zhou, H.-D., Maier, T. A., Cao, H.-B., et al. (2017). Itinerant Antiferromagnetism in RuO2. Phys. Rev. Lett. 118, 3–8. doi:10.1103/PhysRevLett.118.077201
Guragain, Y. N., and Vadlani, P. V. (2017). 2,3-Butanediol Production Using Klebsiella Oxytoca ATCC 8724: Evaluation of Biomass Derived Sugars and Fed-Batch Fermentation Process. Process Biochem. 58, 25–34. doi:10.1016/J.PROCBIO.2017.05.001
Haines, J., Léger, J. M., and Schulte, O. (1996). Pa3̅ Modified Fluorite-type Structures in Metal Dioxides at High Pressure. Science 271, 629–631. doi:10.1126/science.271.5249.629
Henkelman, G., Arnaldsson, A., and Jónsson, H. (2006). A Fast and Robust Algorithm for Bader Decomposition of Charge Density. Comput. Mater. Sci. 36, 354–360. doi:10.1016/J.COMMATSCI.2005.04.010
Hensley, A. J. R., Wang, Y., and McEwen, J.-S. (2016). Adsorption of Guaiacol on Fe (110) and Pd (111) from First Principles. Surf. Sci. 648, 227–235. doi:10.1016/j.susc.2015.10.030
Kitchin, J. R., Nørskov, J. K., Barteau, M. A., and Chen, J. G. (2004). Modification of the Surface Electronic and Chemical Properties of Pt(111) by Subsurface 3d Transition Metals. J. Chem. Phys. 120, 10240–10246. doi:10.1063/1.1737365
Kresse, G., and Furthmüller, J. (1996). Efficient Iterative Schemes For Ab Initio Total-Energy Calculations Using a Plane-Wave Basis Set. Phys. Rev. B 54, 11169–11186. doi:10.1103/PhysRevB.54.11169
Kresse, G., and Hafner, J. (1993). Ab Initio Molecular Dynamics for Liquid Metals. Phys. Rev. B 47, 558–561. doi:10.1103/PhysRevB.47.558
Lejaeghere, K., Bihlmayer, G., Björkman, T., Blaha, P., Blügel, S., Blum, V., et al. (2016). Reproducibility in Density Functional Theory Calculations of Solids. Science 351, aad3000. doi:10.1126/science.aad3000
Malcolm Winfield, B. E. (1945). The Catalytic Dehydration of 2,3-butanediol to 1,3-butadiene. J. Counc. Sci. Ind. Res. 18, 412–423.
Mittendorfer, F., and Hafner, J. (2001). Density-functional Study of the Adsorption of Benzene on the (111), (100) and (110) Surfaces of Nickel. Surf. Sci. 472, 133–153. doi:10.1016/S0039-6028(00)00929-8
Mu, R., Cantu, D. C., Lin, X., Glezakou, V.-A., Wang, Z., Lyubinetsky, I., et al. (2014). Dimerization Induced Deprotonation of Water on RuO2(110). J. Phys. Chem. Lett. 5, 3445–3450. doi:10.1021/jz501810g
Ohtsuka, S., Nemoto, T., Yotsumoto, R., Yamada, Y., Sato, F., Takahashi, R., et al. (2019). Vapor-phase Catalytic Dehydration of Butanediols to Unsaturated Alcohols over Yttria-Stabilized Zirconia Catalysts. Appl. Catal. A: Gen. 575, 48–57. doi:10.1016/J.APCATA.2019.02.013
Perdew, J. P., Burke, K., and Ernzerhof, M. (1996). Generalized Gradient Approximation Made Simple. Phys. Rev. Lett. 77, 3865–3868. doi:10.1103/PhysRevLett.77.3865
Reuter, K., and Scheffler, M. (2002). Composition, Structure, and Stability of RuO2(110) as a Function of Oxygen Pressure. Phys. Rev. B 65, 1–11. doi:10.1103/PhysRevB.65.035406
Rogers, B. D., Shannon, R. D., Sleight, A. W., and Gillson, J. L. (1958). Crystal Chemistry of Metal Dioxides with Rutile-Related Structures. The Chemical Society. Available at: https://pubs.acs.org/sharingguidelines (Accessed April 29, 2021).
Spicher, S., and Grimme, S. (2020). Robust Atomistic Modeling of Materials, Organometallic, and Biochemical Systems. Angew. Chem. Int. Ed. 59, 15665–15673. doi:10.1002/ANIE.202004239
Sun, D., Li, Y., Yang, C., Su, Y., Yamada, Y., and Sato, S. (2020). Production of 1,3-butadiene from Biomass-Derived C4 Alcohols. Fuel Process. Technol. 197, 106193. doi:10.1016/J.FUPROC.2019.106193
Sun, J., Remsing, R. C., Zhang, Y., Sun, Z., Ruzsinszky, A., Peng, H., et al. (2015). SCAN: An Efficient Density Functional Yielding Accurate Structures and Energies of Diversely-Bonded Materials. Available at: http://arxiv.org/abs/1511.01089 (Accessed October 12, 2020).
Wang, W.-C., and Tao, L. (2016). Bio-jet Fuel Conversion Technologies. Renew. Sustain. Energ. Rev. 53, 801–822. doi:10.1016/j.rser.2015.09.016
Zhang, J., Glezakou, V.-A., Rousseau, R., and Nguyen, M.-T. (2020). NWPEsSe: An Adaptive-Learning Global Optimization Algorithm for Nanosized Cluster Systems. J. Chem. Theor. Comput. 16, 3947–3958. doi:10.1021/ACS.JCTC.9B01107
Zheng, Q., Wales, M. D., Heidlage, M. G., Rezac, M., Wang, H., Bossmann, S. H., et al. (2015). Conversion of 2,3-butanediol to Butenes over Bifunctional Catalysts in a Single Reactor. J. Catal. 330, 222–237. doi:10.1016/j.jcat.2015.07.004
Keywords: energy, butene, RuO2, computational catalysis, butanediol, bio-jet fuel, adsorption analysis
Citation: Moore C, Zhang D, Rousseau R, Glezakou V-A and McEwen J-S (2022) Determining the Adsorption Energetics of 2,3-Butanediol on RuO2(110): Coupling First-Principles Calculations With Global Optimizers. Front. Energy Res. 9:781001. doi: 10.3389/fenrg.2021.781001
Received: 22 September 2021; Accepted: 10 November 2021;
Published: 13 January 2022.
Edited by:
Kristin C. Lewis, Volpe National Transportation Systems Center, United StatesReviewed by:
Yaqiong Su, Xi’an Jiaotong University, ChinaIbukun Oluwoye, Murdoch University, Australia
Copyright © 2022 Moore, Zhang, Rousseau, Glezakou and McEwen. This is an open-access article distributed under the terms of the Creative Commons Attribution License (CC BY). The use, distribution or reproduction in other forums is permitted, provided the original author(s) and the copyright owner(s) are credited and that the original publication in this journal is cited, in accordance with accepted academic practice. No use, distribution or reproduction is permitted which does not comply with these terms.
*Correspondence: Vassiliki-Alexandra Glezakou, vanda.glezakou@pnnl.gov; Roger Rousseau, Roger.Rousseau@pnnl.gov; Jean-Sabin McEwen, js.mcewen@wsu.edu