Multiscale Shear Properties and Flow Performance of Milled Woody Biomass
 Jordan Klinger1*
  Nepu Saha1
  Tiasha Bhattacharjee1 Susan Carilli1
  Wencheng Jin1
  Yidong Xia1
  Richard Daniel2
  Carolyn Burns2
  Oyelayo Ajayi3
  Ziwei Cheng4
  Ricardo Navar4
  Troy Semelsberger4
- 1Energy and Environment Science and Technology Directorate, Idaho National Laboratory, Idaho Falls, ID, United States
- 2Energy and Environment Directorate, Pacific Northwest National Laboratory, Richland, WA, United States
- 3Applied Materials Division, Argonne National Laboratory, Lemont, IL, United States
- 4Material Physics Applications Division, Los Alamos National Laboratory, Los Alamos, NM, United States
One dominant challenge facing the development of biorefineries is achieving consistent system throughput with highly variant biomass feedstock quality and handling performance. Current handling unit operations are adapted from other sectors (primarily agriculture), where some simplifying assumptions about granular mechanics and flow performance do not translate well to a highly compressible and anisotropic material with nonlinear time- and stress-dependent properties. This work explores the shear and frictional properties of loblolly pine at multiple experimental test apparatus and particle scales to elucidate a property window that defines the shear behavior over a range of material attributes (particle size, size distribution, moisture content, etc.). In general, it was observed that the bulk internal friction and apparent cohesion depend strongly on both the stress state of the sample in granular shear testers and the overall particle size and distribution span. For equipment designed to characterize the quasi-static shear stress failure of bulk materials ranging from 50 to 1,000 ml in test volume, similar test results were observed for finely milled particles (50% passing size of 1.4 mm) with a narrow size distribution (span between 10 and 90% passing size of 0.9 mm), while stress chaining and over-torque issues persisted for the bench-scale test apparatus for larger particle sizes or widely dispersed sample sizes. Measurement of the anisotropic particle–particle friction ranged from coefficients of approximately 0.20 to 0.45 and resulted in significantly higher and more variable friction measurements for larger particle sizes and in perpendicular alignment orientations. To supplement these laboratory-scale properties, this work explores the flow of loblolly pine and Douglas fir through a pilot-scale wedge-shaped hopper and a screw feeder. For the gravity-driven hopper flow, the critical arching distance and mass discharge rate ranged from approximately 10 to 30 mm and 2 to 16 tons/hour, respectively, for both materials, where the arching distance depends strongly on the overall particle size and depends less on the hopper inclination angle. Comparatively, the auger feeder was found to be much more impacted by the size of the particles, where smaller particles had a more consistent and stable flow while consuming less power.
1 Introduction
Due to the limited resource of fossil fuel and growing sentiment toward global warming, alternative sources of energy are today’s demand. Biomass is considered one of the most abundant and easy-to-access alternative renewable resources of energy and chemicals (Binder and Raines, 2009; Bilgili et al., 2017). However, handling of biomass feedstock is one of the key challenges to the commercialization of biomass as an energy source. Poor understanding of biomass handling, especially with regard to biomass flowability during feedstock conversion process design, may result in excessive process downtime due to common granular material interactions such as unanticipated feed silo ratholing, screw feeder jamming, etc. (Ramírez-Gómez, 2016; Dale, 2017; Ilic et al., 2018; Cheng et al., 2021). Many factors influence the flow properties of biomass materials, such as particle size, particle shape, moisture content, and surface roughness (Liu et al., 2015; Lu et al., 2018). A complete understanding of the flow behavior of biomass as functions of their intrinsic material properties is required to minimize the downtime and improve the commercialization feasibility of feedstock conversion processes.
Until the mid-20th century, the bulk solid flow mainly focused on pharmaceutical ingredients and food powders with relatively regular particle shape and size and little if any moisture content (Fitzpatrick et al., 2004; Faqih et al., 2007; Hou and Sun, 2008; Zhou et al., 2010). The traditional methods used for the powder flowability characterization include the angle of repose test, packing property test, gravity discharge test, and shear test (Krantz et al., 2009; Leturia et al., 2014; Rezaei et al., 2018). Typical properties of biomass particles, which include high moisture content, hygroscopic nature, low bulk density, heterogeneous shapes, and fibrous nature, make them different from the conventional granular particles (e.g., pharmaceutical ingredients). Since the powder flow is multidimensional (Prescott and Barnum, 2000), these unique characteristics of biomass make it more difficult to experimentally measure the characteristic properties. For example, the standard characterization tests suffer from either an inadequate measurement of full stress state (e.g., ring shear test) or limited strain range to reach the critical shear state (e.g., triaxial shear test) for granular biomass feedstocks (Barletta et al., 2015; Hernandez et al., 2017; Lu et al., 2021b).
A variety of shear characterization techniques exist on the market. These range in complexity from rotating plates common in commercial rheometers (or linear stages) to textured cups and customized devices/cells, with a variety of shear mechanisms/zones to accommodate non-idealities in large or non-uniform samples. It is of scientific and commercial interest to evaluate the performance of the range of available commercial and custom shear testers to gain confidence in their ability to accurately characterize the flowability of complex biomass feedstocks and enable a broader range of material characterization techniques to academia and industry. In general, these devices measure the resistance to dynamic or quasi-static (dependent on the rate) shearing with varying applied stresses. These devices usually measure either a continuous shear response (more typical to rheometer-style devices) or create discretized test conditions where the bulk is either re-tested or exchanged between test zones (more typical of “granular testers”). Typically, granular tests preformat the granular solids to yield a given internal stress and particle packing (void volume) configuration. By preformatting the material over a range of internal stresses and measuring the force required to initiate motion, one can characterize apparent internal friction, bulk cohesion, and the unconfined yield strength and major principal stresses through a Mohr’s circle analysis (Comanici and Barsanescu, 2018; Westover and Hartley, 2018; Pachón-Morales et al., 2020). Compared to granular testers, rheometers are more common due to their ease of use and ability to quantify the shear behavior of both viscous fluids and semi-solid materials (such as yield stress fluids). However, for granular materials, they are known to have torque and particle size limitations stemming from the tendency of granular materials to develop stress chains between test geometry surfaces and resulting in bias, noisy, or stochastic measurements because of convoluted impacting factors from particle size and morphology-induced complex packing, interlocking, etc. (Senff et al., 2009; Leturia et al., 2014). While the physical properties of low-moisture, granular biomass feedstocks drive the use of specialized test instruments (e.g., the shear cells developed by Jenike, Schulze, and Peschl) for granular materials, the ubiquity of rheometers in industrial and research laboratory settings facilitates their potential use as opportunistic replacements for specialized granular testing equipment. However, several factors, such as specialized geometries and test apparatuses, limit the use of rheometers for testing granular materials. Regardless of the instrument used to carry out material shear characterization, the main thrust of any characterization effort is to enable 1) predictive assessment of material feeding and handling behaviors and 2) evaluation of the prime impacts of material attributes on handling operation performance. As a first step in meeting this goal for biomass feedstock materials, it is critical to benchmark the effectiveness and impact of these characterization techniques and measurement scales on shear properties while working with biomass particles of various sizes.
To this end, we investigated the bulk shear failure of softwoods resulting in an apparent internal friction angle and bulk cohesion as well as contributing factors of particle–particle and particle–surface frictions using various testers, including a Schulze ring shear tester, a high precision air bearing rheometer, and a Freeman FT4 powder rheometer. These shear characterizations are performed at different scales, in addition to a range of particle scales to collectively contribute to this multiscale analysis. In particulate systems, as in the present study of pine particles, the complex kinematics of micromechanics of the particles’ motion and rearrangement also contribute to the measured friction. Nevertheless, the examination of the particle surface features and structures provides some insight into the strong anisotropic friction behavior of the pine particles. This study also explored the impact of the material attributes on the flow performance by gravity-driven flow in a variable wedge hopper and mechanically assisted flow in a screw feeder. Finally, the applicability and limitations of the characterization techniques were discussed.
2 Materials and Methods
2.1 Materials
This study on the multiscale shear properties focuses on loblolly pine grown on plantations (Edgefield, South Carolina, approximately 25 years of maturity) and collected using relevant industrial methods. Whole trees were cut (Tigercat 724G feller buncher) and pulled by a grapple skidder (Tigercat 630E grapple skidder) to loading decks. The whole trees passed through a flail chain system to remove most of the bark, limbs, and needles on the way to the infeed of the chipper (Peterson Pacific 5000H disc knife chipper) by knuckle boom. The remaining chipped and de-barked stem/bole was loaded into primary transportation and stored outdoors at Idaho National Laboratory (INL). The pine samples were then further size-reduced using a Schutte Buffalo (18 7,300) hammer mill with a 12 mm screen. The wood chips were air-dried over 24 h at 105°C to an approximate moisture content of 10%. The samples then went through particle size exclusion performed with a continuous sieve system (SWECO-ZS24C4444INP3WC) to make sample volumes needed for testing. Sample nomenclature is by the sieve screen size obtained from this separation, and the actual size distribution is noted in the respective analysis. The continuous and imperfect nature of this separator yields an actual size distribution that is slightly more dispersed than the nominal size class suggests but still has >85% of particles, by mass, within the stated class.
The Douglas fir samples used in this study were obtained and preprocessed by Forest Concepts (Auburn, WA) with their rotary sheer size reduction technique. Clean, debarked logs were sourced from the Pacific northwest and chipped prior to arriving at Forest Concepts. These chips were processed as-received (green moisture, ∼35%–40%) through a nominal 4-mm crumbling rotor set and sieved between 9.5 mm (3/8 inch) and 2.4 mm (3/32 inch). Particles over the sieve top size were recirculated until all material passed through to the smaller sizes, and the fines below the bottom screen were not used in this study. A portion of the material between these screen sizes was set aside and dried (nominally labeled 4 mm), while the rest was carried to produce the smaller sample sizes. The nominal 2- and 1-mm samples were produced in a similar manner, with sieve screening between 4.0 mm (5/32 in)–0.8 mm (20 mesh) and 1.7 mm (10 mesh)–0.4 mm (40 mesh) for the samples, respectively. After the 2-mm nominal reduction, the sample was dried prior to producing the 1-mm nominal sample.
The size distribution and bulk density, along with the nomenclature (used in the later sections) of the feedstocks, are shown in Table 1. The particle size distributions (approximately 100 g samples) were measured in a stack of analytical sieves (RX-30 W.S. Tyler Rotap). The sieve stack was agitated for 15 min to achieve size separation, and the recovered mass on each screen was measured on a balance with readability to 0.01 g. Particle size distribution measurements were performed in triplicate. In the case of the incremental particle classes (S1–S5), the whole material distribution was used to estimate the size distribution parameters with a log–normal distribution fitted through least-squares regression. As listed in Table 1, the particle size and size distribution of the investigated samples span multiple classes. Quantitatively, there is up to approximately an order of magnitude (D50 ranging from 0.69 to 5.26) change in particle scales studied.
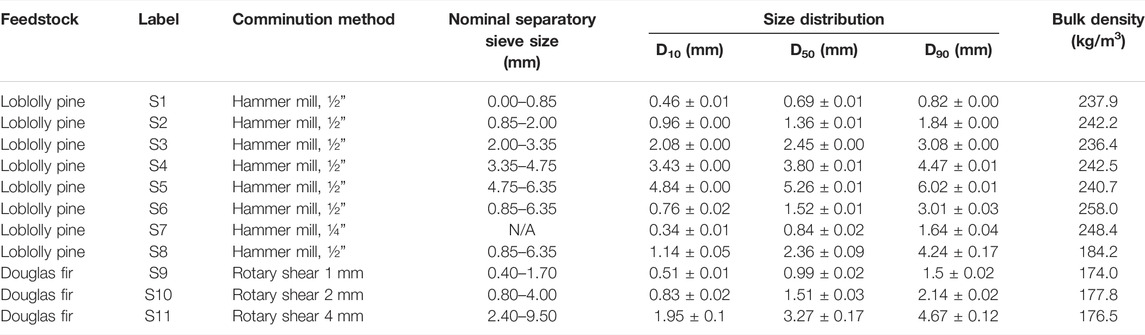
TABLE 1. Size distribution and bulk density of the feedstocks.
2.2 Methods
2.2.1 Shear Test
Shear test of the studied feedstock (denoted “S1”–“S6” in Table 1) was conducted using three different testing instruments, including a Schulze ring shear tester, a high precision air bearing rheometer, and a Freeman FT4 powder rheometer, to understand the limitations of the characterization techniques. An automated Schulze ring shear tester (Dietmar Schulze Schüttgutmesstechnik, Wolfenbüttel, Germany) was used to measure the shear strength of the materials using a size M shear cell (outer diameter of 20 cm and inner diameter of 10 cm) as per ASTM D6773-08. The comparison tests were performed at 1, 5, and 10 kPa pre-shear consolidation stresses, followed by four varying levels of normal stress to develop the yield criterion. For reference, the ring shear tester has a large annular cross-section with an outer diameter of approximately 200 mm and a material depth of 40 mm with a test volume of 900 ml and a rotational speed of 0.02 rad/min, resulting in a quasi-static yielding measurement.
An AR 2000 high-precision air-bearing rheometer (TA Instruments, New Castle, DE) was used to characterize the stress response of sized fractions of a loblolly pine biomass feedstock as a function of normal force loads spanning 0.2–5 N (nominally 0.1–2.5 kPa) and at an angular velocity of 0.03 rad/s. To maintain normal force targets during testing, the rheometer was allowed to adjust its own gap (between −2 and +5 mm deeper into the material as needed). The test was conducted in a test cup with an irregular finned baseplate and baffled fins on the wall. For the majority of measurements, the diameter of the base was 64.0 mm, while the base asperities were 2 mm tall and 1 mm width. The radial fins were 1 mm high and ran the length of the wall (20 mm). For select measurements, 55.0 and 59.5 mm bases were used to evaluate the impact of base radius on the measurement. For all tests, a 50-mm plate rotor with matching irregular fins was used. All tests employed approximately 10 mm of fill material. In general, loblolly pine samples were tested in their as-received condition. However, a limited set of tests were conducted with loblolly pines that had been soaked in room-temperature (20 ± 2°C) deionized water for 24 h and free-drained (resulting in loblolly pine with approximately 70% moisture by mass). In total, 14 separate “shear vs. normal force response” curves were characterized to characterize the impact of loblolly pine size fraction and moisture content as well as the impact of test geometry size on measurements made by the standard laboratory rheometer.
This study also examined the rheological properties measured via a Freeman FT4 powder rheometer (Norcross, GA). The primary use of the instrument is to characterize the flow properties of solid particles, while offering the ability to quantify the flow properties under dynamic conditions. External variables influencing the flow properties include consolidation, composition, wall friction, particle size, aeration, moisture, shear rate, and storage time. Critical material attributes focused on including particle size and distribution and moisture content. For these tests, a 50-mm diameter cup was used. The rotational rates were varied from 10 to 100 mm/s, and the applied normal stress ranged from 5 to 15 kPa in a similar range to those studied in the Schulze tester.
2.2.2 Multiscale Friction
A test method to directly measure the instantaneous particle–particle and particle–wall friction of biomass materials was developed to probe how friction changed under different conditions. The method is based on the adaptation of a high-precision reciprocating sliding tribometer shown in Supplementary Figure S1. Tribometers are devices designed specifically to measure friction and can measure normal and tangential forces at a contact interface at a very high sampling rate (>1,000 Hz) and hence can provide fine details of instantaneous friction behavior at contact interface. The setup for biomass friction measurement consists of a stationary top rectangular (12 × 10 × 6.5 mm) plate made of the wall material and a moving lower rectangular (45 × 40 × 6.5 mm) plate in reciprocating motion (see Supplementary Figure S1B). The contact kinematics of the Jenike shear tester and the reciprocating tribometer are indeed very similar; there are some salient differences between the two measurement techniques. The Jenike shear tester measures the shear strength of confined and consolidated bulk granular materials, while the tribometer measures instantaneous frictional interactions between ensembles of unconfined particles. Comparison of the average friction or shear forces (shear stress) from tribometer and the shear strength from Jenike tester could be instructive and provide potential connection between the two test methods. The tribometer data provide fine details that enable a better understanding of contact dynamics and physics governing particle interaction during shear, such as the anisotropy of friction in irregular shaped particles. Furthermore, the tribometer requires relatively small quantity of materials for testing, while the Jenike shear cell could require a considerable amount of material, depending on the cell size.
For the biomass material friction measurement, a copious amount of biomass material was attached to the lower plate. A second layer of loose biomass material is placed on top of the attached layer to accommodate the shear during testing. For particle–particle friction measurements, the biomass material is attached to the top plate as well. For particle–wall friction measurement, the top plate (made of the wall material of interest) without biomass material is slid over the loss biomass layer. Both the normal and tangential forces are measured during sliding. The test parameters for friction measurement in the tribometer include pressure (normal force), shear rate (sliding speed), stroke length, and temperature. The normal loads of 5, 10, 15, and 25 N impose a nominal pressure of about 42 kPa (6 Psi), 83 kPa (12 Psi), 125 kPa (18 Psi), and 208 kPa (30 Psi), respectively. It should be noted that the interparticle pressures were considerably higher, as indicated by the pressure map. For each load, friction measurements were conducted at sliding speeds of 1.67, 3.33, 5.0, and 6.67 mm/sec. Five replicate measurements were made under each test condition to test the range of variability in the frictional behavior of the tested biomass materials. All the tests were conducted under ambient conditions.
Scanning electron microscopy (SEM) examination of the pine particle surfaces was also conducted to enable better understanding of the frictional behavior. An FEI Quanta 400F environmental SEM system was used for the examination in a secondary electron imaging (SEI) mode. A relatively low accelerating voltage of 1.0 kV was used for the SEM examination in order to minimize the charging effect because the particles of pine biomass material are not electrically conducting. The characteristic features on the surfaces of the pine particles in different orientations were examined.
2.2.3 Flow Performance
To understand and demonstrate how variable material attributes impact the flow performance in real flow systems, five samples (denoted “S7”–“S11” in Table 1) were tested in the wedge hopper and the Acrison® screw feeder. A custom hopper with an adjustable outlet and sidewalls was used to measure the critical arching distance and flow rate of the studied feedstocks. The hopper consists of two side walls and two vertical end walls. For the critical arching distance and flow tests, around 15 kg of sample was loaded in the adjustable hopper for each batch test. The inclination angle of the side walls was varied between 28 and 36° at 4° intervals, where the end walls remained 400 mm apart during all tests. The hopper opening was increased step-wise using 2-step motors attached with the two side walls. The minimum opening at which all the loaded material smoothly flows out from the hopper is defined as the critical arching distance of the material. The critical arching distance was determined for each sample at each inclination angle. The flow test was conducted at nine random openings (> critical arching) of the hopper. The time required to pass all the material through the hopper opening was recorded, which was ultimately used for the flow rate calculation. All these tests were conducted at least twice.
The feeding behavior of each sample was further tested using the Acrison® Bin Weight Screw Feeder (model 402X-250-75-BDF1.5-E/2). This unit consists of a large feed bin atop an interchangeable feed screw auger and several conditioning augers slightly above the feed screw to mix the material and ensure reliable flow. These tests used a 63-mm diameter solid shaft screw with a pitch of equal dimension. The entire unit is mounted on load cells to measure the system mass and connected to a power meter, allowing for measurements of the feed rate and power consumption.
During the feeder tests, the unit was operated under two different modes: 1) controlled auger rotational frequency and 2) controlled loss-in-mass feed rate with active control. In mode (1), the rotational speeds of the auger were set at 10, 20, 30, 40, and 50% of its full capacity. In mode (2), the tests were conducted at set feed rates of 20, 40, 60, 80, and 100 pounds per hour (LBH). For all tests, the mass feed rate was recorded by the feeder controller and archived in a laptop computer via a custom LabView VI. These data were further used to calculate the specific power consumption of each sample under both operational modes. All tests were performed in duplicate for each sample.
3 Results and Discussion
3.1 Effect of Measurement Techniques on Shear Properties
3.1.1 Schulze Ring Shear Tester
Figure 1 shows the shear stress of feedstock S2 under three different pre-shear stresses (1, 5, and 10 kPa) using the RST technique. The apparent internal friction is relatively consistent (41.6 ± 2.0°, 42.2 ± 0.8°, and 42.6 ± 1.0°) among the three pre-shear stress conditions, and their standard deviation is within experimental variability. The results also show a slight increase in the average value with increasing pre-shear stress. The bulk cohesion shows an increase with increasing pre-shear conditions and is approximately 0.08 ± 0.01, 0.35 ± 0.04, and 0.85 ± 0.25 kPa for initial pre-shear of 1, 5, and 10 kPa, respectively. The values for the analysis are tabulated in Table 2. As the shear condition approached the pre-shear condition, the yield surface has a slightly sub-linear decrease that is accounted for the prediction of the principal stresses. Figure 1 also shows the 95% confidence interval bands for the respective yield loci. For presentation and clarity, the compressive stress,
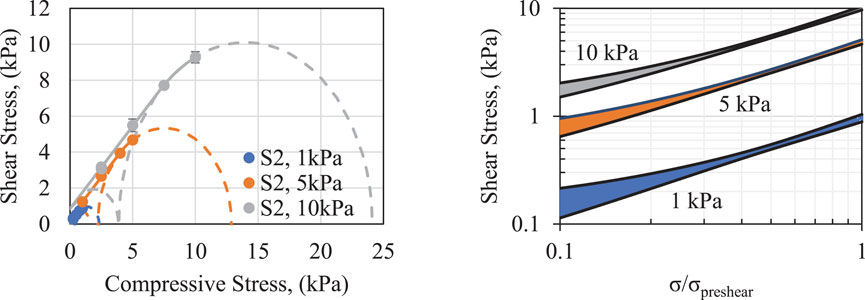
FIGURE 1. (Left) Ring shear test for sample S2 at pre-shear conditions of 1, 5, and 10 kPa. The error bars represent the standard deviation between 10 measurements. (Right) Log–log scale plot of the 95% confidence interval bands for the yield loci at the three conditions with the compressive stress condition normalized by the applied pre-shear stress as labeled.
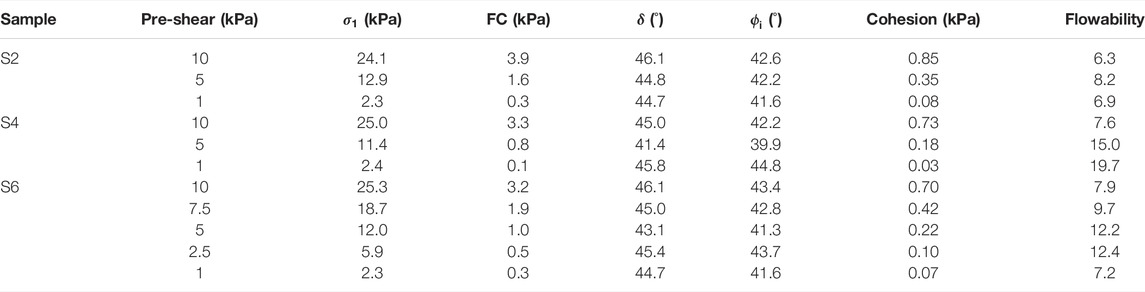
TABLE 2. Shear properties of loblolly pine (S2, S4, and S6) from the RST.
These testing procedures were extended to two additional samples, S6 and S4, to compare a relatively broad particle size distribution and an overall larger particle size distribution. These overall results from the RST are summarized in Table 2, where
The range in the unconfined yield strength measured here for pine samples S2, S4, and S6 are similar to those reported by Falk et al. (2015), which ranged from approximately 0.3 to 3.0 kPa over the similar pre-shear stress region. In the testing of mixed pine chips at a 15 kPa normal pressure in a Jenike shear cell, Stasiak et al. (2018) reported lower values of internal friction (31.3°) and higher values of cohesion (2.5 kPa). This could be due to the difference in the test method as well as testing at higher normal pressure conditions. Miccio et al. (2013) measured the shear properties of several sawdust samples at relatively low pre-shear conditions in an RST and found similar values for cohesion (0.12 and 0.16 kPa) and internal friction (43.3 and 45.6°) at ∼0.79 kPa pre-shear. Their testing of olive husks at higher normal stress conditions also resulted in similar values to the wood reported here (42.8° internal friction and 0.27 kPa cohesion at 4.4 kPa pre-shear).
When examining the internal friction and cohesion, there can be some shift or translation due to different levels of pre-shear compression stress. This is related to the stress-memory of the material and can be significant for biomass. Between different levels of pre-shear stress, changes in the cohesion and in some cases the internal friction were observed (Chen et al., 2018; Fanesi et al., 2021). As a result, the magnitude of the measured shear properties, as well as the changes in the stress memory to the generalized size and shape parameters, was further studied to understand their effect on biomass rotational shear. The bulk cohesion of additional loblolly pine samples, shown in Figure 2, is well-described by a power-law-type relation with increasing stress (for example, see the sample trend for S6 in the Supplementary Figure S2 with R2 > 0.99 and standard error in a cohesion prediction of 0.001 kPa or 0.2%–2%). As shown in Figure 2, the smaller particle size fractions (e.g., S1 and S2) appear to have higher cohesion, and the bulk cohesion decreases with an increase in particle size. It is apparent that the particle size/distribution is a material attribute that impacts the apparent cohesion and the flow behavior of the materials. Materials with smaller particle sizes or more fine contents tend to have higher cohesion and lower flowability than those with larger particle sizes and fewer fines. This is because smaller particles or more distributed particles led to more contact points, thereby increasing apparent cohesion (Shi et al., 2018). A more comprehensive statistical investigation of how particle size and size distribution quantitatively track with these shear properties is planned for future work.
FIGURE 2. Bulk cohesion for various size classes of loblolly pine under different pre-shear stress conditions.
3.1.2 High Precision Air Bearing Rheometer
A select subset of results collected in the TA rheometer system using different size loblolly pin biomass samples (S2, S4, and S6) and tested under the same nominal measuring conditions (cup size and moisture content) are summarized in Table 3. In general, the measured values of the internal friction are close to those measured in the RST, however with the exception of the larger particle sizes (S4) where a significantly lower internal friction was recorded. Here, direct comparison of μ for S4 and the other two materials reported in Table 3 finds S4 to be approximately 15% smaller, whereas S2 and S6 agree with the RST measurement within ∼3%. These measurements with larger particles also show the most variable or widest distributions of recorded values. This phenomenon is likely due to a coupled interaction of equipment limitations along with material impacts (e.g., limited shear region gap relative to measured particle dimension). In general, the apparent cohesion for all materials and trials trended toward 0 kPa, likely due to the comparatively low applied normal stress achievable by this commercial unit (typically 3.5 kPa or less).
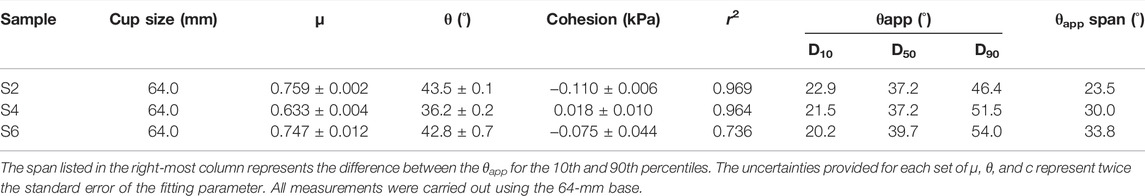
TABLE 3. Best-fit constitutive parameters (µ and c) and dynamic friction angle (θ) as determined by the linear regression analysis of source measurements for loblolly pine along with the apparent dynamic (θapp) angle at three selected percentiles.
The measured normal force (σ) and torque (τ) data depend on how the time series measurements at each normal force condition are interpreted, and for this study, the values were taken each 0.3 s. Because these tests are performed dynamically, many points are captured during a test. Through replication, the tests were composited into a single data series where linear regression was used to fit the data series. For sample S2, the fit parameters for friction angle and cohesion were 43.5 ± 0.1° and −0.110 ± 0.006 kPa, respectively. Compared to the granular tester discussed earlier, the friction angle was biased slightly low but very close in the overall magnitude. The predicted cohesion (essentially zero) is closer to the lower end of the applied normal force (∼1 kPa) of the granular tester. Distributions of the apparent dynamic friction angle were also generated to describe the range of commonly observed values with the 10th, 50th, and 90th percentile values presented in Table 3.
Parametric studies on the TA rheometer data were also distilled through statistical analysis to determine the most impactful material attributes and test conditions. Figure 3 shows the aggregated shear stress (τ) measured as a function of the applied normal stress (σ) for all 14 loblolly pine measurement sets presented in Supplementary Table S1. Each point in Figure 3 represents a single 3.3 Hz measurement. The data presented in Figure 3 suggest that, as expected, normal and shear stresses are correlated. However, the correlation is broadly distributed (i.e., it is not characterized by a singular or narrowly distributed apparent friction angle). Rather, the combination of system parameters (wood moisture content, feedstock size, test cup diameter, etc.), coupled with the evolution of the particle configuration in the test geometry itself, leads to the variation in the stress required to maintain parallel plate rotation. That is, variation in the apparent dynamic friction arises from both natural variation in the orientation of the wood particles (which allows sliding in some configurations or leads to stress chaining in others) and variation associated with the system configuration itself (cup size and wood moisture content).
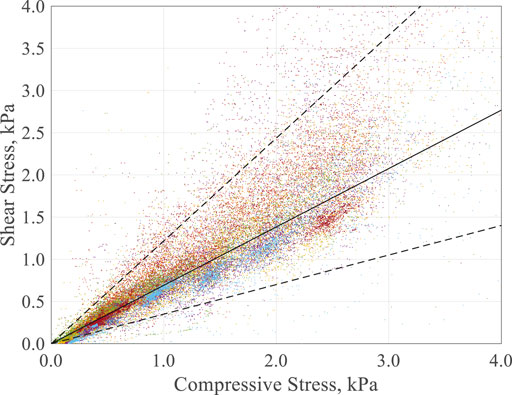
FIGURE 3. Collected shear stress (τ) vs. normal stress (σ). The solid line represents the median apparent friction angle (θapp), while the two dashed lines represent the 5th and 95th percentiles of θapp. The marker color indicates replicate tests.
Different from the analysis and conclusions from the RST above, data gathered on this rheometer in Figure 3 suggest that the aggregate granular response of loblolly pine, at least as characterized by the TA rheometer, was approximately Columbic with no apparent stress of cohesion over the range of normal forces tested (roughly 0–3 kPa). The loblolly pine, appearing to be a cohesionless Columbic material in this stress range, means that the apparent dynamic friction angle (θapp) should be independent of the applied normal force under the tested conditions. Figure 4 shows the probability and cumulative density functions for all θapp measured. The distribution is approximately Gaussian with a median and average friction angle of 34.7 and 36.3°, respectively. The configurational variation of the friction angle manifests by a relatively broad distribution; here, the 2-sigma (i.e., the 5th and 95th percentiles) are 19.3 and 50.6° and represent a roughly ±15° confidence bound.
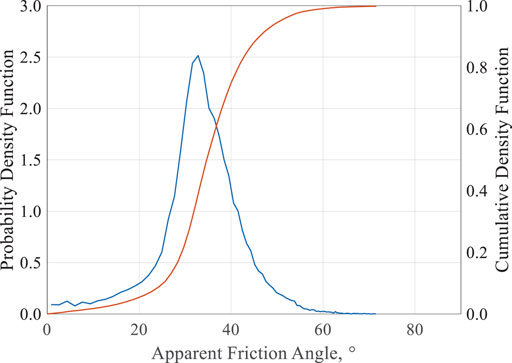
FIGURE 4. Collected apparent granular friction angle (θapp) for all 14 measurement sets in Supplementary Table S1. The blue line indicates the probability density function, while the orange shows the cumulative density function.
3.1.3 FT4 Rheometer
Results obtained in an FT4 rheometer are shown in Figure 5 (and tabulated in Supplementary Table S2), again, for the same three loblolly pine samples (S2, S4, and S6). Overall, the translation between the normal and measured shear stresses is similar in magnitude between the feedstocks. The largest particle size among those three samples, 3.35–4.75 mm (S4) sample, has the lowest resultant friction (∼15% lower), while the smallest (S2) and the broad (S6) samples have similar (within 6%) and slightly higher friction angles, respectively. Like the common RST analysis, the apparent bulk cohesion is extracted by extrapolating the yield surface back to a zero applied compressive stress. Comparatively to the lower particle size discussed above, these data are the highest in the largest particle size (S4) and are significantly higher in magnitude (5.9 kPa), as compared to what was measured in the RST. As a result, the effective internal friction for this sample was lower with an unexpectedly high unconfined yield strength (22.7 kPa). Note that there were limitations in measuring at very low normal stresses in the FT4, which, in turn, impacts the accuracy of this prediction. Furthermore, additional work in the future would be needed to better understand the impact of the comparative loading material depth and rotor design that is embedded in the material.
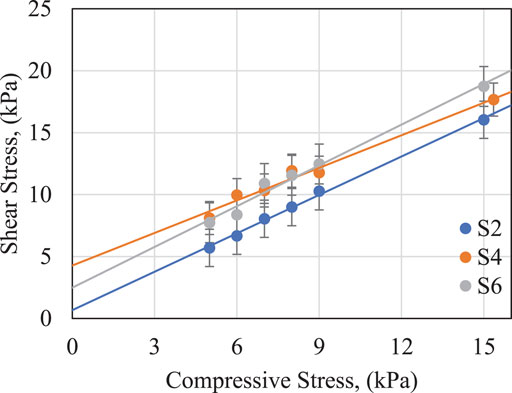
FIGURE 5. Measured shear and normal stress for the three comparative loblolly pine samples.
Comparatively, the shear stresses measured with the FT4 rheometer for the smallest sample (S2), as shown in Figure 5, resulted in a very similar extrapolated apparent cohesion (1.01 kPa) to that measured at 10 kPa pre-shear stress in the RST and slightly higher measured shear stress per unit of applied normal stress (51.7° internal friction). The respective internal frictions for S4 and S6 are closer to the RST magnitude at 43.5° and 48.0°, respectively. Qualitatively, S2 and S6 have statistically similar internal frictions and S4 has a lower average measured friction. This agrees with the observations on the TA rheometer system and could be an artifact of the comparatively large particles. To that effect, there was also the greatest observed variability for these larger particles in the TA rheometer system. This indicates that the measurement was perhaps strongly coupled to the loading method, particular orientation of particles, packing, etc., that accumulated to larger uncertainty as well as incompatibility with this scale of particle. The results presented here, however, are also consistent with measurements of other sawdust (43.8–48.2 kPa) and rice straw (42.4–46.3 kPa) measured in the literature with the same commercial device (Guo et al., 2015). Additional information from these testing routines (compressibility and rotation energy) is presented in Supplementary Figure S3 and Supplementary Figure S4. In general, it was found that the materials were similar in compressibility from 4.2 to 8.3% at 2 kPa and 11.3–13.3% at 12 kPa, and the flow energies were similar for S6 and S4, while S2 was significantly lower.
3.2 Particle–Particle and Particle–Surface Interactions
The tribometry measurements were made for sample S4 with the particles aligned in such a way that the sliding direction is either parallel or perpendicular to the wood grain of the particles. Figure 6 shows the variation of the instantaneous friction coefficient during one reciprocating particle–particle sliding cycle. In general, the particle–particle instantaneous friction coefficient is relatively higher and rather noisy when sliding in the perpendicular direction. For parallel direction sliding, the instantaneous friction is smaller and less noisy. The average friction coefficients for particles sliding in the parallel and perpendicular directions are 0.26 and 0.34, respectively, as shown in Figure 6. However, the standard deviation of friction in the perpendicular direction is substantially high, reflective of the noisy behavior of instantaneous friction behavior in that direction. In simple flow systems such as hoppers and bins, particles tend to align as they are discharged. These differences in friction coefficients could suggest that as materials are charged or loaded into intermediate vessels or batch/semi-batch systems, the flow friction of random particle orientation could directly contribute to problems during flow inception, such as that presented later in this work.
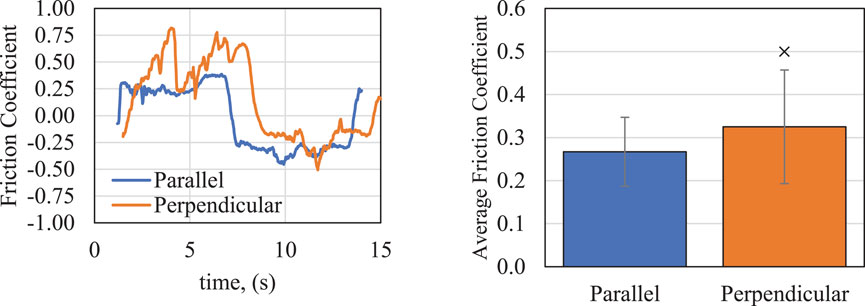
FIGURE 6. (Left) Instantaneous friction coefficient for pine particle (S4) sliding in parallel direction and perpendicular direction and (right) average friction coefficient.
The friction coefficient is defined as the ratio of the tangential or frictional force to the normal force. Traditional definition of the friction coefficient ignores the direction of the forces. In Figure 6, as well as later figures, the direction of the frictional forces is considered when calculating the friction coefficient. Thus, frictional force reversal during reciprocation is reflected as negative values for friction coefficient. The figures can be viewed as the friction force vector normalized by the normal force. This approach enables the assessment of the symmetry for friction behavior during reciprocal sliding as well as the evaluation of frictional energy dissipation. As can be seen in Figure 6, the forward motion (∼1–6 s) of the tribometer results in an average parallel friction coefficient near 0.25, while a similar value near −0.25 is observed during the period (∼8–14 s) when the stage is moving in the opposite direction.
In the tribometry measurement of friction of pine particles, clear anisotropy was observed in terms of friction behavior and magnitude of the friction coefficient. This was further confirmed by the SEM images of pine particles. Figure 7 shows the SEM micrograph of the sides and cross-sectional views of a pine particle. The image scales are shown in the bottom-right corner, and panels 1) and 2) are at 200 µm, while 3) is 100 µm. The distinctive structures of the pine surfaces were expected, which contributed to the frictional anisotropy. Differences in the particle surface features are not the only reason for the frictional variation. The particle scale frictional anisotropy may have a significant impact on the biomass material flow at the macroscale in a unit operating system. Alignment in some direction may be more conducive to easy flow, while other particle arrangements may be detrimental to flow.
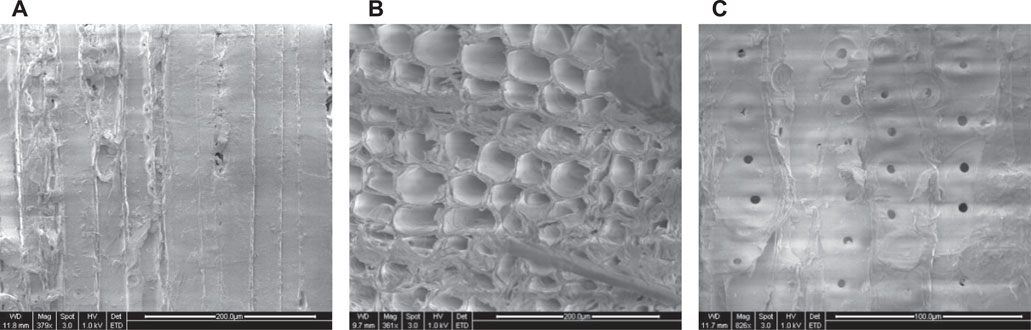
FIGURE 7. SEM micrograph of a pine particle: (A) side view, (B) cross-sectional view, and (C) angular side.
In the particle scale measurement of particle–particle and particle–wall, the results are highly repeatable, as shown in three repeat tests of Figures 8A–C for the three studied loblolly pine samples, respectively. For the three materials (S2, S4, and S6), the size scale of the particles was less of an impact on the measurement, and the larger impact was the variation and inconsistency in measurement that increased with the concentration of large particles. One major observation in the friction result is the effect of particle size on the frictional behavior. For sample S2, the friction (Figure 8A) exhibits relatively minimal noise which should translate to more consistent shear and flow. Interestingly, although this also resulted in a lower friction coefficient compared to the other samples, this sample has the highest apparent bulk cohesion measured from the shear tests above. The friction in the larger particles (S4) was higher and rather noisy (Figure 8B), which can result in uneven shear and flow. The friction behavior of broad particle sieve (S3) was also noisy but not to the same extent as the large ones.
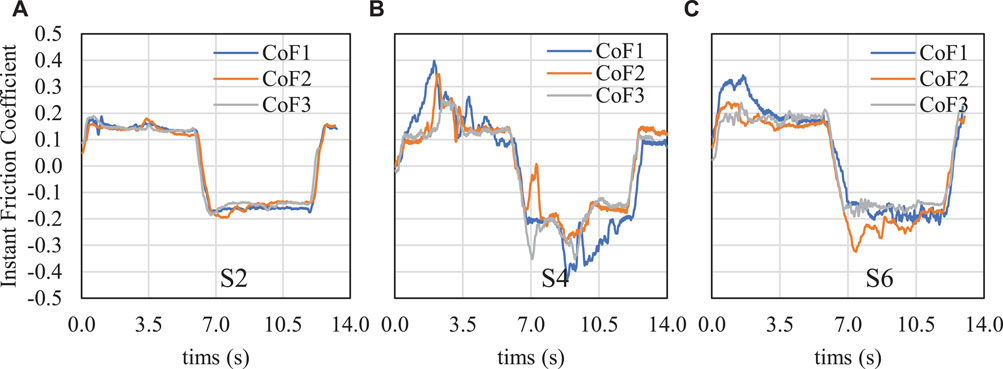
FIGURE 8. Particle–wall friction for samples (A) S2, (B) S4, and (C) S6.
The relative frictional energy dissipation during the tribometry particle scale friction measurement can be estimated by plotting the friction coefficient as a function of position, as shown in Figure 9. The smaller the area of the friction–distance plot, the smaller the amount of frictional energy dissipation. This frictional energy assessment from lab-scale measurement may provide an indication of the energy or power required for bulk shear and flow of biomass materials.
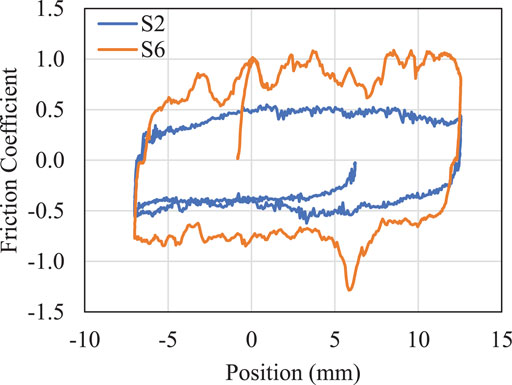
FIGURE 9. Friction energy dissipation during the particle–particle friction measurement for samples S2 and S6.
It is clear from the abovementioned discussion that both the physical properties of feedstock and the measuring techniques have a great impact on the shear properties. In the study, we further investigated the interaction of the particle–surface friction using RST and FT4. In both systems, a range of material surface finishes were used and characterized for the areal roughness texture. This is a measure of the average deviation in height changes about a mean plane (Sa) or line scan (Ra). To determine the wall friction angle, a similar set of conditions were used to measure the resultant shear stress at stable flow, as particles are forced across a surface coupon with a vaned lid/bob. Figure 10 shows a summary of the measured (RST) wall friction angle for S2 and the areal surface roughness as measured by a laser scanning confocal microscope. In this test setup, a variety of potential equipment surface materials were selected to bound potential equipment wall frictions, including steel (304 stainless brushed and mirror finish, carbon steel, AR500 ultra wear-resistant steel), aluminum (two different brushed finished and a mirror finish), and a polymer surface (texture and ultra-slippery). In general, it is observed that a greater surface texture translates to a higher measured wall friction in the test setup. Interestingly, the measurement increases more than 15° across the (aluminum) samples and indicates a strong potential for changes in surface frictions from what might be intuited as modest changes in surface finish (<1.0 µm difference in Sa). This sample (S2) was observed to have a particle–surface friction angle between 15 and 23° (excluding the high/low data point) depending on the surface finish.
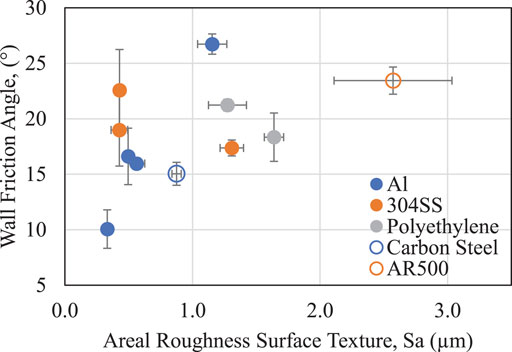
FIGURE 10. Wall friction angle measured by RST and areal surface roughness for loblolly pine (S2).
Similar tests (discussed above) were performed in the FT4 with the three materials, and the findings are shown in Table 4 and Supplementary Figure S5. In these tests, the wall coupons studied included a stainless steel (SS), as well as a Teflon (PTFE) and high-density polyethylene (HDPE) surface. The measured friction for the SS has the highest value and has the highest roughness. The polymer surfaces have more complex relationships but result in overall lower friction angles. The impact of the particle size on the measured friction angle is likewise difficult to discern a direct relationship. For the SS disc coupon, S2 and S6 samples have similar stress relationships. For the PTFE sample, the magnitude of the resulting wall stresses is statistically distinct, although the apparent friction angle given the standard error in the slope regression suggests they are similar. For the HPDE surface, S4 and S6 samples have similar friction angles and magnitudes, while the smallest particle size (S2) results in a drastically lower friction angle. Although the same material surfaces were not shared for this comparison, both show that the surface texture had an influence on the overall friction angle. Compared to the measurements made between the devices, the SS coupons have similar magnitudes (17–23° in RST, while 20–24° in FT4 for the common, smallest sample size), where the values measured here are slightly higher. The polymer surfaces characterized in the FT4 have significantly lower measured friction angles compared to those in the RST.
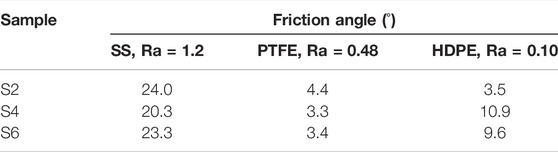
TABLE 4. Effective friction angles in the FT4 for loblolly pine for different wall coupons.
The abovementioned discussion and characterization clearly suggest that the physical properties of both biomass and particle–surface interaction have a significant influence on the shear properties, which ultimately affect the material flowability at bulk. Thus, the following section will discuss the flow properties of loblolly pine (S7–S8), and as a comparison, Douglass fir (S9–S11).
3.3 Flow Performance
One of the critical design criteria for a feed bin or hopper is the discharge opening gap. While this is chiefly linked to the discharge rate through the cross-sectional opening, this is also critical to ensuring that the material is consistently discharged, and the feedstock is not able to establish stress bridges that support the bulk solid from the gravitational driving force. As a result, this critical arching distance is a minimum design criterion and should be regarded as a loose design parameter, where conservative design practices would consider a design factor that is able to incorporate material variability and process upset conditions as much as possible (Lu et al., 2021a). Figure 11 shows the data collected from the critical arching distance testing for the five samples (S7–S11), as shown in Table 1, where S11 has the largest measured arching distance (followed by S8), while S7 is the lowest (followed by S10). Here, these data correlate well with the overall particle sizes noted in the samples; S7 had the smallest particle sizes, while S11 had the largest. Interestingly, S9 and S10 had very similar performance, where the mean size of S10 was much closer to that of S8 rather than S9. This suggests that the performance is rather sensitive to the mean particle sizes, or the various preprocessing strategies used in sample generation had a direct influence as well. Note that the disparate differences between S7 and S8 compared to S9 and S10 (similar jumps in particle sizes for different comminution methods) support the later. One hypothesis for the observation of these flow performance arises from differences in the particle aspect ratios. The S9–S11 samples were produced from a shear-based comminution process (Forest Concepts Crumbler®), which uses particle recycle to more readily control the fiber length and size distribution compared to a once-through high-velocity hammer mill impact. These resulting particle geometries and sizes could play into the bulk properties through the cohesion and internal friction, for example, as discussed above. These materials show arching distances from 10 to 27 mm. While prior work has indicated generally higher values and a positive relationship between arching distance and inclination angle (Lu et al., 2021a), here there was only a modest positive trend with no clear description for all samples. However, in this situation where there was minimal material surcharge above the arching test, it can be concluded that the arching distance results are much less sensitive to the inclination angle compared to even the relatively modest changes in material type/format/size presented here. As a result, we recommend that the style and consistency of biomass comminution should be critically considered when designing or adapting flow systems for biomass samples.
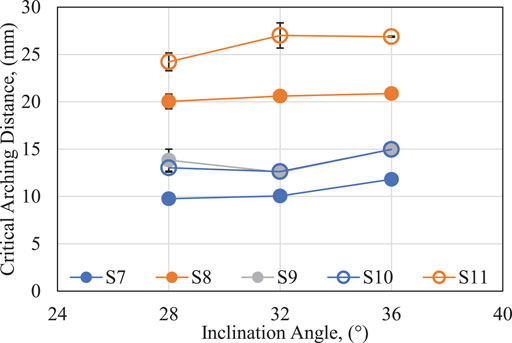
FIGURE 11. Critical arching distance in a wedge hopper.
When the hopper gap is opened sufficiently beyond the arching distance to achieve mass flow, the discharge rate for each material and inclination angle was measured for nine variable opening distances (cross-sectional area). Sample traces of this are shown in Figure 12 and in Supplementary Figure S6 for S7 and S8–S11, respectively. The incremental change in flow rate with opening and inclination angle for all five samples is summarized in Table 5. Similar qualitative trends (inverse) are observed in the flow rate compared to the arching distance. For example, S7 has the lowest arching distance and the greatest specific discharge rate, while S11 has the greatest arching distance and the lowest specific discharge rate. S8–S10 were recorded at similar discharge rates with incremental opening. These trends are also qualitatively like that of the material bulk density in Table 1. Due to the linearity of these specific rates, a provisional mass flow rate, or flow envelope, could be designed for using such flow data. While the relative deviation in specific flow rates between the materials had a 13%–22% relative standard deviation, when these were normalized with the bulk density, this decreases to 3%–6%, indicating that a significant variance in the discharge rate with opening is explainable with the bulk density. Additionally, this suggests that the overall volumetric discharge rate is similar between the materials. Given the variable, but fixed outlet geometry, this might also suggest that the particle packing at the discharge is similar on a gross volumetric basis.
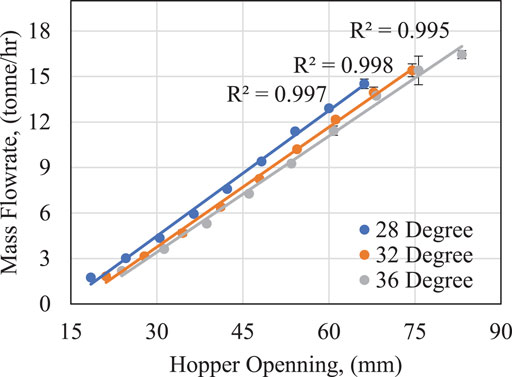
FIGURE 12. Mass discharge rate data for S7 at variable hopper inclination angles and hopper openings. The error bars represent standard deviation between replicate measurements, but most are within symbol markers.
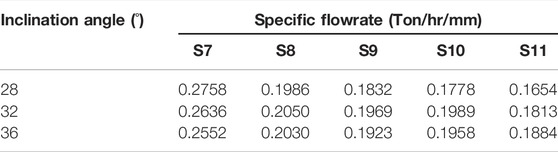
TABLE 5. Hopper-specific flowrate through the wedge hopper per unit hopper opening.
In comparison to these gravity-driven flow tests, these test samples were also characterized in a screw feeder. To convey material through a conveyor (i.e., screw), the central shaft imparts a forward motion to the material contained in the feeder barrel. Typically for dry solid feeders with non-powder materials, the flights are partially filled and lead to a periodic or short-time “slugging” feeding behavior due to the nature of the device. In general, as particles approach smaller, more uniform geometries, this behavior will dampen and similar reduction in rate variability is expected, as the rotation frequency is increased (although the flights become more difficult to fill completely or consistently). This is similarly observed through the reaction torque (power consumption measured and used as a proxy here) exerted on the feed screw. Typical power consumption traces from S7 and S8 are shown in Figure 13 (see Supplementary Figure S7 for S9–S11) and are illustrative to how different the results can be from the same material with a slightly different size/distribution. Falk et al. (2015) noted similar slugging behaviors in their study of screw feeders and related this to a measured dynamic angle of repose. They concluded that on a small timescale (10 Hz), there was no relationship to the feeding variability or behavior. On a comparatively larger timescale (0.5 Hz), however, they noted that this pulsating flow variability was correlated with the dynamic angle of repose. With lower angles, the buildup of material piles was hypothesized to fail earlier at the discharge outlet, resulting in a less pronounced variability.
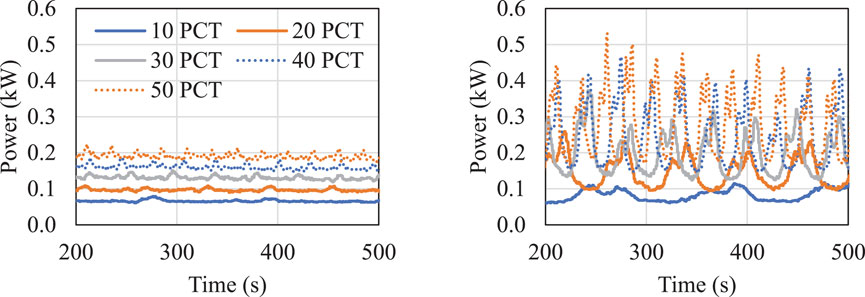
FIGURE 13. Power consumption in the Acrison® screw feeder at a controlled speed for (left) S7 and (right) S8. The solid blue, orange, gray, dotted blue, and orange indicate results at auger rotational speeds of 10, 20, 30, 40, and 50%, respectively.
The data shown in Figure 13 become more sporadic in magnitude and frequency, as the rotational frequency increases. The differences in these bounds are more clearly shown in S8, where the power consumption both increases dramatically in magnitude and deviation about a baseline consumption compared to the more well-behaved increased baseline observed in S7. The data for both the average flow rate and power consumption and their respective deviations are shown in Table 6. As the rotation frequency increases, so too does the flow rate and the power consumption. Because screw conveyors are designed to move a consistent volume of material with time based on the fractional filling of the flights, the resultant flow rate also follows similar qualitative trends as the material bulk density. These rates appear to deviate more with larger particles (S8 and S11), which is consistent with increased variance in particle packing within a confined, finite volume available to fill between flights. Comparatively, the smaller particles can more freely rotate, pack, and fill voids during the screw extraction from the bulk feed bin and result in higher space utilization and ultimately mass flow rate. The power draw during feeding increases with increasing particle size (S8 compared to S7, and S11 compared to S9). Here, it is interesting to note the large deviation in conveyance in particles produced from a hammermill (0.274 vs. 0.190 kW at 50%), compared to particles produced from the rotary shear process (0.207 vs. 0.167 kW). Here, the increase in power draw is lessened in addition to having less overall power draw, despite having larger-sized particle on average. This is hypothesized to occur due to a more uniform particle format in addition to having preferential internal, partial–particle, and partial–surface friction measurements. As a result, there is less energy dissipation or loss during the feeding. As noted above, this agrees with the observations of friction in respect to the particle scale, suggesting one potential source for these differences.
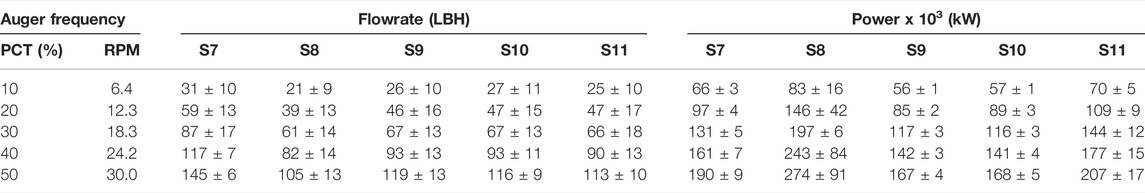
TABLE 6. Summary of performance data for screw feeder in terms of flowrate and power consumption.
4 Conclusion
Various experimental shear and friction characterization techniques were investigated at multiple test and particle scales to examine the impact on the resulting shear characteristics. The critical material attributes, including particle size and distribution, were investigated as exploratory variables to describe the differential shear properties and behavior. To supplement these laboratory-scale properties, this work explored the flow properties through a pilot-scale wedge-shaped hopper and an Acrison® screw feeder. Several conclusions can be drawn from this study:
• Bulk cohesion was found to increase (from 0.68 to 1.3 kPa in an RST at 10 kPa preshear) with decreasing biomass particle size (D50 of 3.80–0.69 mm), except the largest test size. The measured internal friction was statistically constant with particle size and only varied by a few degrees when tested in the RST.
• The scale and type of characterization method were observed to be less sensitive as the particle size of the tested biomasses approached to that of more fine-milled powders (i.e., less than 1–2 mm) but diverged as the stress-chaining potential induced stochastic events to the testing protocols. In granular shear testers, it was found that the multi-scale feedstock properties were more inclined to be influenced through the apparent bulk cohesion or unconfined microscale interactions compared to internal friction when investigating a specific material. Comparatively, the analysis performed in the smaller, more commonly available rheometers showed indeterminant trends of cohesive properties and nonlinear behavior with respect to the resulting effective internal friction. While the RST is a more robust primary characterization tool to provide shear flow property reference data for biomass material handling equipment design, lower-scale shear testers and rheometers are useful for cross-validation of the RST and qualitatively ranking materials, particularly for small-sized or fine-milled particles and are more widely available at research and industrial institutions.
• The mass discharge rate in a wedge hopper was proportionate to the discharge cross-sectional area and was largely dominated by the overall size of the biomass particles and their reduction technique, while the size distribution and the hopper inclination were comparatively minor. A positive regression relationship was observed when normalized with the discharge opening, suggesting some differences in the internal stresses governing forces distributed to the container walls and those in-line with the gravitational flow. The arching distance results had only modest positive correlation with inclination angle and were much less sensitive compared to even the relatively modest changes in the material type/format/size presented here. As a result, the style and consistency of biomass type, comminution, and overall preparation should be critically considered when designing or adapting flow systems for biomass.
• Overall, wedge hopper mass discharge rates were explainable with the bulk density (positive correlation, from 0.26 to 0.19 tonne/hr/mm opening for S7 to S11 at 248 to 177 kg/m3, for example, at 36°). Additionally, this suggests that the overall volumetric discharge rate is similar between similar materials such as the softwoods studied here. For the variable discharge geometries studied here, this suggest that as the particles approach states like what is studied in the unconfined bulk density tests.
• The screw feeder was found to be more consistent for the smaller and more uniform samples, which led to stable flow and less power consumption. This was also aligned with particle–particle anisotropic friction characterizations that found that overall energy dissipation was significantly less for smaller particles. As a result, the scale of mechanical conveyor (or particles being conveyed) must be well controlled to limit downstream “pulsing” flow, energy consumption, and excessive equipment wear as a result.
Overall, the direct understanding of how the shear properties of compressible, irregular, and anisotropic materials translate into flow performance at scale is still in the developing area; understanding how material attributes trend with both shear characteristics and flow performance provides some common qualitative linkages to build foundational knowledge.
Data Availability Statement
The original contributions presented in the study are included in the article/Supplementary Material; further inquiries can be directed to the corresponding author.
Author Contributions
JK, NS, TB, SC, RD, CB, OA, ZC, RN, and TS contributed to experimental investigation, methodology, and writing the original draft article. JK, WJ, YX, RD, OA, and TS contributed to conceptualization, project oversight, formal analysis, data curation, writing, reviewing, and editing.
Funding
This research was supported by the US. Department of Energy (DOE), Office of Energy Efficiency and Renewable Energy (EERE), Bioenergy Technologies Office (BETO), under DOE Idaho Operations Office with Contract No. DE-AC07-05ID14517. This work leveraged resources of the US Department of Energy’s Biomass Feedstock National User Facility (BFNUF) and Bioenergy Feedstock Library located at Idaho National Laboratory (Idaho Falls, ID).
Conflict of Interest
The authors declare that the research was conducted in the absence of any commercial or financial relationships that could be construed as a potential conflict of interest.
Publisher’s Note
All claims expressed in this article are solely those of the authors and do not necessarily represent those of their affiliated organizations, or those of the publisher, the editors, and the reviewers. Any product that may be evaluated in this article, or claim that may be made by its manufacturer, is not guaranteed or endorsed by the publisher.
Acknowledgments
The authors would like to acknowledge the assistance of Eric Fillerup at Idaho National Laboratory with the measurements of areal surface roughness.
Supplementary Material
The Supplementary Material for this article can be found online at: https://www.frontiersin.org/articles/10.3389/fenrg.2022.855289/full#supplementary-material
References
Barletta, D., Berry, R. J., Larsson, S. H., Lestander, T. A., Poletto, M., and Ramírez-Gómez, Á. (2015). Assessment on Bulk Solids Best Practice Techniques for Flow Characterization and Storage/handling Equipment Design for Biomass Materials of Different Classes. Fuel Process. Technol. 138, 540–554. doi:10.1016/j.fuproc.2015.06.034
Bilgili, F., Koçak, E., Bulut, Ü., and Kuşkaya, S. (2017). Can Biomass Energy Be an Efficient Policy Tool for Sustainable Development? Renew. Sustain. Energy Rev. 71, 830–845. doi:10.1016/j.rser.2016.12.109
Binder, J. B., and Raines, R. T. (2009). Simple Chemical Transformation of Lignocellulosic Biomass into Furans for Fuels and Chemicals. J. Am. Chem. Soc. 131 (5), 1979–1985. doi:10.1021/ja808537j
Chen, X., Xu, Y., Lu, H., and Guo, X. (2018). Effect of the Moisture Content of Straw on the Internal Friction Angle of a Granular Biomass-Coal System. Fuel 215, 266–271. doi:10.1016/j.fuel.2017.11.013
Cheng, Z., Leal, J. H., Hartford, C. E., Carson, J. W., Donohoe, B. S., Craig, D. A., et al. (2021). Flow Behavior Characterization of Biomass Feedstocks. Powder Technol. 387, 156–180. doi:10.1016/j.powtec.2021.04.004
Comanici, A. M., and Barsanescu, P. D. (2018). Modification of Mohr's Criterion in Order to Consider the Effect of the Intermediate Principal Stress. Int. J. Plasticity 108, 40–54. doi:10.1016/j.ijplas.2018.04.010
Dale, B. (2017). A Sober View of the Difficulties in Scaling Cellulosic Biofuels. Biofuels, Bioprod. Biorefining 1 (11), 5–7. doi:10.1002/bbb.1745
Dietmar, S. (2008). Flow Properties of Powders and Bulk Solids. Powders And Bulk Solids–Behavior, Characterization, Storage and Flow. Berlin, Germany: Springer-Verlag Berlin Heidelberg.
Falk, J., Berry, R. J., Broström, M., and Larsson, S. H. (2015). Mass Flow and Variability in Screw Feeding of Biomass Powders - Relations to Particle and Bulk Properties. Powder Technol. 276, 80–88. doi:10.1016/j.powtec.2015.02.023
Fanesi, A., Lavayssière, M., Breton, C., Bernard, O., Briandet, R., and Lopes, F. (2021). Shear Stress Affects the Architecture and Cohesion of Chlorella Vulgaris Biofilms. Sci. Rep. 11 (1), 4002–4011. doi:10.1038/s41598-021-83523-3
Faqih, A. M. N., Mehrotra, A., Hammond, S. V., and Muzzio, F. J. (2007). Effect of Moisture and Magnesium Stearate Concentration on Flow Properties of Cohesive Granular Materials. Int. J. Pharm. 336 (2), 338–345. doi:10.1016/j.ijpharm.2006.12.024
Fitzpatrick, J. J., Barringer, S. A., and Iqbal, T. (2004). Flow Property Measurement of Food Powders and Sensitivity of Jenike's Hopper Design Methodology to the Measured Values. J. Food Eng. 61 (3), 399–405. doi:10.1016/s0260-8774(03)00147-x
Guo, Z., Chen, X., Xu, Y., and Liu, H. (2015). Study of Flow Characteristics of Biomass and Biomass-Coal Blends. Fuel 141, 207–213. doi:10.1016/j.fuel.2014.10.062
Hernandez, S., Westover, T. L., Matthews, A. C., Ryan, J. C. B., and Williams, C. L. (2017). Feeding Properties and Behavior of Hammer- and Knife-Milled Pine. Powder Technol. 320, 191–201. doi:10.1016/j.powtec.2017.07.002
Hou, H., and Sun, C. C. (2008). Quantifying Effects of Particulate Properties on Powder Flow Properties Using a Ring Shear Tester. J. Pharm. Sci. 97 (9), 4030–4039. doi:10.1002/jps.21288
Ilic, D., Williams, K., Farnish, R., Webb, E., and Liu, G. (2018). On the Challenges Facing the Handling of Solid Biomass Feedstocks. Biofuels, Bioprod. Bioref. 12 (2), 187–202. doi:10.1002/bbb.1851
Krantz, M., Zhang, H., and Zhu, J. (2009). Characterization of Powder Flow: Static and Dynamic Testing. Powder Technol. 194 (3), 239–245. doi:10.1016/j.powtec.2009.05.001
Leturia, M., Benali, M., Lagarde, S., Ronga, I., and Saleh, K. (2014). Characterization of Flow Properties of Cohesive Powders: A Comparative Study of Traditional and New Testing Methods. Powder Technol. 253, 406–423. doi:10.1016/j.powtec.2013.11.045
Liu, Y., Lu, H., Guo, X., Gong, X., Sun, X., and Zhao, W. (2015). An Investigation of the Effect of Particle Size on Discharge Behavior of Pulverized Coal. Powder Technol. 284, 47–56. doi:10.1016/j.powtec.2015.06.041
Lu, H., Guo, X., Jin, Y., and Gong, X. (2018). Effect of Moisture on Flowability of Pulverized Coal. Chem. Eng. Res. Des. 133, 326–334. doi:10.1016/j.cherd.2018.03.023
Lu, Y., Jin, W., Klinger, J., and Dai, S. (2021a). Flow and Arching of Biomass Particles in Wedge-Shaped Hoppers. ACS Sustain. Chem. Eng. 9 (45), 15303–15314. doi:10.1021/acssuschemeng.1c05628
Lu, Y., Jin, W., Klinger, J., Westover, T. L., and Dai, S. (2021b). Flow Characterization of Compressible Biomass Particles Using Multiscale Experiments and a Hypoplastic Model. Powder Technol. 383, 396–409. doi:10.1016/j.powtec.2021.01.027
Miccio, F., Barletta, D., and Poletto, M. (2013). Flow Properties and Arching Behavior of Biomass Particulate Solids. Powder Technol. 235, 312–321. doi:10.1016/j.powtec.2012.10.047
Miccio, F., Silvestri, N., Barletta, D., and Poletto, M. (2011). Characterization of Woody Biomass Flowability. Chem. Eng. Trans. 24, 643–648.
Pachón-Morales, J., Colin, J., Casalinho, J., Perre, P., and Puel, F. (2020). Flowability Characterization of Torrefied Biomass Powders: Static and Dynamic Testing. Biomass Bioenergy 138, 105608. doi:10.1016/j.biombioe.2020.105608
Ramírez-Gómez, Á. (2016). Research Needs on Biomass Characterization to Prevent Handling Problems and Hazards in Industry. Part. Sci. Technol. 34 (4), 432–441. doi:10.1080/02726351.2016.1138262
Rezaei, H., Sokhansanj, S., and Lim, C. J. (2018). Minimum Fluidization Velocity of Ground Chip and Ground Pellet Particles of Woody Biomass. Chem. Eng. Process. - Process Intensif. 124, 222–234. doi:10.1016/j.cep.2017.12.006
Senff, L., Barbetta, P. A., Repette, W. L., Hotza, D., Paiva, H., Ferreira, V. M., et al. (2009). Mortar Composition Defined According to Rheometer and Flow Table Tests Using Factorial Designed Experiments. Constr. Build. Mater. 23 (10), 3107–3111. doi:10.1016/j.conbuildmat.2009.06.028
Shi, H., Mohanty, R., Chakravarty, S., Cabiscol, R., Morgeneyer, M., Zetzener, H., et al. (2018). Effect of Particle Size and Cohesion on Powder Yielding and Flow. KONA Powder Part. J. 35, 226–250. doi:10.14356/kona.2018014
Stasiak, M., Molenda, M., Gancarz, M., Wiącek, J., Parafiniuk, P., and Lisowski, A. (2018). Characterization of Shear Behaviour in Consolidated Granular Biomass. Powder Technol. 327, 120–127. doi:10.1016/j.powtec.2017.12.037
Westover, T., and Hartley, D. S. (2018). Biomass Handling and Feeding. 86. doi:10.5772/intechopen.74606
Keywords: biomass, shear, granular flow, flow friction, hopper flow
Citation: Klinger J, Saha N, Bhattacharjee T, Carilli S, Jin W, Xia Y, Daniel R, Burns C, Ajayi O, Cheng Z, Navar R and Semelsberger T (2022) Multiscale Shear Properties and Flow Performance of Milled Woody Biomass. Front. Energy Res. 10:855289. doi: 10.3389/fenrg.2022.855289
Received: 15 January 2022; Accepted: 16 June 2022;
Published: 22 July 2022.
Edited by:
Timothy G. Rials, The University of Tennessee, United StatesReviewed by:
Haifeng Lu, East China University of Science and Technology, ChinaMark Wright, Iowa State University, United States
Copyright © 2022 Klinger, Saha, Bhattacharjee, Carilli, Jin, Xia, Daniel, Burns, Ajayi, Cheng, Navar and Semelsberger. This is an open-access article distributed under the terms of the Creative Commons Attribution License (CC BY). The use, distribution or reproduction in other forums is permitted, provided the original author(s) and the copyright owner(s) are credited and that the original publication in this journal is cited, in accordance with accepted academic practice. No use, distribution or reproduction is permitted which does not comply with these terms.
*Correspondence: Jordan Klinger, jordan.klinger@inl.gov