Developing an Artificial Hummingbird Algorithm for Probabilistic Energy Management of Microgrids Considering Demand Response
 Nehmedo Alamir
 Salah Kamel
 Tamer F. Megahed1,3
  Maiya Hori
 Sobhy M. Abdelkader
- 1Electrical Power Engineering, Egypt-Japan University of Science and Technology, New Borg El-Arab City, Egypt
- 2Department of Electrical Engineering, Faculty of Engineering, Aswan University, Aswan, Egypt
- 3Department of Electrical Engineering, Faculty of Engineering, Mansura University, Elmansoura, Egypt
- 4Platform of Inter/Transdisciplinary Energy Research, Kyushu University, Fukuoka, Japan
This study proposes an artificial hummingbird algorithm (AHA) for energy management (EM) for optimal operation of a microgrid (MG), including conventional sources and renewable energy sources (RES), with an incentive-based demand response (DR). Due to the stochastic nature of solar and wind output power and the uncertainty of prices and load, a probabilistic EM with hybrid AHA and point estimation method (PEM) is proposed to model this uncertainty by utilizing the normal and Weibull distribution functions. The PEM method is considered a good tool for handling stochastic EM problems. It achieves good results using the same procedures used with the deterministic problems while maintaining low computational efforts. The proposed AHA technique is employed to solve a deterministic incentive DR program, with the goal of reducing the overall cost, which includes the cost of conventional generator fuel and the cost of power transaction with the main grid while taking into account the load demand. Two different case studies are tested. The simulation results of the proposed AHA is compared with the results of well-known metaheuristic algorithms to demonstrate its efficacy. According to AHA’s results, a total reduction of energy consumption by 104 KWh for the first case study and 2677 MWh for the second case study is achieved while achieving the lowest overall operating cost. The results demonstrate that the AHA is adequate for tackling the EM problem. Then, to examine the effect of uncertainty on the MG state, a probabilistic EM problem is solved using AHA-PEM.
1 Introduction
In recent years, the integration of productive subsystems or distributed generation (DG), which are called microgrids (MGs), into the main grid has played an essential role in resolving many energy-related problems (Shivam and Dahiya, 2018). MG can be connected to other MGs or the main grid, thereby exchanging energy between them or in a stand-alone configuration (Asano et al., 2007). For supplying power demanded in MGs, both conventional and different types of RES, such as solar photovoltaic (PV), wind turbine (WT), biomass units, microturbine units, and energy storage systems (ESS) (Khalili et al., 2019), are used. MG energy management (EM) has received significant attention in research for the optimal operation of MGs. EM involves the maximization or minimization of one or more objective functions, such as maximizing profit or minimizing total cost. MG’s optimal operation is essential for achieving effective EM at a low cost and maximum profit (Parisio et al., 2014).
A deterministic EM in MG is employed in (Aghajani and Ghadimi, 2018), in which the power generated from renewable sources, load profile, and market prices are considered. Many probabilistic EM approaches consider the uncertainties in renewable source generation, load demand, and energy prices (Tabatabaee et al., 2016, García Vera et al., 2019, Alavi et al., 2015). In (Arabali et al., 2013), the uncertainty of solar and wind generation, as well as the load demand, are considered. The EM problem is solved using GA optimization with the 2m point estimation method (PEM) in order to enhance the efficiency and reduce the total cost. In (Baziar and Kavousi-Fard, 2013), a probabilistic framework is modeled using the 2m PEM method, thereby considering uncertainties related to wind and solar power and market bid variations. A modified glowworm swarm optimization with PEM is proposed in (Ben Christopher and Carolin Mabel, 2020). Gravitational search algorithm (GSA) and 2m PEM are proposed in (Niknam et al., 2012a) to solve the EM problem of MGs involving the existing uncertainties in the MGs. Moreover, an improved bat algorithm is considered in (Li et al., 2014).
In (Nguyen et al., 2020) an improved stochastic fractal search algorithm is proposed to solve a multiobjective problem, get lower generation fuel cost, reduce power losses and emission, and enhance the voltage profile, with a faster execution. A new approach for reducing the power loss is proposed in (Nguyen et al., 2021), in which different optimization algorithms, such as particle swarm optimization (PSO), PPA, and TSA, are used.
Meanwhile, 2m + 1 PEM is used to solve the probabilistic EM of MG (Alavi et al., 2015, Mohammadi et al., 2013, Li et al., 2014); in (Alavi et al., 2015), PSO technique is used to reduce the total operating cost and enhance reliability. (Mohammadi et al., 2013) used 2m + 1 PEM with an adaptive modified firefly optimization algorithm while considering the uncertainties.
DR may be considered a tariff that motivates the customers to change their consumption as a response to the change in electricity price over time or to reduce the usage of electricity in response to incentive payments once the price of electricity in the market is high or in the case of grid reliability issues (Aalami et al., 2010).
DR is divided into two types: first, price-based DR (PDR), in which consumers’ electricity prices are altered at varying periods. For example, high prices during peak hours, medium prices during off-peak hours, and low prices during low-peak hours. Second, incentive-based DR (IDR), in which consumers receive incentive awards for changing their consumption (Jordehi, 2019).
In (Aghaei and Alizadeh, 2013), utilizing a hybrid augmented weighted-constraint approach and lexicographic optimization, DR and optimal power flow in a combined heat and power (CHP) system were presented in a MG with an energy storage system. In (Majidi et al., 2017), a multiobjective optimization problem is described for using the DRP to reduce the emissions and cost of a hybrid system. PSO technique was used in (Faria et al., 2013) to manage MG resources and DR in order to reduce the MG operator’s operating costs. Despite the previous studies, further study is needed to apply the DRP to power system issues to include customers and reduce MG fuel prices.
According to the studies mentioned above, several optimization techniques have been efficient in solving engineering challenges, particularly those incorporating EM. These research established the importance of applying new and improved optimization techniques for solving particular EM problems; moreover, according to Wolpert’s (1997) No-Free-Lunch theorem, there are no metaheuristic optimization algorithms capable of addressing all optimization problems. These two considerations inspired us to apply a newly developed optimization technique, artificial hummingbird algorithm (AHA), to solve the EM problem in MGs.
To the best of the authors’ knowledge, no similar study has been conducted. The uncertainties of load, market pricing, and PV and WT output power in grid-connected MG while considering DR and using AHA to solve the EM are investigated in this study. Table 1 illustrates a comparative analysis of the relevant literature in terms optimization technique, uncertainty modeling and contribution.
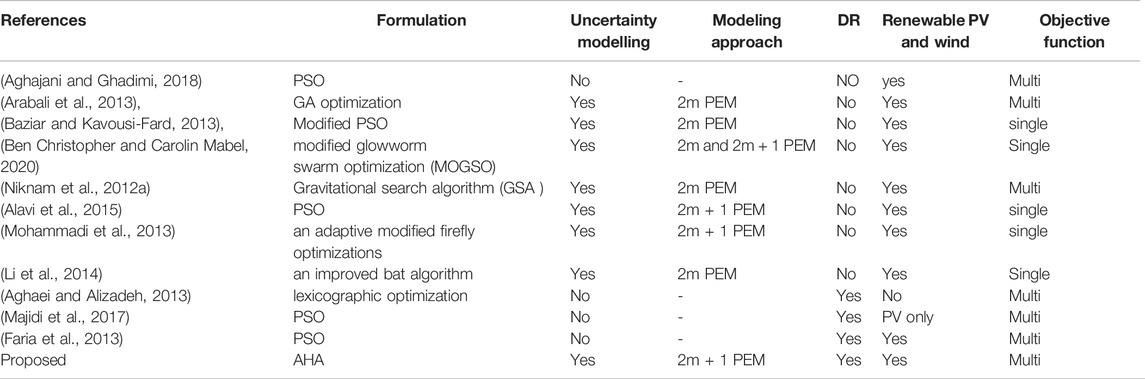
TABLE 1. A summary of the relevant literature.
The objective of this study is to use a newly developed optimization technique, AHA, to solve the EM problem for a MG with an incentive DR program. The proposed EM algorithm is compared to those achieved by other well-known algorithms to demonstrate its robustness. Also, a probabilistic EM using hybrid AHA-PEM to consider the uncertainties of renewable sources, load demand, and market prices is proposed. The main contributions of this study, however, may be stated as follows:
1- Proposing a new application for a recent optimization technique, AHA, for solving the EM problem of a MG while considering DR.
2- Studying two different scenarios; the first is deterministic EM with two different case studies. The first MG consists of one wind generator, one solar PV generator, three conventional generation units (diesel), and three residential customers with DRP, while the second one consists of an aggregated model for solar PV and wind, ten conventional generation units, and seven customers. The second scenario is used for probabilistic EM.
3- Considering the probabilistic nature of the market pricing, load, and produced power of the PV and WT generators and modeling a stochastic energy cost function.
The rest of this paper is organized as follows: Section 2 presents the mathematical model for the MG with the DR model. Section 3 presents the modeling for the EM optimization problem. The uncertainty modeling is discussed in Section 4. Section 5 focuses on the recent optimization technique, AHA. Section 6 presents the simulation results obtained. Finally, the paper is concluded in Section 7.
2 Mathematical Model for Grid-Connected Microgrid
The structure of MG connected to the grid for this paper is shown in Figure 1. This MG comprises conventional generation sources, renewable generation sources (PV power generator and WT generator), and customers with DR model.

FIGURE 1. Grid-connected MG structure with DR mode.
2.1 Grid-Connected Microgrid Model
In this work, the MG is connected to the main grid, and a power transaction is assumed to be bought or sold to the main grid. In the case of surplus (more than the demand) in generation from MG, power will be sold to the main grid, and vice versa.
If
2.2 Modeling of DR
Let
Equation 2 illustrates that the customer will participate in the DR program and reduce his consumption only in the case of
Also, MG benefit can be expressed as:
where
2.3 Customer Cost Function
The formulation for the customer’s cost function (
where:
•
•
Customers’ contract formulation is computed as in (Fahrioglu and Alvarado, 2000); thus, if
Moreover, MG benefit is calculated as:
3 Formulation of the EM Problem
As previously mentioned, the grid-connected MG consists of different generation sources, conventional generators and RESs, and loads with a DR program. The operating cost consists of two components, conventional generation cost and power transaction cost. The main objective of MG management system is to optimize the operation of MG resources by lowering the generation cost and increasing the MG benefit while marinating customers’ benefit and satisfying the operational constraints.
3.1 The Operating Cost Function
For EM in grid-connected MG, one of the objectives in the studied optimization procedure is the minimization of conventional generators’ fuel cost and the transferred power’s cost between the main grid and MG, and it is given as:
The fuel cost for conventional generators (
where
3.2 MG Benefit Function
The objective of maximizing the expected MG benefits can be formulated as follows:
Equation 9 indicates that the MG operator can benefit if he selects not to supply specific customers with power or pay incentive payments.
3.3 Constraints of Generation Sources
At any period t, the total power generated from conventional generation and RESs units and power transacted between the MG and main grid must supply total load demand with the DR program. In this paper, the active power losses in the MG are ignored. Hence, the power balance equation’s constraints can be expressed as:
where
I and T are the total number of conventional generators and dispatch interval, respectively.
Constraint in Eq. 10 describes the power balance to ensure that the total production and grid transacted power at any time t will equal the total demand. While Eq. 11 ensures that any conventional generation’s generation does not exceed its upper and lower limits, the constraint (Eq. 12) do not violate the ramp up and down rates for generators.
The constraints for maximum and minimum generation of solar and WT generators are represented in Eqs 13 and 14, respectively. Eq. 15 represents the transacted power constraint, which limits the power transacted between the MG and the utility grid to not exceed the maximum limit
3.4 DR Constraints
where the upper limit for the MG budget limit is
The demand management contract formulations in Eq. 5 are expanded to cover the entire 24 h-period (1 day) rather than just 1 h, making them more practical and cost effective. The constraint in Eq. 16 ensures that the client receives a total incentive for any power curtailed that is more than the cost of interruption. In addition, if the client increases his or her curtailment (constraint in Eq. 17), the customer should receive a higher incentive. Constraint (Eq. 18) describes the total MG budget limit constraint, thereby ensuring that the daily budget is less than the maximum. Eq. 19 ensures that any client’s total curtailment is within the allowable limits.
The mathematical model of the objective function is given as:
4 Uncertainty Modeling
This study presents a mathematical model for the MG EM that can deal with PV power, wind power generation, load consumption, and market price uncertainty. The chance of a discrepancy between the expected and actual components is defined as uncertainty. The operational cost of MG is substantially influenced by errors produced by the lack of uncertainty. As a result, km + 1 PEM is combined with AHA in this work to enhance MG EM on an uncertainty framework.
4.1 Probabilistic EM of the Micro Grid
In the presence of input variables, with random nature or uncertainty, the EM problem becomes probabilistic instead of deterministic. Because of the random nature of solar irradiance and wind speed, the output power from solar PV and WT generators are also random variables. Furthermore, load demand will not be exactly the same as the forecasted load due to forecasting errors, unexpected disturbances, load variations, or energy prices (Niknam et al., 2012a, Soroudi and Ehsan, 2011). Every probabilistic formulation requires statistical characterization of the random input variables and a method for evaluating statistical features of the output variables.
4.1.1 Statistical Characterization of the Input Random Variables (IRVs)
• Wind power
The power output and wind speed can be calculated as:
where
The power curve of WT is represented by the quadratic model (Eq. 21); thus, the quadratic approximation will be used to obtain the power probability density function (PDF) (Villanueva et al., 2011). Weibull distribution can be used to express the wind speed’s PDF at a certain location, such as what has been expressed in Eq. 22:
and cumulative density function (CDF) is given as:
CDF and its inverse are utilized for computing the wind speed as following:
where C and k are the scale and shape parameters of the Weibull distribution, respectively and r is a uniformly distributed random number between 0 and 1. Different methods can be used for calculating C and K parameters (Atwa et al., 2011, Jangamshetti and Rau, 1999). Here, the parameters are approximately calculated using the mean wind
where gamma function (
• Solar power
The output power of solar PV depends on the ambient temperature, solar irradiation, and characteristics of the module. The solar PV output power can be expressed as:
where
The PV module temperature can be calculated based on the module’s nominal operating cell temperature (
where
In this paper, solar irradiance is suggested to have a normal distribution function. As a result, the PDF of any variable
Normal distribution CDF can be formulated as:
CDF and its inverse are used for determining the variable
where
In technical literature, there are many probabilistic approaches that deal with the uncertainties in renewable energy sources, load demand, and market prices for solving the EM problem. These approaches may be classified into three main categories (Morales and Perez-Ruiz, 2007): Monte Carlo simulation, analytical methods, and approximate methods.
Monte Carlo simulation (MCS) deals with uncertainties by generating random values for the variables. These values help solve the problem as a deterministic problem (Rubinstein and Kroese, 2016). However, MCS uses a deterministic routine to solve the problem in each simulation; its main drawback is that it requires a large number of simulations to attain convergence.
Analytical methods are more effective, but they are based on certain mathematical assumptions that simplify the problem to analyze the statistical characteristics of random output function y based on the statistical characteristics of random input variables p (Pei and Lee, 2004, Niknam et al., 2012b), and they do not yield optimal and accurate results (Ben Christopher and Carolin Mabel, 2020).
Approximate methods provide an approximate description of the statistical properties of output random variables. PEM is one of the approximation approaches. PEM uses a deterministic strategy to solve probabilistic problems, similar to MCS, but it has a much lower number of simulations than MCS. In addition, PEM has led to great reduction in calculation efforts in comparison with the MCS method.
It uses a deterministic strategy to solve a probabilistic issue, similar to MCS, but PEM has a significantly lower number of simulations than MCS.
PEM firstly was developed by Rosenblueth (1975), which was then modified in 1981 (Rosenblueth, 1981). However, this and similar approaches (Wang et al., Seo and Kwak, 2002) give more accurate estimates. The number of simulations required may be very large in a system with high random variables. Hong (1998) proposed PEM, where the number of required simulations grows linearly with the number of random or uncertain variables.
4.2 Point Estimation Method
The PEM approximation method is a scheme to linearize output variables with respect to IRVs. The basic idea of PEM is to compute the moments of a function y, a function of IRV (m), i.e., y = F(p1, p2, …, and pm), and use the forecasted information of these variables to concentrate its first few central moments of the statistical information on K = 2, 3, …, and 5 points for each variable. By using these points statistical moments of output function y, statistical information on y can be approximated. To obtain the central moments, function
• 2m + 1 PEM scheme
Generally, in this scheme, three concentration points are used for each IRV. One of them is the mean value. The standard locations are:
where
Variable locations are:
and weights are:
It is noted from (Eq. 36) that setting
The moments’ vector of output random variables are estimated as:
After knowing these statistical moments of the output function, STD and mean can be obtained as:
Using the values of
5 Optimization Algorithms
5.1 Description
This algorithm, AHA, is one of the bioinspired optimization techniques, which are better at balancing exploration and exploitation in the search for global optimum (Boussaïd et al., 2013). Recently, bioinspired algorithms have received the greatest traction (Darwish, 2018). Those algorithms transfer the biological activities of living organism algorithms into mathematical models, such as PSO, ant colony optimization, artificial bee colony, and cuckoo search, in an optimized manner. AHA was proposed in 2021 in (Zhao et al., 2022), although AHA belongs to the metaheuristics categories. It is pretty distinct from the previously developed bioinspired algorithms. The major difference is AHA’s particular biology background. This algorithm is inspired by hummingbirds’ unique flying abilities and sophisticated foraging techniques. AHA replicates three flying patterns: axial, omnidirectional, and diagonal, as well as three foraging strategies: guided, territorial, and migratory foraging search strategies. Additionally, for selecting the food source, the hummingbird’s memory function is implemented as a visit table.
5.2 Mathematical Model for the AHA
5.2.1 Initialization
In first step, the population of N hummingbirds are initialized to be placed at N food sources as:
where
The visit table, which mimics the memory for hummingbirds, is initialized as:
The visit table at i = j is set to null, which means that this hummingbird is taking its food from its food source, and it is zero (
5.1.2 Foraging
In AHA, there are mainly two strategies for foraging, guided foraging and territorial foraging. Guided foraging involves visiting food sources with the highest refilling nectar rate, thereby choosing it to be the target food source, and then trying to fly toward its target. In territorial foraging, after eating from the target food source, hummingbirds try to find a different food source. Therefore, it attempts to go to a nearby location in the hope of discovering a new food source which is superior to the existing one.
During foraging, a direction vector is used to model the three flights patterns. The patterns for those flights in a d-D space, in which a diagonal flight is defined as following:
The axial flight can be mathematically modeled:
and the omnidirectional flight is defined as:
where randperm(k) creates a random permutation of integers between 1 and k, randi([1, d]) creates a random integer between 1 to d, and r2 is a random number in [0, 1].
Hummingbirds visit the target food source using their flights, and the resulting food source is obtained. The candidate food source is updated based on the target food source for guided foraging as:
The mathematic simulation for territorial forging (local search) hummingbirds for a candidate food source is modeled as follows:
where xi(t) is the position of the ith food source at current iteration t,
Then, the position of the current food source for guiding foraging and territorial forging is updated as follows:
Equation 50 implies that if the current food source’s nectar-refilling rate is less than that of the candidate, the hummingbirds leave the current position and stay at the candidate food source for feeding instead, with
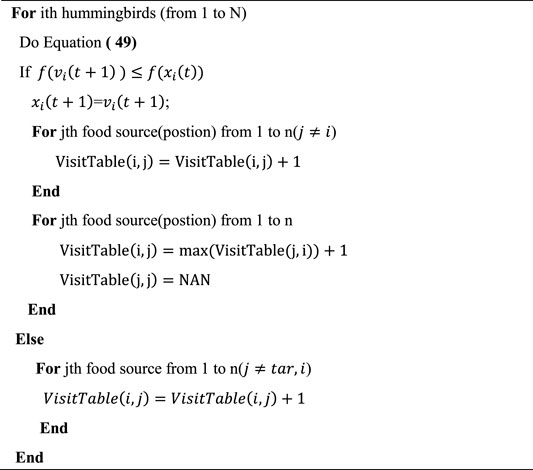
In AHA, the visit table serves as the memory for indicating how long it has been since this hummingbird visited that food source location. Each hummingbird tends to visit a food source with the highest visit level. The guiding foraging with the update process for the visit table is indicated in Algorithm 1 for guided foraging and in Algorithm 2 for territorial forging.
Algorithm 1. Guiding foraging for AHA.

Algorithm 2. Territorial forging for AHA.
Migration foraging: migration for the hummingbird occurs when the most frequently visited region lacks food. The migration happened after a predefined number of iterations depending on the migration coefficient, given as:
Algorithm 2. Territorial forging for AHA. Migration foraging: migration for the hummingbird occurs when the most frequently visited region lacks food. The migration happened after a predefined number of iterations depending on the migration coefficient, given as:
In migration, the food source with the lowest (or worst) nectar-refilling rate will migrate to a new food source randomly generated across the search space. At this point, the hummingbird will leave the previous feeding location in favor of feeding on the new one. The migration from the source with the worst nectar-refilling rate to a new position is described in Eq. 52, and the visit table is updated, as described in Algorithm 3.
Algorithm 3. Migration forging for AHA.
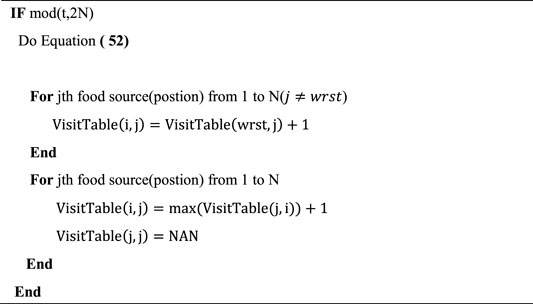
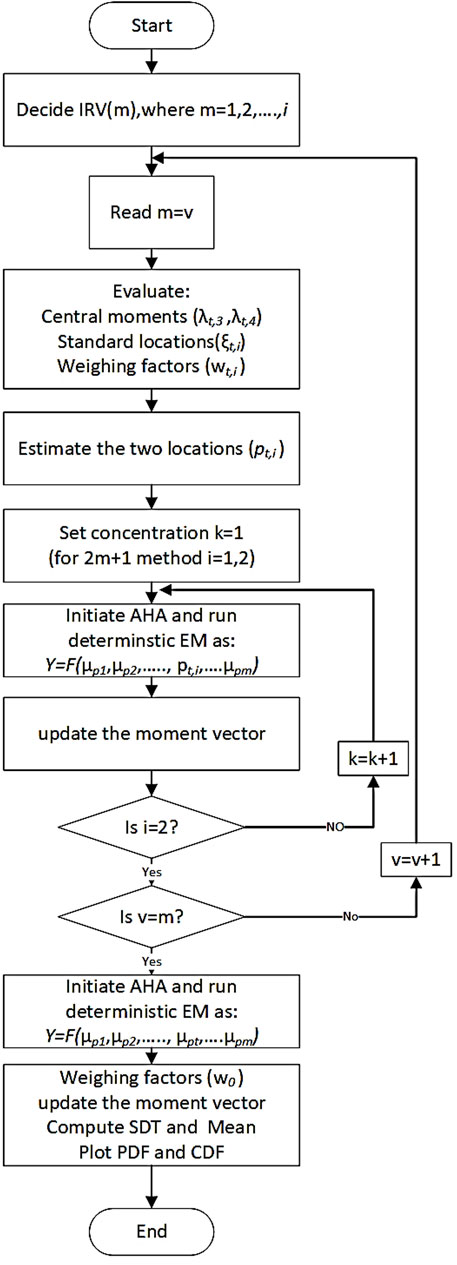
FIGURE 2. Flow chart of proposed PEM-AHA.
6 Results and Discussion
In this section, the proposed algorithm is validated as:
6.1 MG Design
To investigate the performance and the effectiveness of the EM using AHA, a simulated MG comprising DG units and customers with DR is used. The MG is equipped with PV modules and a WT unit with different ratings in different scenarios. In addition, diesel generators are used. A typical illustration of a simulated MG is shown in Figure 1.
6.2 Operating Scenarios
To show the behavior of the EM with AHA in the MG test system, two different scenarios have been formulated. Both deterministic and probabilistic frameworks have been used to solve EM in MG, thereby studying the influence of uncertainty on MG financial assessments and cost estimates. In the first scenario for deterministic EM, the output powers of renewable energy units, PV and WT generators, are assumed to be equal to their forecasted values and at the maximum available power at each hour. Two different case studies are evaluated.
Through 2m + 1 PEM, the uncertainty in random renewable power production, market bids, and total demand are evaluated for probabilistic analysis. In this case, three concentrations were determined for each IRV, one of which was estimated at its mean and the other two were estimated on either side of the mean in the associated distribution function.
6.1.1 Scenario-1 Deterministic EM
In this scenario, two separate case studies are given. Based on the MG shown in Figure 1, the first case study (case study 1) is a small MG that consists of one PV and wind generator, three conventional generating units (diesel), and three residential customers with DRP. This 6.2.1 scenario will last for only 1 day (24 h). Table 2 presents the specifications of conventional generators (cost coefficients, upper and lower generating limits, and ramp up and down rates) and shows the customer information (customer type, cost function coefficients, and daily power curtailment maximum limit). The values of hourly power interruptibility (λi,t) are presented in Table 3, as well as the hourly total initial MG demand; all customers are assumed to have the same hourly power interruptibility. Table 4 presents the solar PV and wind hourly data. The MG daily budget (UB) in this case study is $500 cost.
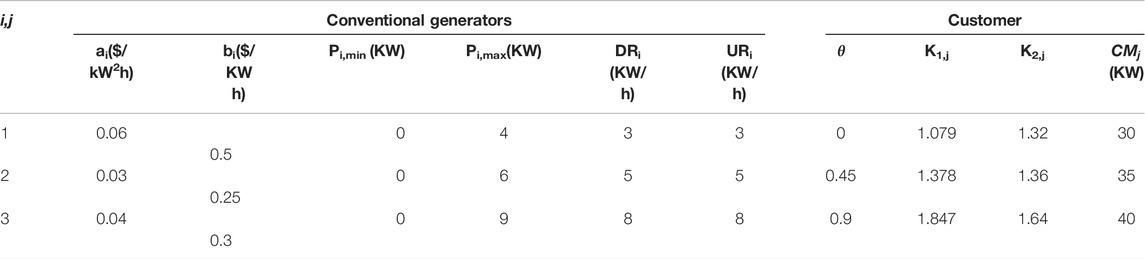
TABLE 2. Conventional generators and customers data (case study 1).

TABLE 3. λi,t values and total initial hourly demand (case study 1).
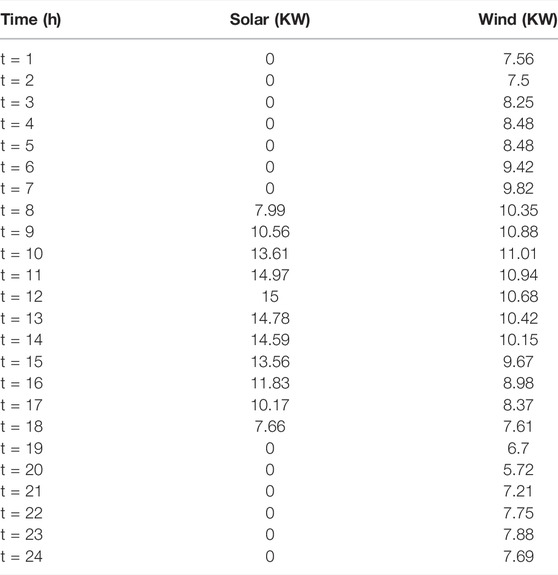
TABLE 4. Forecasted power from solar PV and wind generators (case study 1).
A second case with a larger MG is simulated for scalability validation of the algorithm. This case (case study 2) comprises an aggregated model for solar PV and wind and generators (data in Table 5), ten conventional generating units (parameters in Table 6), and seven customers to evaluate the algorithm’s scalability (data in Table 7). The initial load demand for case 2 is shown in Figure 3, and the load data and values of power interruptibility utilized were given in (Nwulu and Xia, 2017).
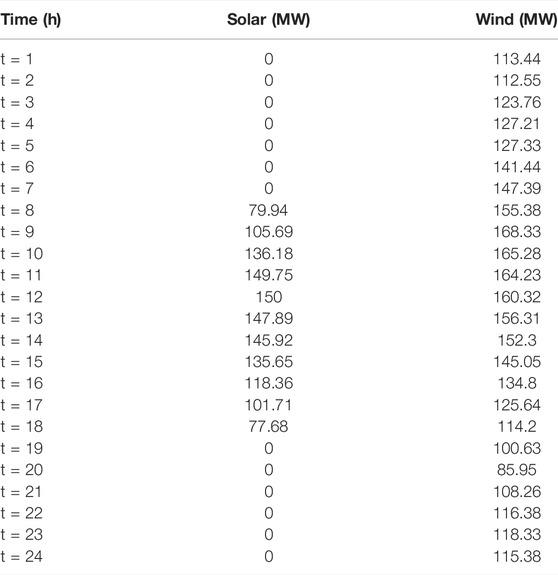
TABLE 5. Forecasted power from solar PV and wind generators (Scenario-1, case study 2).
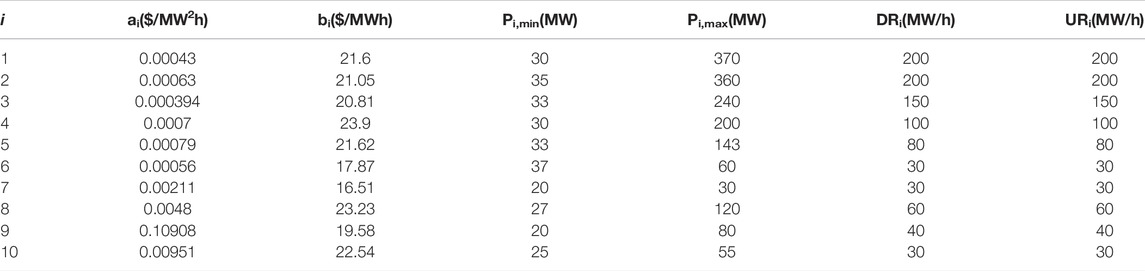
TABLE 6. Ten conventional generators units data (Scenario-1, case study 2).
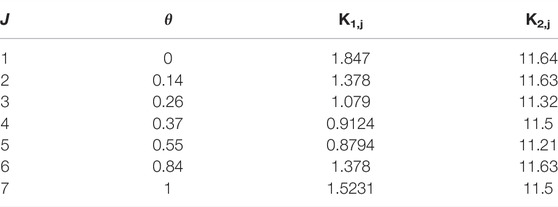
TABLE 7. Coefficients of the customer cost function, customer type, and daily customer curtailment limitations (case study 2) (Scenario-1).
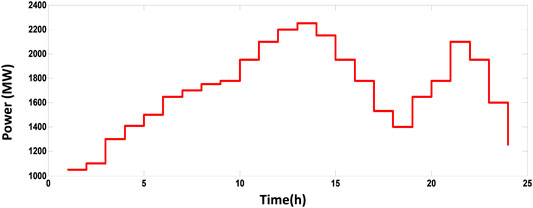
FIGURE 3. Initial hourly load demand for case study 2 (Scenario -1).
The next subsections summarize the results of the two examples analyzed, which have been produced using various optimization approaches, including PSO, JAYA, and AHA:
i) Case study 1
All simulations have been executed using MATLAB 2021b on a 2.9 GHz i7 PC with 8 GB of RAM. A 20 independent run was performed, and the obtained results were compared with the results of the techniques reported in (Moghaddam et al., 2011, Warid et al., 2016, Hashim et al., 2021, Ahmadianfar et al., 2022), as shown in Table 8; the effectiveness of AHA with the best value of operating cost can be noticed when compared with other techniques. The convergence characteristic curve of the objective function for all studied techniques is shown in Figure 4, which demonstrates the effectiveness and robustness of the AHA technique in achieving faster convergence and the best value for the fitness function. Using the AHA technique, the optimal power produced by the three conventional generators (diesel generators) is depicted in Figure 5. Figure 6 depicts the optimal power produced from solar PV generators, wind generators, and electricity transacted between the main grid and the MG. The optimal curtailed power from all customers and their incentives during the day are shown in Figure 7. Table 9 shows the total power curtailed for each customer using all studied techniques and AHA during the day. A comparison of the total cost for the studied techniques is shown in Figure 8.
i) Case study 2

TABLE 8. Comparison of the EM problem for Case 1.
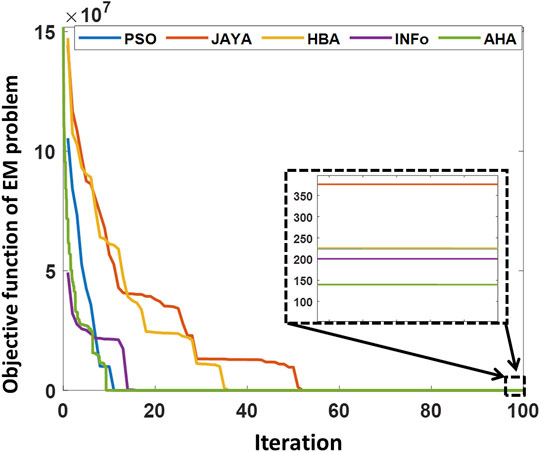
FIGURE 4. Convergence characteristic curve of all studied techniques for Case 1.
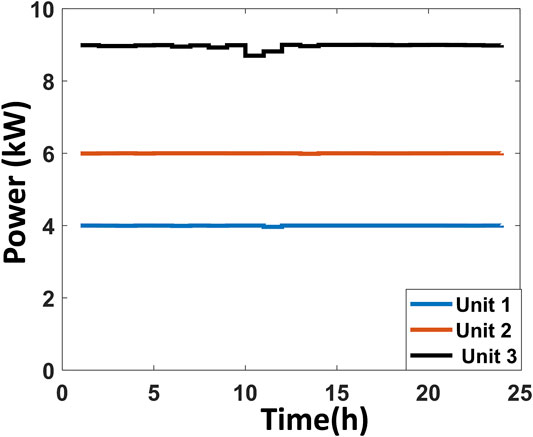
FIGURE 5. Optimal output power for conventional generation units obtained by AHA (case 1).
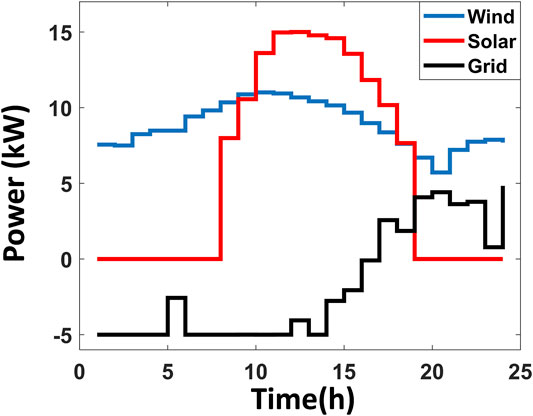
FIGURE 6. Optimal output power for solar, wind and grid power transaction (case study 1) obtained by AHA.
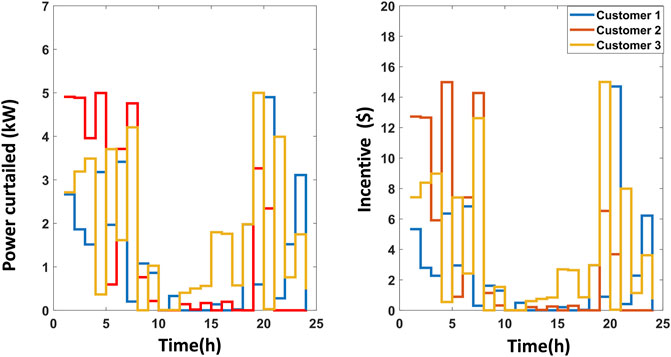
FIGURE 7. Optimal power curtailed and incentive paid to customers obtained by the AHA.
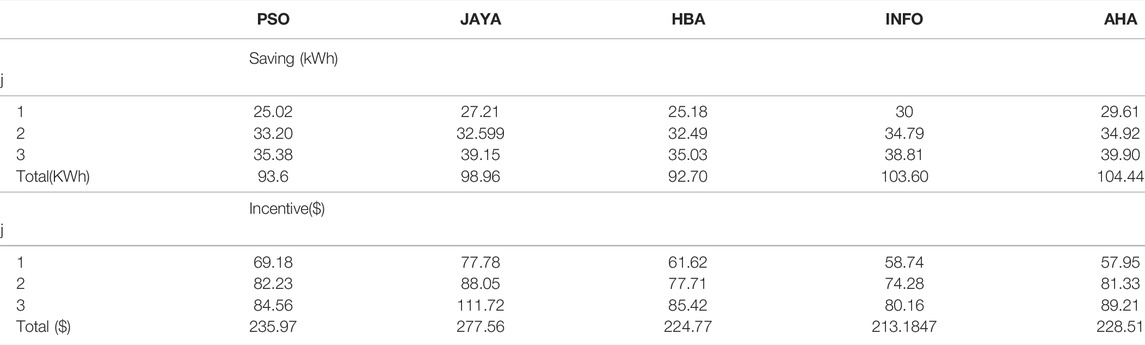
TABLE 9. Total amount of energy saved and the total amount of incentive received (case study 1).
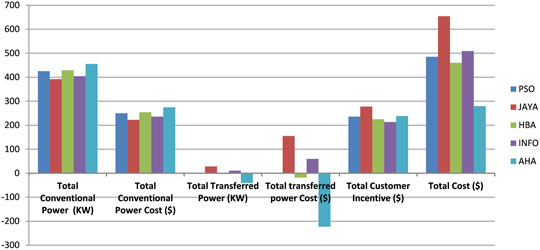
FIGURE 8. Cost breakdown for the studied optimization techniques (case study 1).
Using the AHA technique, the output power from PV and wind generator and the power transacted with the main grid is illustrated in Figure 9. Table 10 presents the total curtailed power and total incentive for each customer (seven customers) during the day for all studied techniques. Table 12 details a thorough comparison of the studied optimization strategies for generation cost, incentive payment cost, and power-transacted cost. Supplementary Appendix Table S1 presents the optimum power produced from ten conventional units in the Appendix, and Supplementary Appendix Table S2 presents a comprehensive curtailed power from seven customers.
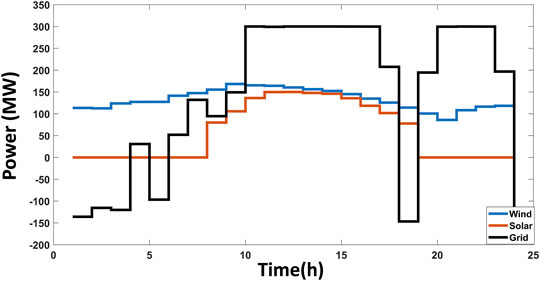
FIGURE 9. Optimal output power for solar, wind and grid power transaction (case study 2) obtained by the studied optimization techniques.
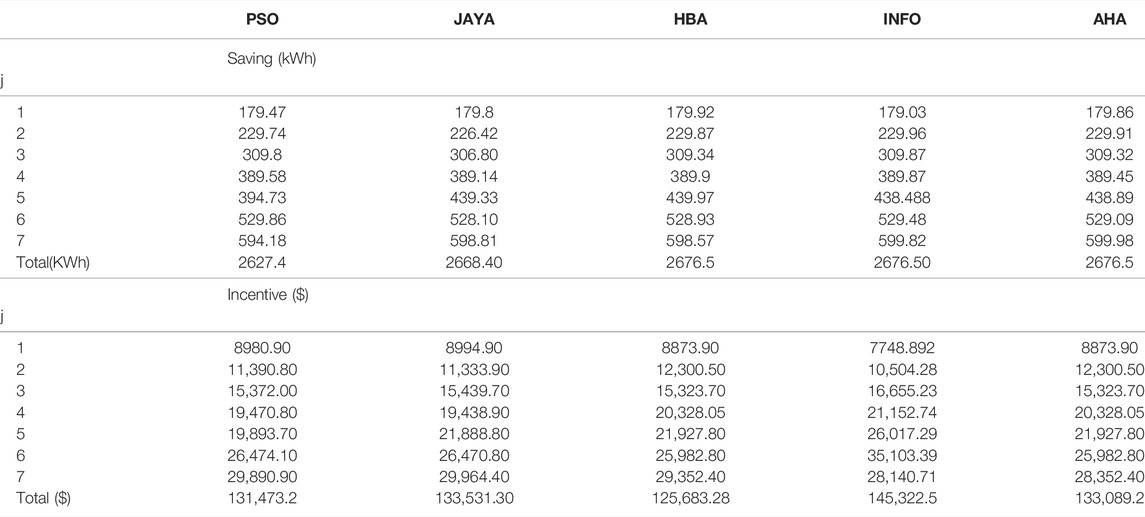
TABLE 10. Total amount of energy saved and the total amount of incentive received (case study 2).
Looking at the simulation results for case study 1, Table 9 reveals that in the case of AHA, the overall power curtailment is the highest compared with other techniques. Also, it can be noted from Figure 8 that the overall amount of power transacted with the grid is substantially lower in the case of AHA as well as the total cost.
In case study 2, the results in Table 10 show that AHA has a larger overall power curtailment than the PSO and the JAYA cases. Table 11 shows that employing the AHA approach has a lower overall cost than the other procedures.

TABLE 11. Cost breakdown for the studied optimization techniques (case study 2).
6.1.2 Scenario-2 Probabilistic EM
In this scenario, the point estimation technique (2m + 1) is combined with the AHA algorithm in order to provide the optimal solution for probabilistic EM. The WT and PV output power, market price, and demand load level are utilized as uncorrelated RIVs. Furthermore, the PV and WT generators’ output power, market price, and demand load level are determined using proper PDF modeling for hourly data of wind power and solar power, as specified in Section 4.1.1. It is assumed that PV output power, market prices, and load demand follow a normal distribution, with a standard deviation of 5% for PV and market prices (Radosavljevic, 2018) and 3% for load demand. The Weibull distribution is considered for the output power of the WT units, with an STD of 5%. Following that, the 2m + 1 approach is used to solve the probabilistic EM problem; IRVs’ concentrations (locations) during the implementation of 2m + 1 are calculated, as indicated in Table 12. AHA approach is employed using data acquired from (2m + 1) for each case. Finally, the statistical moments are calculated, and then, the mean value (
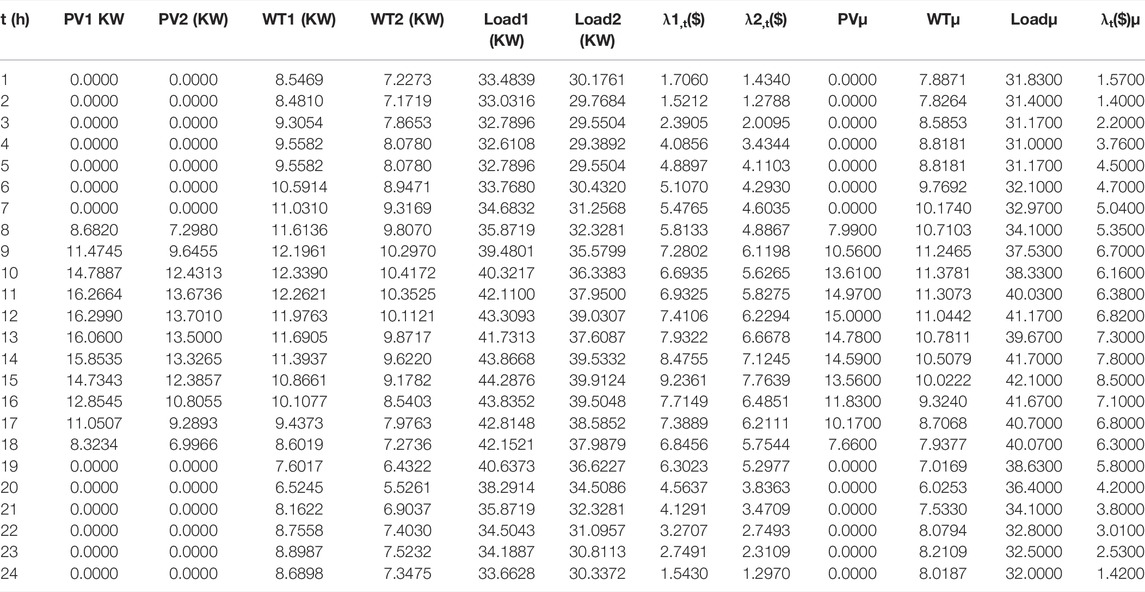
TABLE 12. Locations of the input random variables for EM and corresponding costs.

TABLE 13. Statistical moments of total expected cost for Case 1.
The PDF of the total expected cost for case study 1 is shown in Figure 10. These results demonstrate that the proposed strategy with AHA could solve the EM problem in unpredictable environments.
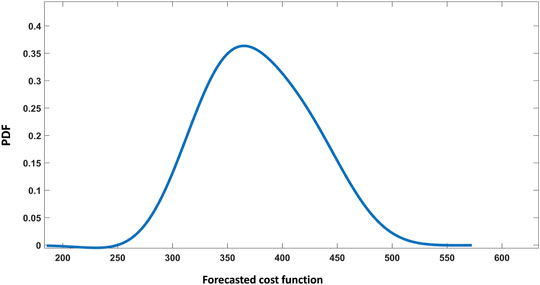
FIGURE 10. Probability density function (PDF of forecasted cost function based on the AHA for Scenario 2.
7 Conclusion
In this paper, a new application of an efficient optimizer, AHA, has been proposed for solving the EM problem of grid-connected MG with DRP. Moreover, a probabilistic EM using hybrid AHA and 2m + 1 PEM has been investigated. The main objective of this study is to get the lowest conventional generating and transaction costs to maximize the MG operator benefit. For deterministic operation, different optimization techniques have been utilized to solve the EM problem in MG over 24 h (1 day) to achieve the optimum operation on both sides of generation and demand. According to AHA’s results, in the first case study, energy consumption has been reduced by 104 KWh, while that in the second case study was reduced by 2677 MWh. The results of two case studies for the studied optimization strategies evaluated have been discussed, thereby proving that the AHA has the lowest overall cost. A probabilistic EM is solved using AHA-PEM, which allows operators of the MG system to make more realistic decisions and examine the effect of input random variable uncertainties on the statistical indicators, which describe the MG system state.
Data Availability Statement
The original contributions presented in the study are included in the article/Supplementary Material. Further inquiries can be directed to the corresponding author.
Author Contributions
All authors contributed to manuscript revision, read, and approved the submitted version.
Conflict of Interest
The authors declare that the research was conducted in the absence of any commercial or financial relationships that could be construed as a potential conflict of interest.
Publisher’s Note
All claims expressed in this article are solely those of the authors and do not necessarily represent those of their affiliated organizations or those of the publisher, the editors, and the reviewers. Any product that may be evaluated in this article or claim that may be made by its manufacturer is not guaranteed or endorsed by the publisher.
Acknowledgments
NA is very grateful to the Egyptian Ministry of Higher Education for providing financial support in the form of a PhD scholarship. In addition, we thank the Japanese International Cooperation Agency for providing all facilities to accomplish this research. The icons used in this paper were developed using Freepik, AmethystDesign, Arkinasi, and Smashicons from www.flaticon.com.
Supplementary Material
The Supplementary Material for this article can be found online at: https://www.frontiersin.org/articles/10.3389/fenrg.2022.905788/full#supplementary-material
References
Aalami, H. A., Moghaddam, M. P., and Yousefi, G. R. (2010). Demand response modeling considering Interruptible/Curtailable loads and capacity market programs. Applied Energy 87, 243–250. doi:10.1016/j.apenergy.2009.05.041
Aghaei, J., and Alizadeh, M.-I. (2013). Multi-objective self-scheduling of CHP (combined heat and power)-based microgrids considering demand response programs and ESSs (energy storage systems). Energy 55, 1044–1054. doi:10.1016/j.energy.2013.04.048
Aghajani, G., and Ghadimi, N. (2018). Multi-objective energy management in a micro-grid. Energy Reports 4, 218–225. doi:10.1016/j.egyr.2017.10.002
Ahmadianfar, I., Heidari, A. A., Noshadian, S., Chen, H., and Gandomi, A. H. (2022). INFO: An efficient optimization algorithm based on weighted mean of vectors. Expert Systems with Applications 195, 116516. doi:10.1016/j.eswa.2022.116516
Alavi, S. A., Ahmadian, A., and Aliakbar-Golkar, M. (2015). Optimal probabilistic energy management in a typical micro-grid based-on robust optimization and point estimate method. Energy Conversion and Management 95, 314–325. doi:10.1016/j.enconman.2015.02.042
Arabali, A., Ghofrani, M., Etezadi-Amoli, M., Fadali, M. S., and Baghzouz, Y. (2013). Genetic-Algorithm-Based Optimization Approach for Energy Management. IEEE Trans. Power Delivery 28, 162–170. doi:10.1109/tpwrd.2012.2219598
Asano, H., Hatziargyriou, N., Iravani, R., and Marnay, C. (2007). Microgrids: an overview of ongoing research, development, and demonstration projects. IEEE Power Energy Magazine, 78–94.
Atwa, Y. M., El-Saadany, E. F., Salama, M. M. A., Seethapathy, R., Assam, M., and Conti, S. (2011). Adequacy Evaluation of Distribution System Including Wind/Solar DG During Different Modes of Operation. IEEE Trans. Power Syst. 26, 1945–1952. doi:10.1109/tpwrs.2011.2112783
Baziar, A., and Kavousi-Fard, A. (2013). Considering uncertainty in the optimal energy management of renewable micro-grids including storage devices. Renewable Energy 59, 158–166. doi:10.1016/j.renene.2013.03.026
Ben Christopher, S. J., and Carolin Mabel, M. (2020). A bio-inspired approach for probabilistic energy management of micro-grid incorporating uncertainty in statistical cost estimation. Energy 203, 117810. doi:10.1016/j.energy.2020.117810
Boussaïd, I., Lepagnot, J., and Siarry, P. (2013). A survey on optimization metaheuristics. Information sciences 237, 82–117. doi:10.1016/j.ins.2013.02.041
Darwish, A. (2018). Bio-inspired computing: Algorithms review, deep analysis, and the scope of applications. Future Computing and Informatics Journal 3, 231–246. doi:10.1016/j.fcij.2018.06.001
Fahrioglu, M., and Alvarado, F. L. (2000). Designing incentive compatible contracts for effective demand management. IEEE Trans. Power Syst. 15, 1255–1260. doi:10.1109/59.898098
Faria, P., Soares, J., Vale, Z., Morais, H., and Sousa, T. (2013). Modified Particle Swarm Optimization Applied to Integrated Demand Response and DG Resources Scheduling. IEEE Trans. Smart Grid 4, 606–616. doi:10.1109/tsg.2012.2235866
García Vera, Y. E., Dufo-López, R., and Bernal-Agustín, J. L. (2019). Energy Management in Microgrids with Renewable Energy Sources: A Literature Review. Applied Sciences 9, 3854.
Hashim, F. A., Houssein, E. H., Hussain, K., Mabrouk, M. S., and Al-Atabany, W. (2021). “Honey Badger Algorithm: New metaheuristic algorithm for solving optimization problems,” in Mathematics and Computers in Simulation.
Hong, H. P. (1998). An efficient point estimate method for probabilistic analysis. Reliability Engineering & System Safety 59, 261–267. doi:10.1016/s0951-8320(97)00071-9
Jangamshetti, S. H., and Rau, V. G. (1999). Site matching of wind turbine generators: a case study. IEEE Trans. On energy Conversion 14, 1537–1543. doi:10.1109/60.815102
Jordehi, A. R. (2019). Optimisation of demand response in electric power systems, a review. Renewable and Sustainable Energy Reviews 103, 308–319. doi:10.1016/j.rser.2018.12.054
Khalili, T., Jafari, A., Abapour, M., and Mohammadi-Ivatloo, B. (2019). Optimal battery technology selection and incentive-based demand response program utilization for reliability improvement of an insular microgrid. Energy 169, 92–104. doi:10.1016/j.energy.2018.12.024
Li, P., Zhou, Z., and Shi, R. (2014). “Probabilistic optimal operation management of microgrid using point estimate method and improved bat algorithm,” in Proceeding of the 2014 IEEE PES General Meeting | Conference & Exposition, 1–5.
Majidi, M., Nojavan, S., Nourani Esfetanaj, N., Najafi-Ghalelou, A., and Zare, K. (2017). A multi-objective model for optimal operation of a battery/PV/fuel cell/grid hybrid energy system using weighted sum technique and fuzzy satisfying approach considering responsible load management. Solar Energy 144, 79–89. doi:10.1016/j.solener.2017.01.009
Moghaddam, A. A., Seifi, A., Niknam, T., and Alizadeh Pahlavani, M. R. (2011). Multi-objective operation management of a renewable MG (micro-grid) with back-up micro-turbine/fuel cell/battery hybrid power source. Energy 36, 6490–6507. doi:10.1016/j.energy.2011.09.017
Mohammadi, S., Mozafari, B., Solimani, S., and Niknam, T. (2013). An Adaptive Modified Firefly Optimisation Algorithm based on Hong's Point Estimate Method to optimal operation management in a microgrid with consideration of uncertainties. Energy 51, 339–348. doi:10.1016/j.energy.2012.12.013
Morales, J. M., and Perez-Ruiz, J. (2007). Point Estimate Schemes to Solve the Probabilistic Power Flow. IEEE Trans. Power Syst. 22, 1594–1601. doi:10.1109/tpwrs.2007.907515
Nguyen, T. T., Le, K. H., Phan, T. M., and Duong, M. Q. (2021). An Effective Reactive Power Compensation Method and a Modern Metaheuristic Algorithm for Loss Reduction in Distribution Power Networks. Complexity 2021, 8346738. doi:10.1155/2021/8346738
Nguyen, T. T., Nguyen, T. T., Duong, M. Q., and Doan, A. T. (2020). Optimal operation of transmission power networks by using improved stochastic fractal search algorithm. Neural Comput & Applic 32, 9129–9164. doi:10.1007/s00521-019-04425-0
Niknam, T., Golestaneh, F., and Malekpour, A. (2012a). Probabilistic energy and operation management of a microgrid containing wind/photovoltaic/fuel cell generation and energy storage devices based on point estimate method and self-adaptive gravitational search algorithm. Energy 43, 427–437. doi:10.1016/j.energy.2012.03.064
Niknam, T., Kavousi Fard, A., and Baziar, A. (2012b). Multi-objective stochastic distribution feeder reconfiguration problem considering hydrogen and thermal energy production by fuel cell power plants. Energy 42, 563–573. doi:10.1016/j.energy.2012.02.023
Nwulu, N. I., and Fahrioglu, M. (2013). A soft computing approach to projecting locational marginal price. Neural Comput & Applic 22, 1115–1124. doi:10.1007/s00521-012-0875-8
Nwulu, N. I., and Xia, X. (2017). Optimal dispatch for a microgrid incorporating renewables and demand response. Renewable Energy 101, 16–28. doi:10.1016/j.renene.2016.08.026
Parisio, A., Rikos, E., and Glielmo, L. (2014). A Model Predictive Control Approach to Microgrid Operation Optimization. IEEE Trans. Contr. Syst. Technol. 22, 1813–1827. doi:10.1109/tcst.2013.2295737
Pei, Z., and Lee, S. T. (2004). Probabilistic load flow computation using the method of combined cumulants and Gram-Charlier expansion. IEEE Transactions on Power Systems 19, 676–682.
Radosavljevic, J. (2018). Metaheuristic Optimization in Power Engineering. Institution of Engineering and Technology.
Radosavljević, J., Jevtić, M., and Klimenta, D. (2016). Energy and operation management of a microgrid using particle swarm optimization. Engineering Optimization 48, 811–830.
Rosenblueth, E. (1975). Point estimates for probability moments. Proc. Natl. Acad. Sci. U.S.A. 72, 3812–3814. doi:10.1073/pnas.72.10.3812
Rosenblueth, E. (1981). Two-point estimates in probabilities. Applied Mathematical Modelling 5, 329–335. doi:10.1016/s0307-904x(81)80054-6
Rubinstein, R. Y., and Kroese, D. P. (2016). Simulation and the Monte Carlo Method. Wiley Publishing.
Seo, H. S., and Kwak, B. M. (2002). Efficient statistical tolerance analysis for general distributions using three-point information. International Journal of Production Research 40, 931–944. doi:10.1080/00207540110095709
Shivam, , and Dahiya, R. (2018). Stability analysis of islanded DC microgrid for the proposed distributed control strategy with constant power loads. Computers & Electrical Engineering 70, 151–162. doi:10.1016/j.compeleceng.2018.02.020
Soroudi, A., and Ehsan, M. (2011). A possibilistic-probabilistic tool for evaluating the impact of stochastic renewable and controllable power generation on energy losses in distribution networks-A case study. Renewable and Sustainable Energy Reviews 15, 794–800. doi:10.1016/j.rser.2010.09.035
Tabatabaee, S., Mortazavi, S. S., and Niknam, T. (2016). Stochastic energy management of renewable micro-grids in the correlated environment using unscented transformation. Energy 109, 365–377. doi:10.1016/j.energy.2016.04.067
Villanueva, D., Pazos, J. L., and Feijoo, A. (2011). Probabilistic Load Flow Including Wind Power Generation. IEEE Trans. Power Syst. 26, 1659–1667. doi:10.1109/tpwrs.2010.2096436
Wang, L., Beeson, D., and Wiggs, G. (2004). “Efficient and Accurate Point Estimate Method for Moments and Probability Distribution Estimation,” in 10th AIAA/ISSMO Multidisciplinary Analysis and Optimization Conference. doi:10.2514/6.2004-4359
Warid, W., Hizam, H., Mariun, N., and Abdul-Wahab, N. (2016). Optimal Power Flow Using the Jaya Algorithm. Energies 9, 678. doi:10.3390/en9090678
Zhao, W., Wang, L., and Mirjalili, S. (2022). Artificial hummingbird algorithm: A new bio-inspired optimizer with its engineering applications. Computer Methods in Applied Mechanics and Engineering 388, 114194. doi:10.1016/j.cma.2021.114194
Nomenclature
Variables and parameters
N Hummingbirds number (population)
Abbreviations
MG Microgrid
DR Demand response
AHA Artificial Hummingbird Algorithm
EM Energy Management
RES Renewable Energy Sources
PEM Point Estimation Method
PV Photovoltaic
WT Wind turbine
PDR price-based DR
IDR incentive-based DR
PSO Particle swarm optimization
HBA Honey Badger Algorithm
Keywords: energy management, Microgrid, renewable energy sources, generation uncertainty, optimization, artificial hummingbird algorithm
Citation: Alamir N, Kamel S, Megahed TF, Hori M and Abdelkader SM (2022) Developing an Artificial Hummingbird Algorithm for Probabilistic Energy Management of Microgrids Considering Demand Response. Front. Energy Res. 10:905788. doi: 10.3389/fenrg.2022.905788
Received: 27 March 2022; Accepted: 25 May 2022;
Published: 13 July 2022.
Edited by:
Sorour Alotaibi, Kuwait University, KuwaitReviewed by:
Baseem Khan, Hawassa University, EthiopiaMinh Quan Duong, The University of Danang, Vietnam
Copyright © 2022 Alamir, Kamel, Megahed, Hori and Abdelkader. This is an open-access article distributed under the terms of the Creative Commons Attribution License (CC BY). The use, distribution or reproduction in other forums is permitted, provided the original author(s) and the copyright owner(s) are credited and that the original publication in this journal is cited, in accordance with accepted academic practice. No use, distribution or reproduction is permitted which does not comply with these terms.
*Correspondence: Nehmedo Alamir, Nehmedo.Alamir@ejust.edu.eg