A feasibility study on Balarbhita for advancing rural electrification with a solar—Micro-hydro hybrid system
 R. Rajesh Kanna
 R. Raja Singh
- 1School of Electrical Engineering, Vellore Institute of Technology, Vellore, India
- 2Dept of Energy and Power Electronics, Vellore Institute of Technology, Vellore, India
The study analyzed the techno-economic feasibility of a village in the Indian state of Assam and designs a framework for a rural hybrid energy system. Through an extensive resource evaluation, techno-economic feasibility analysis and system size optimization are carried out using HOMER Pro software. Batteries are being used as a form of energy storage in the community power system, which is based on solar PV and micro-hydro as its principal energy sources. Macro-economic variables and resource variations have been considered in sensitivity analysis to ensure the robustness and commercial viability of the proposed hybrid energy systems. A reliable and economical design can provide 279861 kWh of electricity for the village at a modest cost of energy (COE) of $0.0953/kWh using 118 kW of solar power, 11 kW of hydropower, and 261 kWh of battery storage. Furthermore, solar energy systems account for about 62.5 percent, while micro-hydro turbines account for 37.5 percent. In addition, the suggested system does not pollute the local environment caused by carbon emissions. Most importantly, this hybrid energy system is capable of providing 24/7 continuous electricity to the site under consideration.
1 Introduction
1.1 General descriptions
Remote electrification is a primary concern for developing nations. According to Vinicius et al. (2021) and Cicowiez et al. (2022), 13% of the global population, or approximately 1 billion people, do not have access to electricity. The majority of nations, including India and African nations, are following the electrical policy “Power for All” that was proclaimed by the United Nations. However, the Covid-19 epidemic reversed earlier developments. Governments have invested significantly in rural electrification programs, yet there are still certain places where the electrification rate is extremely low (Banerjee et al., 2014). The number of people without electricity in a different region is detailed in Figure 1. Due to the Covid-19 epidemic, rising natural gas prices, and fuel prices, the world is currently undergoing an electrical crisis. Utilities have become economically unviable as a result of ongoing price hikes for commercial gas, and the demand for energy infrastructure has increased due to bigger shortages. The United Nations is making progress toward achieving Goal 7 (Affordable and Clean Energy), which aimed to enhance international collaboration to make green power ideas and technology more widely available (United Nations, 2022). Around the world, 771 million people lack access to electricity. One hundred million people in Sub-Saharan Africa have only very limited or irregular access to electricity, out of the region’s 578 million residents. In Sub-Saharan Africa, only approximately 25% of health centers have access to continuous power, even though electricity is essential for powering life-saving equipment in hospitals and keeping people connected at home (International Energy Agency, 2022). Followed by, almost 148 million people in South Asian nations, including Pakistan (51 million) and Bangladesh (23 million), lack access to energy for their basic requirements (Ali et al., 2021), (Das and Zaman, 2018). India’s ability to generate sufficient electricity to meet demand has decreased, notably in key regions such as Assam, Uttar Pradesh, Madhya Pradesh, Rajasthan, and Bihar. This persistent problem affects commerce, industry, and agriculture. Recent large swings in oil prices have increased the cost of producing electricity. So, the conventional methods of power production are insufficient to meet India’s enormous need for electricity. Otherwise, India must buy almost 85% of its crude oil from the Middle Eastern nations to generate electricity (Petroleum Planning, 2022). A power grid expansion is capable of achieving long-term electrification. However, due to the centralized grid’s low stability and high investment expenditures, the solution is financially unsustainable, resulting in an exorbitant levelized cost of electricity (LCOE) (Singh et al., 2022). The cost of production plays a significant role in circular debt and exacerbates economic problems in energy and related industries (Ali et al., 2021). India has a significant potential for producing photovoltaic (PV) energy because of its high solar radiation. Producing electricity from renewable energy sources (RESs) is more cost-effective, cleaner, and ecologically beneficial in the long run.
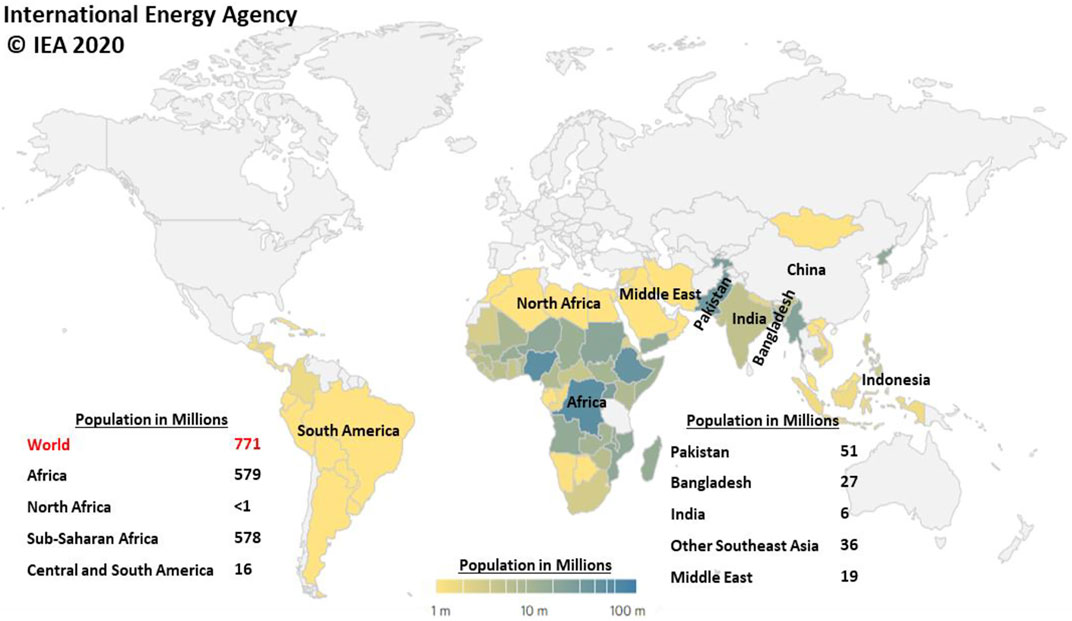
FIGURE 1. Region and population with lacking to electricity.
As a result, a strong off-grid infrastructure is required to deliver uninterruptible power at a reasonable cost. A stand-alone microgrid for rural electrification that generates the necessary energy on its own using RES and small generators may be a preferable choice (Stevanato et al., 2021; Gabriel et al., 2022). Microgrids are autonomous power systems that rely on nearby distributed generating units to supply grid backup power to satisfy local demands. Microgrids minimize greenhouse gas emissions, lower operating costs, and increase investor return as a key to technological developments and the integration of RES (Debouza et al., 2022; Mishra et al., 2022).
One of the most important benefits of microgrids is their ability to operate independently of the central grid, known as the “islanded mode of operation.” The microgrid may be turned off without affecting the power supply to the island loads in the case of an unexpected malfunction of the centralized grid. This resilient process in the microgrid increases the system performance, stability, and overall power quality (Kannan et al., 2021). When analyzing the whole economics of electrical networks, which includes the costs of energy supply transportation, microgrids that use renewable energy frequently operate in a grid-connected mode to maximize benefit (Caparrós Mancera et al., 2022). On the other hand, relying on independent RES to operate a microgrid in islanded mode might induce intermittent issues, which may result in energy outage (Wang et al., 2021). Therefore, hybrid electrical power systems may be the best option for islanded mode power generation (Ara et al., 2021; Dong et al., 2021).
1.2 Literature review
Owing to the growing energy issue as well as the challenges related to both the usage of fossil and nuclear fuels, extensive research on renewable energy has been conducted across the world in recent years. The goal sets of various investigations are reviewed in detail. In the study of Kumar et al. (2022), they discussed the solar PV/biomass/diesel generator (DG)/battery storage–based hybrid system, which comprises 600 kW of solar, 50 kW of DG, 1 MWh of battery storage, and 10 kW of biomass that powers the remote areas in Eastern India. In the study of Ullah et al. (2021), they presented a solar, wind, hydro, and biomass based on/off-grid hybrid system to deliver electrical power to the rural areas of Pakistan. The approach is to integrate a decision-making tool for utilizing 100% RES. The finest off and on-grid systems produce 408.37 kg/yr and 29177.89 kg/yr of CO2, respectively. For an off-grid system, solar and hydro contribute 99.3% of overall production. In the study of Das and Zaman (2018), they presented the PV, DG, and battery storage system for providing continuous electricity to remote communities of Bangladesh, Godagari, and Rajshahi. The system meets a load demand of 350 kWh/day with a 74.34 kW peak demand. The COE effects and net present cost (NPC) under different dispatch strategies using lead–acid and lithium ion batteries are considered. The grid-connected 5 MW solar power plant with different solar tracking modes for eight various cities in Iran is presented in Mohammadi et al. (2018). These solar arrays are integrated with a single-axis tracking system. In the study of Pal and Mukherjee (2021), they exhibited the integration of PV and hydrogen fuel cell (HFC) systems for providing electricity to the northeast Indian states such as Arunachal Pradesh, Assam, Manipur, Meghalaya, and Mizoram. In the study of Rashid et al. (2021), they presented the various configurations of energy sources including PV, wind, DG, and biomass hybrid systems for rural electrification at Kukri Mukri Island, Bangladesh. Among the six configurations, PV, wind, DG, and biomass met the load demand with low emissions. A 1 MW PV system is suggested in Hafeznia et al. (2016) to classify the Iran government policies according to the ecological, technical, and socio-economic factors. Though fossil fuels are available at an enormous level, the government of Iran mostly focused on RES and inaugurated two 7 MW power plants in 2017. In the study of Syahputra and Soesanti (2021), they proposed a PV and micro-hydro–based renewable energy system for rural electrification in Yogyakarta, Indonesia. This hybrid system’s performance has been improved using the enhanced particle swarm optimization (PSO) approach. The excess power from the system is exported to the available grid.
In the study of Fadhil et al. (2021), they introduced micro-hydro, PV, and battery-based hybrid system for lighting the road in Al-Marj. In this project, 100 poles of LED bulbs are powered with 30 kW PV and 0.9 kW hydro. A grid-connected solar and wind-based hybrid energy system is presented in Alharthi et al. (2018) to meet the demand of 15,000 kWh/day with a peak load of 2,395 kW in Saudi Arabia. The maximum energy produced by the feasible configuration will be traded to the utility grid and produce the lowermost CO2 emission. In the study of Ashourian et al. (2013), they presented a solar, wind, fuel cell, battery, and DG-based system to power the tropical islands of Malaysia. To provide the energy back up, battery-based energy storage is suggested. Moreover, in the event of unexpected situations, a DG is also connected with this system. In the study of Ali et al. (2021), they introduced a solar, wind, biomass, battery, and DG-based hybrid system for providing electricity to the rural areas of Mandhra Saidan, Pakistan. The battery is used as a storage system and DG is providing the overall backup. In the study of Azerefegn et al. (2020), they presented a solar, wind, DG, and battery-based power system which is connected with an existing unreliable grid for providing electricity to three dissimilar regions in the industrial parks of Ethiopia. Grid, PV, DG, and battery-based system is considered a feasible system that meets an average critical load demand of 329 kW h/day. A wave- and solar-based renewable energy system is presented in Dallavalle et al. (2021) to supply power to a large desalination plant located in the Canary Islands. The combination of two RES is providing 2 MW of electricity to the desalinization plant. In the study of Li et al. (2022), they suggested a solar, wind, battery, and biomass off-grid hybrid system that powers a rural area in West China. The PV-, wind-, biomass-, and battery-based system is independent of a centralized grid, and also can deliver electric power to the rural people at a reasonable cost of $0.201/kWh. It is also more economically viable than grid extension over a considered project lifetime. A comprehensive review of a techno-economic analysis of various configurations of a hybrid renewable energy design has been carried out by the author and also presents a case study for a remote area using various optimization techniques (Sawle et al., 2016; Sawle et al., 2018). The utilization of solar energy systems for applications such as irrigation and household has been implemented for economic and sustainable development (Kanna et al., 2020; Pillai, 2020). Prefeasibility technical, economic, and sensitive analysis using HOMER has been carried out to electrify a remote location in the district of India (Sawle et al., 2021).
A hybrid system is created in this research study for a remote location in India, Balarbhita, Assam, to supply power for 120 residents. Nearly 120 families lack access to even the most basic sources of electricity. The rest of the residents have basic electricity access. As a result, the authors focused on those 120 residents. Also, the Brahmaputra River, which is the source of the hydro plant, is the key reason for choosing this location. Balarbhita has a strong solar power supply, with irradiation up to 4.6 kWh/m2/day, as well as hydropower capacity from the Brahmaputra River. The combined contribution of these RESs (hydro and solar) accounts for 24% of total grid-connected generation. Micro hydropower and solar power generation systems are the least expensive among clean energy technologies, therefore; properly designed micro-hydropower and solar hybrid systems have the lowest generation costs. The technological and economic efficacy of the hybrid energy system is assessed in this feasibility study according to load demand and source availability. The HOMER Pro software from the National Renewable Energy Laboratory was utilized to optimize the solar–micro-hydro–based microgrid architecture and conduct the feasibility study on Balarbhita.
1.3 Research gap
According to the literature, integrating renewable sources are providing a gateway for electrifying rural places. The Ministry of New and Renewable Energy (MNRE) of India has recently issued directions allowing the off-grid use of renewable energy sources to electrify remote rural populations. Moreover, depending on single RES still results in a discrepancy between load and demand, as well as limited renewable penetration and economically unsustainable. To promote the penetration of affordable and renewable energy, this work has attempted to build an electrification system for a rural community in Assam, which has a substantial level of solar as well as hydro renewable resources. So far, there have been very few extensive evaluations of techno-economic analysis for PV/hydro/battery hybrid systems for household load in Assam, India. As a result, the primary goal of this research was to look into off-grid hybrid renewable energy system setups in Balarbhita, Assam, India, to find the optimal configuration of RESs for delivering energy reliably and sustainably.
1.4 Contribution
The main contributions of this work are as follows
• Based on locally accessible resources, a systematic framework for designing rural energy systems is presented.
• Off-grid arrangements that are entirely reliant on RESs have been observed to offer a continuous power supply to the region under consideration.
• Techno-economic analysis using HOMER Pro software for the multi-combinational hybrid system is carefully examined.
• A sensitivity analysis is demonstrated to examine the effects of various input cost parameters on the COE and NPC for both PV, hydro, and battery or PV and battery-based hybridized systems.
This article presents the feasibility study on Balarbhita for advancing rural electrification using the available RES (solar and micro-hydro); followed by the hybrid renewable energy-based microgrid system for rural electrification, presented in Section 2. In Section 3, a systematic procedure for realization is presented. Finally, the simulation results are obtained and discussed under this case study in Section 4 and concluded in Section 5.
2 Solar–micro-hydro hybrid energy system
This work offers the performance of a solar PV–micro-hydro hybrid renewable energy system with a rural (Balarbhita) load. The proposed system is integrated with solar PV generation units, micro-hydro generation units, battery energy storage units, central control units, and loads. Each element of the proposed hybrid system is extensively discussed in the subsection.
2.1 Solar PV power generation unit
The solar PV is linked to a DC bus, which has a 25-year lifespan. Owing to the reduced servicing costs for the PV panel, the initial setup, as well as return costs for a generic flat plate solar panel that holds 1 kW, are fixed at $397.64 and $50, respectively; conversely, the operational and maintenance cost is set at $10/year/kW. Travel expenses, construction, and logistical cost are included in the costs per kW.
For every flat PV panel, the derating factor is set at 80%, which takes into account things such as panel soiling, cable losses, shadowing, age, and so on. The Earth’s reflectivity is calculated to be 20 percent. Here, the maximum power point tracking system is not fixed with solar panels and the slope is assigned to be 25.91°. The panel azimuth is considered as 0°. Solar irradiation and temperature at 26° 6.06′N and 90° 30.77′E were obtained using HOMER Pro Resources (Power Data Access, 2022) which consists an option webpage of NASA Surface Meteorology. The total yearly average solar irradiation is determined as 4.67 kWh/m2/day, while the annual average clearness index is 0.537. It is clear from Figure 2A that a significant quantity of sunlight in the chosen village will be used virtually all year. The overall power production in the period “t” hour of solar panel can be computed using Eq. 1 based on irradiation and temperature (Homer Pro Home Page, 2022a).
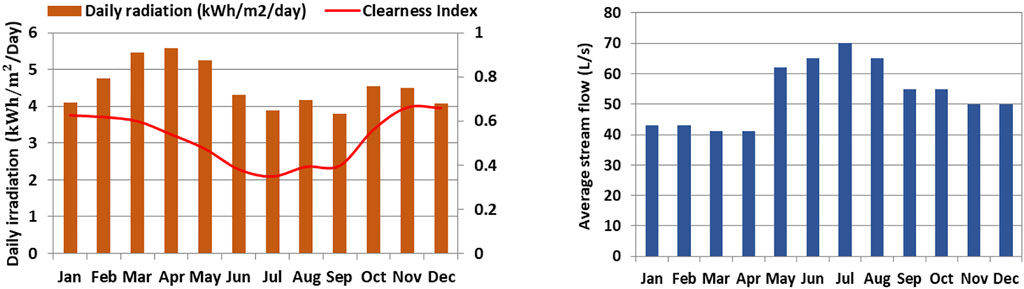
FIGURE 2. Month wise resources available in Balarbhita. (A) Solar radiation per year (Power Data Access, 2022). Average water streamflow rate per year (Sharma et al., 2012)
Because the impact of temperature on the PV system is ignored, HOMER Pro software considers that the temperature coefficient is negligible, therefore simplifying Eq. 1.
where
2.2 Micro-hydropower generation unit
The annual stream discharge and rainfall data of the Goalpara district in Assam, India were obtained from the Government of Assam water resources department. Preliminary data are essential for developing micro-hydro–generating facilities. The capital, replacement costs, operation and maintenance expenses, lifetime of the hydro plant, head of hydro turbine, flow rate, and efficiency of the turbine are required data (Sami et al., 2020), (Naik et al., 2022). In HOMER Pro, all these data are utilized as input data, which helps to generate hydroelectricity-producing capacity. According to HOMER Pro software estimations, micro-hydropower has a capacity of 15 kW. A micro-hydropower plant has an initial purchase and setup cost of $80000 and a replacement cost of $40500. Operational expenditures are expected to be $2,400, assuming micro-hydro systems may be operated for up to 25 years. According to the hydropower prospective statistics with the head range of 25 m as well as the rate of flow of 75 L/s, the production of 15 kW power by micro-hydro will be decided. The lowest and highest rates of flow of the stream are 80 and 120 percent while the efficacy of a turbine is 80 percent. The average water streamflow rate per year is shown in Figure 2B which is extracted from Sharma et al. (2012) and for the minimum requirement for the micro-hydro system of HOMER Pro, and the authors are considering only 40–70 L/s variation in streamflow. The hydro turbine’s electrical power output is calculated by HOMER Pro using (Eq. 3) (Homer Pro Home Page, 2022b).
where
2.3 Battery energy storage unit
The battery utilized in this design has a 513 Ah capacity and a 12 V nominal voltage. Because the DC power system utilized in this project is 80–220 V, these batteries are linked in series to provide the required volt power. The battery is estimated to cost $339.16/2.4 kW. Because it is anticipated that if there is deterioration, the replacement costs are just the same as the capital costs. The fundamental purpose of a lead–acid battery in this situation was to balance power requirements between the generating and load sides. It should also be able to provide all loads when necessary, as well as when removing loaded areas from the microgrid, to fulfill unforeseen and unexpected needs. This will allow it to store the maximum amount of energy required during off-peak hours. In the meantime, the battery state of charge (SOC) capacity is constrained by the following factors.
The highest
2.4 Power inverter
The proper power inverter for a given application is chosen based on load demands. During this operation, the inverter has a 90 percent efficiency rating. A power inverter costs 1226.59 USD per kW in capital expenditure. Here, the capital and replacement costs are considered the same cost. Because it is presumed that if a problem arises, the complete power inverter should be changed. The converter has a 15-years lifespan, with a 95 percent for both inverter and rectifier efficiency. The PV system and battery-based inverter model are offered below.
where
3 Systematic procedures for realization
The systematic process with the finest techno-economics as well as the sensitive study of hybrid off-grid power systems are explained in this section. The detailed data for formulating the simulation and selection of respective components are explained as follows.
3.1 Input data
Meteorological parameters, availability of RES, load profile data, as well as technological and economic data are all essential input information for modeling; also, temperature, solar irradiance, average streamflow, and other meteorological data and available resources. These are inputs given to HOMER Pro as monthly averages data to determine PV array and hydro turbine output power. The load profile for the village is then thoroughly investigated for various applications, with a focus on the regional specifications used in power balancing calculations. Suitable components have been chosen and developed in accordance with local requirements, while cost statistics and methodological characteristics of the elements are defined. The village latitude and the longitude are 26°_6.13′N and 90°_25.25′E, respectively. Agriculture is the main foundation of the village, and solar and water resources are plentiful. The village is 20.4 km away from the local town, Balijana. The available power resources around the Goalpara district are shown in Figure 3.
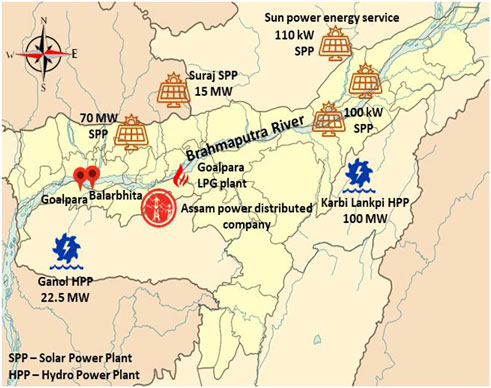
FIGURE 3. Power resources available around the Goalpara district.
The method for identifying the optimum off-grid hybrid energy system is detailed in Figure 4. The recommended system is modeled to serve the whole 25-year project with several variations, including component cost and load profile. A hybrid renewable energy system should be able to adapt to almost any circumstance, including changes in the critical factors that directly affect them. Resources data and economic data are collected and fetched as inputs to produce an optimal design. The most valued system is then chosen based on the NPC after a load-following simulation. The system is evaluated using an off-grid connection to determine the optimal solution. Following that, the technical, financial, and ecological enforcement of the selected system is assessed. The off-grid hybrid system is primarily examined during sensitivity analysis to assess the impact of environmental variables and load profile on the ideal design. If the model does not satisfy the load demand, the components of the off-grid hybrid system are resized and again tested.
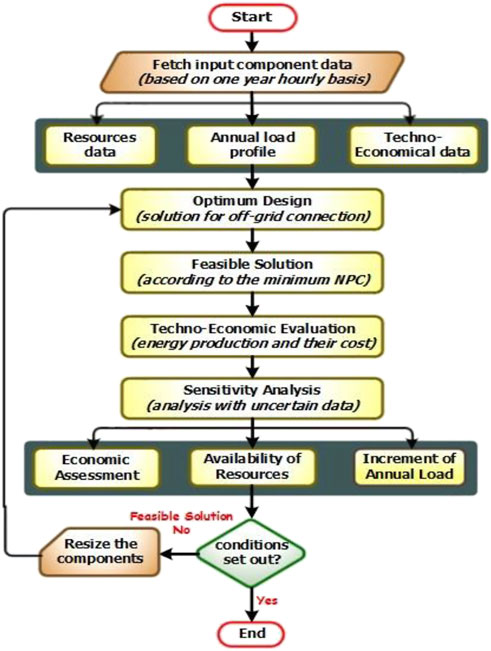
FIGURE 4. Systematic procedure for realization.
Several sets of dispatch strategies have been developed to control the operation of generators and storage batteries when renewable energy is discovered to be insufficient to fulfill the demand. In the HOMER Pro software’s optimization algorithm, depending on the load demand, the availability of power sources, the conditions of weather circumstances, and various arrangements of dispatch strategies, such as load following (LF), cycle charging (CC), generator order, and combined dispatch, seem to be used. The dispatch strategies of LF and CC are utilized to control the generator operation and the battery. During CC dispatch strategies, generators energize storage batteries, and during off-peak periods, generators shut down, thereby decreasing the total operating hours of generators. However, the replacement cost of the battery is high in this strategy because of its sequence of charging and discharging processes.
When a generator is needed, the LF process states that it should only supply enough capacity to fulfill the load requirement. Load demand should be satisfied by renewable resources to keep the system sustainable and stable. The system under the LF strategy experiences maximum utilization of renewable sources because the generator is used for accessing load demand only and cannot provide charging storage batteries. The battery is generally charged through the renewable system’s excess electricity only. Moreover, the battery attains a longer life due to its lower utilization. In this dispatch approach, the power supply to the load takes precedence. As a result, the system reliability for this technique is quite high. In this work, simulation was carried out using the load flow strategy, and the general flowchart for the load-following strategy proposed is shown in Figure 5.

FIGURE 5. Diagrammatic representation of load following dispatch strategies.
3.2 Load demand profile
Currently, the people from Balarbhita are using kerosene, diesel generators, and a small level of PV plant for lighting purposes as well as agriculture. Even the grid is connected in some places that are not reliable to provide continuous supply. Nearly 120 families lack access to even the most basic sources of electricity. The rest of the residents have basic electricity access. So, the authors focused on 120 residents. The authors surveyed the area, which revealed that agricultural production is the village’s primary source of income. As a result, electricity is mostly used for domestic and agricultural purposes. Consequently, the electricity demand is divided into two groups: residential and agricultural groups. Lamps, mobile chargers, fans, electric irons, water pumps, and televisions are the most common home appliances that use electricity. However, the electricity for agriculture purposes in rural areas is especially utilized for irrigation systems, lighting, sprayers, and cutting machines. The equivalent load needs are shown in Table A1, which reveals that the bulk of the energy is used by agriculture. Most isolated rural areas in India rely on rainfall or irrigation water from neighboring areas for their farming. Rice, maize, sesame, castor, soybean, groundnut, and Kharif vegetables are the primary plants of the Balarbhita that rely heavily on irrigation water. As a result, every load was thoroughly evaluated, taking into account the period of usage. Summer (March–July), monsoon (August–September), and winter (October–February) are the three main seasons in Assam, India. In addition, the electricity demand will grow in the future due to the rapid increase in the number of people.
As a consequence, the regular base load (daily load) on this site was assessed to be 400 kWh, with a 39.87 kW peak load, that is linked to the AC bus in this analysis. Then it was incorporated into HOMER Pro software to construct a somewhat realistic profile for this field by adding randomization for various days and months. The normalized yearly average load of the system is recognized as the acquired base load for real-time systems design. Moreover, the power demand is large throughout the day and lower during nighttime. The water irrigation pump requires the most electricity for agricultural use. So the peak usage period for agriculture occurs throughout the day. Furthermore, since most domestic electrical equipment is used at nighttime, the power demand for residential uses is considerable at night.
3.3 Simulation and optimization
To provide the optimum design and suitable size of its components, HOMER Pro is utilized to model and optimize the structure. Modeling and optimization account for a search space since a hybrid system’s components are of different sizes. There are 750 plans in this search space.
For every plan in the search space, both simulations and optimization processes are performed. To determine if a design is feasible within the specified constraints, the system’s operation is modeled in the simulation section by running the energy stability computation repeatedly for 12 months (8,760 h). The optimization process comes after all simulations, with the aim of each plan being able to reduce the system’s NPC. The HOMER Pro optimizer uses a grid search algorithm to find the most cost-effective solution. The outputs of the feasible plans include element operation outcomes at each time interval, as well as the initial setup cost and system operational cost during the lifespan of the project. Then, lists of possible plans are arranged according to the least NPC, which helps in assessing the feasibility of system design options. A system’s total NPC is the up-to-date value of entire expenditures incurred during its lifespan, subtract by the current value of all income earned over that period (Li et al., 2022). Capital and replacement costs, operational expenditure, oil prices, and pollution penalties are included in the costs incurred. The total NPC is determined by adding all the discount rates for every year of the lifecycle of the project that is denoted in the expression below (Homer Pro Home Page, 2022c).
where
where N represents the number of years and i represents the real discount rate.
3.4 Techno-economic analysis
Parameters such as the LCOE as well as NPC are used in the technical and economic study of the hybrid off-grid system. In addition, each resource’s electricity output and component operating outcomes are examined. The cost-benefit of each plan is computed by comparing the hybrid off-grid system and load profile. As described by HOMER Pro, the levelized COE is the estimated total cost per kWh of useable electricity produced by the hybrid power system. HOMER Pro divides the annual cost of generating energy by the entire useable electricity generation to get at the COE, which is determined as follows (Homer Pro Home Page, 2022d), (Thirunavukkarasu and Sawle, 2020).
where
3.5 Economic parameters
The economic parameters such as annual inflation rate, discount rate, and exchange rate are considered as 5.2%, 10.02%, and 76.74, respectively (CEA, 2020; Ali et al., 2021; Pal and Mukherjee, 2021; Prices and Inflation, 2021; Syahputra and Soesanti, 2021; Ullah et al., 2021; Reserve bank, 2022). The cost data of the components in the project are given in Table 1. The actual data of solar panels, micro-hydro generators, batteries, and bidirectional converters have been collected through various dealers, websites, and some references (Ali et al., 2021; Thirunavukkarasu and Sawle, 2021; Kumar et al., 2022; Loom Solar, 2022; Solar experts, 2022; Syntony solar Madurai, 2022; Thirunavukkarasu and Sawle, 2022; VGM, 2022). The lowest price of the equipment is considered and incorporated into the simulation. The economic variables and other parameters are listed in Table A2. The real annual discount rate is represented by (Eq. 12).
where i′ is the nominal discount rate and f is the expected inflation rate.
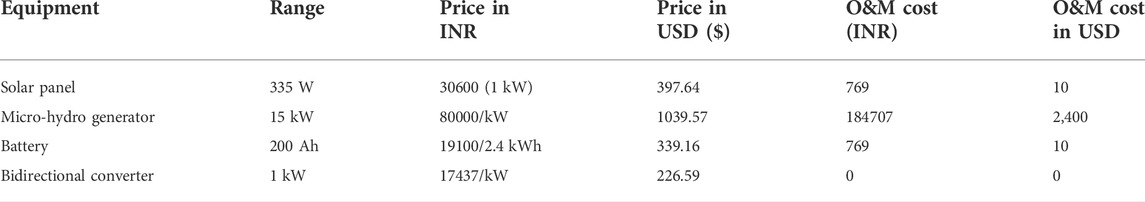
TABLE 1. Cost of the components (Ali et al., 2021), (Reserve bank, 2022).
3.6 Sensitivity analysis
By performing sensitivity analysis, the effects of uncertain variables may be evaluated. The impact of these modifications on the ideal system will also be considered. For every value of the sensitivity parameter, the simulation and optimization process is performed again. Another purpose to perform sensitivity analysis was to create only one suitable analysis of several installations, as well as to give references for communities with comparable circumstances. The influence of specific variables is monitored via sensitivity analysis. To analyze the influence of variables on the system, different values within a narrow range are assigned to all these variables. Table 2 illustrates the sensitivity variables that were evaluated in this investigation.
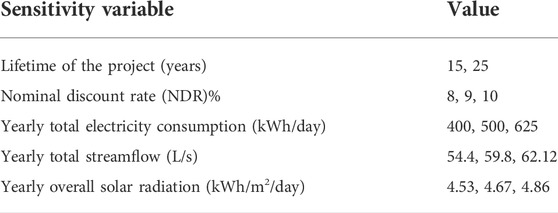
TABLE 2. Sensitivity variables.
Two different lifetimes of the project have been proposed to consider various electrification scenarios such as 15 years which is an optional scenario and 25 years (actual lifetime of the project). The NDR is projected to rise between 8 and 10 percent in future, depending on local circumstances and steady inflation, which gives variants in the financial condition. The load increases in the future are taken into account, as the load demand may vary over time as more appliances are utilized by different types of customers. Hence, the load consumption will increase by 25% of the starting consumption, based on indigenous growth circumstances. The load demand levels stated are 400, 500, and 625 kWh. For the hybrid power system, variables such as solar irradiation as well as streamflow in renewable energy resources are taken into account, which fluctuates in an anticipated sequence from year by year based on a roughly 20-year database. In this study, the average yearly streamflow rate is 50.17 L/s, and radiation from the Sun is 4.67 kWh/m2/day. The yearly streamflow mean values are 54.4, 59.8, and 62.12 L/s, and the yearly average solar irradiance values are 4.53, 4.67, and 4.86 kWh/m2/day, respectively, for sensitivity analysis. The variation limits are determined by the measured variations in hydro and solar resources, as well as the available resources at various places around the village.
4 Result and discussion
The numerical equations, which are formed in Section 2 and Section 3, were used to develop a hybrid system for a research study and the simulation diagram is shown in Figure 6. The 968 cases with hydropower ranging from 9.56 kW to 13.87 kW and solar energy ranging from 0 to 75.21 kWp have been simulated in around less than 14.05 h through HOMER Pro version 3.14. There are 484 cases for optimization exploration and three cases for sensitivity exploration included in this study. Under all conditions, no energy deficiency was tolerated and the original maximum charge status in the battery storage was considered to be 90 and 30 percent of the minimum capacity. The optimization studies have been reviewed in this part, followed by a more extensive explanation of the ideal hybrid system simulation results.
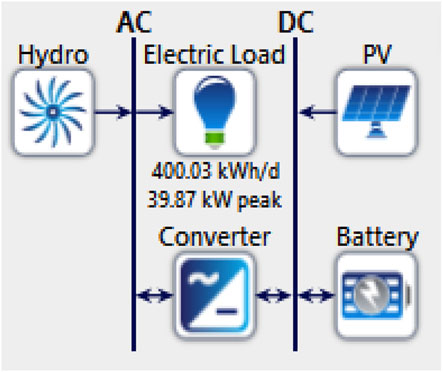
FIGURE 6. Simulation of the hybrid system.
4.1 Optimization results of the hybrid system
The following are the study’s initial simulation conditions: load requirement of 400 kWh/day, yearly average streamflow of 50.25 L/s, yearly solar radiation of 4.67 kWh/m2/day, and period of project 25 years. Two ideal size configurations, PV/hydro/battery, and PV/battery are examined in-depth among the entire possible system designs. Table 3 shows three sections of optimization output; architecture, costs, and system, with every status being the lowermost NPC representation of system design. According to the starting circumstances, the PV/hydro/battery system is the lowest expense of the system topologies, with an NPC of $251597. These setups consist of 118 kW of PV, 11 kW of hydroelectric turbine, 221 generic (standard) 1 kWh of lead–acid batteries, and a system converter with a range of 33.6 kW. The PV/hydro/battery system has NPC, COE, and capital investment costs of $251597, $0.0953/kWh, and $149724, respectively, which are shown in Table 3. On the other hand, PV/battery is the second finest hybrid system after PV/hydro/battery, having NPC, COE, and capital investment costs of $764727, $0.290/kWh, and $508258, respectively. PV/hydro/battery is much less cost-effective than PV/battery owing to the less utilization of battery which raises the initial capital expenses. According to the optimization findings, it could be concluded that PV/hydro/battery and PV/battery are the most cost-effective hybrid systems for powering the Balarbhita community. However, the PV/hydro/battery combination is the most cost-effective alternative.
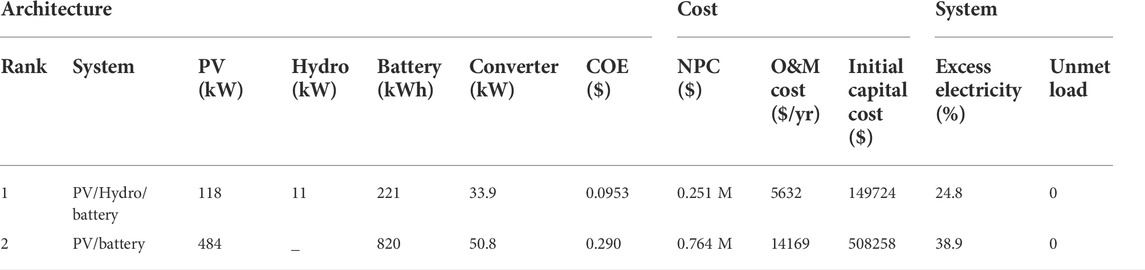
TABLE 3. Optimization result of the hybrid system.
4.2 Optimal hybrid system: Simulation results
According to the results of the aforementioned discussion, it can be discovered that PV-, hydro-, and battery-integrated hybrid power system shall be used for powering the community in various optimization analysis scenarios. Over the year, the hybrid energy system produces 279861 kWh of electricity. Photovoltaic systems contribute about 62.5 percent and micro-hydro turbines for 37.5 percent. Moreover, PV generation is particularly high in the summer, as illustrated in Figure 7C. As a result, PV plants have a greater percentage of this hybrid system than hydropower plants. In dissimilarity, the hydro energy contribution was found to be maximum in the period of June–August. Solar and micro-hydropower generation over various months of the year are shown in Figures 7A,B.
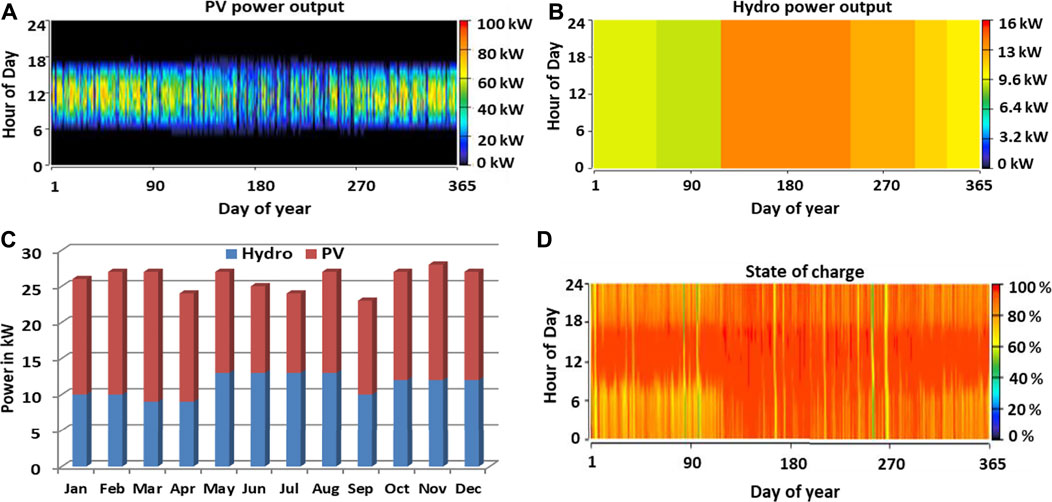
FIGURE 7. (A) Annual solar power production. (B) Annual micro-hydro production. (C) Power production by hybrid system over the annual year. (D) Rainbow profile of battery’s SOC.
The results in Figure 7D demonstrate the storing of energy in the battery bank when excess power is generated by the renewable energy system. This amount of charging value in the battery storage system is often stated as the SOC of the storage system. The SOC was comparatively moderate, as shown by the rainbow profile. The levels between 40 percent and 80 percent (red color) account for about 70 percent of the time for the yearly distribution, reflecting that the battery is completely or almost fully charged for a very long time for the regular distribution. In the afternoon, the battery storage system is normally charged and discharges electricity in the nighttime and early morning. A large discharge rate exists in January–May, resulting from the increased agro load during these months. Therefore, in order to maintain a sustainable and consistent supply of electricity, there should be a sufficient capacity for a battery storage system during those 5 months.
4.3 Sensitivity analysis
The factors mentioned in Table 4 were subjected to a sensitivity analysis. The effects of project lifespan, NDR, and normalized yearly average demand on the selected system with optimization analysis are investigated to evaluate the capabilities of the proposed hybrid system in various situations. Furthermore, NDRs of 8, 9, and 10 percent have been provided, as well as yearly average energy demand levels of 400 kWh, 500 kWh, and 625 kWh also given with solar radiation and streamflow of 4.67 kWh/m2/day and 50.17 L/s, respectively. Two different project lifespans of 15 and 20 years have been chosen for various situations. PV/hydro/battery was found to always be the optimal system design under all conditions. The findings show that the optimal design can handle a wide range of project lifetimes, NDRs, and yearly average energy demands.
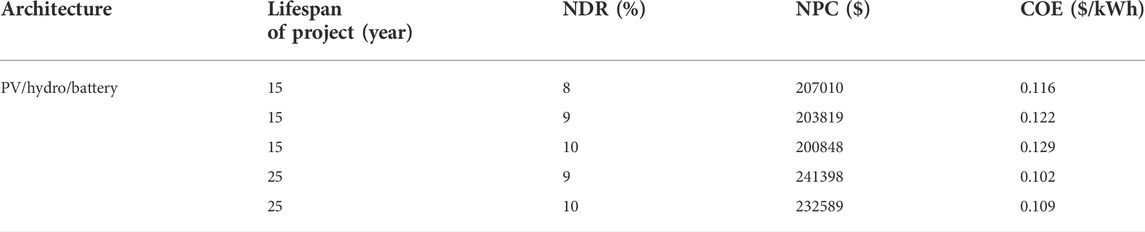
TABLE 4. Impact of NDR and project lifetime on the system.
The LCOE rises between $0.102/kWh and $0.109 kWh when the NDR grows from 9 percent to 10 percent during the lifespan of the project set to be 25 years, but the NPC lowers between $241398 and $232589. As a result, a larger NDR would increase the system’s COE, even after the system’s greater economic viability with a lower NPC. It demonstrates the NDR’s influences on the COE counteract their impacts on the system’s NPC. Projects with such a longer lifespan have a larger NPC and a lesser COE when compared to those with a shorter lifespan and the same NDR. The NPC increases as the operational and maintenance costs as well as costs associated with the replacement of the elements rise over the longer lifetime, while the profits of using a hybrid power system interpret reduced COE. Furthermore, across all situations studied, the PV/hydro/battery combination is more cost-effective than PV/battery. In this analysis, it can be observed that modifications in NDR and the lifespan of the project have little impact on the financial performance of the off-grid hybrid system. The effects of changing the streamflow and solar radiation on the economics of the selected system from optimization analysis are investigated. With the use of optimization surface plots, NPC of solar PV radiation and streamflow of micro-hydro are depicted with COE superimposed shown in Figure 8A, wherein irradiation of solar PV is assessed along the x-axis and streamflow assessed along the y-axis. It can be found from the plot as well as the tabular chart in sensitivity cases that if solar radiation rises from 4.10 kWh/m2/day to 4.90 kWh/m2/day with 50.17 L/s streamflow, overall COE lowers between $0.106/kWh and $0.0950/kWh, but the NPC reduces from $279848 to $250674.
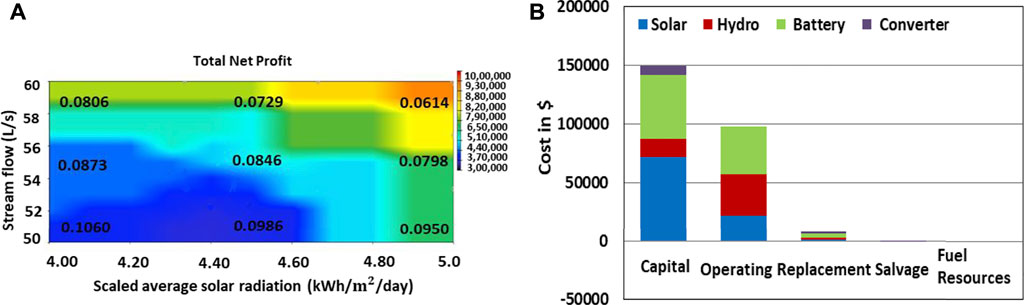
FIGURE 8. (A) Sensitivity analysis: solar size vs. battery string, NDR-8%, project lifetime 25 years. Cost summary of the PV/hydro/battery hybrid system.
The output power from the solar PV panels grows while radiation from the Sun improves, resulting in a reduction in NPC. The system’s LCOE lowers as the total NPC drops. According to the streamflow under constant solar irradiation of 4.67 kWh/m2/day, increasing the streamflow from 50 L/s to 60 L/s lowers the COE from $0.0984/kWh to $0.0729/kWh while also lowering the value of NPC from $259655 to $192384. As a result, increasing the steam flow will lower the system’s COE and NPC. Hence, it can be concluded that when solar radiation and streamflow rise, the hybrid system’s energy efficiency and financial viability improved, with reduced COE and NPC. As a consequence of its sustainability with natural energy supplies, a hybrid PV/hydro/battery-based mode could be more economical compared to other systems. The different cost of the various elements is summarized in Figure 8B. PV is the most initially invested element, followed by batteries, wind turbines, and system converters. The most expensive part of the operation is the hydro turbine. The cost of replacing a hydro turbine is the greatest, followed by a solar PV system. The comparison of the proposed with existing literature is provided in Table A3.
4.4 Hourly energy balance
To analyze the energy equilibrium of the proposed model, a sample of the outcome of the hourly simulation for 24 h on a day in January month is presented in Figure 9. It is clear that accessible PV and micro-hydro output are used first to meet local power needs, and that battery storage is getting charged when the generation of RES surpasses the need for the load. The battery storage system is discharged to generate electricity and therefore meet the net load if a shortage in power supply occurs. This battery energy storage system can be produced to 40 kWh during the unavailability of RES.
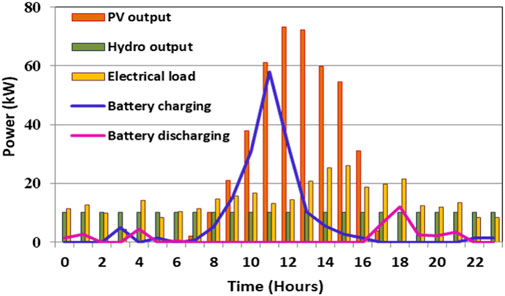
FIGURE 9. Analysis of the energy equilibrium.
5 Conclusion
The project is unique in that it focuses on delivering self-sustaining energy to isolated rural regions while also creating local employment opportunities. The proposed study concentrated on different configuration studies of a variety of unknown characteristics related to system power output and economics of the system. The HOMER Pro analysis focuses on a techno-economic assessment of classified finest hybrid designs that use locally available solar and hydro. According to the findings, the most dependable and cost-effective architecture comprises 118 kW PV/11 kW hydro/261 kWh battery which produces 279861 kWh of electricity to the rural areas at a reasonable COE of $0.0953/kWh in off-grid mode. Here, PV systems contribute about 62.5 percent of power, and micro-hydro turbines for 37.5 percent of power. The second finest hybrid system is PV/battery, which is 484 PV and 820 kWh battery, which holds the COE of $0.290/kWh. PV/hydro/battery is much less cost-effective than PV/battery owing to the less utilization of battery which raises the initial capital expenses.
The research has also been expanded to look at the impact of sensitivity factors such as system load, solar irradiation, streamflow, NDR, and project lifetime on the system NPC and COE. A larger NDR would increase the system’s COE, even after the system’s greater economic viability with a lower NPC. Projects with such a longer lifespan have a larger NPC and a lesser COE when compared to those with a shorter lifespan and the same NDR. Moreover, the electric power generation using PV/hydro/battery does not produce any pollutants throughout its lifespan. However, if diesel generators were to control this remote area, considerable pollution would be produced in the atmosphere, as mentioned in Table 5. It should be noted that if a 100 kW diesel generator is connected instead of a 100% renewable energy system with a minimum load ratio of 75 percent, it will emit pollutants of about 3854 kg per year.
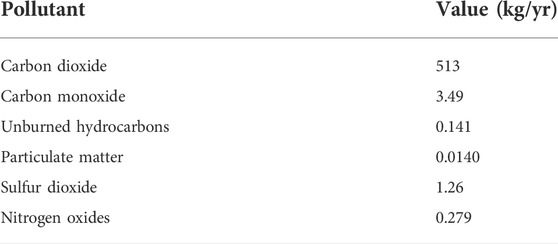
TABLE 5. Pollution emission survey.
Therefore, the proposed system design is an attractive solution for investors in the renewable energy sector. In addition, the Government of India can play a crucial role to eradicate the energy crisis in remote rural parts by implementing the recommended system, which can also be seen as a small step toward the achievement of the renewable energy target of 175 GW by 2022 and 500 GW by 2030. Future research is warranted to expand the energy systems analysis by involving other renewable energy sources, such as geothermal heat or biomass. Furthermore, it is recommended to conduct demand-side management to strengthen the system efficiency and cost. In addition, the recent multi-criteria decision analysis can be utilized to increase the model accuracy.
Data availability statement
The original contributions presented in the study are included in the article/Supplementary Material; further inquiries can be directed to the corresponding author.
Author contributions
Conception and design of study: RS. Modeling, data collection, and simulation: RK. Analysis: RS. Drafting and proof reading: RK and RS. Drafting of the manuscript: RK and RS. Revising the manuscript critically for important intellectual content: RS. Approval of the version of the manuscript to be published (the names of all authors must be listed): RK and RS.
Conflict of interest
The authors declare that the research was conducted in the absence of any commercial or financial relationships that could be construed as a potential conflict of interest.
Publisher’s note
All claims expressed in this article are solely those of the authors and do not necessarily represent those of their affiliated organizations, or those of the publisher, the editors, and the reviewers. Any product that may be evaluated in this article, or claim that may be made by its manufacturer, is not guaranteed or endorsed by the publisher.
References
Alharthi, Y. Z., Siddiki, M. K., and Chaudhry, G. M. (2018). Resource assessment and techno-economic analysis of a grid-connected solar PV-wind hybrid system for different locations in Saudi Arabia. Sustainability 10, 3690. doi:10.3390/su10103690
Ali, F., Ahmar, M., Jiang, Y., and AlAhmad, M. (2021). A techno-economic assessment of hybrid energy systems in rural Pakistan. Energy 215, 119103. doi:10.1016/j.energy.2020.119103
Ali, F., Jiang, Y., and Khan, K. (2017). Feasibility analysis of renewable-based hybrid energy system for the remote community in Pakistan. IEEE Int. Conf. Ind. Eng. Eng. Manag. 8289909, 344–348.
Amutha, W. M., and Rajini, V. (2016). Cost benefit and technical analysis of rural electrification alternatives in southern India using HOMER. Renew. Sustain. Energy Rev. 62, 236–246. doi:10.1016/j.rser.2016.04.042
Ara, S. R., Paul, S., and Rather, Z. H. (2021). Two-level planning approach to analyze techno-economic feasibility of hybrid offshore wind-solar pv power plants. Sustain. Energy Technol. Assessments 47, 101509. doi:10.1016/j.seta.2021.101509
Ashourian, M. H., Cherati, S. M., Mohd Zin, A. A., Niknam, N., Mokhtar, A. S., and Anwari, M. (2013). Optimal green energy management for island resorts in Malaysia. Renew. Energy 51, 36–45. doi:10.1016/j.renene.2012.08.056
Azerefegn, T. M., Bhandari, R., and Ramayya, A. V. (2020). Techno-economic analysis of grid-integrated PV/wind systems for electricity reliability enhancement in Ethiopian industrial park. Sustain. Cities Soc. 53, 101915. doi:10.1016/j.scs.2019.101915
Bagheri, M., Shirzadi, N., Bazdar, E., and Kennedy, C. A. (2018). Optimal planning of hybrid renewable energy infrastructure for urban sustainability: Green Vancouver. Renew. Sustain. Energy Rev. 95, 254–264. doi:10.1016/j.rser.2018.07.037
Banerjee, S. G., Barnes, D., Singh, B., Mayer, K., and Samad, H. (2014). Power for all: Electricity access challenge in India, 18–112.
Caparrós Mancera, J. J., Saenz, J. L., Lopez, E., Andujar, J. M., Segura Manzano, F., Vivas, F. J., et al. (2022). Experimental analysis of the effects of supercapacitor banks in a renewable DC microgrid. Appl. Energy 308, 118355. doi:10.1016/j.apenergy.2021.118355
CEA (2020). Report on optimal generation capacity mix for 2029-30. Ministry of Power, Government of India. Available at: https://cea.nic.in/wp-content/uploads/irp/2020/12/Optimal_mix_report_2029-30_FINAL.pdf (accessed April 30, 2022).
Chmiel, Z., and Bhattacharyya, S. C. (2015). Analysis of off-grid electricity system at isle of eigg (scotland): Lessons for developing countries. Renew. Energy 81, 578–588. doi:10.1016/j.renene.2015.03.061
Cicowiez, M., Akinyemi, O., Sesan, T., Adu, O., and Sokeye, B. (2022). Gender-differentiated impacts of a rural electrification policy in Nigeria. Energy Policy 162, 112774. doi:10.1016/j.enpol.2021.112774
Dallavalle, E., Cipolletta, M., Casson Moreno, V., Cozzani, V., and Zanuttigh, B. (2021). Towards green transition of touristic islands through hybrid renewable energy systems. A case study in Tenerife, Canary Islands. Renew. Energy 174, 426–443. doi:10.1016/j.renene.2021.04.044
Das, B. K., Alotaibi, M. A., Das, P., Islam, M. S., Das, S. K., and Hossain, M. A. (2021). Feasibility and techno-economic analysis of stand-alone and grid-connected PV/Wind/Diesel/Batt hybrid energy system: A case study. Energy strategy. Energy Strategy Rev. 37, 100673. doi:10.1016/j.esr.2021.100673
Das, B. K., and Zaman, F. (2018). Performance analysis of a PV/Diesel hybrid system for a remote area in Bangladesh: Effects of dispatch strategies, batteries, and generator selection. Energy 169, 263–276. doi:10.1016/j.energy.2018.12.014
Debouza, M., Al-Durra, A., El-Fouly, T. H. M., and Zeineldin, H. H. (2022). Survey on microgrids with flexible boundaries: Strategies, applications, and future trends. Electr. Power Syst. Res. 205, 107765. doi:10.1016/j.epsr.2021.107765
Dong, H., Guo, J. e., Liu, J., Meng, T., Li, M., Chen, X., et al. (2021). Energy generation and storing electrical energy in an energy hybrid system consisting of solar thermal collector, Stirling engine, and thermoelectric generator. Sustain. Cities Soc. 75, 103357. doi:10.1016/j.scs.2021.103357
Duman, A. C., and Güler, Ö. (2018). Techno-economic analysis of off-grid PV/wind/fuel cell hybrid system combinations with a comparison of regularly and seasonally occupied households. Sustain. Cities Soc. 42, 107–126. doi:10.1016/j.scs.2018.06.029
Fadhil, N. A., Elmnifi, M., Abdulrazig, O. D. H., and Habeeb, L. J. (2021). Design and modeling of hybrid photovoltaic micro-hydro power for Al-bakur road lighting: A case study. Mat. Today Proc. 49, 2851–2857.
Gabriel, L. F. G., Ruiz-Cruz, R., Coss y Leon Monterde, H. J., Zúñiga-Grajeda, V., Gurubel-Tun, K. J., and Coronado-Mendoza, A. (2022). Optimizing the penetration of standalone microgrid, incorporating demand side management as a guiding principle. Energy Rep. 8, 2712–2725. doi:10.1016/j.egyr.2022.01.192
Hafeznia, H., Aslani, A., Anwar, S., and Yousef jamali, M. (2016). Analysis of the effectiveness of national renewable energy policies: A case of photovoltaic policies. Renew. Sustain. Energy Rev. 79, 669–680. doi:10.1016/j.rser.2017.05.033
Homer Pro Home Page (2022). Homer Pro home page. Available at: https://www.homerenergy.com/products/pro/docs/latest/how_homer_calculates_the_pv array_power_output.html (accessed May 04, 2022).
Homer Pro Home Page (2022). Homer Pro home page. Available at: https://www.homerenergy.com/products/pro/docs/latest/nominal_hydro_power.html (accessed May 04, 2022).
Homer Pro Home Page (2022). Homer Pro home page. Available at: https://www.homerenergy.com/products/pro/docs/latest/net_present_cost.html (accessed May 04, 2022).
Homer Pro Home Page (2022). Homer Pro home page. Available at: https://www.homerenergy.com/products/pro/docs/latest/levelized_cost_of_energy.html (accessed May 04, 2022).
International Energy Agency (2022). World energy outlook 2020 - event - IEA. Available at: https://www.iea.org/reports/sdg7-data-and-projections/access-to-electricity (accessed January 03, 2022).
Kanna, R. R., Baranidharan, M., Singh, R. R., and Indragandhi, V. (2020). “Solar energy application in Indian irrigation system,” in IOP Conference Series: Materials Science and Engineering (IOP Publishing), 937, 012016.
Kannan, D. A. S., Thummala, S., and Mouli Chandra, D. (2021). Cost optimization of micro-grid of renewable energy resources connected with and without utility grid. Mat. Today Proc. 12, 282–291. doi:10.17762/turcomat.v12i4.506
Kolhe, M. L., Ranaweera, K. M. I. U., and Gunawardana, A. G. B. S. (2015). Techno-economic sizing of off-grid hybrid renewable energy system for rural electrification in Sri Lanka. Sustain. Energy Technol. Assessments 11, 53–64. doi:10.1016/j.seta.2015.03.008
Kumar, P., Pal, N., and Sharma, H. (2022). Optimization and techno-economic analysis of a solar photo-voltaic/biomass/diesel/battery hybrid off-grid power generation system for rural remote electrification in eastern India. Energy 247, 123560. doi:10.1016/j.energy.2022.123560
Li, J., Liu, P., and Li, Z. (2022). Optimal design and techno-economic analysis of a hybrid renewable energy system for off-grid power supply and hydrogen production: A case study of west China. Chem. Eng. Res. Des. 177, 604–614. doi:10.1016/j.cherd.2021.11.014
Loom Solar (2022). Loom solar home page. Available at: https://www.loomsolar.com/pages/contact (accessed May 3, 2022).
Lozano, L., Querikiol, E. M., Abundo, M. L. S., and Bellotindos, L. M. (2019). Techno-economic analysis of a cost-effective power generation system for off-grid island communities: A case study of gilutongan island, cordova, cebu, Philippines. Renew. Energy 140, 905–911. doi:10.1016/j.renene.2019.03.124
Micangeli, A., Del Citto, R., Kiva, I. N., Santori, S. G., Gambino, V., Kiplagat, J., et al. (2017). Energy production analysis and optimization of mini-grid in remote areas: The case study of Habaswein, Kenya. Energies 10 (12), 2041. doi:10.3390/en10122041
Mishra, M., Patnaik, B., Biswal, M., Hasan, S., and Bansal, R. C. (2022). A systematic review on DC-microgrid protection and grounding techniques: Issues, challenges, and future perspective. Appl. Energy 313, 118810. doi:10.1016/j.apenergy.2022.118810
Mohammadi, K., Naderi, M., and Saghafifar, M. (2018). Economic feasibility of developing grid-connected photovoltaic plants in the southern coast of Iran. Energy 156, 17–31. doi:10.1016/j.energy.2018.05.065
Naik, K. R., Rajpathak, B., Mitra, A., Sadanala, C., and Kolhe, M. L. (2022). Power management scheme of DC micro-grid integrated with photovoltaic-Battery–Micro-hydro power plant. J. Power Sources 525, 230988. doi:10.1016/j.jpowsour.2022.230988
Odou, O. D. T., Bhandari, R., and Adamou, R. (2020). Hybrid off-grid renewable power system for sustainable rural electrification in Benin. Renew. Energy 145, 1266–1279. doi:10.1016/j.renene.2019.06.032
Ouedraogo, B. I., Kouame, S., Azoumah, Y., and Yamegueu, D. (2015). Incentives for rural off-grid electrification in Burkina Faso using LCOE. Renew. Energy 78, 573–582. doi:10.1016/j.renene.2015.01.044
Padrón, I., Avila, D., Marichal, G. N., and Rodríguez, J. A. (20182019). Assessment of hybrid renewable energy systems to supplied energy to autonomous desalination systems in two islands of the canary archipelago. Renew. Sustain. Energy Rev. 101, 221–230. doi:10.1016/j.rser.2018.11.009
Pal, P., and Mukherjee, V. (2021). Off-grid solar photovoltaic/hydrogen fuel cell system for renewable energy generation: An investigation based on techno-economic feasibility assessment for the application of end-user load demand in North-East India. Renew. Sustain. Energy Rev. 149, 111421. doi:10.1016/j.rser.2021.111421
Petroleum Planning (2022). Petroleum planning &analysis cell home page. Available at: https://www.ppac.gov.in/ (accessed May 02, 2022).
Pillai, A. M. (2020). “Advancement of inventive solar power based frameworks for rural India,” in IOP Conference Series: Materials Science and Engineering (IOP Publishing), 906, 012001.
Power Data Access (2022). Power data access viewer home page. Available at: https://power.larc.nasa.gov/data-access-viewer/ (accessed May 04, 2022).
Prices and Inflation (2021). Prices and inflation, 22. Available at: https://www.indiabudget.gov.in/economicsurvey/doc/eschapter/echap05.pdf (accessed April 30, 2022).
Rashid, F., Hoque, M. E., Aziz, M., Sakib, T. N., Islam, M. T., and Robin, R. M. (2021). Investigation of optimal hybrid energy systems using available energy sources in a rural area of Bangladesh. Energies 14, 14185794. doi:10.3390/en14185794
Reserve bank (2022). Reserve bank of India Home page. Available at: https://www.rbi.org.in/scripts/ReferenceRateArchive.aspx (accessed May 02, 2022).
Salameh, T., Abdelkareem, M. A., Olabi, A. G., Sayed, E. T., Al-Chaderchi, M., and Rezk, H. (2021). Integrated standalone hybrid solar PV, fuel cell, and diesel generator power system for battery or supercapacitor storage systems in Khorfakkan, United Arab Emirates. Int. J. Hydrogen Energy 46, 6014–6027. doi:10.1016/j.ijhydene.2020.08.153
Sami, I., Ullah, N., Muyeen, S. M., Techato, K., Chowdhury, S., Ro, J. S., et al. (2020). Control methods for standalone and grid connected micro-hydro power plants with synthetic inertia frequency support: A comprehensive review. IEEE Access 8, 176313–176329. doi:10.1109/access.2020.3026492
Sawle, Y., Gupta, S. C., and Bohre, A. K. (2018). Review of hybrid renewable energy systems with comparative analysis of off-grid hybrid systems. Renew. Sustain. Energy Rev. 81 (Part 2), 2217–2235.
Sawle, Y., Gupta, S. C., and Bohre, A. K. (2016). PV-wind hybrid system: A review with case study. Cogent Eng. 3 (1). doi:10.1080/23311916.2016.1189305
Sawle, Y., Jain, S., Babu, S., Nair, A. R., and Khan, B. (2021). Prefeasibility economic and sensitivity assessment of hybrid renewable energy system. IEEE Access 9, 28260–28271.
Sharma, N., Garg, R. D., Sarkar, A., Akhtar, P., and Kumar, N. (2012). Study of Brahmaputra river erosion and its control. India: Indian Institute of Technology Roorkee. Natl. Audit Violence 2003-2005.
Singh, S., Kanwar, N., Zindani, D., and Jadoun, V. K. (2022). Decision-making approach for assessing the suitable hybrid renewable energy-based microgrid system for rural electrification in India. Mater. Today Proc. 51, 21–25. doi:10.1016/j.matpr.2021.04.186
Solar experts (2022). Haryana home page. Available at: https://www.solarexpertsindia.com/solar-battery-ah-price-charger/ (accessed May 3, 2022).
Stevanato, N., Corigliano, S., Petrelli, M., Tonini, F., Merlo, M., and Colombo, E. (2021). Rural areas electrification strategies through shadow costs analysis - Bolivian Highlands case study. Energy sustain. Dev. 65, 162–174. doi:10.1016/j.esd.2021.10.009
Syahputra, R., and Soesanti, I. (2021). Renewable energy systems based on micro-hydro and solar photovoltaic for rural areas: A case study in Yogyakarta, Indonesia. Energy Rep. 7, 472–490. doi:10.1016/j.egyr.2021.01.015
Syntony solar Madurai (2022). Syntony solar Madurai. (Abundant energy on your roof) home page. Available at: www.syntonysolar.com (accessed April 30, 2022).
Thirunavukkarasu, M., and Sawle, Y. (2021). A comparative study of the optimal sizing and management of off-grid solar/wind/diesel and battery energy systems for remote areas. Front. Energy Res. 9, 752043. doi:10.3389/fenrg.2021.752043
Thirunavukkarasu, M., and Sawle, Y. (2022). An examination of the techno-economic viability of hybrid grid-integrated and stand-alone generation systems for an Indian tea plant. Front. Energy Res. 10, 806870. doi:10.3389/fenrg.2022.806870
Thirunavukkarasu, M., and Sawle, Y. (2020). Design, analysis, and optimal sizing of standalone PV/diesel/battery hybrid energy system using HOMER. IOP Conf. Ser. Mat. Sci. Eng. 937, 012034. doi:10.1088/1757-899x/937/1/012034
Ullah, Z., Elkadeem, M. R., Kotb, K. M., Taha, I. B. M., and Wang, S. (2021). Multi-criteria decision-making model for optimal planning of on/off grid hybrid solar, wind, hydro, biomass clean electricity supply. Renew. Energy 179, 885–910. doi:10.1016/j.renene.2021.07.063
United Nations (2022). Home page (sustainable Development goals). Available at: https://www.un.org/sustainabledevelopment/energy/ (accessed May 03, 2022).
VGM (2022). VGM engineers coimbatore(indiamart) home page. Available at: https://www.indiamart.com/vgmengineers/(accessed May 3, 2022).
Vinicius, G. T. F., Silvia, C., Aleksandar, D., Massimo, B., and Marco, M. (2021). Rural electrification planning based on graph theory and geospatial data: A realistic topology oriented approach. Sustain. Energy Grids Netw. 28, 100525. doi:10.1016/j.segan.2021.100525
Wang, Z., Wang, L., Li, Z., Cheng, X., and Li, Q. (2021). Optimal distributed transaction of multiple microgrids in grid-connected and islanded modes considering unit commitment scheme. Int. J. Electr. Power & Energy Syst. 132, 107146. doi:10.1016/j.ijepes.2021.107146
Glossary
Nomenclature
Appendix
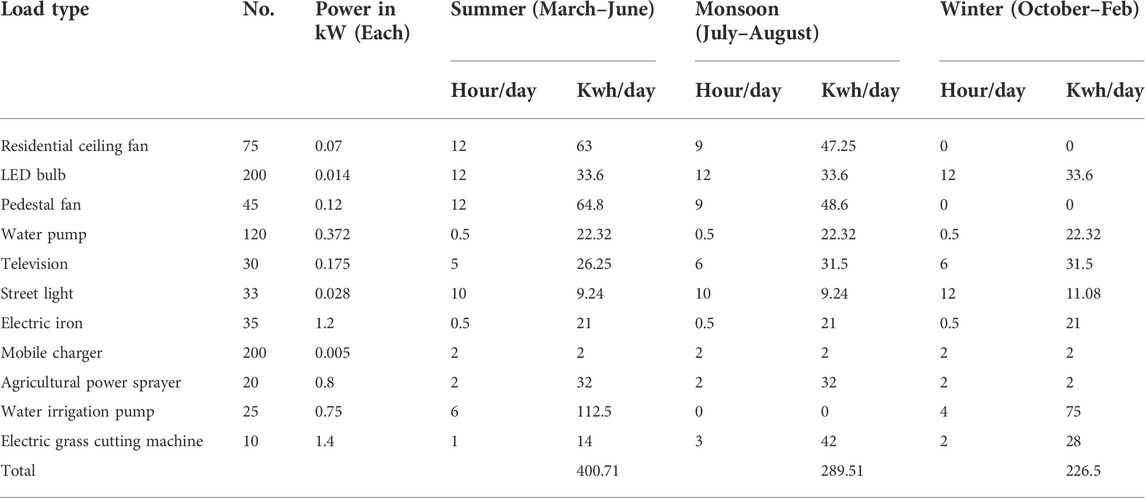
TABLE A1. Real-time village load
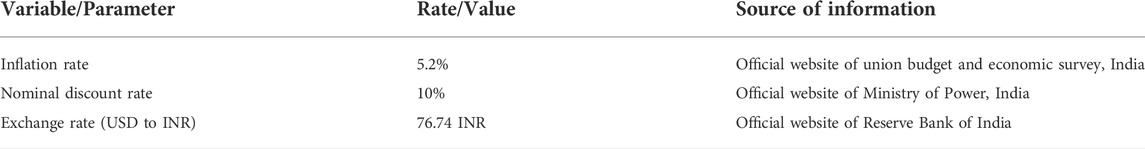
TABLE A2. Economic variables and other parameters (Ali et al., 2017)
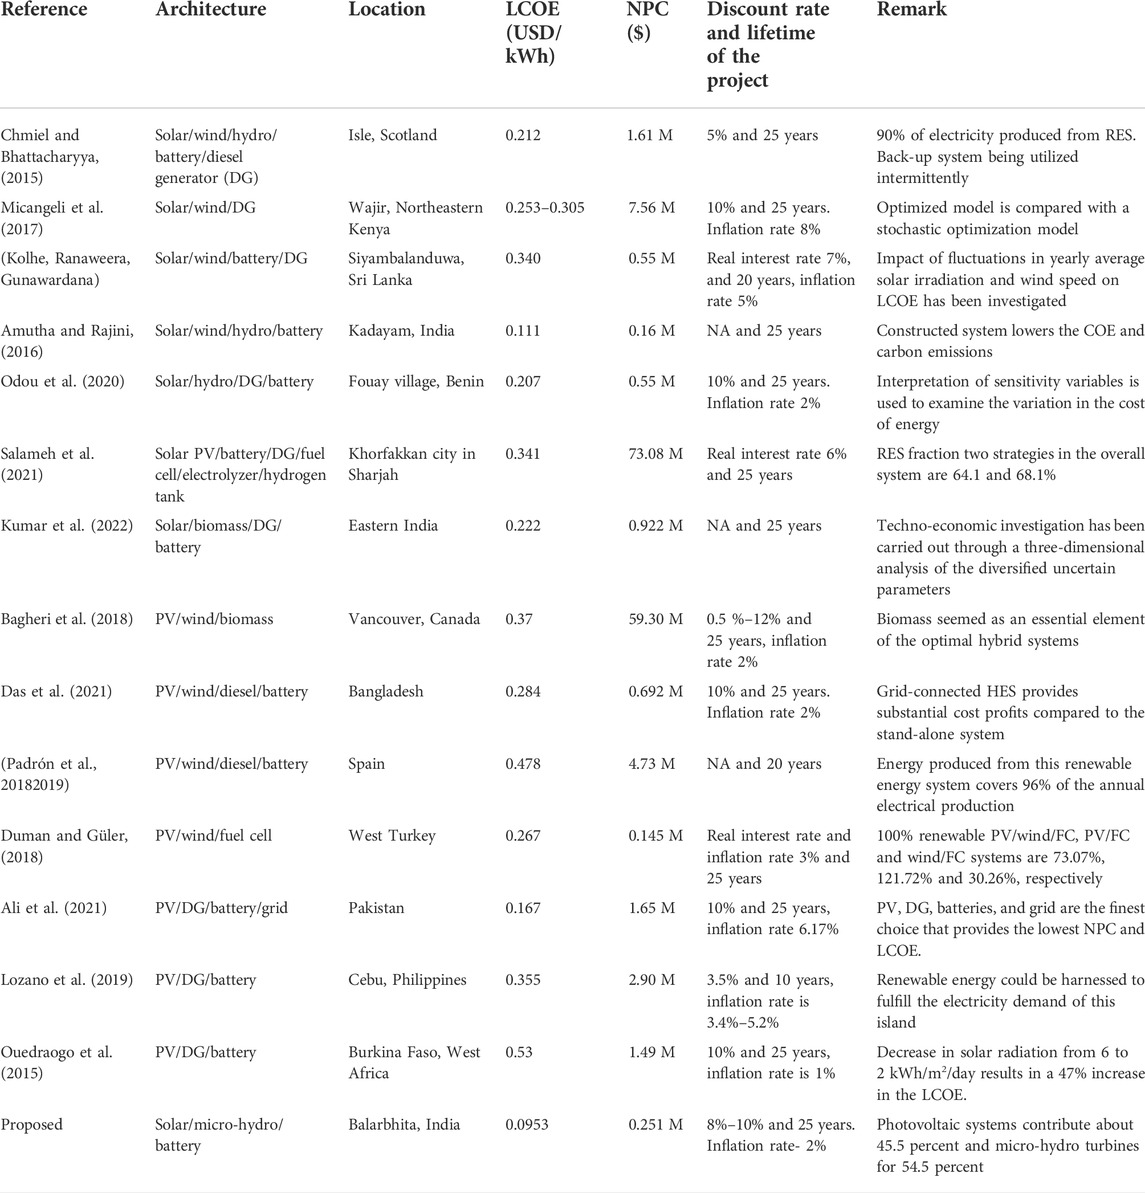
TABLE A3. Comparison of the proposed system with existing literature
Keywords: rural electrification, hybrid energy system, microgrid, optimization, HOMER Pro, feasibility study
Citation: Kanna RR and Singh RR (2022) A feasibility study on Balarbhita for advancing rural electrification with a solar—Micro-hydro hybrid system. Front. Energy Res. 10:960045. doi: 10.3389/fenrg.2022.960045
Received: 02 June 2022; Accepted: 29 July 2022;
Published: 12 September 2022.
Edited by:
Yashwant Sawle, Madhav Institute of Technology and Science Gwalior, IndiaReviewed by:
Olatunde Dahunsi, Bowen University, NigeriaAashish Kumar Bohre, National Institute of Technology, Durgapur, India
Copyright © 2022 Kanna and Singh. This is an open-access article distributed under the terms of the Creative Commons Attribution License (CC BY). The use, distribution or reproduction in other forums is permitted, provided the original author(s) and the copyright owner(s) are credited and that the original publication in this journal is cited, in accordance with accepted academic practice. No use, distribution or reproduction is permitted which does not comply with these terms.
*Correspondence: R. Raja Singh, rrajasingh@gmail.com