Combining real-time fluorescence spectroscopy and flow cytometry to reveal new insights in DOC and cell characterization of drinking water
 Jonas Schuster
 Johanna Huber1
  Mathias Ernst
- 1Institute of Water Resources and Water Supply, Hamburg University of Technology, Hamburg, Germany
- 2DVGW Research Center TUHH, Hamburg University of Technology, Hamburg, Germany
Sudden changes in drinking water quality can cause harmful consequences for end users. Thus, real-time monitoring of drinking water quality can allow early warning and provide crucial gains for securing safe water distribution. This study investigated the advantages of simultaneous real-time measuring of flow cytometry and fluorescence spectroscopy. A contamination event was investigated in a laboratory-scale analysis by spiking drinking water samples with organic nutrients. Flow cytometric data were analyzed by creating fingerprints based on differentiation into high and low nucleic acid cells (HNA/LNA). The detailed characterization of these data showed that an increase in HNA cells indicated an increase in the bacterial growth potential even before actual TCC increases. The fluorescence data was decomposed via the PARAFAC method to reveal seven fluorescent components. Three aromatic protein-like components were associated with the microbiological condition of the drinking water cells; namely, Components 4 (λEx = 279 nm, λEm = 351 nm), 6 (λEx = 279 nm, λEm = 332 nm), and 7 (λEx = 276 nm, λEm = 302 nm). Component 6 was identified as a possible organic variable for appropriate monitoring of TCC, whereas Components 4 and 7 were identified as organic compounds representing nutrients for organisms present in drinking water. Overall, combining both methods for real-time monitoring can be a powerful tool to guarantee drinking water quality.
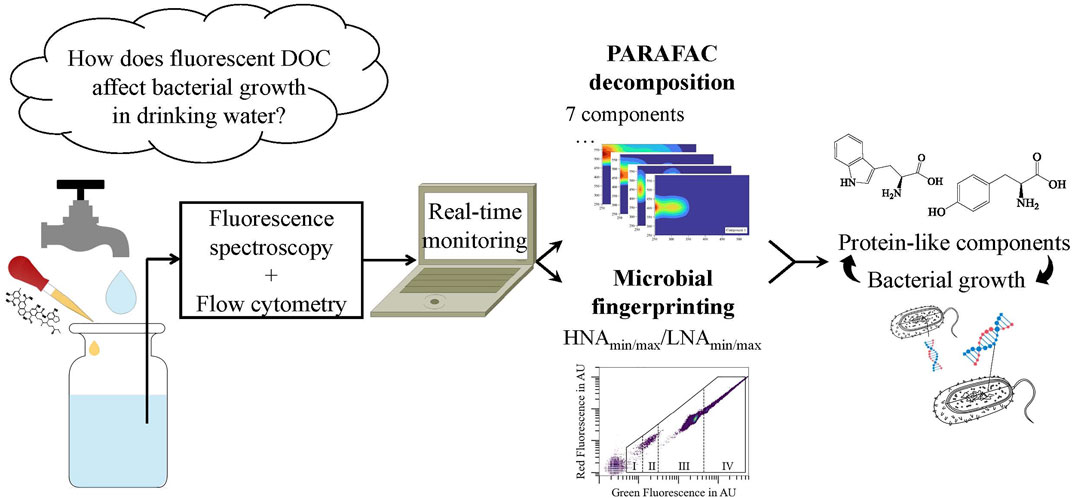
GRAPHICAL ABSTRACT
1 Introduction
Guaranteeing high drinking water quality after treatment and within the water distribution system (WDS) is essential to ensure public health. Ashbolt et al. (2014) reported that illnesses from drinking water mainly occur due to the presence of containing microbiological pathogens such as bacteria, protozoa, and viruses. Furthermore, recent studies have also reported the relationship between microorganisms and dissolved organic matter (DOM) (Camper et al., 2003; Sillanpää, 2014). Therefore, there is a crucial need for an early warning system for evolving microbiological or organic contamination, particularly the real-time monitoring of water quality parameters after water treatment and in critical sections within the WDS.
Flow cytometry is a proven method of evaluating total cell count (TCC) and nucleic acid viability and amount in bacterial cells (Macey, 2007; Prest et al., 2013; Schönher et al., 2021). Community characterization in a liquid medium is often performed through the discrimination of cells with high nucleic acid content (HNA) and low nucleic acid content (LNA) (Wang et al., 2010). Several studies have demonstrated the use of flow cytometry for real-time monitoring of TCC, HNA, and LNA (Hammes et al., 2012; Jie et al., 2017). Moreover, studies have reported the identification of chlorine disinfection characteristics in drinking water via flow cytometry (Gillespie et al., 2014; Cheswick et al., 2020; Mao et al., 2021) or exhaustive differentiation between pathogens and harmless drinking water bacteria (Vital et al., 2012; Al-Sabi et al., 2015). Other studies have investigated the interdependencies between TCC and shifts between HNA and LNA cells and specific events (day- and nighttime, e.g.) (Besmer et al., 2014) or monitored changes in TCC between several steps of the water treatment process (Buysschaert et al., 2018). Although flow cytometric methods have been applied, data evaluation remains challenging and is not yet standardized (Safford and Bischel, 2019). The general standardization of the data post-processing is driven by current studies. Therefore, microbiological fingerprinting methods have been developed by applying gate-independent evaluation tools (Rogers and Holyst, 2009; Rubbens and Props, 2021). Moreover, several promising python and R-based toolkits have been developed to facilitate evaluation and allow comparability between different flow cytometric devices (Ross, 2021; Heins et al., 2022).
Apart from bacteria, the amount of DOM (equivalent to DOC, dissolved organic carbon) plays a crucial role in drinking water quality. The usual challenges are the formation of disinfection by-products (Ding et al., 2019), inconveniences due to taste and odor (Li et al., 2020), and the occurrence of membrane fouling (Al-Amoudi, 2010) and its microbial impact (Weinrich et al., 2010). Regarding DOC as potential bacterial substrates, the amount of assimilable organic carbon (AOC) plays a crucial role in drinking water analysis in non-disinfected WDS. AOC describes the proportion of DOC that can be easily biodegraded by microorganisms (Van der Kooij et al., 1982). Thus, even though it comprises 0.1%–9% of the DOC in drinking water, AOC is among the most important parameters for determining the microbiological stability of drinking water in non-disinfected WDS (Van der Kooij, 2003; Yu et al., 2011; Wang et al., 2014).
Regarding the characterization of DOC in the steps of drinking water treatment, size-exclusion chromatography is an expedient but expensive and slow method (Baghoth et al., 2011; Brezinski and Gorczyca, 2019). The search for a faster and more sensitive method led to the development of DOC characterization via fluorescence spectroscopy (Korshin, Sgroi, and Ratnaweera, 2018; Carstea et al., 2020). The correlations between particular fluorescent components and water DOC level have been reported (Johnstone et al., 2009; Shutova et al., 2014). Further successful applications of fluorescence spectroscopy, such as the effects of bacterial coagulation in drinking water (Ma et al., 2018), DOM adsorption on activated carbon and nanotubes (Shimizu et al., 2018), the influence of organic molecules within a membrane process (Meng et al., 2011), and pH effects on DOM in freshwater (Spencer et al., 2007) illustrate the wide range of application of this method for the analysis of drinking water.
In general, fluorescence spectroscopy generates an excitation-emission matrix (EEM), with up to tens of thousands of excitation (λEx) and emission (λEm) wavelength pairs. Since Coble (1996) described the correlation between the appearance of λEx/λEm peak regions and samples containing humic-like and protein-like substances, methods for the use of fluorescence spectroscopy for the characterization of DOM have improved continuously. However, the data analysis method referred to as peak picking interpretation has limitations in the quantitative analysis of eventual overlapping peak regions. Therefore, the parallel factor analysis (PARAFAC) method was introduced by Andersen and Bro (2003) and Stedmon et al. (2003), which uses a least square model approach to identify several fluorescent components of DOM in natural water sources. The PARAFAC method enables the identification and characterization of several peak regions by decomposing the generated EEM. Subsequently, PARAFAC has been adapted and improved as a sustainable method for fluorescent data treatment and evaluation (Stedmon and Bro, 2008; Murphy et al., 2013; Wünsch and Murphy, 2021). Besides the appearance and the position (λEx/λEm) of the identified fluorescent components, the respective intensities can now also be determined.
PARAFAC modeling had been widely applied to evaluate the steps of drinking water treatment (Yang et al., 2015). Xu et al. (2021) demonstrated the advantages of this modeling for characterizing the types and sources of DOM that affect the formation of disinfection by-products. Sorensen et al. (2018) initially presented an approach for monitoring the correlation between fluorescent DOM and TCC and Escherichia coli by applying a two-component PARAFAC model. However, according to Heibati et al. (2017), studies about characterizing drinking water quality via fluorescence spectroscopy within a WDS are very few and need further investigations.
The present study demonstrated the detailed simultaneous real-time fingerprinting of drinking water via flow cytometry and fluorescence spectroscopy. By spiking samples with organic nutrients, microbial growth was simulated to monitor the changes and correlations between flow cytometry and fluorescence spectroscopy. The spiked nutrients were selected due to their fluorescent properties. Applying an appropriate seven-component PARAFAC model provided insights into the influence of DOM on microbial conditions. This PARAFAC model can be used for future investigations of a broader range of tap water sources. Additionally, this study also presents the advantages of detailed TCC gating for the early detection of bacterial growth.
2 Materials and methods
2.1 Samples
Tap water samples were collected at the Hamburg University of Technology (11°C, pH = 8.2, conductivity = 227 μS/cm. After 2 min of flushing the tap, the water was sampled in autoclaved glass bottles and immediately used in the respective experiments. The tap water samples showed an initial total cell count (TCC) of approximately
This study investigated six tap water samples with increasing concentrations of LB medium: S1—tap water, S2—tap water + vol% 0.001 LB medium, S3—tap water + vol% 0.007 LB medium, S4—tap water + vol% 0.014 LB medium, S5—tap water + vol% 0.029 LB medium, and S6—tap water + vol% 0.043 LB medium.
2.2 Experimental setup
Figure 1 shows the scheme of the laboratory setup in this study, which allowed the simultaneous investigation of three different water samples. Thus, two experiments were run successively (samples S1–S3 and S4–S6). Automatic sampling was conducted every 90 min (flow cytometry) and every 180 min (fluorescence spectroscopy). In between, the tubes and cuvettes were disinfected, quenched, and rinsed with sodium hypochlorite and sodium thiosulfate solutions as well as with ultrapure water. The duration of all experiments was 70 h, while stirring the samples at 200 rpm. All experiments were performed at room temperature (25 ± 1°C). The first measurement of each experiment was used to generate individual microbiological and organic fingerprints of both the tap water and the organic LB medium. In addition to the continuous monitoring by flow cytometry and fluorescence spectroscopy, a detailed characterization of the containing organic carbon was conducted by LC-OCD and TOC analysis before and after the experiments.
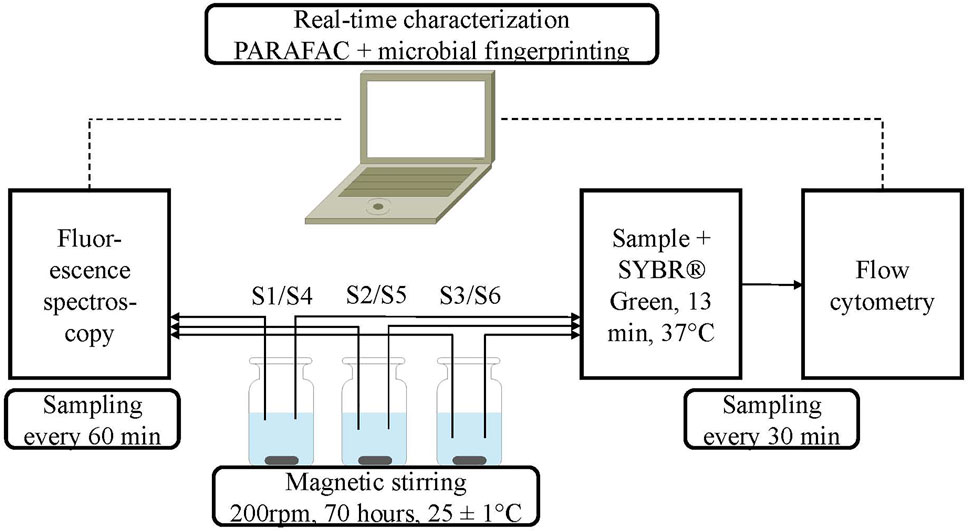
FIGURE 1. Flow scheme of the real-time characterization setup via fluorescence spectroscopy and flow cytometry, which enables the simultaneous analysis of three different samples.
2.3 Flow cytometry
The flow cytometric analysis in this study was performed on a CyFlow™ Cube 6 V2 device (Sysmex, Germany) equipped with a 60 mW blue diode laser at a rigid wavelength of 488 nm. The detectors included non-fluorescent and fluorescent signal detectors. Non-fluorescent signals were detected by forward (FSC) and sideward (SSC) scatter detectors. The FI1 and FI3 detectors detected light emitted at specific wavelengths of 536 ± 40 nm (green) and >630 nm (red), respectively. As described by Ho et al. (2020) the flow cytometer was calibrated using the integrated CyView™ software using fluorescent 3 µm calibration beads (Sysmex), mineral water, and sterile filtered mineral water (evian®). For the real-time monitoring analysis, the flow cytometer was connected to the onCyt™ OC-300 automation add-on (OC300, onCyt Microbiology AG, Switzerland), which conducted sampling, mixing, and incubation (37°C, 13 min) with SYBR® Green I (SIGMA-ALDRICH®) (Dragan et al., 2012).
Between sample measurements, disinfectant cleaning solutions were applied, including disinfectant sodium hypochlorite (approximately 1% active chlorine) and sodium thiosulfate (50 mM) quenching solutions.
The flow cytometric data was proceeded by integrated analysis software onCyt™ cyPlot, as well as the python toolkit FlowKit version 0.8.2 compiled by White et al. (2021). The latter was especially utilized for detailed fingerprinting tools. Based on various studies, the TCC gate was set by utilizing evian® as an external standard for bacterial cells (Ho et al., 2020). All signals detected within this TCC gate were counted to generate the respective bacterial concentration. The distinction between high nucleic acid (HNA) and low nucleic acid (LNA) cells and the position of their respective gates was also performed using evian®. For detailed microbial fingerprinting, further sectioning was applied by dividing the HNA and LNA cells into minimum (min) and maximum (max) gates.
2.4 Fluorescence spectroscopy and PARAFAC methodology
The fluorescence spectroscopic measurements in this study were performed using an Aqualog® fluorometer (HORIBA, Japan). Without pre-treatment, the samples were automatically injected into a 10 mm flow cuvette (Helma GmbH, Germany). The measurement was initialized via external triggering of the Aqualog®. During analysis, the water sample was exposed to monochromatic light with excitation wavelengths (λEx) from 200 to 600 nm in 3-nm increments. The fluorescently emitted light (λEm) was detected at 212–619 nm.
Fluorescence spectroscopic data were analyzed using the PARAFAC multi-way decomposition method (Murphy et al., 2013) in drEEM (decomposition routines for excitation and emission matrices) toolbox version 0.6.3 for MATLAB version R2021a. This toolbox perfoms post-treatment and correction of all data, known as inner-filter effects, as well as Raman and Rayleigh scattering. The mathematical decomposition of the PARAFAC model is based on Eq. 1:
In Eq. 1,
• Evaluation of the respective residues of each sample
• Random initialization of the x-component model by applying nonnegativity constraint
• Evaluation of the spectral properties of each x-component model
• Split-half-analysis by splitting the dataset into three separate datasets of equal sizes
2.5 Total-, dissolved- and assimilable organic carbon
Total organic carbon (TOC) was determined using a TOC-analyzer (Shimadzu, Japan). Regarding a more specific organic carbon characterization, size exclusion liquid chromatography (LC) was used in combination with an organic carbon detector (OCD) and UV detector (UVD) (LC-OCD-UVD, DOC Labor Dr. Huber, Germany). All analyses were performed as described by Huber et al. (2011). Additional standard analyses such as monitoring of pH, temperature, and conductivity were conducted using a MultiLine® Multi 3630 IDS.
Assimilable organic carbon (AOC) was analyzed based on Hammes and Egli (2005) and (Van der Kooij, 2003). Briefly, AOC was determined as the difference between the maximum TCC (TCCmax) and the initial TCC (TCCinitial) of a water sample in an aerobic biotest for up to 28 days. An expression for the AOC is given in Eq. 2. This equation was applied by replacing the parameters with TCC0 and TCCend monitored at the beginning and end of the real-time monitoring experiments, respectively.
3 Results and discussion
3.1 Fingerprinting of drinking water and LB medium
3.1.1 Gating of flow cytometric microbiological fingerprints
One focus of this study was the optimization and standardization of the gating procedure. For this, Figure 2 shows the flow cytometric fingerprint of the drinking water. Within the TCC gate, signals are classified as bacterial cells. Signals outside of the gate are background noise, which affect the general fingerprint of miscellaneous waters, although they did not affect the upcoming bacterial growth behavior. We could identify around
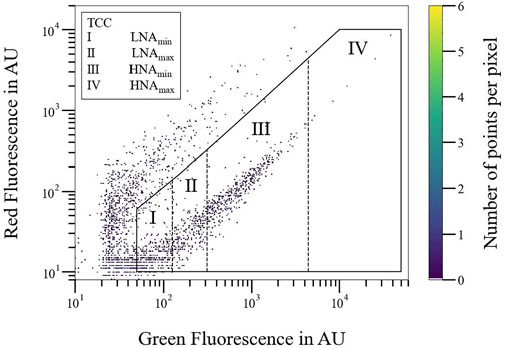
FIGURE 2. Flow cytometric fingerprint (red over green fluorescence signals) of a tap water sample (S1) at time t = 0. Discrimination into overall TCC (
The single distribution into two gates was not precise enough to detect obvious changes in the drinking water matrix in real-time monitoring of flow cytometric data. Discrimination of the LNAmin/LNAmax and HNAmin/LNAmax (Figure 2) gates should highlight the advantage of detailed gating, especially compared to state-of-the-art discrimination into two gates only (HNA and LNA). For tap water, similar proportions of LNAmin and LNAmax cells were observed, whereas almost all HNA cells appeared within the HNAmin gate.
This approach of further discrimination was introduced due to its convenient way of applying it to existing gating procedures for water quality analysis within waterworks. This might be promising for the easy applicability of this method compared to more detailed programming-based analysis tools described recently (Rogers and Holyst, 2009; Ross, 2021).
3.1.2 Organic carbon characterization via TOC analyses and LC-OCD
According to the high TOC concentration of pure LB medium (7 g/L), very low amounts were injected to the tap water and investigated in this study. The respective TOC concentrations of all samples are shown in Table 1.
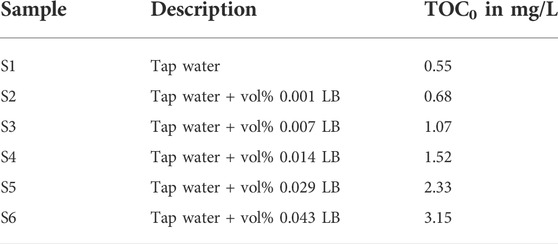
TABLE 1. Overview of TOC in tap water samples. The description refers to the amounts of LB medium in the tap water. The analyses were performed before the start of the real-time monitoring experiment.
The TOC analysis confirmed the linearity between each sample and the respective concentration of LB medium. Very small concentrations of LB medium (vol% 0.001) were detected via the TOC analysis. Additional LC-OCD analysis was applied to better understand the molecular weight distribution of the organic components in water and their effect on bacterial growth. The relative OCD signals of each sample are shown in Figure 3. The corresponding results from the UV detector showing analogous behavior are included in the Supplementary Material (Supplementary Figure S1).
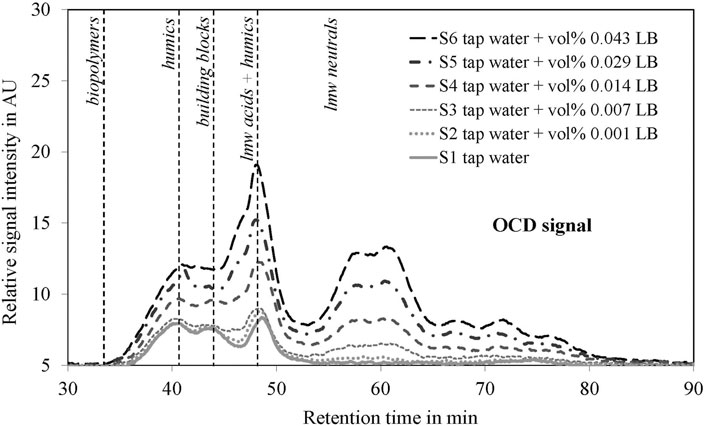
FIGURE 3. Characterization of organic carbon by LC-OCD analysis for all samples (S1–S6). Differences in biopolymers, humics, building blocks, low molecular weight (lmw) acids + humics and lmw neutrals are show. The analyses were performed before the start of the real-time monitoring experiments.
Tap water analysis (S1) showed that the organic carbon content was dominated by humic substances (humics), building blocks, and low molecular weight (lmw) acids and humics. Significant levels of lower molecular weight neutrals and biopolymers were not detected in tap water. The addition of LB medium to tap water showed corresponding increases in the relative signal intensities. Even for very low concentrations of LB medium (S2—tap water + vol% 0.001 LB), a slight increase was visible for low molecular weight acids and humics as well as for low molecular weight neutrals. This trend was also observed for higher LB medium concentrations.
According to the results of the LC-OCD analysis, we could characterize most of the TOC as DOC. The DOC in tap water and LB medium were mainly hydrophilic.
3.1.3 Organic carbon characterization via PARAFAC modeling
Fluorescence spectroscopy can be run in real-time and generated organic fingerprints much more quickly compared to TOC and LC-OCD analysis. We applied fluorescence spectroscopy for organic fingerprinting characterization of drinking water to check whether TOC and LC-OCD analysis could be a complementary real-time approach for detecting changes in water quality. Our model validation showed a successful performance for the 7-component model.
Fluorescence spectroscopic data is displayed in the excitation-emission matrix (EEM), which shows the fluorescence intensities for the corresponding excitation and emission wavelengths (λEx/λEm). By plotting EEMs (Figure 4), characteristic patterns of fluorescent compounds can be identified. Figure 4A shows the EEM of a pure tap water sample (S1), while Figure 4B shows the EEM of a tap water sample containing LB medium (S3—tap water + vol% 0.007 LB medium).
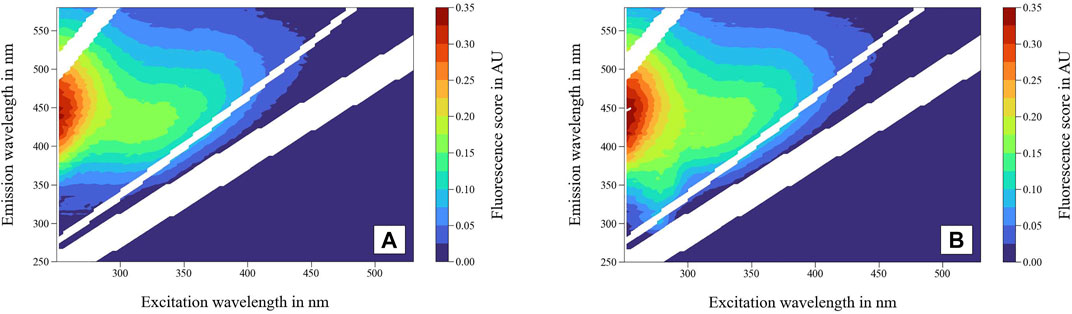
FIGURE 4. Excitation emission matrix (EEM) (A) of tap water (S1) and (B) tap water + vol% 0.007 LB medium (S3). Rayleigh and Raman scattering is removed and interpolated, respectively.
Fluorescence spectroscopic analysis of DOM in water generally showed fluorescent signals at excitation wavelengths of 200–500 nm and emission wavelengths of 250–600 nm (Stedmon and Bro, 2008). Depending on the TOC level and the source of the natural water sample, fluorescent peak regions and intensities can vary slightly (Coble, 1996). The EEM of tap water (Figure 4A) showed the typical appearance of DOM peaks in natural water. Based on Coble (1996) and Chen et al. (2003) the DOM signals can be divided into humic acid-like, fulvic acid-like, and protein-like components. Compared to the tap water sample (Figure 4A), different peak intensities and positions were observed for the sample containing LB medium (Figure 4B), especially at lower excitation wavelengths (250–300 nm). The real-time monitoring of fluorescence spectroscopic data by plotting and comparing EEM is not expedient for two reasons. First, the change in signal intensities might be too small to be seen by eye, particularly for drinking water with very low DOM concentrations, constant raw water sources, or stable treatment processes. Second, the fluorescence peaks can overlap in EEM graphics. This might result in unnoticed changes in peaks of lower intensities, which are masked by higher-intensity peaks. Therefore, it is currently crucial to apply the PARAFAC method as an offline- and real-time monitoring standard.
PARAFAC allows the specific characterization of particular fluorescent organic components present in tap water based on EEM decomposition. The PARAFAC model used in this study included 96 measurements of six different samples (S1–S6). The validation of the model revealed successful performance for seven fluorescent components. The individual fingerprints for each component, including their corresponding excitation and emission wavelength peaks, are shown in Figure 5. The fluorescence scores were normalized for each component.
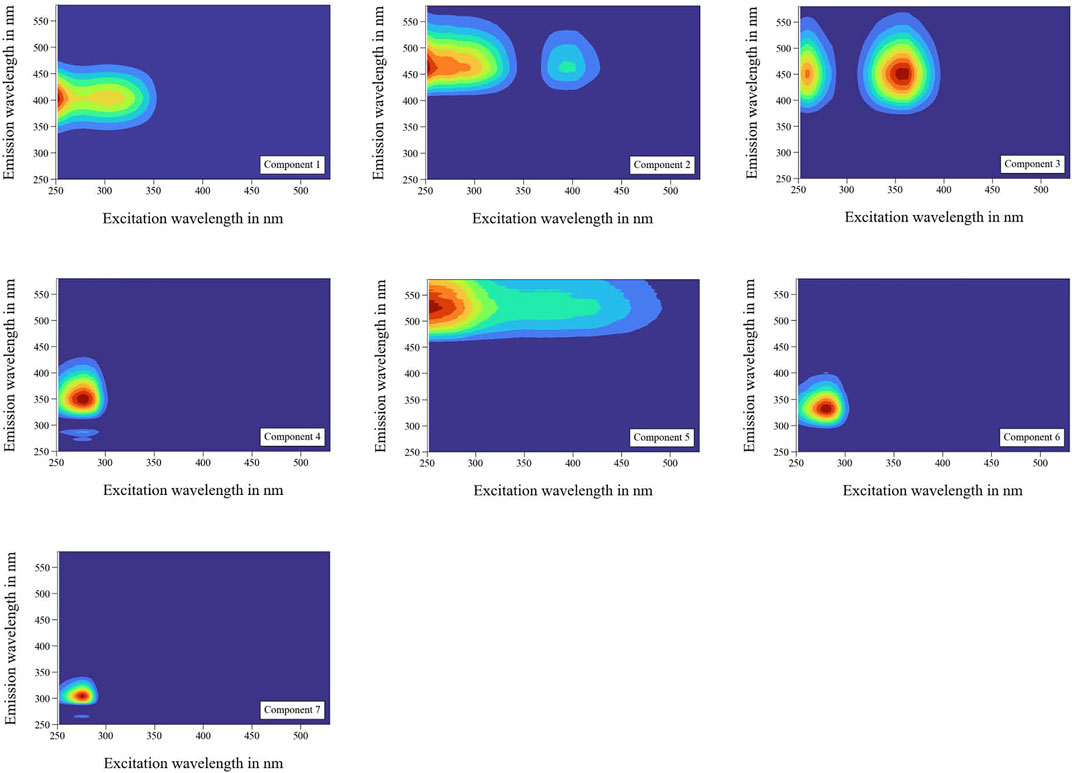
FIGURE 5. Fluorescent fingerprint of seven organic components in tap water with LB medium. Peak regions by pair of excitation (λEx) and emission (λEm) wavelengths: Component 1 λEx = 252/303 nm, λEm = 403 nm; Component 2 λEx = 252/393 nm, λEm = 463 nm; Component 3 λEx = 261/357 nm, λEm = 453 nm; Component 4 λEx = 279 nm, λEm = 351 nm; Component 5 λEx = 252 nm, λEm = 526 nm; Component 6 λEx = 279 nm, λEm = 332 nm; Component 7 λEx = 276 nm, λEm = 302 nm.
Components 1, 2, 3, 5, 6, and 7 were detected in the investigated tap water (S1). No signal was observed for Component 4 in tap water which indicated that this signal belonged mainly to the LB medium. However, while distinction among DOM fractions is difficult, it was required in this study. The OpenFluor database was used for detailed single component characterization (Murphy et al., 2014). An overview of studies that mentioned components with high matches (>95%) to the seven components modeled by the PARAFAC model in the present study is shown in Table 2.
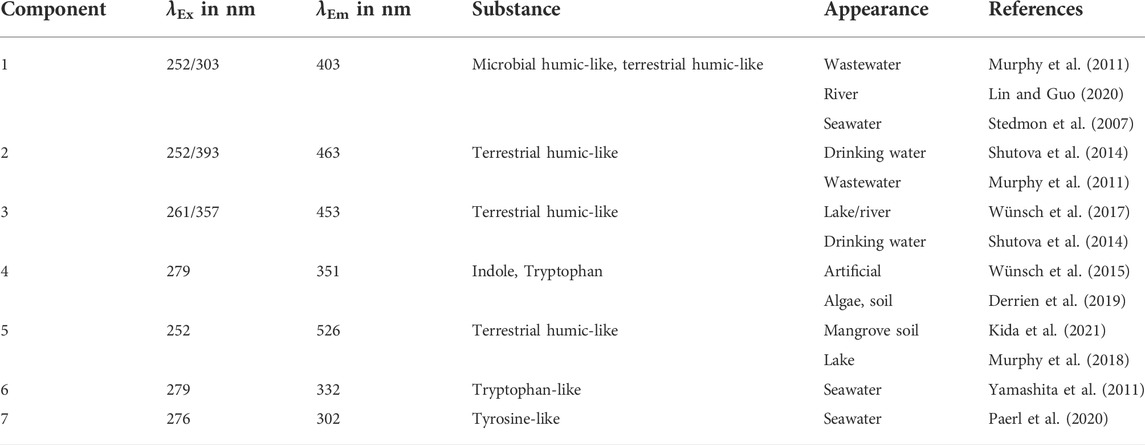
TABLE 2. Overview of seven components detected by the PARAFAC model in the present study, with their respective substance or substance-like designations, appearance in natural sources, and respective references according to Murphy et al. (2014).
The DOM categorization proposed by Coble (1996) is the most commonly used among the studies cited in the present study. However, a detailed characterization of humic-like DOM in microbial and terrestrial humic-like components is evident. The studies investigating humic-like compounds showed that the differentiation between components is not trivial, since there is usually a larger existing range of excitation-emission spectrum related to each component (Shutova et al., 2014). Aromatic protein-like components can be located more precisely in the EEM. This leads to the accurate identification of tryptophan-like and tyrosine-like compounds in both artificial and natural water sources. The components of our analyzed drinking water cannot be identified as general characteristics of drinking water only as they occurred in a wide range of natural water sources (Table 2).
3.2 Real-time monitoring of bacterial growth and fluorescent properties in tap water
3.2.1 Simultaneous monitoring and characterization results
Figure 6 shows the real-time monitoring results of drinking water samples S1, S2, S5, and S6. The results of the remaining samples are shown in Supplementary Figure S2. Fluorescent (λEx/λEm) Component 6 (279 nm/332 nm) was strongly correlated with the TCC. Components 4 (279 nm/351 nm) and 7 (276 nm/302 nm) affected the microbial conditions of the drinking water.
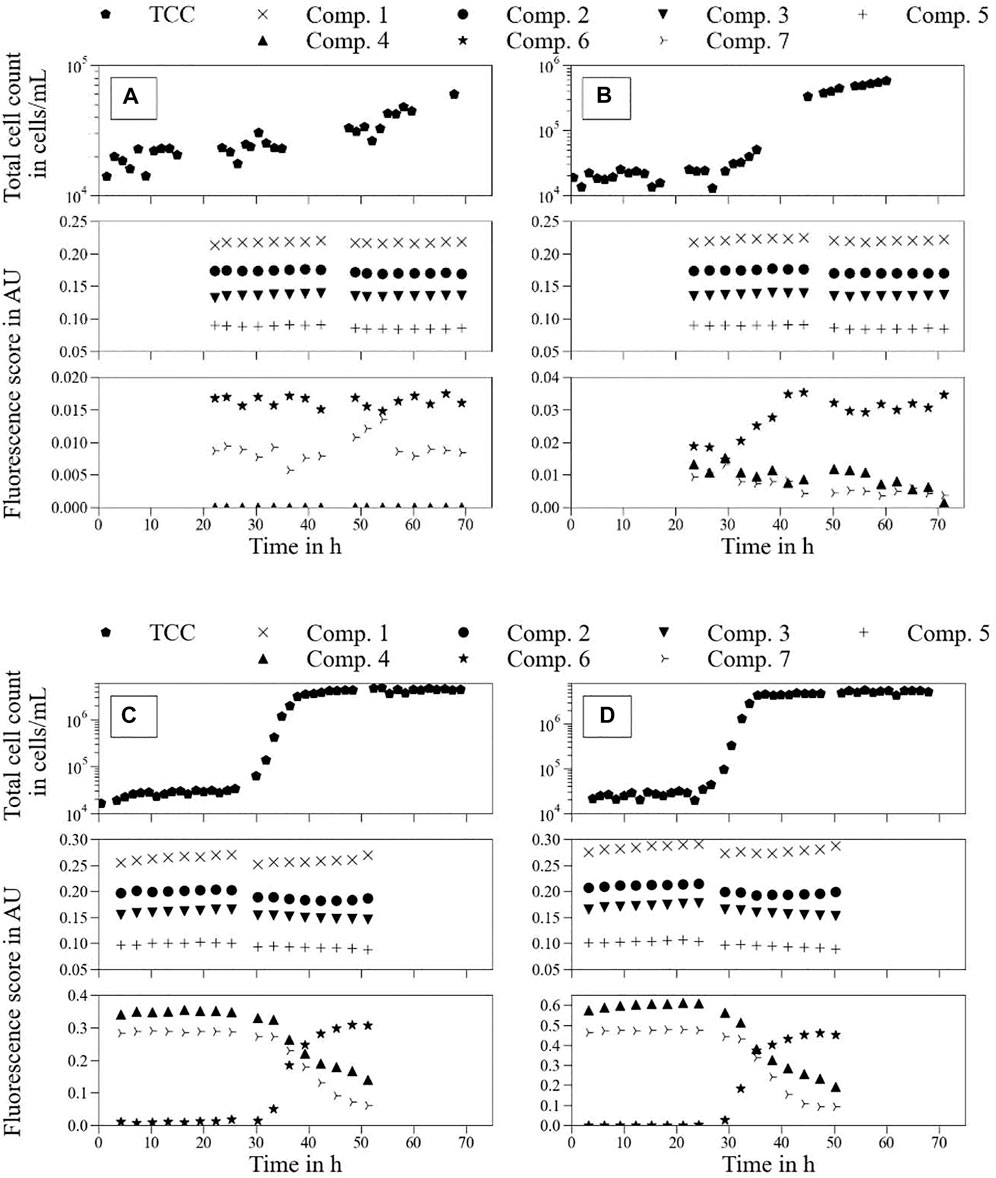
FIGURE 6. Real-time monitoring of total cell count (TCC) and fluorescence score in arbitrary units (Components 1–7) over an experimental period of approximately 70 h. Tap water samples with different LB medium concentrations: (A)—S1 tap water; (B)—S2 tap water + vol% 0.001 LB medium; (C)—S5 tap water + vol% 0.029 LB medium; (D)—S6 tap water + vol% 0.043 LB medium.
3.2.1.1 Flow cytometry
The TCC of each sample was stable in the beginning (<20–30 h) of the experiment, which corresponded to the lag-phase of the cells present in the drinking water. Regarding the tap water sample (Figure 6A), a slight linear increase of TCC is noticeable not only for the initial 20–30 h but over the entire experimental duration. However, the final TCC with approximately
Samples spiked with LB medium (Figures 6B–D) showed typical bacterial growth behavior over the experimental duration; namely, lag-phase, exponential growth, and stationary phase (Maier, 2009). After the initial lag phase, the cell communities enter the exponential growth phase before reaching the TCCmax (stationary phase). At least for (Figures 6C, D), the bacterial growth reached a stationary phase, whereas the TCC for (Figure 6B) continued to increase slightly until 60 h. In all samples, TCCmax was strongly related to the initial LB medium concentration. Furthermore, there was a link between the maximum exponential growth rate of each sample and its initial LB medium concentration. The higher the LB concentration, the higher TCCmax and exponential growth rate, respectively (Supplementary Table S1).
Despite the correlation between bacterial growth and LB medium concentration in drinking water, bacterial growth potential is also dependent on external parameters such as the general condition of cells in drinking water or the water temperature (Dukan et al., 1996; Jie et al., 2017).
Regarding the detected signals outside the TCC gate, no changes in event concentrations were observed during the experiments. The number of these events remained constant at around 5,000 cells/ml. Therefore, they were considered non-microbiological events that did not participate in microbiological growth.
3.2.1.2 Fluorescence spectroscopy
Fluorescent (λEx/λEm) Components 1 (252 and 303 nm/403 nm), 2 (252 and 393 nm/463 nm), 3 (261 nm/357 nm), 5 (252 nm/526 nm), 6 (279 nm/332 nm), and 7 (276 nm/302 nm) can clearly be identified as present in drinking water (Figure 6A). Regarding the effect of LB medium on tap water (Figures 6B–D) for the first respective measurement, the PARAFAC decomposition showed a significant linear increase in the fluorescence signals of Components 4 (279 nm/351 nm) and 7. However, Components 1, 2, 3, and 5 only showed slight and linear increases with the addition of LB medium, whereas the fluorescence signal in Component 6 remained constant. Comparison of these findings to the results of LC-OCD analysis (Figure 3) suggest to which of the possible fractions each component can be attributed. The large increase in the fluorescence scores of Components 4 and 7 suggest that they are low molecular weight organic acids and humics, and low molecular weight neutrals, respectively. The fluorescence scores of Components 1, 2, 3, and 5 suggested larger molecule structures such as humics and building blocks.
Regarding the time-dependent development of (Figures 6B–D), we start with Components 4, 6, and 7—previously determined to be protein-like compounds. The development of Component 6 shows the same behavior as the TCC growth curve. This might suggest that Component 6 can be used as a monitoring parameter for TCC. However, the modest increase over time of TCC in tap water (Figure 6A) was not demonstrated in Component 6. Different behaviors were observed for Components 4 and 7. Over the experimental duration, each component showed decreased fluorescence scores, divergent to the increase in TCC.
However, Component 4 did not show perfect synchronization with the corresponding TCC development. The stable TCCmax (stationary phase) during the declining fluorescence score of Component 4 could mean that the PARAFAC model was detecting microbiological changes in the water that were not directly related to the TCC. However, the respective minimum fluorescence scores for Components 4 and 7 had probably not yet been reached in (Figures 6C, D). It was not clear from the results of the experiments if both components reached their respective fluorescence scores from the pure tap water sample (Figure 6A) at some time after 70 and 50 h for (Figures 6C, D), respectively.
TOC measurements at the end of the experiments confirmed the remaining organic carbon amounts for S2–S6. The respective final TOC results are included in the Supplementary Material (Supplementary Table S2). Thus, it is likely that some organic carbon remained in these samples at the end of the experiments, which could not be utilized by bacteria (refractory organics).
The fluorescence scores of Components 1, 2, 3, and 5 showed largely stable behavior over the entire experimental period, with no visible and continuous trends in significant ranges.
3.2.2 Flow cytometric fingerprinting
S4 (tap water + vol% 0.014 LB medium) and S5 (tap water + vol% 0.029 LB medium) were chosen as representative samples to show respective bacterial growth behavior (Figure 7).
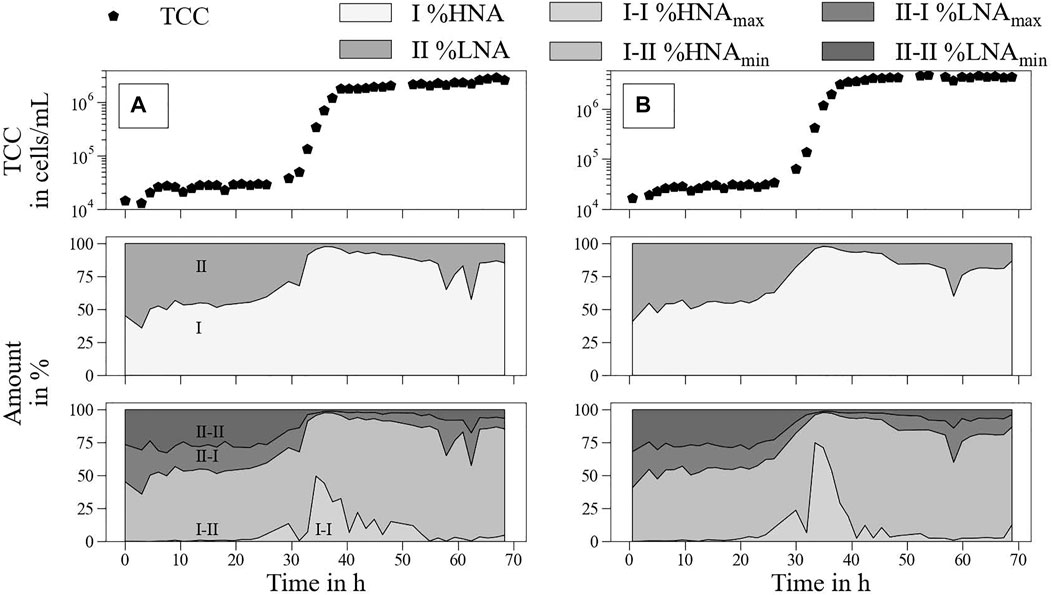
FIGURE 7. Real-time monitoring of detailed microbial fingerprints over approximately 70 h (A)—S4 tap water + vol% 0.014 LB medium; (B)—S5 tap water + vol% 0.029 LB medium.
During the lag phase, the HNA (I) and LNA (II) were stable, at approximately 50% each (Figure 7—second row). With increasing TCC, a shift towards HNA cells up to 90% during the exponential growth phase was observed. After reaching the stationary phase, the proportion of HNA declined but remained higher than that at the beginning (80%–85%). The single outliers might be caused by device issues in the beginning as well as during the analysis of high bacterial concentrations. Thus, the continuous measurement was an advantage over single measurements as outliers could be easily identified.
For a more detailed analysis of the bacterial community, the HNA/LNA gates were further divided into two sub-gates each. The peak of HNA cells for maximum exponential growth rate was mainly dominated by HNAmax (I-I) cells (Figure 7—third row). During the lag phase, no HNAmax cells were detected, and the proportion of HNAmax cells decreased again during the stationary phase. Interestingly, the significant appearance of HNAmax cells was identified before the exponential growth phase, as indicated by TCC monitoring (between 15 and 20 h).
This study confirmed the results of recent studies characterizing HNA cells as crucial cells compared to LNA cells for bacterial growth (Park et al., 2016; Jie et al., 2017). Furthermore, shifts between HNA and LNA cells within the stationary phases were also identified. A similar trend was observed in the PARAFAC analysis of Component 4 (Figures 6C,D). This might support the hypothesis of detailed microbiological monitoring via fluorescence spectroscopy and should be investigated in further studies.
The sudden occurrence of HNAmax cells could mark a central change in the water matrix that can lead to exponential growth or other general issues in the WDS. The analysis of several gate regions and the movement of bacterial clusters within these gates might be promising for the development of an early warning system for bacterial and organic contamination in WDS.
Recent studies highlighted the opportunities for detailed automatic fingerprinting. Ross (2021) introduced a python package (FlowGateNIST) that enables automatic gating to differentiate between cells and background and between singlet and multiplet events. Rogers and Holyst (2009) presented the R-based flowFP fingerprinting tool, which allows the automatic classification of bacteria. These innovative and accurate approaches aim for the successful identification of specific bacteria. Since it is currently impossible to distinguish between different bacteria species present in drinking water and data are difficult to interpret, it is a challenge to apply these techniques to a continuous monitoring system in a WDS. Considering the interaction between the accuracy and feasibility of drinking water monitoring, the method described in the present study connects both.
3.3 Application of the PARAFAC model for assimilable organic carbon analysis
The present database allowed the differentiation of organic components related to bacterial growth from those that were not. Protein-like Components 4 (λEx = 279 nm, λEm = 351 nm), 6 (λEx = 279 nm, λEm = 332 nm), and 7 (λEx = 276 nm, λEm = 302 nm) were identified as components representing microbiological conditions in drinking water. Component 6 was useful for the quantitative monitoring of TCC in drinking water. Components 4 and 7 represented potential nutrient material for cells present in drinking water.
This study assessed the potential usefulness of fluorescence spectroscopy, in particular the fluorescent behaviors of Components 4 and 7, to estimate AOC. Conventional AOC measurement of drinking water samples requires up to 4 weeks; thus, real-time measurement is not generally possible. Fluorescence spectroscopic analysis could significantly accelerate this process. This study identified a correlation between AOC and fluorescence scores for both Components 4 and 7 (Figure 8).
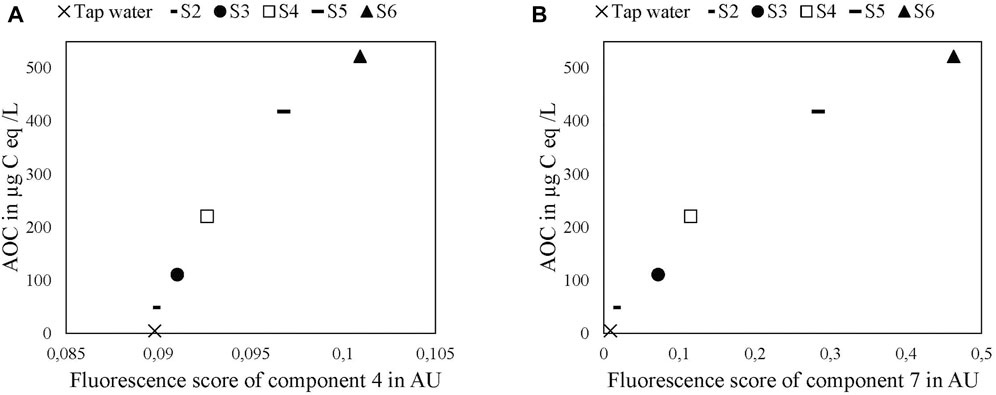
FIGURE 8. Correlations between fluorescence scores in arbitrary units for Components 7 (A) and 4 (B) and AOC level in the tap water samples.
The high fluorescence scores in Components 4 and 7 were correlated with higher AOC levels. Since these were drinking water samples containing LB medium (S2–S6), this finding requires validation in actual water samples with originally high amounts (high AOC in drinking water, groundwater, wastewater e.g.). Lower AOC levels (<50 μg C eq/L) likely lead to lower fluorescence spectroscopy accuracy since the fluorescence signals of both components are low compared to those of the remaining fluorescent components (Figure 6A). Moreover, the AOC standard deviation is high for lower ranges (<20 μg C eq/L). Another issue is that AOC can be affected by different carbon sources, such as single-bound carbon chains, which have no fluorescent properties and would consequently not be detected by fluorescence spectroscopy (Chen et al., 2018).
Another possible approach to characterize the AOC in water samples is LC-OCD-UVD analysis performed before and after the experimental run. The results of one representative sample (S4) are included in the Supplementary Material (Supplementary Figure S3). The OCD results showed that low molecular weight components (acids and neutrals) were the main sources of AOC in this study. However, these fractions were not significantly detected by UVD. Thus, fluorescence spectroscopy is better for the quantification of AOC compared to LC-OCD-UVD analysis.
Fluorescence spectroscopy for general AOC measurements cannot detect components with small amounts of double bonds (sugars e.g.), since they have low or even no fluorescent properties. However, considering the proportions of natural organic matter DOC as the potential source of AOC, most of the potential components from natural waters have fluorescent properties. Thus, the real-time monitoring of fluorescent components in drinking water might still allow an estimation of changes in microbial growth potential (AOC). A future objective is the application of this PARAFAC model to characterize fluorescence scores (Components 4 and 7) of several real drinking water sources without artificial growth stimulation by LB medium, which may confirm the correlation between the presence of these components and the AOC level in different drinking water sources.
4 Conclusion
The results of this study underscore the potential for real-time water quality characterization in real application fields based on real-time monitoring and characterization of flow cytometric and fluorescence spectroscopic data. The demonstrated correlations between the real-time monitoring of flow cytometric and fluorescence spectroscopic data can be summarized as follows:
• The PARAFAC model identified six different fluorescent components present in drinking water, whereas one extra component was only present in the medium (LB) applied as a nutrient source. This discrimination allows a precise and complementary characterization of drinking water DOC apart from conventional TOC or LC-OCD analysis.
• The identified protein-like Component 6 showed a strong correlation to TCC in drinking water, whereas protein-like Components 4 and 7 were organics that can be utilized as nutrients from autochthonous cells in drinking water. Analyzing both components may allow rapid estimation of the AOC level in drinking water samples.
• Fluorescence spectroscopy with real-time PARAFAC modeling enabled the combined analysis of bacterial concentration, detailed DOC information, and the microbial growth potential of drinking water.
• The distinction of flow cytometric fingerprints into four characteristic gates (LNAmin, LNAmax, HNAmin, and HNAmax) suggests the possibility of an early warning system for bacterial growth potential in drinking water. The occurrence of bacteria within the HNAmax gate identified emerging bacterial growth before the TCC increased.
• The developed PARAFAC model and dataset can be applied and adjusted for future real-time monitoring investigations of a broader range of drinking water sources as well as other sources including wastewater, surface water, etc.
Data availability statement
The raw data supporting the conclusions of this article will be made available by the authors without undue reservation.
Author contributions
JSc: conceptualization, methodology, experimental design, data analysis, investigation, visualization, and writing. JH: data analysis and PARAFAC modeling. JSt: co-conceptualization, experimental design, writing—review and editing. AG: methodology, supervision, and writing—review and editing. ME: supervision, project administration, funding acquisition, and writing—review editing.
Funding
Publishing fees funded by the Deutsche Forschungsgemeinschaft (DFG, German Research Foundation) - Projektnummer 491268466 and the Hamburg University of Technology (TUHH) in the funding programme “Open Access Publishing”. The investigations were supported by the German-Israeli Water Technology Cooperation Program, which is funded by the German Federal Ministry of Education and Research (BMBF) and the Israeli Ministry of Science, Technology and Space (MOST). The actual project is named MoDiCon (Project Number 02WIL1553A).
Acknowledgments
We thank Juri Steindorff from the Hamburg University of Technology for his literature research on PARAFAC modeling as well as his construction of the laboratory setup. We also thank Thorsten Dorsch from the Hamburg University of Technology for his support regarding the LC-OCD measurements. Finally, we thank Yuanpeng Fu for the overall review and scientific discussion.
Conflict of interest
The authors declare that the research was conducted in the absence of any commercial or financial relationships that could be construed as a potential conflict of interest.
Publisher’s note
All claims expressed in this article are solely those of the authors and do not necessarily represent those of their affiliated organizations, or those of the publisher, the editors and the reviewers. Any product that may be evaluated in this article, or claim that may be made by its manufacturer, is not guaranteed or endorsed by the publisher.
Supplementary material
The Supplementary Material for this article can be found online at: https://www.frontiersin.org/articles/10.3389/fenvc.2022.931067/full#supplementary-material
References
Al-Amoudi, A. S. (2010). Factors affecting natural organic matter (nom) and scaling fouling in NF membranes: A review. Desalination 259, 1–10. doi:10.1016/j.desal.2010.04.003
Al-Sabi, M. N. S., Gad, J. A., Riber, U., Kurtzhals, J. A. L., and Enemark, H. L. (2015). New filtration system for efficient recovery of waterborne Cryptosporidium oocysts and Giardia cysts. J. Appl. Microbiol. 119, 894–903. doi:10.1111/jam.12898
Andersen, C. M., and Bro, R. (2003). Practical aspects of PARAFAC modeling of fluorescence excitation-emission data. J. Chemom. 17, 200–215. doi:10.1002/cem.790
Ashbolt, N. J., Cunliffee, D., D’Anglada, L., Greiner, P., Gupta, R., Hearn, J., et al. (2014). in Water safety in distribution systems. Editor D. Cunliffee (Geneva, Switzerland: World Health Organization). Available at: https://apps.who.int/iris/bitstream/handle/10665/204422/9789241548892_eng.pdf.
Baghoth, S. A., Sharma, S. K., Guitard, M., Heim, V., Croué, J.-P., and Amy, G. L. (2011). Removal of NOM-constituents as characterized by LC-OCD and F-EEM during drinking water treatment. J. Water Supply Res. Technol. 60, 412–424. doi:10.2166/aqua.2011.059
Bahram, M., Bro, R., Stedmon, C., and Afkhami, A. (2006). Handling of Rayleigh and Raman scatter for PARAFAC modeling of fluorescence data using interpolation. J. Chemom. 20, 99–105. doi:10.1002/cem.978
Besmer, M. D., Weissbrodt, D. G., Kratochvil, B. E., Sigrist, J. A., Weyland, M. S., and Hammes, F. (2014). The feasibility of automated online flow cytometry for in-situ monitoring of microbial dynamics in aquatic ecosystems. Front. Microbiol. 5, 265–312. doi:10.3389/fmicb.2014.00265
Brezinski, K., and Gorczyca, B. (2019). An overview of the uses of high performance size exclusion chromatography (HPSEC) in the characterization of natural organic matter (NOM) in potable water, and ion-exchange applications. Chemosphere 217, 122–139. doi:10.1016/j.chemosphere.2018.10.028
Buysschaert, B., Vermijs, L., Naka, A., Boon, N., and De Gusseme, B. (2018). Online flow cytometric monitoring of microbial water quality in a full-scale water treatment plant. npj Clean. Water 1, 16. doi:10.1038/s41545-018-0017-7
Camper, A. K., Brastrup, K., Sandvig, A., Clement, J., Spencer, C., and Capuzzi, A. J. (2003). Effect of distribution system materials on bacterial regrowth. Journal‐. Am. Water. Works. Assoc. 95, 107–121. doi:10.1002/j.1551-8833.2003.tb10412.x
Carstea, E. M., Popa, C. L., Baker, A., and Bridgeman, J. (2020). In situ fluorescence measurements of dissolved organic matter: A review. Sci. Total Environ. 699, 134361. doi:10.1016/j.scitotenv.2019.134361
Chen, W., Westerhoff, P., Leenheer, J. A., and Booksh, K. (2003). Fluorescence excitation-emission matrix regional integration to quantify spectra for dissolved organic matter. Environ. Sci. Technol. 37, 5701–5710. doi:10.1021/es034354c
Chen, Z., Yu, T., Ngo, H. H., Lu, Y., Li, G., Wu, Q., et al. (2018). Assimilable organic carbon (AOC) variation in reclaimed water: Insight on biological stability evaluation and control for sustainable water reuse. Bioresour. Technol. 254, 290–299. doi:10.1016/j.biortech.2018.01.111
Cheswick, R., Moore, G., Nocker, A., Hassard, F., Jefferson, B., and Jarvis, P. (2020). Chlorine disinfection of drinking water assessed by flow cytometry: New insights. Environ. Technol. Innov. 19, 101032. doi:10.1016/J.ETI.2020.101032
Coble, P. G. (1996). Characterization of marine and terrestrial DOM in seawater using excitation-emission matrix spectroscopy. Mar. Chem. 51, 325–346. doi:10.1016/0304-4203(95)00062-3
Derrien, M., Shin, K. H., and Hur, J. (2019). Assessment on applicability of common source tracking tools for particulate organic matter in controlled end member mixing experiments. Sci. Total Environ. 666, 187–196. doi:10.1016/J.SCITOTENV.2019.02.258
Ding, S., Deng, Y., Bond, T., Fang, C., Cao, Z., and Chu, W. (2019). Disinfection byproduct formation during drinking water treatment and distribution: A review of unintended effects of engineering agents and materials. Water Res. 160, 313–329. doi:10.1016/j.watres.2019.05.024
Dragan, A. I., Pavlovic, R., McGivney, J. B., Casas-Finet, J. R., Bishop, E. S., Strouse, R. J., et al. (2012). SYBR green I: Fluorescence properties and interaction with DNA. J. Fluoresc. 22, 1189–1199. doi:10.1007/s10895-012-1059-8
Dukan, S., Levi, Y., Piriou, P., Guyon, F., and Villon, P. (1996). Dynamic modelling of bacterial growth in drinking water networks. Water Res. 30, 1991–2002. doi:10.1016/0043-1354(96)00021-8
El-Chakhtoura, J., Prest, E., Saikaly, P., van Loosdrecht, M., Hammes, F., and Vrouwenvelder, H. (2015). Dynamics of bacterial communities before and after distribution in a full-scale drinking water network. Water Res. 74, 180–190. doi:10.1016/J.WATRES.2015.02.015
Gillespie, S., Lipphaus, P., Green, J., Parsons, S., Weir, P., Juskowiak, K., et al. (2014). Assessing microbiological water quality in drinking water distribution systems with disinfectant residual using flow cytometry. Water Res. 65, 224–234. doi:10.1016/j.watres.2014.07.029
Hammes, F. A., and Egli, T. (2005). New method for assimilable organic carbon determination using flow-cytometric enumeration and a natural microbial consortium as inoculum. Environ. Sci. Technol. 39, 3289–3294. doi:10.1021/es048277c
Hammes, F., Broger, T., Weilenmann, H.-U., Vital, M., Helbing, J., Bosshart, U., et al. (2012). Development and laboratory-scale testing of a fully automated online flow cytometer for drinking water analysis. Cytom. A 81, 508–516. doi:10.1002/cyto.a.22048
Heibati, M., Stedmon, C. A., Stenroth, K., Rauch, S., Toljander, J., Säve-Söderbergh, M., et al. (2017). Assessment of drinking water quality at the tap using fluorescence spectroscopy. Water Res. 125, 1–10. doi:10.1016/j.watres.2017.08.020
Heins, A.-L., Hoang, M. D., and Weuster-Botz, D. (2022). Advances in automated real-time flow cytometry for monitoring of bioreactor processes. Eng. Life Sci. 22, 260–278. doi:10.1002/elsc.202100082
Ho, J., Nocker, A., Bendinger, B., West, S., and Thiem, A. (2020). Weiterentwicklung und Validierung der Durchflusszytometrie als schnelle Detektionsmethode für Bakterien in Roh- und Trinkwasser.
Huber, S. A., Balz, A., Abert, M., and Pronk, W. (2011). Characterisation of aquatic humic and non-humic matter with size-exclusion chromatography--organic carbon detection--organic nitrogen detection (LC-OCD-OND). Water Res. 45, 879–885. doi:10.1016/j.watres.2010.09.023
Jie, L., Zhipeng, Z., Cuihong, C., Peilin, C., and Yingying, W. (2017). In-situ features of LNA and HNA bacteria in branch ends of drinking water distribution systems. J. Water Supply. Res. Tec. 66, 300–307. doi:10.2166/aqua.2017.108
Johnstone, D. W., Sanchez, N. P., and Miller, C. M. (2009). Parallel factor Analysis of excitation–emission matrices to assess drinking water disinfection byproduct formation during a peak formation period. Environ. Eng. Sci. 26, 1551–1559. doi:10.1089/EES.2009.0139
Kida, M., Watanabe, I., Kinjo, K., Kondo, M., Yoshitake, S., Tomotsune, M., et al. (2021). Organic carbon stock and composition in 3.5-m core mangrove soils (Trat, Thailand). Sci. Total Environ. 801, 149682. doi:10.1016/J.SCITOTENV.2021.149682
Korshin, G. V., Sgroi, M., and Ratnaweera, H. (2018). Spectroscopic surrogates for real time monitoring of water quality in wastewater treatment and water reuse. Curr. Opin. Environ. Sci. Health 2, 12–19. doi:10.1016/j.coesh.2017.11.003
Li, L., Li, J., Zhu, C., and Yu, S. (2020). Study of the binding regularity and corresponding mechanism of drinking water odorous compound 2-MIB with coexisting dissolved organic matter. Chem. Eng. J. 395, 125015. doi:10.1016/j.cej.2020.125015
Lin, H., and Guo, L. (2020). Variations in colloidal DOM composition with molecular weight within individual water samples as characterized by flow field-flow fractionation and EEM-PARAFAC analysis. Environ. Sci. Technol. 54, 1657–1667. doi:10.1021/acs.est.9b07123
Ma, C., Xu, H., Zhang, L., Pei, H., and Jin, Y. (2018). Use of fluorescence excitation–emission matrices coupled with parallel factor analysis to monitor C- and N-DBPs formation in drinking water recovered from cyanobacteria-laden sludge dewatering. Sci. Total Environ. 640–641, 609–618. doi:10.1016/J.SCITOTENV.2018.05.369
Macey, M. G. (2007). Flow cytometry: Principles and applications, 1–290. doi:10.1007/978-1-59745-451-3
Maier, R. M. (2009). “Chapter 3 - bacterial growth,” in Environmental Microbiology. Editors R. M. Maier, I. L. Pepper, and C. P. Gerba. Second Edition (San Diego: Academic Press), 37–54. doi:10.1016/B978-0-12-370519-8.00003-1
Mao, G., Wang, Y., and Hammes, F. (2021). Automated flow cytometry as a flexible tool for comparing disinfection characteristics of indigenous bacterial communities and pure cultures. Ecotoxicol. Environ. Saf. 225, 112799. doi:10.1016/j.ecoenv.2021.112799
Meng, F., Zhou, Z., Ni, B. J., Zheng, X., Huang, G., Jia, X., et al. (2011). Characterization of the size-fractionated biomacromolecules: Tracking their role and fate in a membrane bioreactor. Water Res. 45, 4661–4671. doi:10.1016/J.WATRES.2011.06.026
Murphy, K. R., Hambly, A., Singh, S., Henderson, R. K., Baker, A., Stuetz, R., et al. (2011). Organic matter fluorescence in municipal water recycling schemes: Toward a unified PARAFAC model. Environ. Sci. Technol. 45, 2909–2916. doi:10.1021/es103015e
Murphy, K. R., Stedmon, C. A., Graeber, D., and Bro, R. (2013). Fluorescence spectroscopy and multi-way techniques. PARAFAC. Anal. Methods 5, 6557–6566. doi:10.1039/c3ay41160e
Murphy, K. R., Stedmon, C. A., Wenig, P., and Bro, R. (2014). OpenFluor– an online spectral library of auto-fluorescence by organic compounds in the environment. Anal. Methods 6, 658–661. doi:10.1039/C3AY41935E
Murphy, K. R., Timko, S. A., Gonsior, M., Powers, L. C., Wünsch, U. J., and Stedmon, C. A. (2018). Photochemistry illuminates ubiquitous organic matter fluorescence spectra. Environ. Sci. Technol. 52, 11243–11250. doi:10.1021/acs.est.8b02648
Paerl, R. W., Claudio, I. M., Shields, M. R., Bianchi, T. S., and Osburn, C. L. (2020). Dityrosine formation via reactive oxygen consumption yields increasingly recalcitrant humic-like fluorescent organic matter in the ocean. Limnol. Oceanogr. Lett. 5, 337–345. doi:10.1002/LOL2.10154
Park, J. W., Kim, H.-C., Meyer, A. S., Kim, S., and Maeng, S. K. (2016). Influences of NOM composition and bacteriological characteristics on biological stability in a full-scale drinking water treatment plant. Chemosphere 160, 189–198. doi:10.1016/j.chemosphere.2016.06.079
Prest, E. I., Hammes, F., Kötzsch, S., van Loosdrecht, M. C. M., and Vrouwenvelder, J. S. (2013). Monitoring microbiological changes in drinking water systems using a fast and reproducible flow cytometric method. Water Res. 47, 7131–7142. doi:10.1016/j.watres.2013.07.051
Rogers, W. T., and Holyst, H. A. (2009). FlowFP: A bioconductor package for fingerprinting flow cytometric data. Adv. Bioinforma. 2009, 1–11. doi:10.1155/2009/193947
Ross, D. (2021). Automated analysis of bacterial flow cytometry data with FlowGateNIST. PLoS One 16, e0250753–12. doi:10.1371/journal.pone.0250753
Rubbens, P., and Props, R. (2021). Computational analysis of microbial flow cytometry data. mSystems 6, e00895-20. doi:10.1128/MSYSTEMS.00895-20
Safford, H. R., and Bischel, H. N. (2019). Flow cytometry applications in water treatment, distribution, and reuse: A review. Water Res. 151, 110–133. doi:10.1016/j.watres.2018.12.016
Schönher, C., Proksch, P., Kerschbaumer, D., Fiedler, C. J., Schmidt, B.-J., Keskinöz, C., et al. (2021). Every cell counts”—Experiences with flow cytometry for Austrian drinking water supply. Osterr. Wasser- Abfallw. 73, 501–511. doi:10.1007/S00506-021-00802-Z
Sezonov, G., Joseleau-Petit, D., and D’Ari, R. (2007). Escherichia coli physiology in luria-bertani broth. J. Bacteriol. 189, 8746–8749. doi:10.1128/JB.01368-07
Shimizu, Y., Ateia, M., and Yoshimura, C. (2018). Natural organic matter undergoes different molecular sieving by adsorption on activated carbon and carbon nanotubes. Chemosphere 203, 345–352. doi:10.1016/j.chemosphere.2018.03.197
Shutova, Y., Baker, A., Bridgeman, J., and Henderson, R. K. (2014). Spectroscopic characterisation of dissolved organic matter changes in drinking water treatment: From PARAFAC analysis to online monitoring wavelengths. Water Res. 54, 159–169. doi:10.1016/J.WATRES.2014.01.053
Sillanpää, M. E. T. (2014). Natural organic matter in water : Characterization and treatment methods.
Sorensen, J. P. R., Vivanco, A., Ascott, M. J., Gooddy, D. C., Lapworth, D. J., Read, D. S., et al. (2018). Online fluorescence spectroscopy for the real-time evaluation of the microbial quality of drinking water. Water Res. 137, 301–309. doi:10.1016/j.watres.2018.03.001
Spencer, R. G. M., Bolton, L., and Baker, A. (2007). Freeze/thaw and pH effects on freshwater dissolved organic matter fluorescence and absorbance properties from a number of UK locations. Water Res. 41, 2941–2950. doi:10.1016/J.WATRES.2007.04.012
Stedmon, C. A., and Bro, R. (2008). Characterizing dissolved organic matter fluorescence with parallel factor analysis: A tutorial. Limnol. Oceanogr. Methods 6, 572–579. doi:10.4319/lom.2008.6.572b
Stedmon, C. A., Markager, S., and Bro, R. (2003). Tracing dissolved organic matter in aquatic environments using a new approach to fluorescence spectroscopy. Mar. Chem. 82, 239–254. doi:10.1016/S0304-4203(03)00072-0
Stedmon, C. A., Markager, S., Tranvik, L., Kronberg, L., Slätis, T., and Martinsen, W. (2007). Photochemical production of ammonium and transformation of dissolved organic matter in the Baltic Sea. Mar. Chem. 104, 227–240. doi:10.1016/j.marchem.2006.11.005
Van der Kooij, D. (2003). Assimilable organic carbon (AOC) in treated water: Determination and significance. Encycl. Environ. Microbiol. doi:10.1002/0471263397.ENV175
Van der Kooij, D., Visser, A., and Hijnen, W. A. M. (1982). Determining the concentration of easily assimilable organic carbon in drinking water. J. Am. Water Works Assoc. 74, 540–545. doi:10.1002/J.1551-8833.1982.TB05000.X
Van Nevel, S., Buysschaert, B., De Roy, K., De Gusseme, B., Clement, L., and Boon, N. (2017). Flow cytometry for immediate follow-up of drinking water networks after maintenance. Water Res. 111, 66–73. doi:10.1016/J.WATRES.2016.12.040
Vital, M., Hammes, F., and Egli, T. (2012). Competition of Escherichia coli O157 with a drinking water bacterial community at low nutrient concentrations. Water Res. 46, 6279–6290. doi:10.1016/j.watres.2012.08.043
Wang, Q., Tao, T., Xin, K., Li, S., and Zhang, W. (2014). A review research of assimilable organic carbon bioassay. Desalination Water Treat. 52, 2734–2740. doi:10.1080/19443994.2013.830683
Wang, Y., Hammes, F., De Roy, K., Verstraete, W., and Boon, N. (2010). Past, present and future applications of flow cytometry in aquatic microbiology. Trends Biotechnol. 28, 416–424. doi:10.1016/J.TIBTECH.2010.04.006
Weinrich, L. A., Jjemba, P. K., Giraldo, E., and LeChevallier, M. W. (2010). Implications of organic carbon in the deterioration of water quality in reclaimed water distribution systems. Water Res. 44, 5367–5375. doi:10.1016/J.WATRES.2010.06.035
White, S., Quinn, J., Enzor, J., Staats, J., Mosier, S. M., Almarode, J., et al. (2021). FlowKit: A Python toolkit for integrated manual and automated cytometry analysis workflows. Front. Immunol. 12, 768541. doi:10.3389/fimmu.2021.768541
Wünsch, U. J., and Murphy, K. (2021). A simple method to isolate fluorescence spectra from small dissolved organic matter datasets. Water Res. 190, 116730. doi:10.1016/j.watres.2020.116730
Wünsch, U. J., Murphy, K. R., and Stedmon, C. A. (2015). Fluorescence quantum yields of natural organic matter and organic compounds: Implications for the fluorescence-based interpretation of organic matter composition. Front. Mar. Sci. 2, 98. doi:10.3389/fmars.2015.00098
Wünsch, U. J., Murphy, K. R., and Stedmon, C. A. (2017). The one-sample PARAFAC approach reveals molecular size distributions of fluorescent components in dissolved organic matter. Environ. Sci. Technol. 51, 11900–11908. doi:10.1021/acs.est.7b03260
Xu, X., Kang, J., Shen, J., Zhao, S., Wang, B., Zhang, X., et al. (2021). EEM–PARAFAC characterization of dissolved organic matter and its relationship with disinfection by-products formation potential in drinking water sources of northeastern China. Sci. Total Environ. 774, 145297. doi:10.1016/j.scitotenv.2021.145297
Yamashita, Y., Panton, A., Mahaffey, C., and Jaffé, R. (2011). Assessing the spatial and temporal variability of dissolved organic matter in Liverpool Bay using excitation-emission matrix fluorescence and parallel factor analysis. Ocean. Dyn. 61, 569–579. doi:10.1007/s10236-010-0365-4
Yang, L., Hur, J., and Zhuang, W. (2015). Occurrence and behaviors of fluorescence EEM-PARAFAC components in drinking water and wastewater treatment systems and their applications: A review. Environ. Sci. Pollut. Res. 22, 6500–6510. doi:10.1007/s11356-015-4214-3
Keywords: drinking water quality, real-time monitoring, dissolved organic matter, PARAFAC, bacterial growth, fluorescence spectroscopy, flow cytometry
Citation: Schuster J, Huber J, Stumme J, Grieb A and Ernst M (2022) Combining real-time fluorescence spectroscopy and flow cytometry to reveal new insights in DOC and cell characterization of drinking water. Front. Environ. Chem. 3:931067. doi: 10.3389/fenvc.2022.931067
Received: 28 April 2022; Accepted: 27 July 2022;
Published: 30 August 2022.
Edited by:
Kang Xiao, University of Chinese Academy of Sciences, ChinaCopyright © 2022 Schuster, Huber, Stumme, Grieb and Ernst. This is an open-access article distributed under the terms of the Creative Commons Attribution License (CC BY). The use, distribution or reproduction in other forums is permitted, provided the original author(s) and the copyright owner(s) are credited and that the original publication in this journal is cited, in accordance with accepted academic practice. No use, distribution or reproduction is permitted which does not comply with these terms.
*Correspondence: Jonas Schuster, jonas.schuster@tuhh.de