Underestimated increase and intensification of humid-heat extremes across southeast China due to humidity data inhomogeneity
 Xuezhu Li
 Yang Chen1*
 - 1State Key Laboratory of Severe Weather, Chinese Academy of Meteorological Sciences, Beijing, China
- 2National Meteorological Information Center, Beijing, China
When co-occurring with elevated levels of ambient relative humidity (RH), hot extremes are more perceivable and consequently more health-damaging. Quantifying changes in humid-heat extremes has therefore gained considerable scientific and societal attention, but a fundamental yet critical aspect to the estimation—data reliability—has been largely downplayed in previous analysis. By comparing ∼10 observational and reanalysis datasets to fully-homogenized observations across China, we report ubiquitous inhomogeneity in RH series in these popularly-used datasets [including HadISD(H) and ERA5], which accordingly produce unrealistically strong drying trends 2–3 times the homogenized dataset-based estimate during 1979–2013 in warm-moist southeast China. Locally, an inhomogeneity-caused exaggeration of drying by a magnitude of 1% decade−1 translates into a significant underestimation of increasing rates for frequency and intensity of humid-heat extremes by more than 1.2 days decade−1 and .07% decade−1 respectively. From a regional perspective, these inhomogeneous records have underestimated the frequency increase of extremes by up to 2 days decade−1 and their intensification by up to .4°C decade−1 in southeast China. Extremes identified via homogenized and non-homogenized datasets also differ in the bivariate joint distribution structure, with former cases featuring similarly hot temperatures yet discernably lower humidity.
1 Introduction
It is unequivocal that human influence has warmed the atmosphere, leading to more frequent, more intense, longer-lasting, and more widespread hot temperature extremes worldwide (IPCC, 2021). These hot extremes are a major cause of suffering and death as punctuated by some of the deadly cases such as the 2003 European event (∼70,000 mortality) and the 2010 Russian event (∼50,000 mortality, Hoag, 2014). The combination of extremely high temperatures with high humidity, i.e., the so-called humid-heat stress, represents a greater threat to human health, as it lowers the cooling efficiency of sweat, therefore making it difficult or even impossible for the body to prevent overheating (Mora et al., 2017; Buzan and Huber, 2020; IPCC, 2021; Vecellio et al., 2022). Hence, considerable efforts have been devoted to defining, monitoring and understanding extreme humid-heat events, based on diverse metrics configuring temperature and humidity as well as other relevant variables (e.g., winds and radiation) in different ways (Delworth et al., 1999; Diffenbaugh et al., 2007; Stull, 2011; Willett and Sherwood, 2012; Fischer and Knutti, 2013).
Regardless of metrics used, humid heat extremes have exhibited significantly increasing trends for frequency and intensity in most continents (Rogers et al., 2021; Tuholske et al., 2021). When incorporating humidity into the indices in a highly non-linear manner, these increases are markedly larger than their temperature-only counterparts (Delworth et al., 1999; Wang and Zhu, 2020; Rogers et al., 2021). Even at the current level of global warming, several populous regions, including North and South China, Eastern India, and the Middle East (Freychet et al., 2020; Saeed et al., 2021; Raymond et al., 2020; Mora et al., 2017), have experienced humid-heat extremes very close to or even above upper physiological limit. Though the survivability limits are still exceeded only on the rarest of occasions for now, the likelihood of exceedance is expected to grow rapidly in future warmer climates in these hotspots (Dunne et al., 2013; Mora et al., 2017; Kang and Eltahir, 2018; Saeed et al., 2021).
For the bivariate extremes, data quality of both air temperature and relative humidity (RH) matters to the accuracy of estimate for their long-term changes, and hence to assessments of related human health impacts and risks as well as adaptation planning (Sherwood, 2018; Brouillet and Joussaume, 2019). In contrast to high-quality air temperature datasets provided by multiple agencies, observational records of relative humidity are subject to large uncertainties resulting primarily from data inhomogeneity, and thus should be used with caution (IPCC, 2021; Schröder et al., 2019). It has been observed that global mean and boreal midlatitude summer-mean surface RH slightly increased during 1973–2000, followed by a steep decline based on the HadISDH (Willett et al., 2014; Douville and Plazzotta, 2017; Dunn et al., 2017); however, none of the CMIP5 models could capture such evolution. It is not yet clear if this discrepancy is related to the misrepresentation of internal variability in simulations or observational data inhomogeneity. Byrne and O’Gorman (2018) provided a candidate theory suggesting that the observed negative trends for relative humidity over midlatitude continents were linked to warming over the neighbouring oceans. The observational and theoretical uncertainties along with the observation-simulation discrepancy, preclude any robust detection and attribution conclusion with respect to relative humidity changes (IPCC, 2021).
The inhomogeneity issue in relative humidity records stands out starkly over China, the southeastern parts in particular, which may be related to the technical defects of humidity sensors under high temperature and humidity environments there (Yu and Mu, 2008; Zhu et al., 2015). The dielectric parameter of the humicap varies volatilely at high humidity and even more drastically combined with high temperatures, making observed humidity deviating far from real values. Using quality-controlled yet non-homogenized observations, the annual China Climate Bulletin released before 2014 used to report a significant decreasing trend in nationwide surface RH (China Climate Bulletin, 2014); whilst turning to a homogenized RH dataset instead, RH is believed to remain essentially unchanged since 1961 as concluded in the post-2014 Bulletins. Zhu et al. (2015) detected break points in the RH series observed in more than 68% of stations across China, mainly occurring during 2000–2005, coincident with the massive automation of the observing system. Without diving into the history of instrument replacement, conventional homogenization procedures by automatic software are reluctant to accurately detect and properly address potential region-wide inhomogeneities from the source (e.g., homogenized HadISDH, Willett et al., 2014).
Despite improved awareness of RH inhomogeneity (Li et al., 2020c; Wang and Sun, 2021; Zhang et al., 2021), the extent to which such inhomogeneity distorts the estimate for past and future changes in humid-heat extremes has been seldomly quantified (Freychet et al., 2020). The ERA5 (Hersbach et al., 2018) and HadISD (Dunn et al., 2016), are the most widely-used datasets to analyze humid-heat extremes at impact-relevant scales (sub-daily to daily) worldwide (Li et al., 2020b; Raymond et al., 2020; Speizer et al., 2022), with in-situ observations adding values to understanding on the regional heterogeneity (Luo and Lau, 2018; Wang et al., 2019; Li et al., 2020a). If RH is inhomogeneous in these datasets, the derived quantification of long-term changes in extremes would be biased. The recent availability of two homogenized RH datasets covering the domain of mainland China (Zhu et al., 2015; Li et al., 2020a) offers us a unique chance to revisit the existing understanding of humid-heat extremes in the populous region as a showcase, calling for more emphasis on the importance of RH data quality in characterizing the multivariate extreme event worldwide.
We do this by comprehensively comparing homogenized observations with popularly-used ∼10 datasets including raw station-based observations, gridded observations and reanalysis (detailed information see Supplementary Table S1). In addition to the differences in local-to-regional changes in RH and humid-heat extremes, we will also compare the T-RH joint distribution during humid-heat extremes, i.e., the impact-relevant nature of events, in homogenized and non-homogenized datasets.
2 Materials and methods
2.1 Data
There are currently two homogenized datasets including daily mean T and RH, available in China. One is based on raw daily records observed at 2,479 meteorological stations and was homogenized by using the PMTred and PMFT methods (Wang, 2008a; Wang, 2008b), with identified “break points” in the time series further manually double-checked with metadata to pin down its origin from any of site relocation, replacement/upgrading of observing instruments, or changes in observing timing and reporting protocol (Zhu et al., 2015, referred to as OBS-1 and used as the reference hereafter). The other is homogenized with respect to a dataset containing 756 stations, alternatively using the MASH method but not compared to the metadata (Li et al., 2020a; termed as OBS-2 hereafter). Raw daily observations from 2,479 stations across China are used for comparison, named OBS-3. Notably, the OBS-3 is most commonly used to study humid-heat as well as other types (e.g., precipitation) of weather extremes across China. It was often claimed as “a homogenized dataset” (Luo and Lau, 2018; Kong et al., 2020) by referring to Xu et al. (2013). As a matter of fact, the homogenization in Xu et al. (2013) was conducted with respect to daily temperatures only, and other variables in the datasets including RH were only quality-controlled by the data developer—National Meteorological Information Center—by means of detecting, flagging and correcting suspect/wrong values if possible (Zhu et al., 2015; Xu et al., 2021).
Three gridded datasets produced by site observations are also considered, including the CN05.1 (Wu and Gao, 2013) covering mainland China at a resolution of .25°, the HadISD v3.3.0—global sub-daily station dataset based on the ISD dataset from NOAA’s NCEI, where temperature, dewpoint temperature, sea-level pressure are quality controlled (Dunn et al., 2016), and the HadISDH—homogenized global gridded (5° × 5°) monthly mean land surface air temperature and humidity datasets based on the HadISD dataset (Smith et al., 2011; Willett et al., 2014).
As a supplement or sometimes proxy to observations, reanalysis data with greater spatial coverage and fewer missing values is also broadly taken for the analysis of humid-heat extremes both globally and regionally. The potential inhomogeneity of reanalyzed relative humidity, however, has been seldomly noted and examined. To this end, we also collected reanalysis data for RH as many as possible, including ERA5 (.25° × .25°, Hersbach et al., 2018), ERA-Interim (.75° × .75°, Dee et al., 2011), JRA-55 (.8° × .8°, Kobayashi et al., 2015), NCEP-DOE 2 (2.5° × 2.5°, Kanamitsu et al., 2002), and CRA-40 (.125° × .8°, Liao et al., 2021). Detailed information on datasets used could be found in Supplementary Table S1.
Given that period common to observations and reanalysis datasets started in 1979 and the formal homogenization for OBS-1 was conducted with respect to raw records before 2014, a 35-year period over 1979–2013 is selected for comparison amongst datasets. Though the homogenized dataset—OBS-1 is claimed to be extended to the very recent, the extension was actually made by simply concatenating post-2013 automatic observations, which are found potentially inhomogeneous again due to the re-parameterization of the automatic observing instrument. So further homogenization efforts are needed to reconcile period-specific inhomogeneities stemming from different sources.
2.2 Data pre-processing, metrics, extremes and methods
Before conducting the analysis, all reanalysis data are adjusted by their scaling and offsetting factors specified in the netcdf files. Also, the time zone of each dataset is converted to local standard time of homogenized station observations to guarantee the consistency of follow-up comparisons.
Given closer relevance of summertime humid heat stress to human health impacts, we put our focus on the summer season spanning from June to August. In the OBS-1 and OBS-3 datasets, we only use 2,270 stations that operate continuously throughout the study period without missing values. Since HadISDH only provides monthly-mean data and unknown errors of CRA-40 temperature data occur in 2013 (details see below), these two sets of data are not involved in the calculation of extreme events.
Heat stress indicators that characterize human thermal discomfort due to high air temperature and humidity are diverse, with varying levels of equation complexity, input parameters and their weightings, and physiological assumptions (e.g., a person of average height, weight, health, and in moderate clothing). All indices consider T and RH. We here adopt three representative indices, including wet-bulb temperature (Tw), wet-bulb globe temperature (WBGT), and NOAA-developed heat index (HI), to account for linear and non-linear combinations between heat and humidity (Supplementary Figure S1) as well as their distinct impacts on human health (Buzan and Huber, 2020). The multi-indices comparison also acknowledges their different sensitivities to RH (Sherwood, 2018), especially in extreme states (Buzan and Huber, 2020), thus acting to strengthen the robustness of our quantification of influences from RH inhomogeneity on trend estimates for humid-heat extremes.
The thermodynamic wet bulb temperature (Tw) refers to the temperature of wet air when it changes adiabatically to the saturated state, and is usually measured by a wet bulb thermometer. Given Tw above 31°C physical labor becomes difficult (Sherwood and Huber, 2010); while, when its value approaches or even exceeds 35°C, evaporative cooling from sweating is no longer effective as a means of dissipating body heat. Some recent pieces of evidence also point to the danger of much lower Tw values to even young, healthy people (Asseng et al., 2021; Vecellio et al., 2022). Considering the availability of observational meteorological variables, we follow the empirical expression of Tw proposed by Stull (2011) that:
WBGT is another typical measure of heat stress expressed as a linear combination of wet-bulb temperature, black globe temperature, and air temperature (Yaglou and Minard, 1957). The WBGT is employed as the ISO standard for thermal comfort (ISO, 1989) and is in use by a number of bodies including the military, civil engineers, and sports associations, with established thresholds relating directly to levels of physical activity (Willett and Sherwood, 2012). Considering the availability of variables used for calculation, we here adopt a “simplified WBGT” (sWBGT) version, developed by the Australian Bureau of Meteorology (ACSM, 1984), which depends only on T and humidity and represents heat stress for average daytime shady conditions outdoors (Willett Sherwood, 2012; Fischer and Knutti, 2013):
where water vapor pressure
The third index used here is the HI developed by Rothfusz (1990) and further refined and recommended by the National Oceanic and Atmospheric Administration (NOAA) with explicit thresholds warning of different levels of danger (Diffenbaugh et al., 2007). The HI is directly comparable to air temperature, with their difference informing the feels-like amplification effect of moisture on T (Delworth et al., 1999). The index is expressed as a polynomial equation composed of T and RH:
where T is air temperature in degrees F and RH is RH in percent.
If the RH is less than 13% and the temperature falls between 80° and 112°F, then the following adjustment needs to be subtracted from HI:
On the other hand, if the RH is greater than 85% and the temperature is between 80° and 87°F, then the following adjustment is added to HI:
In case that conditions of temperature and humidity warrant a HI value below 80°F, HI is re-calculated as:
All heat stress indices are finally converted to values in °C.
For each station or grid, summertime daily heat stress values are firstly calculated based on the aforementioned three indices respectively, and then all samples during 1979–2008 (a 30-year reference period) are pooled and empirically ranked to obtain local 95th percentiles of each heat stress index used as thresholds to identify their extremes.
With respect to the index considered, we count the number of threshold-exceeding days in each summer as the frequency of extreme humid-heat events, and the average amongst these extreme heat stress values represents the mean intensity of extremes of the year.
Given the same network density of OBS-1 and OBS-3, biases in the trend estimate for T, RH and extreme heat stress due to data inhomogeneity could be measured by a direct site-to-site comparison; whilst as with the comparison between station observations and gridded observations/reanalysis of different resolutions, we prepare a box-average series using all stations or grids at a scale of 5° × 5°, and calculate the areal-weighted mean of box values across a region to produce the regional-mean series. We did not interpolate station- and gridded- data onto the same mesh grid, to avoid untraceable uncertainties from interpolation algorithms.
We use ordinary least squares scheme to quantify linear trends for T, RH and extreme events, along with students’ t-test to evaluate the significance (at the .05 level). As a cross-validation, we additionally employ Kendall’s tau slope estimator (results now shown), and report highly consistent results in terms of both trend magnitude and significance. To isolate and quantify the influence of RH inhomogeneity on the estimate for changes in extreme humid-heat events at a local scale (Figure 3), we configure homogenized T from the OBS-1 to both homogenized RH (OBS-1) and raw RH (OBS-3). More specifically, we regress station-based differences in trends for extremes evaluated via homogenized and non-homogenized data onto the underlying differences in RH trends.
3 Results
During 1979–2013, daily mean air temperature exhibits significant warming trends across China in both homogenized and raw site observations (Figures 1A, B), characteristic of highly similar spatial patterns and local-to-regional magnitudes for trends between the two (Figure 1C). This suggests a minor influence of potential temporal inhomogeneity in T on the estimate for long-term changes of the variable. By contrast, the pattern, magnitude, significance and even the sign of trends for RH differ pronouncedly between homogenized and non-homogenized station-based observational datasets. The inhomogeneity issue in relative humidity is particularly stark in southeast China (south of 30N, east of 105E, black rectangle in Figures 1D, E), leading to widespread biases in trend estimates for RH with incorrect signs there (Figure 1F). The region (black rectangle) is typical of humid-hot subtropical climates in favor of the occurrence of oppressive heat (Supplementary Figure S1; Vargas Zeppetello et al., 2022) with the two variables playing equivalently important roles to cause extremes there (Buzan and Huber, 2020).
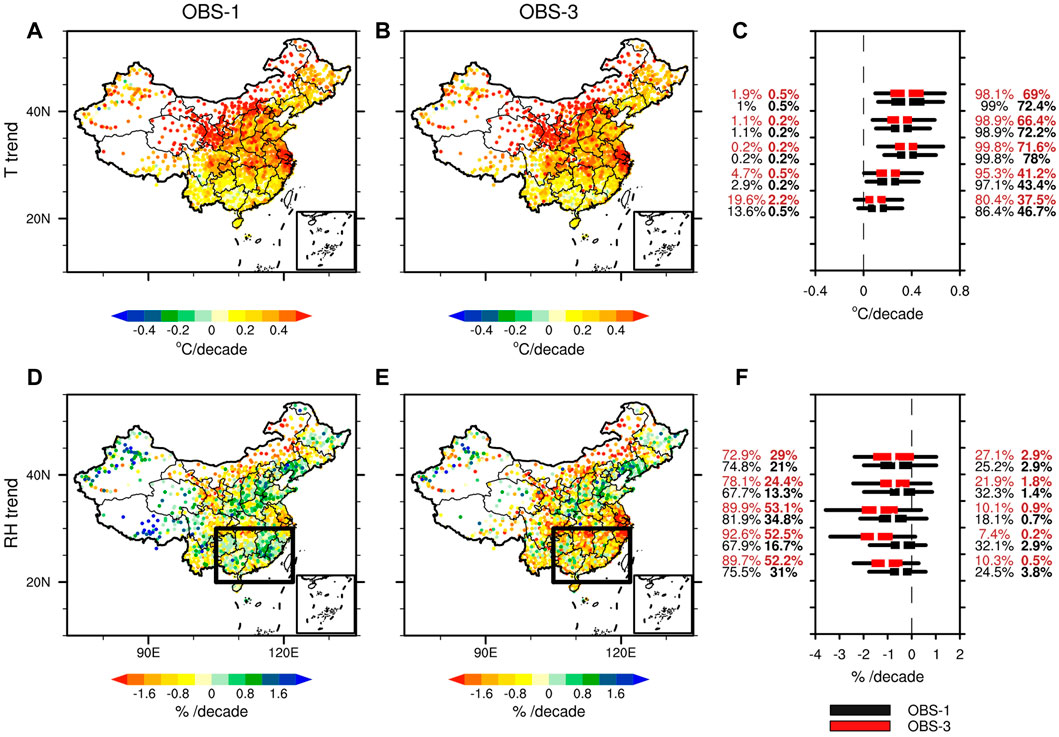
FIGURE 1. Trends for summertime T and RH in China during 1979–2013. (A,B) show T trends (°C per decade) estimated by OBS-1 (homogenized) and OBS-3 (non-homogenized), respectively. The box-and-whisker plots shown in (C) presents the distribution of T trends amongst stations within each 5°latitudinal band, including the 5th, 25th, median, 75th, and 95th percentiles in OBS-1 (black) and OBS-3 (red). The numbers labeled to the negative/positive side of the x-axis indicate the fraction of stations observing negative/positive trends within the latitudinal band, in which the fraction of station registering significant trends are bold-highlighted in the second column. (D–F) are the same as (A–C) but for RH.
With respect to the identified RH inhomogeneity hotspot, we further expand the comparison to gridded observations and widely-used reanalysis data at a regional scale. Large interannual to inter-decadal variability could be found in the domain-average RH series in homogenized observations (black curve, OBS-1, Figure 2A), experiencing a relatively wet regime before 2000 followed by a shift to a dry episode. This might be explained via a moist static energy balance perspective in the context of equal fractional changes in specific humidity over land and neighboring oceans (Byrne and O’Gorman, 2018) through remote moisture transport and local evapotranspiration processes (Byrne and O’Gorman, 2016; Douville et al., 2020).
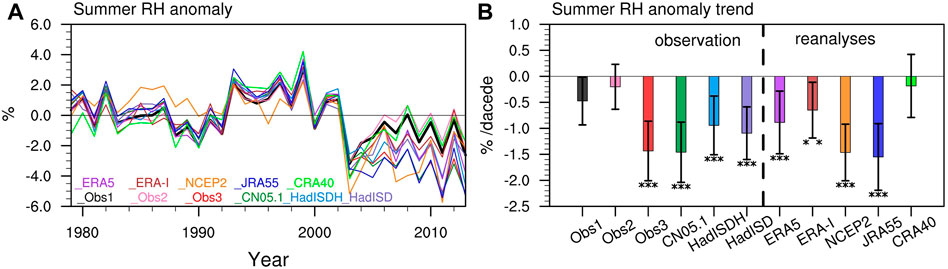
FIGURE 2. Domain-averaged series of RH over southeastern China during 1979–2013 based on eleven datasets (A) and their linear trends (B). The RH series is pre-processing into anomalies with respect to the 1979–2008 climatology. The error bars in (B) enclose the 95% confidence interval of trend estimates, with symbols “**” and “***” indicating their significance at the .05 and .01 levels respectively.
Though the regional variability is generally captured by other datasets, the RH drop around 2000, when coincidentally the observational network across China shifted from manual to automatic practices (2000–2005), is exaggerated in non-homogenized datasets (except for CRA-40). This is mainly because of the systematic difference in manual and automatic observing instruments, with the lower values recorded in the latter period (e.g., Supplementary Figure S2, RH) deemed more accurate and used since then (Zhu et al., 2015). The inhomogeneity gives rise to long-term drying trends of unrealistically high magnitude and significance (Figure 2B). Specifically, the regional drying rate estimated by OBS-1 is around −.47%/decade; while the estimate based on OBS-3 is −1.43%/decade, almost three times sharper than the correct one. In particular, the HadISDH was commonly used as homogenized observations to calculate heat stress indices globally (Raymond et al., 2020; Rogers et al., 2021). Our analysis brings into question the homogeneity of HadISDH over southeastern China, suggesting that detecting region-wide inhomogeneities by automated methods (Dunn et al., 2014) without knowing detailed histories of station information (e.g., relocation and instrument replacement) might be less effective than expected. Another extensively-used dataset—ERA5 also suffers from severe inhomogeneities in RH for the region, and is therefore not suitable to characterize humid-heat extremes at sub-daily to daily scales in the region (Freychet et al., 2020). Encouragingly, incorporating into homogenized station observations (OBS-1), the CRA-40 reanalysis newly released by the China Meteorological Administration performs well in reproducing both variability and trends of RH in southeastern China. Though expanding the study region northward to 35N does not alter the comparison of trend magnitude and significance amongst datasets in any significant manner (figure omitted), it might introduce confounding factors related to differential representation of irrigation in the 30–35N latitudinal band, an intensely irrigated region (Kang and Eltahir, 2018). So, to distinguish influences of data inhomogeneity from other similar confounding factors, southeastern China to the south of 30N is a better candidate study area.
Though air temperature records were also subject to changes in observing sites, instruments and timing, the inhomogeneities from these sources seemed to pose a trivial influence on the temporal variability and long-term trends as well as their significance of domain-averaged series of air temperature (Supplementary Figure S3, OBS-1 and OBS-2 vs. OBS-3). The differences in magnitudes and significances of trends for air temperature amongst datasets are much less conspicuous than those for relative humidity. Notably, despite better performance in representing RH during 1979–2013 in CRA-40, for unknown reasons, its temperature records in 2013 are inconsistent with counterparts from any of other datasets. This year’s error in temperature records has reported back to the data developer for improvement, and the flaw also excludes CRA-40 for participation in follow-up analysis on extremes.
We next quantify extent to which the RH inhomogeneity in observation and reanalysis datasets distorts the trend estimate for humid-heat metrics, similarly starting with a site-by-site comparison (OBS-1 vs. OBS-3). We do this by regressing the differential trends for extremes in homogenized and non-homogenized observations onto the differences of RH trends in them (homogeneous trend minus non-homogeneous one). As indicated by Figures 3A–C, given the same atmospheric warming (local trends for T from OBS-1), an exaggeration of drying trend by 1% decade−1 due to RH inhomogeneity translates into an underestimation of increasing trends for humid-heat extremes’ frequency by more than 1.2 days decade−1, with extreme sWBGT events influenced most. The RH inhomogeneity also significantly abates the intensification rates of extreme humid-heat events, especially those resulting from the highly non-linear combination between T and RH as showcased by the HI index (Figures 3D–F; also Supplementary Figures S4A–C). Locally, an 1% decade−1 drying bias caused by the RH inhomogeneity leads to an underestimation of intensification rates (absolute trends normalized by local index climatology, for the purpose of objective comparison amongst indices) for HI extremes by around .19% decade−1, equivalent to a bias around .07°C decade−1 there (Supplementary Figure S4).
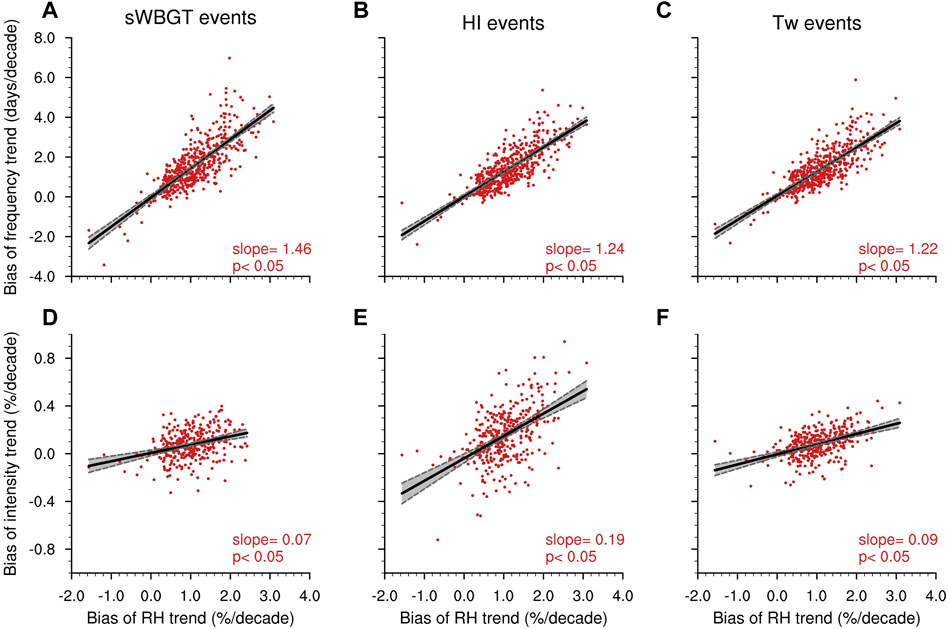
FIGURE 3. Influences of local RH trend bias (homogenized OBS1 minus non-homogenized OBS3) on the estimate for trends for frequency (A–C) and intensity (D–F) of humid-heat extremes across southeast China, identified using three indicators. To improve comparability in intensity amongst indicators (D–F), the trend for intensity at each station is normalized by local indicator climatology. Linear regressions are shown by black curves and the 95% regression confidence intervals are shaded in grey, with regression coefficients (Slope) and significance (P) indicated at the lower-right of each panel.
For the domain-average series of frequency, with reference to the trend evaluated via homogenized data, all non-homogenized datasets discernably underestimate the increase, by the magnitudes ranging from .5 to 2 days decade−1, basically proportional to the regional drying biases (both the X-axis and Y-axis represent the homogenized OBS-1 minus other datasets). The limited sample size (∼9 datasets) prohibits us from further evaluating the significance of such relationship. Despite being widely used, the HadISD and ERA5 datasets are amongst the worst that considerably underestimate past increases in the frequency of humid-heat extremes (Figure 4). Their bad performance arises jointly from an overestimation of the RH drying rate and an underestimation of the warming trend (Supplementary Figure S5).
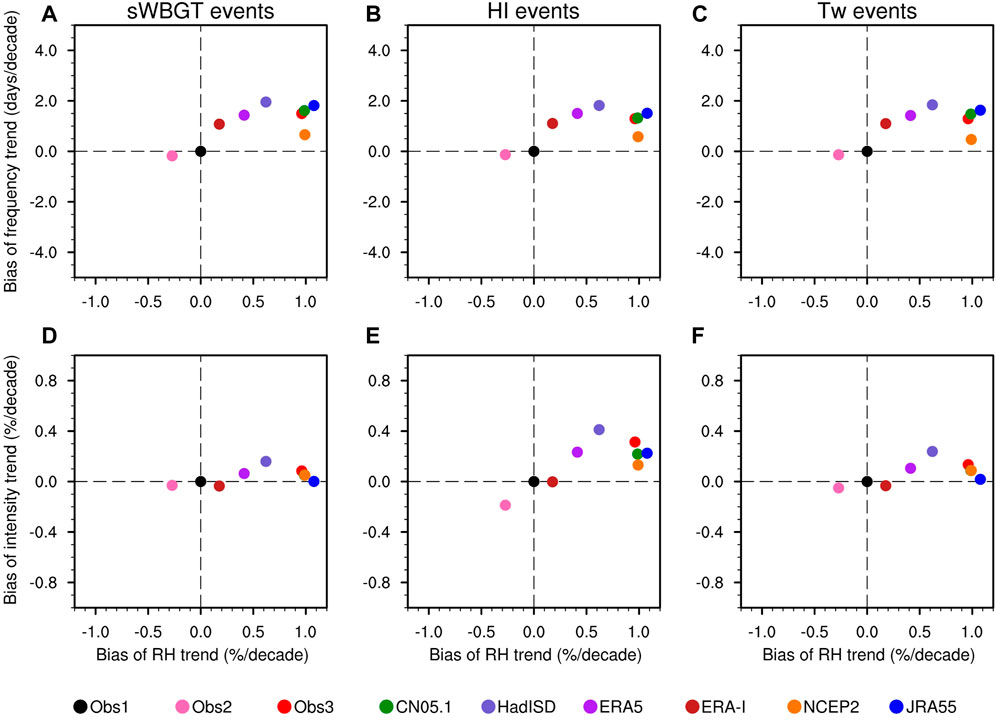
FIGURE 4. Scatter plot–between regional-mean (southeast China) RH trend bias and extreme events’ frequency (A–C)/intensity (D–F) trend bias, amongst inhomogeneous datasets with reference to homogenized one (OBS-1, black dot in the center).
Notably, despite significant negative correlation between air temperature and relative humidity at the regional scale, we did not find the cancellation or say compensation effect between greater warming and stronger RH reduction biases in the same dataset (Supplementary Figure S5) as reported in historical simulations and future projections (Fischer and Knutti, 2013), except for NCEP2 which shows the strongest negative correlation between the two variables. Rather, slightly weaker warming trends and drying bias in RH trends in tandem contribute to an underestimation of regional increases in humid-heat extremes in frequency and intensity, with the “out-of-range” RH bias (outside the grey shadings in Supplementary Figure S5) dominating in most datasets. Even for NCEP2 seemingly most faithfully reproducing extremes’ statistics, such better performance apparent arises from the wrong reason, and therefore should not be further leveraged as a reliable benchmark for model evaluation and impact quantification (Casanueva et al., 2019). Similar “right statistics for wrong reason” might exist at local scales where the T-RH anti-correlation is even stronger (e.g., <−.85).
When referring to extreme humid-heat conditions, the combination in a fashion of high temperature and high humidity comes to one’s mind first and naturally. But as a matter of fact, extreme humid-heat events represent a typical case that not all of its components are necessarily extreme, but their combination leads to an extreme impact (Zscheischler et al., 2018). Different forms of joint distributions of temperature and humidity during extreme humid-heat events are worth further sorting out, because they might cause distinct impacts on human health (Mora et al., 2017; Asseng et al., 2021).
Compared to humid-heat extremes previously identified by non-homogenized observations (OBS-3), counterparts from homogenized observations are similarly warm (mostly within the range of 25–33°C, Supplementary Figure S6) but not necessarily that moist, regardless of indicators selected (Figure 5). Quantitatively, we used to believe that the majority of extremes (around 60%–80% events across the region) occurred in the context of RH wetter than 70%; while subject to the homogenization correction, the understanding is revised into that the conventionally favorable thermodynamic environment host only half of extremes. Such a contrast in the RH constituent to extremes is also ubiquitous amongst other observation and reanalysis datasets (Supplementary Figure S7). In particular, though the bivariate distribution difference is largely determined by RH biases, the temperature difference also plays a non-trivial role in shaping the differential joint distribution structure in some datasets, e.g., ERA5 (Supplementary Figure S7E) and NCEP2 (Supplementary Figure S7G). In addition to the absolute magnitude for humid-heat extremes, the accurate mapping of typical bivariate configuration constituting the extremes, based on homogenized datasets, matters to identification of key thresholds for early warning against health-damaging events (Han et al., 2022; Vecellio et al., 2022). In light of the distinct bivariate distribution structures (Supplementary Figure S7) along with the harder-detectable inhomogeneity in the bivariate combined indices (e.g., Supplementary Figure S2, Tw), a component-wise bias correction technique might be superior to an “one-step” correction scheme with respect to the combined index, for both observations and simulations (Casanueva et al., 2019).
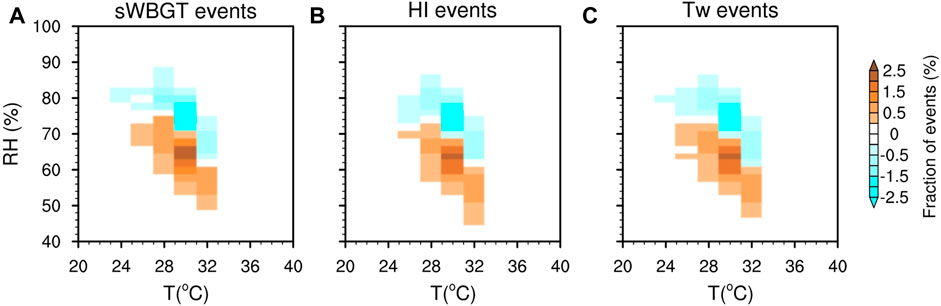
FIGURE 5. The difference (homogenized minus non-homogenized) in the bivariate joint distribution of T and RH which produce three type extreme events (A-C) of corresponding indicators. Temperature and humidity are firstly binned by 2°C and 2% intervals, and the fraction of extreme-producing (all cases during the study period across the domain) T-RH configurations that fall into corresponding bivariate bins are calculated and presented.
4 Discussion and conclusion
4.1 Discussion
We here addressed the issue of ubiquitous inhomogeneity of relative humidity in most observational and reanalysis datasets, with a specific focus on its influences on the estimate for changes in daily humid-heat extremes in China. We acknowledge that the intrinsic diurnal cycle of humid heat stress, resulting from quasi out-of-phase variations of air temperature and relative humidity (Fischer and Knutti, 2013), makes the daily-mean value conservative to represent daily maxima, the most concerning value to human health (Schär, 2016; Kang and Eltahir, 2018; Raymond et al., 2020). The current unavailability of homogenized hourly to sub-daily (e.g., 6-h) RH observations, however, prohibits us from moving forward in this regard (Wang and Sun, 2021), Our analysis clearly demonstrates that using sub-daily records from ERA-5 or raw HadISD observations to achieve the goal is problematic. As a result, efforts are badly needed to collect, quality-control and homogenize hourly temperature and relative humidity, to revisit and better inform changing risks of impact-relevant heat stress in the populous region, as well as in other vulnerable regions around the world.
The data inhomogeneity-caused bias in the estimate for past changes in humid-heat extremes would propagate into their future projections, as all of model validation, bias correction (Casanueva et al., 2019), selection (Ridder et al., 2022) and weighting scheme (Ribes et al., 2021) as well as the design of emergent constraints (Freychet et al., 2021) are contingent on thorough comparisons of historical simulations to observations. By leveraging homogenized RH records as an observational constraint, follow-up efforts are therefore worth extending into projection analyses, in terms of both magnitudes and width of the uncertainty range for projected frequency and intensity of humid-heat extremes.
To the other end of spectrum of T-RH configuration, low relative humidity combined with high temperatures aggravates risks for wildfire occurrence and agricultural impacts (Chiodi et al., 2021; Balch et al., 2022). The unrealistically strong drying trend for RH is expected to result in an overestimation of increasing fire risks, which also remains under-appreciated in the region because of little attention paid to hot-dry-fire compound events there for now.
5 Conclusion
We present the most comprehensive comparison to date on long-term changes in relative humidity across China, based on ∼10 widely-used observational and reanalysis datasets subject to different levels of homogenization. We report an artificially sharp decline in RH around 2000–2005 in most datasets due mainly to the massive transition from manual observation practices to automatic observations with observational instruments replaced at the time. The inhomogeneity issue stands out particularly stark in warm-moist southern China, leading to unrealistically strong and significant drying trends there.
The biased drying trends in these inhomogeneous datasets lead to underestimation of changes in humid-heat extremes, with a drying bias of 1% decade−1 attenuating the magnitude for increases in extremes’ frequency (intensity) by more than 1.2 days decade−1 (.07% decade−1) locally, regardless of metrics considered. For the region as a whole, these inhomogeneous records have underestimated domain-averaged frequency (intensity) of extremes by .47–1.95 days decade−1 (−.04%∼.41% decade−1). Humid-heat extremes identified by homogenized and non-homogenized datasets also differ in the T-RH joint anomalies, with most cases in the latter equivalently hot or slightly cooler yet discernably moister.
Our results call for emphasis on data quality of observed/reanalyzed relative humidity, not only in China but also in other parts of the world, and the need of re-evaluating past changes of humid-heat extremes to improve projections of deadly heat stress worldwide.
Data availability statement
The raw data supporting the conclusion of this article will be made available by the authors, without undue reservation.
Author contributions
YC designed the research; XL carried out most calculations and result interpretations, created all figures and wrote the original draft, further reviewed and edited by YC and YZ developed and provided the homogenized observation dataset, and took part in result discussion. NA and ZL participated in result discussion.
Funding
The research is financially supported by the National Key Research and Development Program of China (Grant No. 2018YFC1507700). The study is also supported by S&T Development Fund of CAMS (2021KJ014).
Acknowledgments
We thank the data developer, i.e., National Meteorological Information Center, for collecting, quality controlling, homogenizing and kindly providing the observational data.
Conflict of interest
The authors declare that the research was conducted in the absence of any commercial or financial relationships that could be construed as a potential conflict of interest.
Publisher’s note
All claims expressed in this article are solely those of the authors and do not necessarily represent those of their affiliated organizations, or those of the publisher, the editors and the reviewers. Any product that may be evaluated in this article, or claim that may be made by its manufacturer, is not guaranteed or endorsed by the publisher.
Supplementary material
The Supplementary Material for this article can be found online at: https://www.frontiersin.org/articles/10.3389/fenvs.2022.1104039/full#supplementary-material
References
ACSM (1984). Prevention of thermal injuries during distance running. Med. J. Aust. 141 (12-13), 876–879.
Asseng, S., Spänkuch, D., Hernandez-Ochoa, I. M., and Laporta, J. (2021). The upper temperature thresholds of life. Lancet Planet. Health 5 (6), e378–e385. doi:10.1016/S2542-5196(21)00079-6
Balch, J. K., Abatzoglou, J. T., Joseph, M. B., Koontz, M. J., Mahood, A. L., McGlinchy, J., et al. (2022). Warming weakens the night-time barrier to global fire. Nature 602 (7897), 442–448. doi:10.1038/s41586-021-04325-1
Brouillet, A., and Joussaume, S. (2019). Investigating the role of the relative humidity in the Co-occurrence of temperature and heat stress extremes in CMIP5 projections. Geophys. Res. Lett. 46 (20), 11435–11443. doi:10.1029/2019GL084156
Buzan, J. R., and Huber, M. (2020). Moist heat stress on a hotter earth. Annu. Rev. Earth Planet. Sci. 48 (1), 623–655. doi:10.1146/annurev-earth-053018-060100
Byrne, M. P., and O’Gorman, P. A. (2018). Trends in continental temperature and humidity directly linked to ocean warming. Proc. Natl. Acad. Sci. 115 (19), 4863–4868. doi:10.1073/pnas.1722312115
Byrne, M. P., and O’Gorman, P. A. (2016). Understanding decreases in land relative humidity with global warming: Conceptual model and GCM simulations. J. Clim. 29 (24), 9045–9061. doi:10.1175/JCLI-D-16-0351.1
Casanueva, A., Kotlarski, S., Herrera, S., Fischer, A. M., Kjellstrom, T., and Schwierz, C. (2019). Climate projections of a multivariate heat stress index: The role of downscaling and bias correction. Geosci. Model Dev. 12 (8), 3419–3438. doi:10.5194/gmd-12-3419-2019
China Climate Bulletin (2014). China climate Bulletin 2014. Beijing: China Meteorological Administration.
Chiodi, A. M., Potter, B. E., and Larkin, N. K. (2021). Multi-decadal change in western US nighttime vapor pressure deficit. Geophys. Res. Lett. 48 (15), e2021GL092830. doi:10.1029/2021GL092830
Dee, D. P., Uppala, S. M., Simmons, A. J., Berrisford, P., Poli, P., Kobayashi, S., et al. (2011). The ERA-Interim reanalysis: Configuration and performance of the data assimilation system. Q. J. R. Meteorological Soc. 137 (656), 553–597. doi:10.1002/qj.828
Delworth, T. L., Mahlman, J. D., and Knutson, T. R. (1999). Changes in heat index associated with CO2-induced global warming. Clim. Change 43 (2), 369–386. doi:10.1023/A:1005463917086
Diffenbaugh, N. S., Pal, J. S., Giorgi, F., and Gao, X. (2007). Heat stress intensification in the Mediterranean climate change hotspot. Geophys. Res. Lett. 34 (11), L11706. doi:10.1029/2007GL030000
Douville, H., Decharme, B., Delire, C., Colin, J., Joetzjer, E., Roehrig, R., et al. (2020). Drivers of the enhanced decline of land near-surface relative humidity to abrupt 4xCO2 in CNRM-CM6-1. Clim. Dyn. 55 (5), 1613–1629. doi:10.1007/s00382-020-05351-x
Douville, H., and Plazzotta, M. (2017). Midlatitude summer drying: An underestimated threat in CMIP5 models? Geophys. Res. Lett. 44 (19), 9967–9975. doi:10.1002/2017GL075353
Dunn, R. J. H., Willett, K. M., Ciavarella, A., and Stott, P. A. (2017). Comparison of land surface humidity between observations and CMIP5 models. Earth Syst. Dyn. 8 (3), 719–747. doi:10.5194/esd-8-719-2017
Dunn, R. J. H., Willett, K. M., Morice, C. P., and Parker, D. E. (2014). Pairwise homogeneity assessment of HadISD. Clim. Past 10 (4), 1501–1522. doi:10.5194/cp-10-1501-2014
Dunn, R. J. H., Willett, K. M., Parker, D. E., and Mitchell, L. (2016). Expanding HadISD: Quality-controlled, sub-daily station data from 1931. Geoscientific Instrum. Methods Data Syst. 5 (2), 473–491. doi:10.5194/gi-5-473-2016
Dunne, J. P., Stouffer, R. J., and John, J. G. (2013). Reductions in labour capacity from heat stress under climate warming. Nat. Clim. Change 3 (6), 563–566. doi:10.1038/nclimate1827
Fischer, E. M., and Knutti, R. (2013). Robust projections of combined humidity and temperature extremes. Nat. Clim. Change 3 (2), 126–130. doi:10.1038/nclimate1682
Freychet, N., Hegerl, G., Mitchell, D., and Collins, M. (2021). Future changes in the frequency of temperature extremes may be underestimated in tropical and subtropical regions. Commun. Earth Environ. 2 (1), 28. doi:10.1038/s43247-021-00094-x
Freychet, N., Tett, S. F. B., Yan, Z., and Li, Z. (2020). Underestimated change of wet-bulb temperatures over east and South China. Geophys. Res. Lett. 47 (3), e2019GL086140. doi:10.1029/2019GL086140
Han, Q., Liu, Z., Jia, J., Anderson, B. T., Xu, W., and Shi, P. (2022). Web-based data to quantify meteorological and geographical effects on heat stroke: Case study in China. GeoHealth 6 (8), e2022GH000587. doi:10.1029/2022GH000587
Hersbach, H., de Rosnay, P., Bell, B., Schepers, D., Simmons, A., Soci, C., et al. (2018). Operational global reanalysis: Progress, future directions and synergies with NWP, 27. doi:10.21957/tkic6g3wm
Hoag, H. (2014). Russian summer tops ‘universal’ heatwave index. Nature 2014, 16250. doi:10.1038/nature.2014.16250
ISO (1989). Hot Environments – estimation of the heat stress on working man, based on the WBGT-index (wet bulb globe temperature). Geneva: International Standards Organization. ISO 7243.
Kanamitsu, M., Ebisuzaki, W., Woollen, J., Yang, S.-K., Hnilo, J. J., Fiorino, M., et al. (2002). NCEP–DOE AMIP-II reanalysis (R-2). Bull. Am. Meteorological Soc. 83 (11), 1631–1644. doi:10.1175/BAMS-83-11-1631
Kang, S., and Eltahir, E. A. B. (2018). North China Plain threatened by deadly heatwaves due to climate change and irrigation. Nat. Commun. 9 (1), 2894. doi:10.1038/s41467-018-05252-y
Kobayashi, S., Ota, Y., Harada, Y., Ebita, A., Moriya, M., Onoda, H., et al. (2015). The JRA-55 reanalysis: General specifications and basic characteristics. J. Meteorological Soc. Jpn. Ser II 93 (1), 5–48. doi:10.2151/jmsj.2015-001
Kong, D., Gu, X., Li, J., Ren, G., and Liu, J. (2020). Contributions of global warming and urbanization to the intensification of human-perceived heatwaves over China. J. Geophys. Res. Atmos. 125 (18), e2019JD032175. doi:10.1029/2019JD032175
Li, C., Sun, Y., Zwiers, F., Wang, D., Zhang, X., Chen, G., et al. (2020a). Rapid warming in summer wet bulb globe temperature in China with human-induced climate change. J. Clim. 33 (13), 5697–5711. doi:10.1175/JCLI-D-19-0492.1
Li, D., Yuan, J., and Kopp, R. E. (2020b). Escalating global exposure to compound heat-humidity extremes with warming. Environ. Res. Lett. 15 (6), 064003. doi:10.1088/1748-9326/ab7d04
Li, Z., Yan, Z., Zhu, Y., Freychet, N., and Tett, S. (2020c). Homogenized daily relative humidity series in China during 1960−2017. Adv. Atmos. Sci. 37 (4), 318–327. doi:10.1007/s00376-020-9180-0
Liao, J., Wang, H., Zhou, Z., Liu, Z., Jiang, L., and Yuan, F. (2021). Integration, quality assurance, and usage of global aircraft observations in CRA. J. Meteorological Res. 35 (1), 1–16. doi:10.1007/s13351-021-0093-3
Luo, M., and Lau, N.-C. (2018). Increasing heat stress in urban areas of eastern China: Acceleration by urbanization. Geophys. Res. Lett. 45 (2313), 13060–13069. doi:10.1029/2018GL080306
IPCC (2021). “Chapter 3: Human influence on the climate system,” in Climate change 2021: The physical science basis, contribution of working group I to the sixth assessment report of the intergovernmental panel on climate change. Editors V. Masson-Delmotte, P. Zhai, A. Pirani, S. L. Connors, C. Pean, S. Bergeret al. (Cambridge University Press), 3–31. –3-33 In press Available at: https://www.ipcc.ch/report/sixth-assessment-report-working-group-i/.
Mora, C., Dousset, B., Caldwell, I. R., Powell, F. E., Geronimo, R. C., Bielecki, C. R., et al. (2017). Global risk of deadly heat. Nat. Clim. Change 7 (7), 501–506. doi:10.1038/nclimate3322
Raymond, C., Matthews, T., and Horton, R. M. (2020). The emergence of heat and humidity too severe for human tolerance. Sci. Adv. 6 (19), eaaw1838. doi:10.1126/sciadv.aaw1838
Ribes, A., Qasmi, S., and Gillett, N. P. (2021). Making climate projections conditional on historical observations. Sci. Adv. 7 (4), eabc0671. doi:10.1126/sciadv.abc0671
Ridder, N. N., Ukkola, A. M., Pitman, A. J., and Perkins-Kirkpatrick, S. E. (2022). Increased occurrence of high impact compound events under climate change. Npj Clim. Atmos. Sci. 5 (1), 3. doi:10.1038/s41612-021-00224-4
Rogers, C. D. W., Ting, M., Li, C., Kornhuber, K., Coffel, E. D., Horton, R. M., et al. (2021). Recent increases in exposure to extreme humid-heat events disproportionately affect populated regions. Geophys. Res. Lett. 48 (19), e2021GL094183. doi:10.1029/2021GL094183
Rothfusz, L. (1990). The heat index equation. Camp Springs, Maryland, USA: National Weather Service Technical Attachment, 23–90.
Saeed, F., Schleussner, C.-F., and Ashfaq, M. (2021). Deadly heat stress to become commonplace across south asia already at 1.5°C of global warming. Geophys. Res. Lett. 48 (7), e2020GL091191. doi:10.1029/2020GL091191
Schär, C. (2016). The worst heat waves to come. Nat. Clim. Change 6 (2), 128–129. doi:10.1038/nclimate2864
Schröder, M., Lockhoff, M., Shi, L., August, T., Bennartz, R., Brogniez, H., et al. (2019). The GEWEX water vapor assessment: Overview and introduction to results and recommendations. Remote Sens. 11 (3), 251. Article 3. doi:10.3390/rs11030251
Sherwood, S. C. (2018). How important is humidity in heat stress? J. Geophys. Res. Atmos. 123 (2111), 11808–11810. doi:10.1029/2018JD028969
Sherwood, S. C., and Huber, M. (2010). An adaptability limit to climate change due to heat stress. Proc. Natl. Acad. Sci. 107 (21), 9552–9555. doi:10.1073/pnas.0913352107
Smith, A., Lott, N., and Vose, R. (2011)., 92. JSTOR, 704–708. doi:10.1175/2011bams3015.1The integrated surface database: Recent developments and partnershipsBull. Am. Meteorological Soc.6
Speizer, S., Raymond, C., Ivanovich, C., and Horton, R. M. (2022). Concentrated and intensifying humid heat extremes in the IPCC AR6 regions. Geophys. Res. Lett. 49 (5), e2021GL097261. doi:10.1029/2021GL097261
Stull, R. (2011). Wet-bulb temperature from relative humidity and air temperature. J. Appl. Meteorology Climatol. 50 (11), 2267–2269. doi:10.1175/JAMC-D-11-0143.1
Tuholske, C., Caylor, K., Funk, C., Verdin, A., Sweeney, S., Grace, K., et al. (2021). Global urban population exposure to extreme heat. Proc. Natl. Acad. Sci. 118 (41), e2024792118. doi:10.1073/pnas.2024792118
Vargas Zeppetello, L. R., Raftery, A. E., and Battisti, D. S. (2022). Probabilistic projections of increased heat stress driven by climate change. Commun. Earth Environ. 3 (1), 183. doi:10.1038/s43247-022-00524-4
Vecellio, D. J., Wolf, S. T., Cottle, R. M., and Kenney, W. L. (2022). Evaluating the 35°C wet-bulb temperature adaptability threshold for young, healthy subjects (PSU HEAT Project). J. Appl. Physiology 132 (2), 340–345. doi:10.1152/japplphysiol.00738.2021
Wang, D., and Sun, Y. (2021). Long-term changes in summer extreme wet bulb globe temperature over China. J. Meteorological Res. 35 (6), 975–986. doi:10.1007/s13351-021-1080-4
Wang, P., Leung, L. R., Lu, J., Song, F., and Tang, J. (2019). Extreme wet-bulb temperatures in China: The significant role of moisture. J. Geophys. Res. Atmos. 124 (22), 11944–11960. doi:10.1029/2019JD031477
Wang, S., and Zhu, J. (2020). Amplified or exaggerated changes in perceived temperature extremes under global warming. Clim. Dyn. 54 (1), 117–127. doi:10.1007/s00382-019-04994-9
Wang, X. L. (2008b). Accounting for autocorrelation in detecting mean shifts in climate data series using the penalized maximal t or F test. J. Appl. Meteorology Climatol. 47 (9), 2423–2444. doi:10.1175/2008JAMC1741.1
Wang, X. L. (2008a). Penalized maximal F test for detecting undocumented mean shift without trend change. J. Atmos. Ocean. Technol. 25 (3), 368–384. doi:10.1175/2007JTECHA982.1
Willett, K. M., Dunn, R. J. H., Thorne, P. W., Bell, S., de Podesta, M., Parker, D. E., et al. (2014). HadISDH land surface multi-variable humidity and temperature record for climate monitoring. Clim. Past 10 (6), 1983–2006. doi:10.5194/cp-10-1983-2014
Willett, K. M., and Sherwood, S. (2012). Exceedance of heat index thresholds for 15 regions under a warming climate using the wet-bulb globe temperature. Int. J. Climatol. 32 (2), 161–177. doi:10.1002/joc.2257
Wu, J., and Gao, X. J. (2013). A gridded daily observation dataset over China region and comparison with the other datasets. Chin. J. Geophys. 56 (4), 1102–1111. doi:10.6038/cjg20130406
Xu, F., Chan, T. O., and Luo, M. (2021). Different changes in dry and humid heat waves over China. Int. J. Climatol. 41 (2), 1369–1382. doi:10.1002/joc.6815
Xu, W., Li, Q., Wang, X. L., Yang, S., Cao, L., and Feng, Y. (2013). Homogenization of Chinese daily surface air temperatures and analysis of trends in the extreme temperature indices. J. Geophys. Res. Atmos. 118 (17), 9708–9720. doi:10.1002/jgrd.50791
Yaglou, C. P., and Minard, D. (1957). Control of heat casualties at military training centers. Ama Arch. Ind. Health 16 (4), 302–316.
Yu, J., and Mu, R. (2008). Research on the cause of difference between AWS-and MAN-relative humidity observations. Met. EOROLOGICAL Mon. 34 (12), 96–102. In Chinese. (with English abstract).
Zhang, J., Zhao, T., Li, Z., Li, C., Li, Z., Ying, K., et al. (2021). Evaluation of surface relative humidity in China from the CRA-40 and current reanalyses. Adv. Atmos. Sci. 38 (11), 1958–1976. doi:10.1007/s00376-021-0333-6
Zhu, Y. N., Cao, L., Tang, G., and Zhou, Z. (2015). Homogenization of surface relative humidity over China. Clim. Change Res. 11 (6), 379. In Chinese. (with English abstract).
Keywords: humid-heat extremes, data inhomogeneity, relative humidity, drying bias, multivariate compound events
Citation: Li X, Chen Y, Zhu Y, Shi Y, An N and Liao Z (2023) Underestimated increase and intensification of humid-heat extremes across southeast China due to humidity data inhomogeneity. Front. Environ. Sci. 10:1104039. doi: 10.3389/fenvs.2022.1104039
Received: 21 November 2022; Accepted: 23 December 2022;
Published: 10 January 2023.
Edited by:
Ming Luo, Sun Yat-sen University, ChinaReviewed by:
Chao Li, East China Normal University, ChinaGuojie Wang, Nanjing University of Information Science and Technology, China
Copyright © 2023 Li, Chen, Zhu, Shi, An and Liao. This is an open-access article distributed under the terms of the Creative Commons Attribution License (CC BY). The use, distribution or reproduction in other forums is permitted, provided the original author(s) and the copyright owner(s) are credited and that the original publication in this journal is cited, in accordance with accepted academic practice. No use, distribution or reproduction is permitted which does not comply with these terms.
*Correspondence: Yang Chen, ychen@cma.gov.cn