Could Green Technology Innovation Help Economy Achieve Carbon Neutrality Development–Evidence From Chinese Cities
 Zhengning Pu
 Jingyu Liu
 Mingyan Yang
- School of Economics and Management, Southeast University, Nanjing, China
China’s 12th Five-Year Plan emphasizes green technological advances in energy conservation, which provides a feasible quasi-natural experimental node to study the role of green technological innovation in influencing the achievement of carbon neutrality. The difference-in-difference model examines whether China’s electricity consumption efficiency has improved since the 12th Five-Year Plan and reveals the role of green technology innovation in this process. Specifically, this paper takes 216 cities in China from 2003 to 2016 as the study sample, the midpoint between China’s 11th and 12th Five-Year Plans as the quasi-natural starting point, and uses the top 50 cities in terms of the number of listed companies as the quasi-natural experimental group. The results show that China’s electricity consumption efficiency has improved significantly since the 12th Five-Year Plan, supported by different robustness tests. The mechanism analysis finds that green technology innovation positively affects energy efficiency but is not the best option for cities with many listed companies. Cities with many listed companies can achieve energy savings by adjusting their industrial structure. Energy conservation and emission reduction policies should be formulated according to the city’s situation and give full play to green technology progress and industrial transformation and upgrading, which is of great significance to achieving carbon neutrality.
1 Introduction
Since the beginning of the 11th Five-Year Plan (FYP)1, China has targeted decreasing energy consumption to make the completion of the target an assessment target for local governments at all levels. The nation wishes to control energy consumption’s momentum through structural adjustment, adoption of advanced energy-saving/low-carbon technologies, and elimination of backward production capacity. During the 11th FYP, China set a “reduction of energy consumption per unit of GDP by about 20%” as an essential binding target. However, although the goal was reached, China still faces international pressure for its carbon emission. During the COP15 Copenhagen hold in 2009, developing countries, including China, were required to take responsibility for global carbon emissions.
In order to implement domestic carbon reform while responding to international calls for China to take on more responsibility, the 12th FYP period, starting from 2011, became the most important period for the development of the environment in China. Since industrialization and urbanization were further accelerated, and energy demand increased rigidly, resource and environmental constraints became prominent. Therefore, during the 12th FYP, the implementation of energy-saving and carbon emission reduction targets in China was further strengthened under more green technology innovations and industry structure modifications. Total control measures were implemented, resulting in remarkable energy-saving and carbon emission reduction results. As statistical data shows, China’s energy conservation and emission reduction targets for the 12th FYP period are to reduce energy consumption per unit of GDP by 16%, control total energy consumption at around 4 billion standard coal equivalents, and increase the proportion of non-fossil energy consumption to 11.4%.
The proposal of energy saving, emission reduction targets, and dual carbon targets is a solid initiative to address climate change in China and brings opportunities and challenges to the development of the electricity consumption field. As a critical industry for energy saving and carbon reduction, electricity and electricity efficiency have received widespread attention (Figures 1, 2, 3). In this regard, three requirements set out in the 12th FYP for energy efficiency are related to increasing industrial electricity consumption. Specifically, first, the 12th FYP proposes to implement targets and responsibilities. The 12th FYP took regional economic development, industrial structure, and energy-saving potential into full consideration, determined the energy-saving targets according to each region’s condition, and improved the evaluation and assessment methods. Second, the 12th FYP proposes to increase structural adjustment efforts. The 12th FYP encourages the development of service and high-tech industries, actively developing energy-saving, environmental protection, new energy, and other strategic new industries to adjust energy consumption structure and increase the proportion of non-fossil energy. Finally, the 12th FYP proposes to promote technological progress, especially green technology progress in energy conservation. The proposal includes accelerating the implementation of key energy-saving renovation projects, energy-saving technology industrialization demonstration projects, energy-saving products for the people projects, and contract energy management promotion projects.
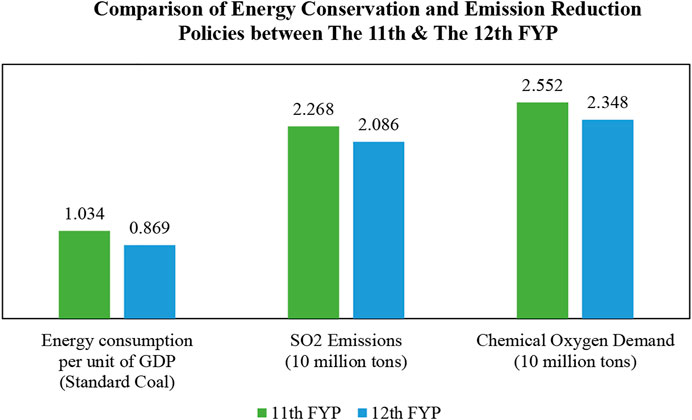
FIGURE 1. Policy comparison between the 11th and the 12th FYP2.
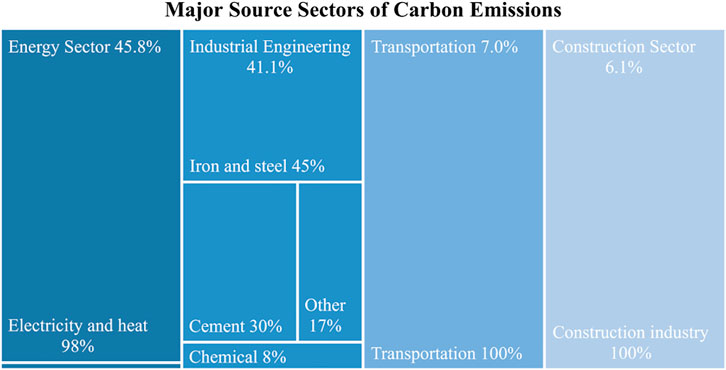
FIGURE 2. Major source sectors of carbon emissions3.
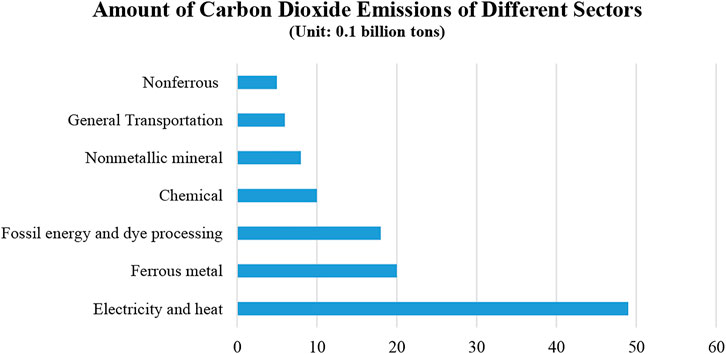
FIGURE 3. Amount of carbon dioxide emissions of different sectors4.
Given China’s very different carbon reduction performance at the end of the 11th Five-Year Plan and the end of the 12th Five-Year Plan, the timeframe at the end of 11th FYP and the start of 12th FYP provides a possible quasi-natural experimental cut-off point for discussing the carbon reduction effects of green technological innovation in the energy sector, particularly in the power sector. Hence, this paper investigates whether the efficiency of electricity consumption in China has improved since the 12th FYP. The paper also examines how key factors such as technology innovation helped to improve such a process and hopes to clarify whether technology innovation, especially green technology innovation, could help the economy achieve carbon neutrality development.
Using the city-level data in China from 2003 to 2016, this paper examines whether China’s electricity consumption efficiency has improved since the 12th Five-Year Plan by a difference-in-difference model. The results show that the electricity consumption efficiency has improved significantly, and the influential mechanism is explored as well. The main contributions of this paper can be summarized in the following aspects. First, this paper looks at the policy implications of a critical development period in China. The 12th FYP period is the most important period for environmental protection and an important stage in China’s development from middle-income to middle-developed. This paper gives a reference evaluation of the response by Chinese cities to the policy during the 12th FYP period. Second, the impact and mechanism on electricity efficiency by energy conservation and emission reduction policies are explored. Instead of carbon emissions and electricity consumption, this paper pays more attention to electricity efficiency. On the one hand, improving energy efficiency is more meaningful than simply reducing energy consumption. On the other hand, studies on reducing carbon emissions cannot distinguish between reductions in energy consumption and improvements in emissions treatment technologies. Therefore, this paper innovatively selects energy efficiency (i.e., GDP per electricity consumption) as the research object. Third, in the natural experiment of this paper, cities with more listed companies are treated as the treatment group that is affected more by stringent policies, which allows the paper to explore policy impacts at the macro level and inform micro-level research on firms policies.
The paper is structured as follows. Literature Review Section reviews the previous literature. Data and Methodology Section describes the data and sets up the model, while Results Section reports the results. Conclusion and Policy Implications Section concludes and comes up with policy suggestions.
2 Literature Review
As an important topic in the context of carbon peaking and carbon neutrality, the policy’s impact on electricity efficiency and its effective mechanism has attracted the attention of many scholars. The related research can be divided into two main categories: electricity efficiency and environmental policy. The literature on electricity efficiency mainly discusses the measurement approach and influential factors of electricity efficiency. Furthermore, the studies concerned with environmental policy’s impact are explored in green innovation, residential electricity consumption, building energy efficiency, and electricity efficiency at the utility or firm level.
2.1 Electricity Efficiency
Electricity efficiency has received growing attention as a key component of sustainable development to tackle energy security and poverty while addressing climate change concerns (Voigt et al., 2014). According to Lin and Zhu (2020), the measurement approach of electricity efficiency in current research can be divided into three main categories. First, single factor indexes are widely used to represent energy efficiency, such as the energy intensity, calculated by dividing the total energy consumption by real GDP (Liddle, 2010; Lin and Zhu, 2017; Voigt et al., 2014). Second, a nonparametric Data Envelopment Analysis (DEA) method is adopted to estimate energy efficiency. DEA, a nonparametric method, applies linear programming to determine the efficiency of firms without assuming a functional form of the production function. Third, the Stochastic Frontier Analysis (SFA) model is popular in recent years. SFA is a parametric method that applies statistical analysis to examine efficiency while controlling environmental factors (Li et al., 2019). This paper adopts the single factor indexes and defines electricity efficiency as the ratio of electricity use and gross output by following Voigt et al. (2014).
In addition to the measurement approach, influential factors have also attracted the attention of many scholars. Existing studies show that a great variety of factors can affect electricity efficiency, including technology, industrial structure, economic development level, population density, fiscal decentralization level, and urbanization level (Wu, 2012; Zhang et al., 2017; An et al., 2020; Lin and Zhu, 2020; Sun et al., 2021a; Sun et al., 2021b). Among them, industrial structure and technological progress are two key factors that are effective in reducing electricity consumption (Yu, 2012; Jiang et al., 2014; Jiang et al., 2015). Voigt et al. (2014) analyze regional and global energy intensity trends by using mean Divisia index decomposition, and the results show that increases in energy efficiency can be due to the use of more efficient production technologies and newer vintages of capital equipment or to changes in the structural composition of the economy (a shift towards less energy-intensive sectors).
Most scholars investigate the influence of green technological innovation on electricity consumption, and conclusions are not consistent. On the one hand, some scholars believe that technological progress could directly improve energy efficiency by improving the performance of production tools, developing new electricity-saving products, and reducing the electricity loss in the process of power transmission (Ho et al., 1999; Zhang, 2003; Li et al., 2013; An et al., 2020). On the other hand, some scholars thought that technological innovation might not increase energy efficiency directly. Using business data from China (2008–2014), Yin et al. (2018) find that the level of technical innovation has an inverted U-shaped effect on the electricity consumption of industrial enterprises. Lin and Zhao (2016) also proved a nonlinear relationship between technological progress and energy consumption. Specifically, they find that initial technological innovation would promote the reduction of energy consumption, and there would be a rebound effect when it crossed a certain threshold. Some scholars studied the interaction between technological innovation and industrial structure when they impact electricity efficiency. Rostow (1991) gave the analysis from a theoretical point of view and believed that technological innovation might also indirectly affect energy consumption by upgrading industrial structures. Voigt et al. (2014) also shed light on the interplay between structural and technological effects. Empirical results in the pieces of literature above demonstrated that green technology innovation should be considered an important, influential factor for electricity consumption and electricity efficiency.
Similarly, there is also a substantial body of literature on whether the industrial structure can curb electricity efficiency. With the theoretical framework of Newell et al. (1999), the structural adjustment from heavy to light industry is considered to reduce the energy consumption intensity and thus improve energy efficiency at a constant output level. As for the empirical works, van Megen et al. (2019) showed that changes in structure-corrected energy intensity were the main reasons for changes in electricity consumption in Switzerland, while Al-Bajjali and Shamayleh (2018) found that the structure of the economy in Jordan was significantly and positively related to electricity consumption. Similar results have also been found in Ahmed and Zeshan (2014) and Narayanan and Sahu (2014) for cases in Pakistan and India, respectively. In the case of China, Zhang et al. (2019) revealed that industrial sectors played a significant role in decoupling in China. Lin and Zhu (2020) also provide empirical results on improving the electrification level in line with the electricity substitution policy proposed by China in recent years. Although most of the literature above believes that an increase in the share of the tertiary sector can lead to an increase in energy efficiency, another view is that this effect holds only to a certain extent (Li and Lin, 2014). Therefore, it is necessary to explore further whether the industrial structure can contribute to electricity efficiency.
On the one hand, most of the literature focuses on the impact of technological innovation and industrial structure on energy consumption. Only a small portion is on electricity as an energy source and even less on electricity efficiency (rather than electricity consumption). On the other hand, there is no consensus in the past literature on whether the impact of technological innovation and industrial structure on electricity efficiency is positive or negative. Therefore, in the light of the previous literature, this paper further explores the mechanism by which policy affects electricity efficiency based on the study of policy impact, i.e., whether policy affects electricity efficiency by influencing technological innovation or industrial structure.
2.2 Environmental Policy
The policy impact on energy efficiency is an issue that has long been discussed. Scholars have discussed this issue from different aspects.
First, the empirical literature investigating the role of policies in eco-innovation activities is extensive. Using a dataset covering 23 OECD countries over the period 1990–2010, Costantini et al. (2017) provide an empirical investigation of the positive role of the policy mix in inducing innovation in energy efficiency technologies. Also, Nesta et al. (2014) explore the effect of environmental policies on innovation by using information regarding renewable energy policies, competition, and green patents for OECD countries since the late 1970s.
Second, several empirical studies have analyzed the effectiveness of policies in the residential sector or the electricity efficiency of buildings (Buck and Young, 2007; Filippini and Hunt, 2012; Filippini et al., 2014; Ramos et al., 2016; Marin and Palma, 2017). By reviewing 192 publications from January 2015 to June 2020, Sanchez-Escobar et al. (2021) conclude the contribution of bottom-up energy models to support policy design of electricity end-use efficiency for residential buildings and the residential sector. In the case of China, Lin and Zhu (2021) measure the energy efficiency and direct rebound effect of residential electricity consumption from the energy efficiency-related policies based on data from CHFS over the period 2010 to 2018.
Third, the policy impacts were also discussed from the aspect of firms or electricity utilities. Using a unique firm-level dataset from 2010 to 2014, Li et al. (2019) examine the electricity utilities’ production efficiency under the sustainable development policy reform. Also, Ying Lee et al. (2019) investigate the economic impact of an energy penalty policy on electricity-intensive firms in Ghana. By using a regression discontinuity design (RDD) to the panel data from 1994 to 2012, the results indicate that small- and medium-voltage firms are economically vulnerable to the penalty policy in the long run. In the case of China, Bi et al. (2014) examine whether environmental regulation affects the energy efficiency of China’s thermal power generation, and the results show prominent geographical characteristics. Policy impacts at the firm-level or plant-level are also investigated in other influential works (Barabutu and Lee, 2018; Ma and Zhao, 2015; Sueyoshi and Goto, 2011; Zhang et al., 2014).
In summary, previous studies have mainly explored the effects of environmental policies on green innovation, residential electricity consumption, building energy efficiency, and electricity efficiency at the utility or firm level. However, residential electricity consumption accounts for a small part (13.04% in 2015) of China’s total electricity consumption (Lin and Zhu, 2021). Most of the electricity consumption is consumed during the production process of industrial sectors. Thus it is undoubtedly vital to analyze the industrial electricity consumption efficiency. At the same time, past studies have tended to select policies that can be easily quantified (e.g., subsidiarity), leaving a relative lack of research related to the effects of policies that cannot be easily quantified. Therefore, there is a lack of research on the impact of policy implementation on electricity efficiency in the industrial sector, especially concerns about the policy environment during the 12th FYP period. This paper is willing to investigate whether electricity consumption in China has improved since the promulgation of the Outline of the 12th FYP.
3 Data and Methodology
3.1 Model
Since industrial energy consumption (e.g., industrial electricity consumption) and pollutants are mainly generated industrial by companies, not households or individuals, environmental policy is ultimately a policy for those companies in cities instead of cities per se. When environmental policy constraints or incentives impact cities, the authorities often start by regulating those listed companies. Such implication is because listed companies tend to have more significant disclosure obligations and greater corporate social responsibility, thus are affected by stricter supervision and leading the way for other companies. That is to say, the city with more listed companies is supposed to have better policy results. Therefore, this paper assumes that, after implementing the 12th FYP in 2010, the cities with more listed companies improved their electricity efficiency.
Furthermore, this paper provides further insight into the policy’s impact on electricity efficiency. Since the level of electricity consumption varies significantly among different industries, an industry structure change from energy-intensive to energy-saving optimization will affect the consumption of electric power resources (Shi et al., 2022). Meanwhile, power-saving technology innovation is one of the main factors restraining electricity consumption growth. Therefore, this paper assumes that the 12th FYP policy affects electricity efficiency by two factors: industrial structure and technological innovation. More specifically, whether these two moderating factors have a positive or negative effect on the impact of the policy is unknown.
A natural experiment was conducted in this paper using the Difference-in-difference (DID) model to test the hypothesis above. DID models were used to measure the impact of intervention through the difference between group and time. A DID model combines these two kinds of differences, excludes the influence of factors other than the intervention factors on the results to a certain extent, and effectively solves the problem posed by the incomplete randomization of natural experiments (Liu et al., 2021). Therefore, DID models have been widely used to evaluate policy effects. Therefore, a DID model was used to more effectively reflect the effect of the 12th FYP on the GDP capacity per unit of electricity consumption of a city.
The model set was as follows:
In Eq. 1, the explained variable Yit is used to measure the level of capacity per unit of electricity consumption of a city. This variable is expressed as the ratio of GDP divided by industrial electricity consumption (GDP_ELE).
Treatedi is a dummy variable for the treatment group (Treatedi = 1 if city i is among the top 50 cities in terms of the number of listed companies; Treatedi = 0, if-else) and is used to describe the difference between the treatment group and the control group. Postt is a time dummy variable [Postt = 1 when t is after the 12th FYP (2010); Postt = 0, when t is before the 12th FYP] and used to describe the difference between the two phases before after the experiment. Treatedi * Postt is an interaction term used to measure the policy effect of the experimental group. The coefficient β1 is of primary interest, and the estimated sign of β1 is supposed to be positive. εit is a random perturbation term. Figures 4, 5 plot the average GDP and electricity consumption, respectively.
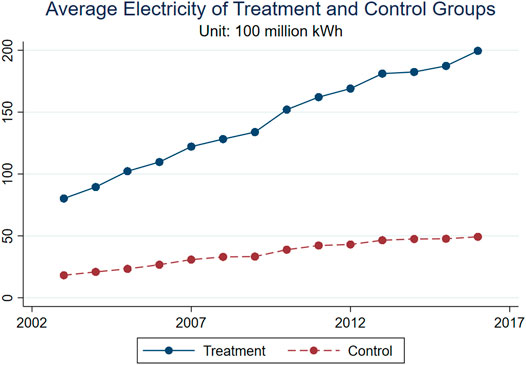
FIGURE 4. Average electricity consumption of treatment and control groups.
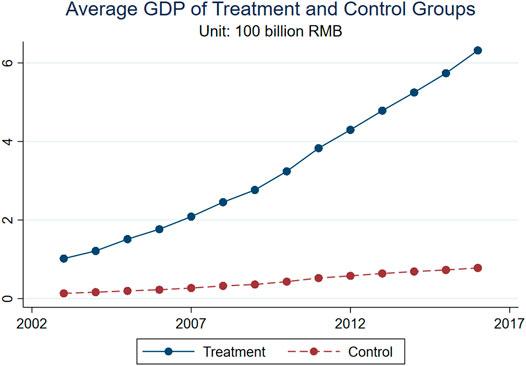
FIGURE 5. Average GDP of treatment and control groups.
This paper also includes a series of indicators that affect electricity efficiency as control variables, Xt, as shown in Table 1. Specifically, according to Cheng et al. (2021), a high degree of fiscal decentralization is necessary for improving the environment. The fiscal decentralization level (FD) is obtained by calculating the proportion of the fiscal revenue of a city in total GDP. Also, socio-demographic factors such as population density (POPU_DEN) and urbanization level (MOD) have an impact on the GDP and thus make a difference in electricity efficiency (Wang et al., 2018). Meanwhile, following Liu et al. (2021), industrial structure (IS) and Economies of scale level (SCALE) are treated as control variables for the industrial condition.
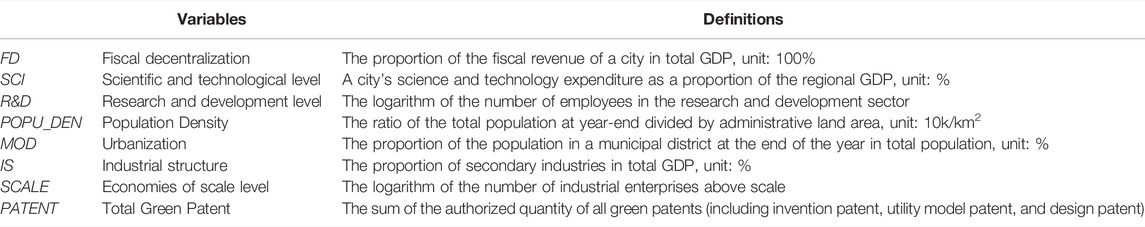
TABLE 1. Definitions of control variables.
Furthermore, referring to Guo et al. (2018), the degree of government R&D funding and R&D staff also make a difference in energy efficiency. Thus, the Scientific and technological level (SCI) and research and development level (R&D) are controlled. Also, following Lin and Zhu (2020), socio-demographic factors like population density (POPU_DEN) and urbanization level (MOD) are controlled as well. At last, technological innovation is also pointed out to increase productivity and reduce the amount of electricity used per unit of GDP output (Cheng et al., 2021). Therefore, this paper uses the number of green patents (PATENT) to denote environmental and technological innovation.
3.2 Data
This paper adopts the city-level panel data from 2003 to 2016 to estimate whether the efficiency of electricity consumption in China has improved since the 12th FYP. The city-level socio-economic and socio-demographic data are collected from China City Statistical Yearbook. The data on Carbon dioxide emission is collected from the Carbon Emission Accounts & Datasets (CEADs). The data on the Total Green Patent get are collected from the Chinese Research Data Service Platform (CNDRS).
The descriptive statistical results of the main variables for the 216 cities studied in this paper are shown in Table 2. The level of capacity per unit of electricity consumption of a city (GDP_ELE) has a mean of 20.6178, which means that an average of 20.6 yuan of GDP will be generated for every Kilowatt-hour (kWh) of electricity consumption. Moreover, the value of GDP_ELE ranges from 1.1489 to 545.5433, indicating the significant disparities in electricity efficiency across Chinese cities.
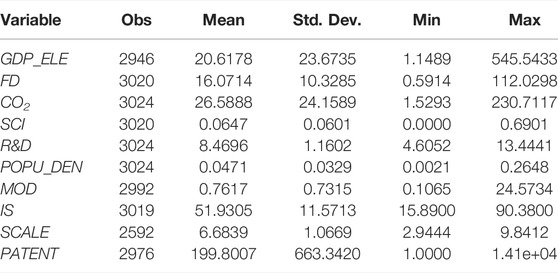
TABLE 2. Descriptive statistics.
The grouping statistics are shown in Table 3. The treatment group consists of cities with more listed companies, and the control group consists of other cities with fewer listed companies. Among all the variables, only the descriptive statistics for carbon dioxide emission (CO2) and the number of green patents (PATENT) show a wide gap between the two groups. The treatment group emitted almost 250% more CO2 than the control group, while they had nearly 14 times as many green patents as the control group. The average GDP_ELE in the treatment group is 23.6465, higher than 19.7856 in the control group, indicating that the electricity efficiency of those cities with more listed companies is slightly higher. Otherwise, the descriptive statistics of the variables except CO2 and PATENT do not differ a lot between the two groups.
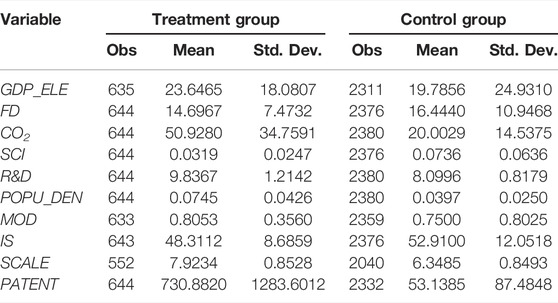
TABLE 3. Grouping statistics of the main variables.
4 Results
4.1 Baseline Regression
In order to investigate whether the implementation of the 12th FYP imposes a significant impact on the capacity per unit of electricity consumption of a city, a fixed-effect panel regression approach is adopted based on the empirical model (1). Corresponding estimates and statistics are shown in Table 4. The control variables are gradually added from columns (1) to (5). The coefficients of did are all significantly positive at the level of 1%, which indicates that the implementation of the 12th FYP has a significant positive impact on the capacity per unit of electricity consumption of a city.
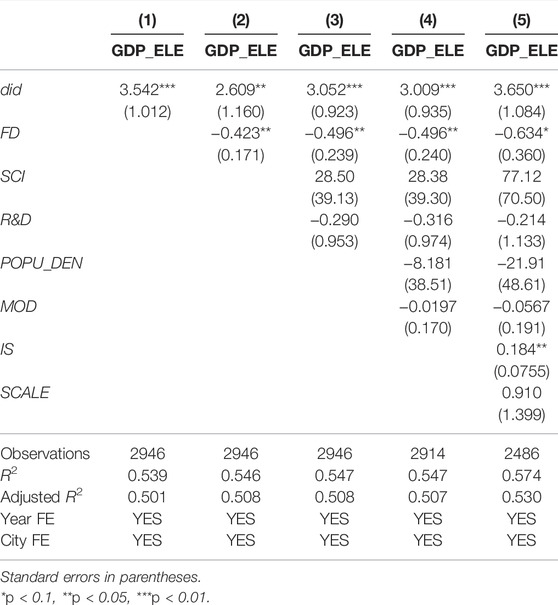
TABLE 4. Results of the baseline regression.
In column (5), the coefficient of did is 3.65, indicating that after implementing the 12th FYP, there is an increase in GDP per unit of electricity consumption of a city in the treatment group. The significant improvement in electricity efficiency since the 12th FYP is due to two main factors. On the one hand, the 12th FYP policy has increased the pressure on local governments to control energy consumption, especially to control electricity consumption. The 12th FYP period is the most important period for the development of the environment, so the implementation of energy-saving and emission reduction targets and stricter control standards were further strengthened in the Outline of the 12th FYP. It can be said that China’s requirements for energy efficiency in the 12th FYP period are a step up from the 11th FYP.
On the other hand, listed companies have a more remarkable ability and greater incentive to promote energy efficiency, making for better policy outcomes in cities with more listed companies. To achieve short-term results, local government officials have imposed stricter regulatory measures on those listed companies, resulting in the first motivation to improve the energy efficiency of those companies. Meanwhile, since the listed companies are supposed to disclosure more information, including their contribution to the energy-saving and environmental protection, than the other companies, stakeholders’ interest in this information and the positive benefits from these positive comments lead the listed companies to be more motivated to save energy and reduce emissions. Additionally, the ultimate purpose of the 12th FYP is not only to set constraints on electricity consumption but also to encourage economic growth (GDP). The improvement in electricity efficiency is what the 12th FYP drives. Listed companies usually have more advanced technology and develop new technologies, which gives them a more vital corporate social responsibility. As a result, listed companies are more effective in improving energy efficiency due to policy facilitation, meaning that they usually have a more remarkable ability to save on the cost of energy consumption while maintaining output.
Apart from that, the level of Fiscal decentralization has a negative impact on the explained variable, while the level of industrial structure has a positive impact on the explained variable. The former may be because the free-rider behavior among jurisdictions deteriorates the environmental quality due to an increasing degree of FD, which is consistent with the conclusion of Sigman (2014). The industrial structure (the proportion of secondary industry and tertiary industry) has a significant positive impact on capacity, which may be due to the higher proportion of secondary industry could generate more GDP than the other two industries.
4.2 Robustness Test
4.2.1 Parallel Trend Test
The underlying identification assumption for DID models is that the pre-treatment trends in the explained variable for the treatment and control groups are parallel. We test this assumption by including a set of leads and lag(s) of the policy implementation. The model was set as follows.
In Eq. 2, the explained variable Dit is a time dummy that takes 1 when t = 2010 + j, and βj is the corresponding coefficient. The other variables take the same meaning as in Eq. 1.
The estimated coefficients and their corresponding 95% confidence intervals are plotted in Figure 6, showing the parallel trend test results for the DID model. The results show that the coefficients were not significant until 2010 (the policy year). There was no significant difference between the treatment and control groups before the policy implementation; after 2010, most estimated coefficients were significant. Therefore, the results indicate that the overall capacity per unit of electricity consumption in the treatment and control groups had similar trends before 2010; thus, the parallel trend assumption in this DID model setting is accepted.
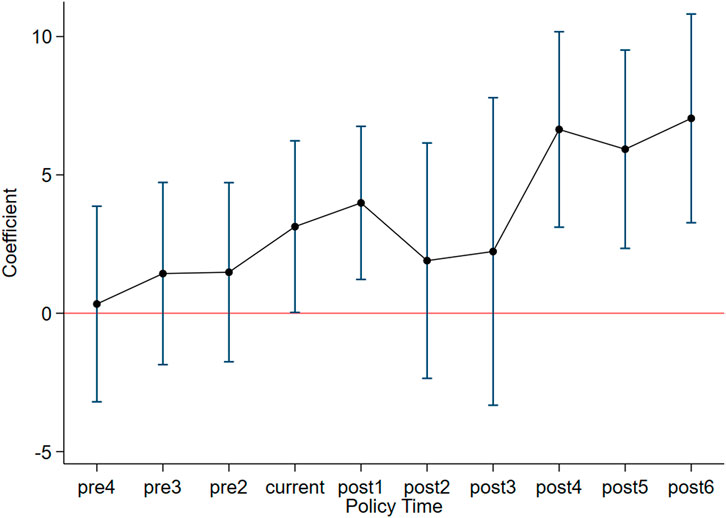
FIGURE 6. Parallel trend test.
4.2.2 Placebo Test
Referring to La Ferrara et al. (2012) and Li et al. (2016), a placebo test was also used in this study. This paper constructs a time-city randomized experiment by randomly selecting the experimental group of cities and generating the policy time; thus, a two-level randomized experiment was constructed accordingly.
Next, we run regressions according to the baseline model in Eq. 1, and the reliability of the findings was judged based on the probability of obtaining the estimated coefficients of the baseline regression from the spurious experiment. To further enhance the validity of the placebo test, the above procedure was repeated 500 times, and finally, the distribution of the estimated coefficients of did plot in Figure 7.
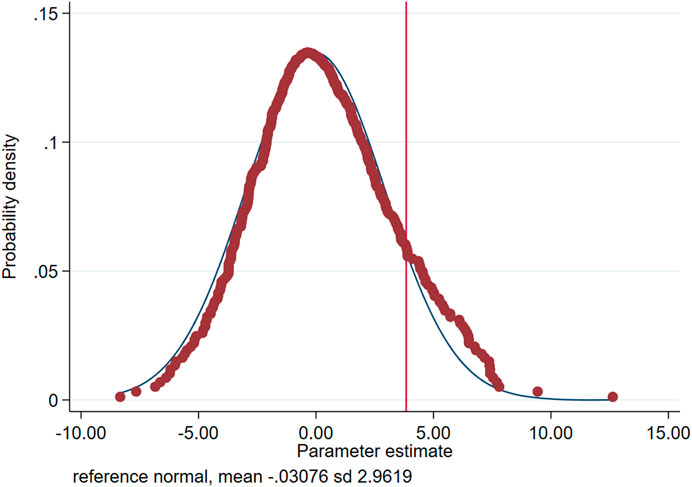
FIGURE 7. Placebo test.
If the distribution of the estimated coefficients under the randomization treatment is around 0, sufficiently important influences have not been omitted from the model set. In other words, the effects in the baseline analysis are indeed the result of the policy occurrence of interest in this paper. As shown in Figure 7, the spurious estimated coefficients of did in this placebo test are concentrated around 0 [roughly follows a normal distribution of N(−0.03, 2.962)], indicating that there is no significant omission of variables in the model setting and that the core findings remain robust.
4.2.3 Replace Explanatory Variables
The explained variable in the baseline regression means the capacity per unit of electricity consumption and the savings in electricity consumption. Since a city’s carbon emissions are closely linked to its energy consumption, this paper introduces the GDP generation per unit of carbon dioxide emission as a replacement explanatory variable to test the robustness of the results. Table 5 reports the estimates and statistics results of this replacement explanatory variable, and the control variables are gradually added from columns (1) to (5).
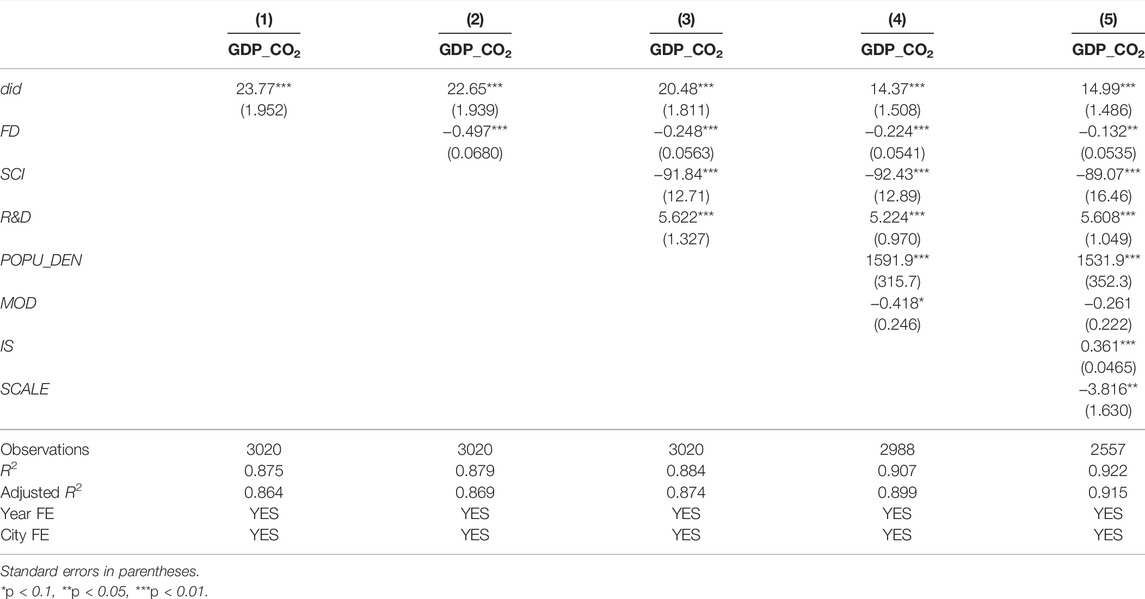
TABLE 5. Results of GDP per unit carbon dioxide emission as the explanatory variable.
The coefficients of did are all significantly positive at the level of 1%, which indicates that the implementation of the 12th FYP has a significant positive impact on the capacity per unit of carbon emission of a city. In column (5), the coefficient of did in the regression of all control variables is 14.99, indicating that after implementing the 12th FYP, there is an increase in a city’s GDP per unit carbon emission.
In addition, a range of control variables is significant at the level of 1% under this regression. Control variables, including the fiscal decentralization level, scientific and technological level, urbanization level, and economies of scale level, have a negative impact on the explained variable. In contrast, the level of research and development, population density, and industrial structure positively impact the explained variable.
4.2.4 Exclude Extreme Values
This paper regressed the data after excluding the 1 and 5% extreme observations from the sample according to the dependent variable for considering the possible impact of extreme values. The regression results are shown in Table 6. Columns (1) and (2) show the results of 1% extreme observations exclusion, while columns (3) and (4) show the results of 5% extreme observations exclusion.
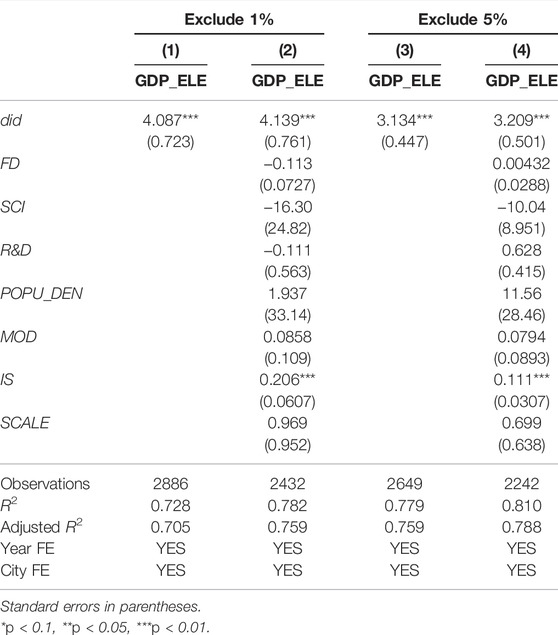
TABLE 6. Results of excluding the 1 and 5% extreme observations.
The coefficients of did are all significantly positive at the level of 1% as well after excluding 1% extreme observations, the coefficient of interest increases, while it decreases a little after excluding 5% extreme observations. They indicate that the influence of the extreme observations is negligible and that the estimation results of the baseline regression are robust.
4.2.5 Exclude Observations
According to the Statistical Yearbook of Urban Construction (2019), published by the Ministry of Housing and Urban-Rural Development at the end of 2020, six megacities in China, including Shanghai, Beijing, Chongqing, Guangzhou, Shenzhen, and Tianjin. Since the GDP and electricity of those megacities are always much more massive than the others, those observations may impact the final coefficients as well. Therefore, we also run a regression without those six megacities to estimate the results’ robustness. Table 7 reports the corresponding results. The regression coefficient did remain positive and significant; thus, this robustness test also passed.

TABLE 7. Results of excluding six megacities.
4.3 Mechanisms Analysis
A mediation effect model is applied to understand how the 12th FYP policy affects electricity efficiency. As assumed before, the 12th FYP policy affects electricity efficiency through industrial structure and technological innovation.
In terms of industry structure, Shi et al. (2022) point out in their study that, on the one hand, when the continuous industrialization process has promoted the consolidation and enhancement of China’s industrial industry, which is the main source of electricity consumption, a significant increase exist in electricity consumption. Thus the impact of industrial structure on electricity consumption is positive; on the other hand, when China emphasizes industrial structure optimization and adjustment (i.e., shifting the industrial structure domination from high energy-consuming industries to green industries), the impact of the change in industrial structure on electricity consumption is inhibited. Therefore, when we discuss the efficiency of electricity consumption (i.e., GDP per unit of electricity consumption), it becomes even more ambiguous whether the moderating effect of industrial structure is positive or negative.
Scholars generally believe that technological innovation, especially green technology, promotes energy efficiency. Wei et al. (2007) used the Malmquist exponential decomposition method to study the energy efficiency of the steel industry from 1994 to 2003, and the results showed that the key to improving energy efficiency lies in technology innovation. However, when Tan et al. (2019) analyzes the impact of technology innovation under different energy categories, they find that technology innovation contributes mainly to coal technology and comprehensive energy-saving technology, while the technological contribution in the electricity sector is not significant. At the same time, the research also proposes that because of the high cost of technology innovation, it is unsure that companies will develop new technologies to improve energy efficiency when other routes exist. Hence, it is ambiguous whether the moderating effect of technology innovation, especially green technology innovation, is positive or negative.
These hypotheses are tested through the model as follows.
Mit is the mediation factor, representing industrial structure (IS) and green technological innovation (PATENT). In particular, the industrial structure is the proportion of secondary industries in total GDP, and technological innovation is measured by the sum of the authorized quantity of all green patents (including invention patent, utility model patent, and design patent).
In this model, β2 is the coefficient of the interaction term of didit (i.e., Treatedi×Postt) and Mit, which is the coefficient of interest. If β2 >0, the corresponding mediation factor is estimated to promote the effect of the implementation of the 12th FYP on electricity efficiency, while it is estimated to alleviate the effect of that if it is negative.
Table 8 demonstrates the estimation results of the mediation effect model. Column (1) provides the estimates of industrial structure as the mediation factor without control variables, while column (2) provides that with control variables. The coefficient of the interaction term, IS×did, is estimated to be negative at the significance level of 1%, which means that cities with a higher proportion of secondary industries. The promotion effect of the implementation of the 12th FYP on the capacity per unit of electricity consumption is weakening. That is to say, listed companies in the secondary industry tend to have lower productivity per unit of electricity used, while those listed in the tertiary industry are relatively more efficient and economical in electricity consumption. Under the influence of the 12th FYP, cities with more listed companies (treatment group) can change the industrial structure by promoting the development of listed companies in the tertiary industry, thus achieving electricity consumption savings.
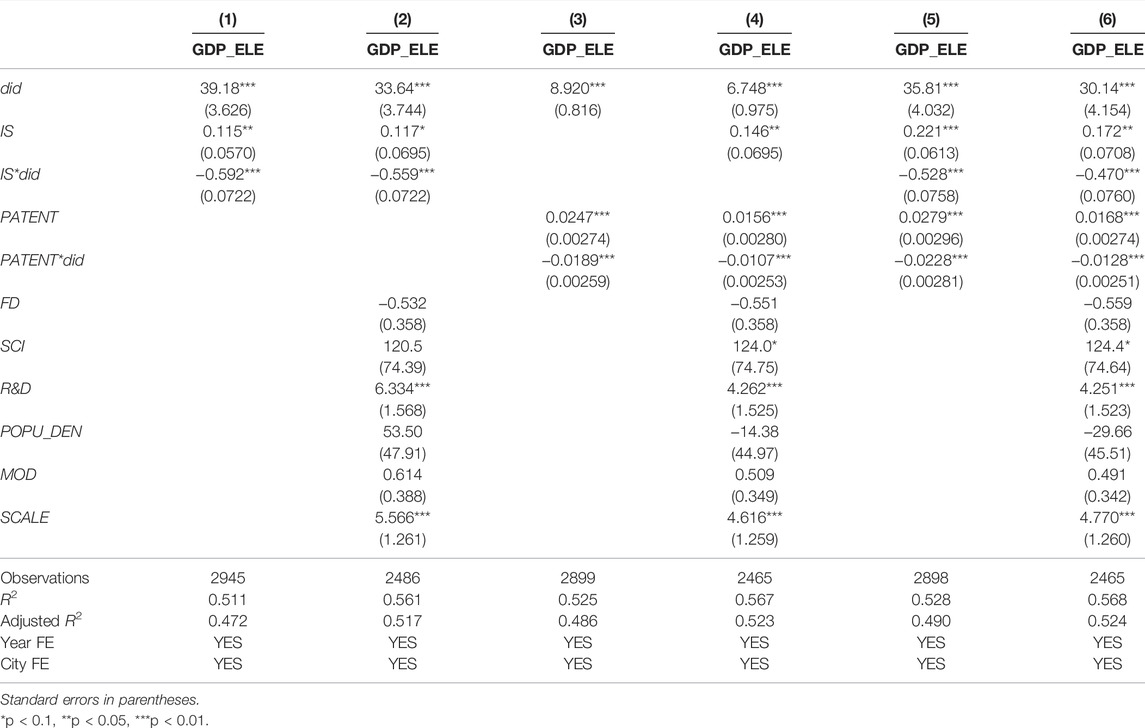
TABLE 8. Results of the mediation effect model.
From another aspect, columns (3) and (4) in Table 8 provide the estimates of technological innovation as the mediation factor. Here, the coefficient of PATENT is significantly positive at the 1% level; thus, the effectiveness of technological innovation is verified generally. However, the ineffectiveness of technological innovation is verified in those treatment cities since the coefficient of the interaction term, PATENT×did, is estimated to be significantly negative. That is to say, technological innovation has dragged down their electricity efficiency rather than boosting the capacity per unit of electricity used in the treatment group of cities. It can be inferred that technological innovation is not the best option for energy savings in cities with more listed companies.
Further more, the results did not show a significant change after introducing IS and PATENT in the model simultaneously, as shown in columns (5) and (6).
5 Conclusion and Policy Implications
This paper assesses the effect of implementing the 12th FYP on China’s electricity efficiency by DID model, based on the city-level data of China from 2003 to 2016. In particular, 2010 is treated as the policy year. The top 50 cities in terms of the number of listed companies are treated as the treatment group. As a result, the improvement of electricity in the treatment group after the policy year is verified, and different robustness tests support the results. Moreover, the mediation effect model shows the mechanism of this impact, that cities with more listed companies can change the industrial structure by promoting the development of listed companies in the tertiary industry, thus achieving electricity consumption savings. At the same time, technological innovation is not the best option for energy savings in cities with more listed companies.
Several policy recommendations could be made based on the research’s empirical results. First, additional energy-saving and emission reduction policies and evaluation standards according to the specific conditions of different cities should be considered. As research results show, cities with higher economic activities will affect more effectively by carbon reduction policies for their electricity efficiency. Also, these cities should take more responsibility for carbon reduction. Hence, higher economic-related cities should be more concerned with policies when future carbon reduction is made.
Second, the improvement of industrial structure is proved to have been more widely applied in the cities with more listed companies, thus how to efficiently transform industries and encourage the development of the tertiary sector while reducing the energy consumption and carbon emissions of the secondary sector, is the next step that deserves attention.
Third, new policy support should consider that green technology innovation is ineffective in improving electricity efficiency. Technological innovation should be the fundamental means of driving electricity efficiency. Therefore, the government should consider more direct technological innovation support policies to promote the practical application of green technological innovation in the energy systems of China’s economically active cities in order to ensure the continued optimization of electricity efficiency in these cities and to contribute to the achievement of green and sustainable economic development.
Data Availability Statement
The original contributions presented in the study are included in the article/Supplementary Material, further inquiries can be directed to the corresponding author.
Author Contributions
Conceptualization, ZP; Data curation, JL; Formal analysis, JL and MY; Funding acquisition, ZP; Methodology, ZP, JL and MY; Project administration, ZP; Resources, ZP; Software, JL and MY; Visualization, JL; Writing—original draft, JL; Writing—review and editing, ZP and MY. All authors have read and agreed to the published version of the manuscript.
Funding
This research is supported by The National Social Science Fund of China (No. 20&ZD110).
Conflict of Interest
The authors declare that the research was conducted in the absence of any commercial or financial relationships that could be construed as a potential conflict of interest.
Publisher’s Note
All claims expressed in this article are solely those of the authors and do not necessarily represent those of their affiliated organizations, or those of the publisher, the editors and the reviewers. Any product that may be evaluated in this article, or claim that may be made by its manufacturer, is not guaranteed or endorsed by the publisher.
Footnotes
1FYP is a national governmental program of planned, coordinated, and cumulative economic and social development over a period of 5 years. In China, 11th FYP refer to the period of 2006–2010.
2Data Source: The Central People’s Government of the People’s Republic of China (URL: http://www.gov.cn/zwgk/2011-09/07/content_1941731.htm).
3Data Source: Climate Change and Sustainable Development Research Institute of Tsinghua University (URL: http://iccsd.tsinghua.edu.cn/).
4Data source: Carbon Brief, IRENA, Climate Change and Sustainable Development Research Institute of Tsinghua University (URL: http://iccsd.tsinghua.edu.cn/).
References
Ahmed, V., and Zeshan, M. (2014). Decomposing Change in Energy Consumption of the Agricultural Sector in Pakistan. Agrarian South: J. Polit. Economy 3 (3), 369–402. doi:10.1177/2277976014560944
Al-Bajjali, S. K., and Shamayleh, A. Y. (2018). Estimating the Determinants of Electricity Consumption in Jordan. Energy 147, 1311–1320. doi:10.1016/j.energy.2018.01.010
An, H., Xu, J., and Ma, X. (2020). Does Technological Progress and Industrial Structure Reduce Electricity Consumption? Evidence from Spatial and Heterogeneity Analysis. Struct. Change Econ. Dyn. 52, 206–220. doi:10.1016/j.strueco.2019.11.002
Barabutu, J., and Lee, H. (2018). An Empirical Analysis of the Efficiency Determinants in the Southern African Electricity Sector: Evidence and Policy Implications. Geosystem Eng. 21 (1), 31–42. doi:10.1080/12269328.2017.1353445
Bi, G.-B., Song, W., Zhou, P., and Liang, L. (2014). Does Environmental Regulation Affect Energy Efficiency in China's thermal Power Generation? Empirical Evidence from a Slacks-Based DEA Model. Energy Policy 66, 537–546. doi:10.1016/j.enpol.2013.10.056
Buck, J., and Young, D. (2007). The Potential for Energy Efficiency Gains in the Canadian Commercial Building Sector: A Stochastic Frontier Study. Energy 32 (9), 1769–1780. doi:10.1016/j.energy.2006.11.008
Cheng, Y., Awan, U., Ahmad, S., and Tan, Z. (2021). How do Technological Innovation and Fiscal Decentralization Affect the Environment? A Story of the Fourth Industrial Revolution and Sustainable Growth. Technolo. Forecast. Soc. Change 162, 120398. doi:10.1016/j.techfore.2020.120398
Costantini, V., Crespi, F., and Palma, A. (2017). Characterizing the Policy Mix and its Impact on Eco-Innovation: A Patent Analysis of Energy-Efficient Technologies. Res. Pol. 46 (4), 799–819. doi:10.1016/j.respol.2017.02.004
Ferrara, E., Chong, A., and Duryea, S. (2008). Soap Operas and Fertility: Evidence from Brazil. American Econ. J.: Appl. Econ. 4. doi:10.1257/app.4.4.1
Filippini, M., and Hunt, L. C. (2012). US Residential Energy Demand and Energy Efficiency: A Stochastic Demand Frontier Approach. Energ. Econ. 34 (5), 1484–1491. doi:10.1016/j.eneco.2012.06.013
Filippini, M., Hunt, L. C., and Zorić, J. (2014). Impact of Energy Policy Instruments on the Estimated Level of Underlying Energy Efficiency in the EU Residential Sector. Energy Policy 69, 73–81. doi:10.1016/j.enpol.2014.01.047
Garbaccio, R. F., Ho, M. S., and Jorgenson, D. W. (1999). Why Has the Energy-Output Ratio Fallen in China? Energ. J. 20, 63–92. doi:10.5547/ISSN0195-6574-EJ-Vol20-No3-3
Guo, Y. Y., Xia, X. N., Zhang, S., and Zhang, D. P. (2018). Environmental Regulation, Government R&D Funding and Green Technology Innovation: Evidence from China Provincial Data. Sustainability 10(4). doi:10.3390/su10040940
Jiang, L., Folmer, H., and Ji, M. (2014). The Drivers of Energy Intensity in China: A Spatial Panel Data Approach. China Econ. Rev. 31, 351–360. doi:10.1016/j.chieco.2014.10.003
Jiang, L., Ji, M., and Bai, L. (2015). Characterizing China's Energy Consumption with Selective Economic Factors and Energy-Resource Endowment: a Spatial Econometric Approach. Front. Earth Sci. 9 (2), 355–368. doi:10.1007/s11707-014-0469-0
La Ferrara, E., Chong, A., and Duryea, S. (2012). Soap Operas and Fertility: Evidence from Brazil. American Econ. J.: Appl. Econ. 4 (4), 1–31. doi:10.1257/app.4.4.1
Li, P., Lu, Y., and Wang, J. (2016). Does flattening government improve economic performance? Evidence from China. J. Dev. Econ. 123. doi:10.1016/j.jdeveco.2016.07.002
Li, Y., Sun, L., Feng, T., and Zhu, C. (2013). How to Reduce Energy Intensity in China: A Regional Comparison Perspective. Energy Policy 61, 513–522. doi:10.1016/j.enpol.2013.06.007
Li, F., Xie, J., and Wang, W. (2019). Incentivizing Sustainable Development: The Impact of a Recent Policy Reform on Electricity Production Efficiency in China. Sust. Dev. 27, 1942. doi:10.1002/sd.1942
Li, K., and Lin, B. (2014). The Nonlinear Impacts of Industrial Structure on China's Energy Intensity. Energy 69, 258–265. doi:10.1016/j.energy.2014.02.106
Liddle, B. (2010). Revisiting World Energy Intensity Convergence for Regional Differences. Appl. Energ. 87, 3218–3225. doi:10.1016/j.apenergy.2010.03.030
Lin, B., and Zhao, H. (2016). Technological Progress and Energy Rebound Effect in China׳s Textile Industry: Evidence and Policy Implications. Renew. Sust. Energ. Rev. 60, 173–181. doi:10.1016/j.rser.2016.01.069
Lin, B., and Zhu, J. (2017). Energy and Carbon Intensity in China during the Urbanization and Industrialization Process: A Panel VAR Approach. J. Clean. Prod. 168, 780–790. doi:10.1016/j.jclepro.2017.09.013
Lin, B., and Zhu, J. (2020). Chinese Electricity Demand and Electricity Consumption Efficiency: Do the Structural Changes Matter? Appl. Energ. 262, 114505. doi:10.1016/j.apenergy.2020.114505
Lin, B., and Zhu, P. (2021). Measurement of the Direct Rebound Effect of Residential Electricity Consumption: An Empirical Study Based on the China Family Panel Studies. Appl. Energ. 301, 117409. doi:10.1016/j.apenergy.2021.117409
Liu, L. J., Jiang, J. Y., Bian, J. C., Liu, Y. Z., Lin, G. H., and Yin, Y. K. (2021). Are Environmental Regulations Holding Back Industrial Growth? Evidence from China. J. Cleaner Product. 306. doi:10.1016/j.jclepro.2021.127007
Ma, C., and Zhao, X. (2015). China's Electricity Market Restructuring and Technology Mandates: Plant-Level Evidence for Changing Operational Efficiency. Energ. Econ. 47, 227–237. doi:10.1016/j.eneco.2014.11.012
Marin, G., and Palma, A. (2017). Technology Invention and Adoption in Residential Energy Consumption. Energ. Econ. 66, 85–98. doi:10.1016/j.eneco.2017.06.005
Narayanan, K., and Sahu, S. K. (2014). Energy Consumption Response to Climate Change: Policy Options for India. IIM Kozhikode Soc. Manag. Rev. 3 (2), 123–133. doi:10.1177/2277975214544014
Nesta, L., Vona, F., and Nicolli, F. (2014). Environmental Policies, Competition and Innovation in Renewable Energy. J. Environ. Econ. Manag. 67 (3), 396–411. doi:10.1016/j.jeem.2014.01.001
Newell, R. G., Jaffe, A. B., and Stavins, R. N. (1999). The Induced Innovation Hypothesis and Energy-Saving Technological Change. Q. J. Econ. 114, 941–975. doi:10.1162/003355399556188
Ramos, A., Labandeira, X., and Löschel, A. (2016). Pro-environmental Households and Energy Efficiency in Spain. Environ. Resource Econ. 63 (2), 367–393. doi:10.1007/s10640-015-9899-8
Rostow, W. W. (1991). The Stages of Economic Growth: A Non-Communist Manifesto (3 ed.). Cambridge University Press. doi:10.1017/CBO9780511625824
Sanchez-Escobar, M. O., Noguez, J., Molina-Espinosa, J. M., Lozano-Espinosa, R., and Vargas-Solar, G. (2021). The Contribution of Bottom-Up Energy Models to Support Policy Design of Electricity End-Use Efficiency for Residential Buildings and the Residential Sector: A Systematic Review. Energies 14 (20), 6466. doi:10.3390/en14206466
Shi, C. F., Zhao, Y., Zhang, C. J., Pang, Q. H., Chen, Q. Y., and Li, A. (2022). Research on the Driving Effect of Production Electricity Consumption changes in the Yangtze River Economic Zone-Based on Regional and Industrial Perspectives. Energy, 238. doi:10.1016/j.energy.2021.121635
Sigman, H. (2014). Decentralization and Environmental Quality: An International Analysis of Water Pollution Levels and Variation. Land Economics 90 (1), 114–130. doi:10.3368/le.90.1.114
Sueyoshi, T., and Goto, M. (2011). Operational Synergy in the US Electric Utility Industry under an Influence of Deregulation Policy: A Linkage to Financial Performance and Corporate Value. Energy Policy 39 (2), 699–713. doi:10.1016/j.enpol.2010.10.043
Sun, H., Edziah, B. K., Sun, C., and Kporsu, A. K. (2021a). Institutional Quality and its Spatial Spillover Effects on Energy Efficiency. Socio-Economic Plann. Sci., 101023. doi:10.1016/j.seps.2021.101023
Sun, H., Edziah, B. K., Kporsu, A. K., Sarkodie, S. A., and Taghizadeh-Hesary, F. (2021b). Energy Efficiency: the Role of Technological Innovation and Knowledge Spillover. Technol. Forecast. Soc. Change 167, 120659. doi:10.1016/j.techfore.2021.120659
Tan, X. C., Li, H., Guo, J. X., Gu, B. H., and Zeng, Y. (2019). Energy-saving and emission-reduction technology selection and CO2 emission reduction potential of China's iron and steel industry under energy substitution policy. Journal of Cleaner Production 222, 823–834. doi:10.1016/j.jclepro.2019.03.133
van Megen, B., Bürer, M., and Patel, M. K. (2019). Comparing Electricity Consumption Trends: A Multilevel index Decomposition Analysis of the Genevan and Swiss Economy. Energ. Econ. 83, 1–25. doi:10.1016/j.eneco.2019.06.004
Voigt, S., De Cian, E., Schymura, M., and Verdolini, E. (2014). Energy Intensity Developments in 40 Major Economies: Structural Change or Technology Improvement? Energ. Econ. 41, 47–62. doi:10.1016/j.eneco.2013.10.015
Wang, B., Sun, Y. F., and Wang, Z. H. (2018). Agglomeration Effect of CO2 Emissions and Emissions Reduction Effect of Technology: A Spatial Econometric Perspective Based on China's Province-level Data. Journal of Cleaner Production 204, 96–106. doi:10.1016/j.jclepro.2018.08.243
Wei, Y.-M., Liao, H., and Fan, Y. (2007). An empirical analysis of energy efficiency in China's iron and steel sector. Energy, 32 (12), 2262–2270. doi:10.1016/j.energy.2007.07.007
Wu, Y. (2012). Energy Intensity and its Determinants in China's Regional Economies. Energy Policy 41, 703–711. doi:10.1016/j.enpol.2011.11.034
Yin, J., Wang, S., and Gong, L. (2018). The Effects of Factor Market Distortion and Technical Innovation on China's Electricity Consumption. J. Clean. Prod. 188, 195–202. doi:10.1016/j.jclepro.2018.03.294
Ying Lee, C., Lotsu, S., Islam, M., Yoshida, Y., and Kaneko, S. (2019). The Impact of an Energy Efficiency Improvement Policy on the Economic Performance of Electricity-Intensive Firms in Ghana. Energies 12 (19), 3684. doi:10.3390/en12193684
Yu, H. (2012). The Influential Factors of China's Regional Energy Intensity and its Spatial Linkages: 1988-2007. Energy Policy 45, 583–593. doi:10.1016/j.enpol.2012.03.009
Zhang, C., Zhou, K., Yang, S., and Shao, Z. (2017). On Electricity Consumption and Economic Growth in China. Renewable and Sustainable Energy Reviews 76, 353–368. doi:10.1016/j.rser.2017.03.071
Zhang, N., Kong, F., Choi, Y., and Zhou, P. (2014). The Effect of Size-Control Policy on Unified Energy and Carbon Efficiency for Chinese Fossil Fuel Power Plants. Energy Policy 70, 193–200. doi:10.1016/j.enpol.2014.03.031
Zhang, C., Su, B., Zhou, K., and Yang, S. (2019). Analysis of Electricity Consumption in China (1990-2016) Using index Decomposition and Decoupling Approach. J. Clean. Prod. 209, 224–235. doi:10.1016/j.jclepro.2018.10.246
Zhang, Z. (2003). Why Did the Energy Intensity Fall in China's Industrial Sector in the 1990s? the Relative Importance of Structural Change and Intensity Change. Energ. Econ. 25, 625–638. doi:10.1016/S0140-9883(03)00042-2
Appendix
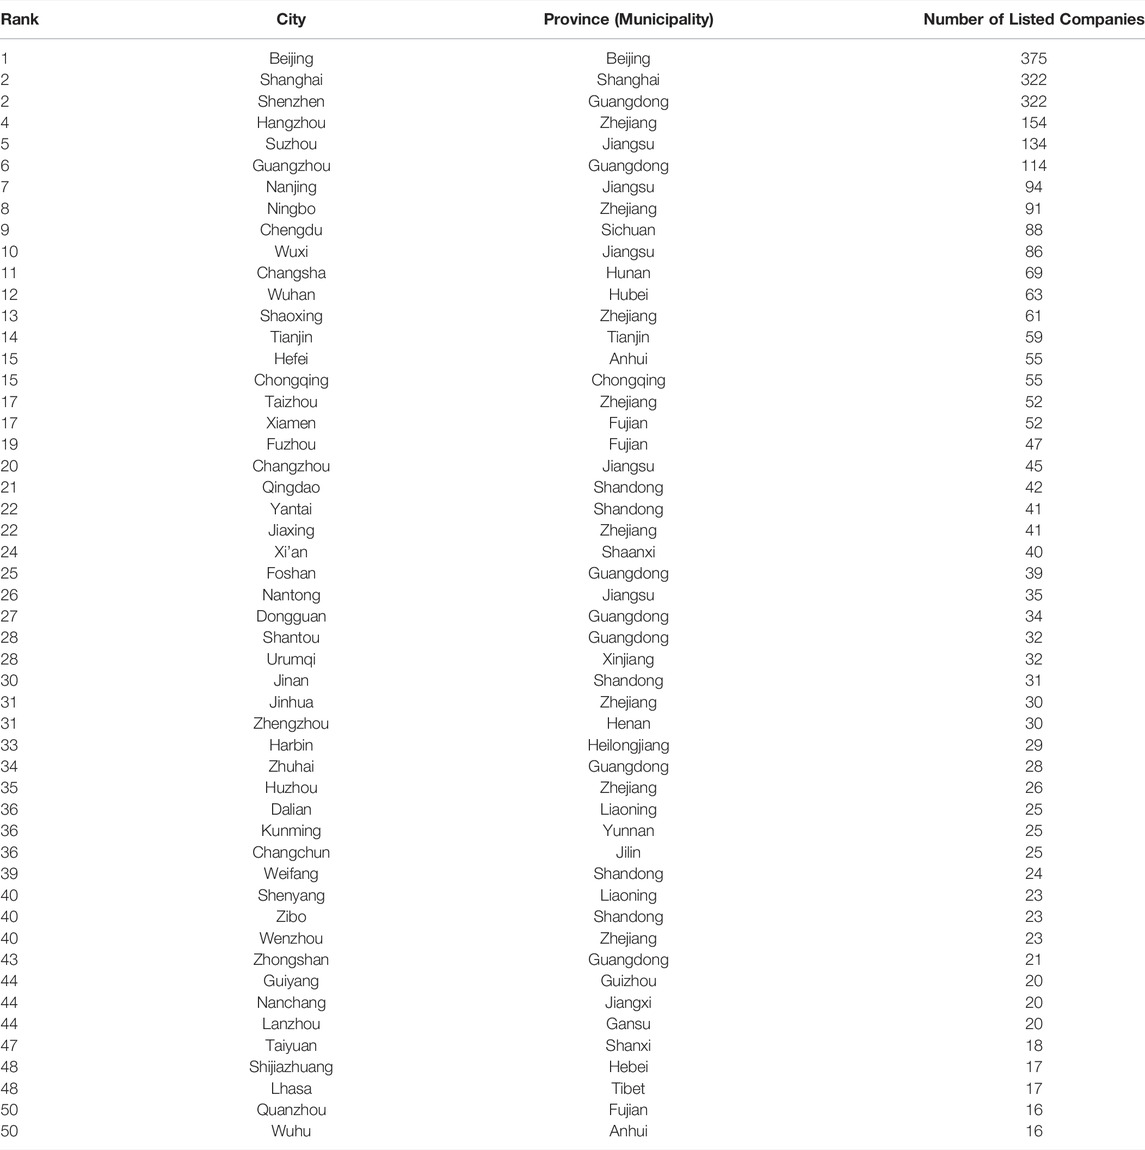
TABLE 9. Top 50 cities in terms of number of listed companies
Keywords: green technology innovation, carbon neutrality, difference-in-difference model, electricity efficiency, environmental policy
Citation: Pu Z, Liu J and Yang M (2022) Could Green Technology Innovation Help Economy Achieve Carbon Neutrality Development–Evidence From Chinese Cities. Front. Environ. Sci. 10:894085. doi: 10.3389/fenvs.2022.894085
Received: 11 March 2022; Accepted: 04 April 2022;
Published: 29 April 2022.
Edited by:
Huaping Sun, Jiangsu University, ChinaReviewed by:
Lin Ding, Tohoku University, JapanJun-Jun Jia, Hefei University of Technology, China
Jiasha Fu, Southwestern University of Finance and Economics, China
Copyright © 2022 Pu, Liu and Yang. This is an open-access article distributed under the terms of the Creative Commons Attribution License (CC BY). The use, distribution or reproduction in other forums is permitted, provided the original author(s) and the copyright owner(s) are credited and that the original publication in this journal is cited, in accordance with accepted academic practice. No use, distribution or reproduction is permitted which does not comply with these terms.
*Correspondence: Zhengning Pu, puzhengning@seu.edu.cn