High Confident Evaluation for Smart City Services
 Hao Sheng
 Yang Zhang
 Wei Wang3*
 - 1State Key Laboratory of Software Development Environment, Beijing Advanced Innovation Center for Big Data and Brain Computing, School of Computer Science and Engineering, Beihang University, Beijing, China
- 2College of Information Science and Technology, Beijing University of Chemical Technology, Beijing, China
- 3Informatization and Industry Development Department, State Information Center, Beijing, China
This study aims to analyze massive data in cities through data vitalization, and quantitatively evaluate smart city services, so as to promote the construction and development of smart cities. Due to the great difference between cities, a single evaluation method cannot accurately describe the development of a city. In this study, we classify cities by multiple labels according to various bases to give cities comprehensive description. Then, a Multi-level Service Evaluation System (MSES) is introduced. It considers individual weights to cities with different characteristics and evaluates the smart city services from different aspects. In addition to putting forward the iterative development of smart city services, a Maturity Model-based Service Evaluation (MMSE) framework is proposed based on the evaluation results of the MSES. It constructs a standardized and high confident evaluation framework to analyze the current state of cities and make feedback to the government policies. Finally, we take 10 cities in China to demonstrate the effectiveness of MMSE during the development of smart city services.
1 Introduction
The development of smart city services has become a new type of infrastructure for city development. It promotes the deep integration of the new generation of information technology and regional coordinated development strategy, and improves the modernization level of city comprehensive governance capacity. Smart city service is an important carrier to promote the transformation and upgrading of the traditional city development mode and enhance people’s sense of convenience, security, access, justice, happiness, and satisfaction.
At present, the development of smart city service has become an important driving force to promote city economic reform, industrial upgrading, and enhance the comprehensive competitiveness of cities, but it still faces various problems. How to scientifically and accurately evaluate the service level of smart cities and provide guidelines for the further development of cities is one of the most critical issues.
There are a large number of different smart city services in cities, involving different fields and industries, facing different people and enterprises. There are usually huge differences between these services. Therefore, in the process of evaluating smart city services, the selection of indicators directly affects the results of comprehensive evaluation. The selection of evaluation indicators should be quantifiable with scientific weights and highlight the features of the city. Based on this consideration, this study proposes a Multi-level Service Evaluation System (MSES) to categorize smart city services into different level, from subjective indicators to objective indicators, from general primary indicators to detailed secondary indicators.
In addition, the purpose of evaluating smart city services is to urge the government to analyze and reflect on the existing development mode and government decision-making, so as to continuously improve and perfect smart city services. Through the new generation of information technology, information in various fields in cities can be effectively integrated, and an information service and sharing platform for government, enterprises, and citizens can be built to improve resource utilization efficiency, which is more efficient in the development of city services and improve the quality of life of the citizens.
Therefore, this study proposes Maturity Model-based Service Evaluation (MMSE) framework to establish a standardized and high confident evaluation system for smart city service evaluation, it provides guidance for governments at all levels to carry out the classification and construction of smart city services and also provides reference for the industry.
In summary, our main contributions include the following:
• A Multi-level Service Evaluation System (MSES) to describe smart city services from various aspects with different level
• A Maturity Model-based Service Evaluation (MMSE) framework to make high confident evaluation for smart city services
• A detailed demonstration case to introduce the application of MMSE to improve the development of smart city services
The rest of the article is organized as follows. Related work is discussed in Section 2. Our proposed MSES is introduced in Section 3. The framework of MMSE is described in Section 4. We show and analyze the demonstration cases in Section 5. Conclusion is in Section 6.
2 Related Work
At present, there are a large number of smart cities in the world (Szabó et al., 2013; Giordano et al., 2016; Tu, 2018; Zhong et al., 2019; Ting, 2020). Different countries have their own cultural and economic development, and different countries have different understandings and emphases on smart cities. Therefore, each country has its own different characteristics. However, probing into its root causes, smart cities are put forward to provide more convenient services for citizens, which is the development focus of every country when building smart cities.
In the theoretical research of smart city service (Balakrishna, 2012; Lee and Lee, 2014; Qian et al., 2019; Song et al., 2020), Allwinkle et al. (Sam and Cruickshank, 2011) put forward two theories of smart city, which provided the basic theoretical basis for the related construction of smart city. In 2012, Batty et al. (2012) listed city service as an important part of the top-level design of smart cities, comprehensively discussed the future development of smart cities, and constructed the basic framework for the realization of smart cities. In 2014, Piro et al. (2014) pointed out that smart cities can provide high-quality services for citizens, and their applications involve various fields of social life, and explained in detail the practical applications of traffic accident signal assistance, intelligent physical examination, intelligent garbage management, etc., and showed the expected application effect in the future.
In terms of applications (Hamid et al., 2017; Khajenasiri et al., 2017; Komninos et al., 2015; Lau et al., 2019; Li et al., 2019), Caragliu et al. (2011) analyzed many factors that have an impact on smart cities, and put forward the view that smart cities should pay attention to public service and technological innovation, so as to achieve sustainable development and improve people’s quality of life. Winter et al. (Winters, 2011) pointed out that the construction of smart cities should not only stay at the construction level, but also face the public and serve the public. Anttiroiko et al. (2014) constructed the overall framework of public information service in smart cities, and systematically discussed the contents of public information service in smart cities and the construction of intelligent service platform, clarifying that digital technology will be increasingly embedded in social management innovation. Khan et al. (2014) designed a smart city environment-aware service system based on cloud architecture, and found that cloud infrastructure plays an important role in smart city service.
In the aspect of service evaluation (Pan et al., 2011; Lombardi et al., 2012; Magrin et al., 2017; Akin, 2018; Caird and Hallett, 2019), Vienna University has established a set of three-level index system, which evaluates the comprehensive development of small and medium-sized cities in Europe from the aspects of city economy, social human capital, city management, transportation, environment, and people’s quality of life. Intelligent Community Forum (Komninos, 2006, 2008) is a very influential organization. According to the principles of openness, transparency, and globalization, taking broadband economy as the core, the selected smart communities were evaluated and the annual smart community was selected. The evaluation indicators of IDF includes five aspects: broadband connection, knowledge labor, innovation ability, skill training level, and publicity intensity, which serve as permanent evaluation basis. However, with the rapid development of smart cities, these evaluation indicators have been unable to completely cover different areas of city services, and there is a lack of guidance for the iterative improvement of smart city services.
In China, as early as 1998, the basic idea of constructing digital China was put forward (Shen et al., 2018). With the development of society, standardization construction is becoming more and more important. Under the guidance of the national smart city construction policy, many cities across the country have carried out the hypothesis of smart cities. In 2015, China issued Blue Book of Public Service (Zhong and Wu, 2015), constructing a service evaluation system of smart cities with multi-level evaluation indicators, and evaluated 38 cities in China. In 2016, the National Development and Reform Commission and the National Standards Committee carried out research on the national standards for evaluation indicators of new smart cities, and issued the national standard Evaluation indicators of new smart cities (GB/T 33356–2016) (the People’s Republic of China, 2016). At the same time, China has become the initiator and core member of several international standardization organizations in the field of smart cities.
In the recent past, China issued a number of relevant standards on smart city construction and service evaluation, such as Smart city: Application guide of SOA standard (GB/T 36445-2018) (the People’s Republic of China, 2018a), Smart city: Terminology (GB/T 37043-2018) (the People’s Republic of China, 2018b), etc. China’s national standard achievements and technical reference framework have been upgraded to international standard items.
3 Service Evaluation System
3.1 City Classification
Due to the difference on administrative region, population size, and geographical location, the smart city services are usually quite different in different cities, and the development focuses also reflect their features respectively. Therefore, before evaluating smart city services, it is of great significance to analyze city features from different angles and classify them comprehensively and accurately.
The study of city classification has gone through a long process, from the simple to the complex, from the qualitative to the quantitative, from single index to multiple indexes. As shown in Figure 1, this study introduces five common methods of city classification, and analyzes the features of different types of cities.
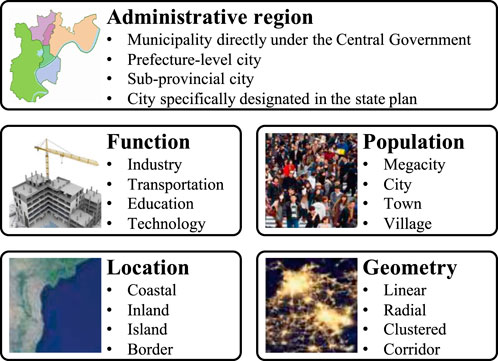
FIGURE 1. Examples of classifying cities from different aspects.
Administrative division system, in countries with different social systems, in countries with different structural forms of unitary system or compound system, can be divided into different types by various standards. Taking China as an example, cities can be divided into municipalities directly under the central government, prefecture-level city, sub-provincial city and city specifically designated in the state plan, and so on.
Another classification method is based on the different functions of the city. The function of a city refers to the role and division of labor that plays in the economic and social development in a certain region, and it is the role that city plays in areas other than itself. Common functions include tourist, transportation, education, technology, etc.
People is the main body of the modern city. Therefore, the population of the city is also one of the important bases for city classification. Internationally, it is generally believed that the population of a megacity needs to exceed 10 million, such as Tokyo, Mumbai and Shanghai. Other common types include city, town, village, etc.
Cities can also be classified by their different location. Coastal cities are located on the interface or transition areas between land and sea, inland cities located in the interior of a country or region away from a sea or border and island city is defined as a body of land surrounded by water. In addition, a border city is close to the boundary between two countries, states, or regions, and the nearness to the border is usually one of the things the city is most famous for.
Geometric shape of the spatial distribution of cities is also a typical classification basis. The formation of the city shape is influenced by many factors, including geographical environment, historical events, social forms, technological development, and so on. Common city shapes include linear city, radial city, clustered city, corridor city, etc.
Generally speaking, different city classification results can be obtained by analyzing city features from different angles. Therefore, when evaluating smart city services, it is necessary to fully consider the features of different cities in different aspects.
3.2 Service Evaluation
Considering that smart city services involve various aspects in different fields in cities, this study proposes a Multi-level Service Evaluation System (MSES). As shown in Figure 2, MSES is mainly composed of subjective evaluation indicator and objective evaluation indicator.
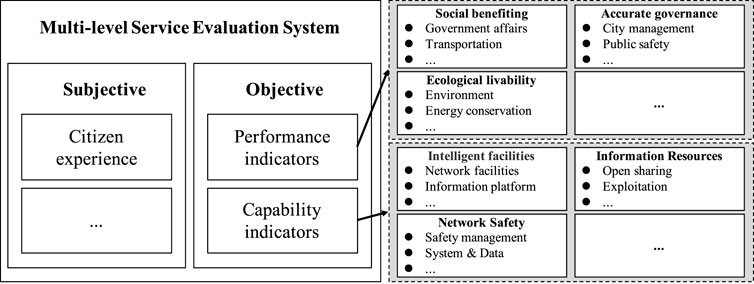
FIGURE 2. An illustration of the multi-level service evaluation system. The bold items in the right box indicate various primary indicators, each of which contains multiple secondary indicators.
Subjective indicators are designed to guide the evaluation to focus on public satisfaction and social participation as shown in Table 1. Since residents are the main body of the city, it is impossible to truly serve the people without their real feeling about smart city services. The main forms of collecting citizens’ experience include questionnaires, random interviews, and so on. These indicators evaluate the public’s personal feelings about the development effect of smart city services.
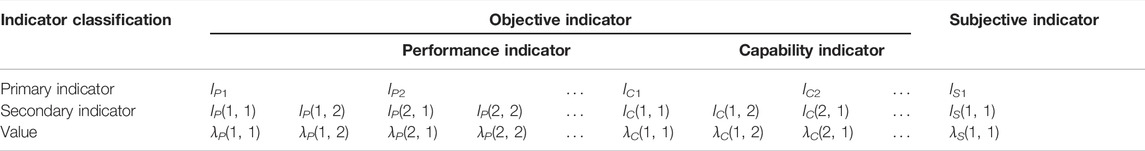
TABLE 1. Multi-level service evaluation system.
On the other hand, objective indicators focus on the evaluation of the status, the space, and the features of the city development through objective data of city services. Different from subjective indicators focusing on residents’ comprehensive feelings, objective indicators evaluate city services from multiple subdivisions. Therefore, the objective indicators are divided into performance indicator and capability indicator, including various primary indicators and secondary indicators, thus achieving a more fine-grained evaluation of city services.
Performance indicators aim to objectively reflect the effectiveness of smart city services and some typical indicators are illustrated in Figure 2. Specifically, social benefiting contains several secondary indicators including government affairs, transportation, social security, medical treatment, education, employment, e-business, etc. These indicators describe the construction of smart city services from various fields closely related to residents’ lives.
Accurate governance is another commonly used primary indicator for evaluation which consists of multiple secondary indicators, including city management, public safety, etc. They demonstrate the use of digital means to intelligently manage cities and develop intelligent municipal infrastructure, and evaluate the construction of the social security prevention and control system in cities and the networking application of public security video surveillance.
Ecological livability is a primary indicator that evaluates the city’s intelligent monitoring in environmental protection, environmental information disclosure, and environmental problem disposal. It also describes the development of energy conservation and consumption reduction.
In addition to performance indicators, capability indicators mainly focus on the basic facility construction of the city. It aims to discover cities with great development potential. With the development of smart city services, the importance of network, information, and intelligent facilities in cities has been continuously improved. In recent years, intelligent facilities construction has become a typical indicator for evaluation, which evaluates the development of the fixed broadband networks and mobile broadband networks and evaluates the establishment of spatio-temporal information service system and the development of spatio-temporal information service in cities as well.
Information resources describe the situation of sharing government departments and the opening of public information resources to the society. Moreover, it evaluates the development and utilization of basic information resources, the development of innovative services, and the promotion of accurate city governance by government–enterprise cooperation.
Nowadays, network safety has become an important issue of common concern to both government and public. Therefore, it can be used as an indicator to evaluate the implementation of the security responsibility system in the construction and management process of smart cities. It helps to strengthen network security monitoring, notification and early warning, and information sharing during the operation of smart cities, and improve the network security risk resilience and emergency response capability. This indicator is also used to evaluate the security of key information infrastructure in smart cities.
Considering the difference on city service levels and overall development strategies of different cities, in the actual evaluation process of smart city services, it is of great necessity to design different evaluation indicators to achieve accurate and reliable service evaluation. The primary and secondary indicators proposed in this section are a general evaluation method, and they are used in the demonstration cases in this study.
3.3 Individuation Weight
As discussed above, according to different city classification methods, the same city belongs to different categories. Therefore, this study proposes a multi-label based individuation weight algorithm to evaluate smart city services.
In order not to lose generality, this study abstracts different city classification methods into different classification attributes, such as attribute A, attribute B, etc., representing administrative region, function, population, and so on. The evaluation indicators consist of IP(1, 1), IC(1, 1), and IS(1, 1) to describe performance indicator, capability indicator, and subjective indicator, respectively. Therefore, to evaluate the weight of each evaluation indicator in smart city service, ωk(i, j) is determined according to various attribute of the city. The value of ωk(i, j) ranges from 0 to 1 while the sum of all weights of the indicators for each attribute is 1. As shown in Table 2, weight ωk(i, j) is designed to describe the importance and the influence of an indicator for an attribute, instead of a specific city. In this way, the weight of the indicator is much more objective since only a certain attribute is considered at a time.
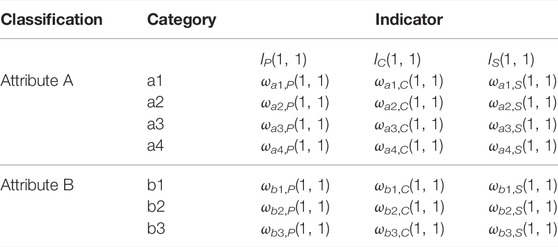
TABLE 2. Individuation weight for different cities.
For a given city X, it can be classified according to a series of attribute \{A, B, … \}, and the category of X can be expressed by {ai1, bi2, … }. Therefore, the city {ai1, bi2, … } has multiple weights ωk(i, j) for each indicator I(i, j) and the normalized weight for each indicator can be calculated as follows:
where n is the number of attributes and the value of ω(i, j) ranges from 0 to 1.
4 Maturity Model for Service Evaluation
4.1 Overview
The goal of developing smart city services is to form a virtuous circle of city system operation and create a better environment for people to live, work, rest, and play. The construction and development of the smart city services is a process of gradually maturing, and it is a process of continuously improving the ability and effectiveness of serving the people, governance, infrastructure, information resources, network security, system and mechanism, and citizens’ sense of acquisition and satisfaction. Therefore, we propose five basic principles for smart city service evaluation.
Combination of qualitative and quantitative analysis. The construction of the smart city services is a systematic, dynamic, continuous, and normal process. The smart city itself is not only an idea and a vision, but also a development process. In the process of promoting the construction of the smart city services, we should give full play to the concept of system engineering, adopt the principle of combining qualitative and quantitative analysis, and adopt the principles of qualitative positioning, quantitative analysis, local optimization, and overall promotion.
Dynamic development and optimization. In the process of promoting the construction of smart city services, suitable standards should be put forward and strictly observed according to the normality, dynamics, and regionality of the specific city. Meanwhile, the concept and vision, planning and strategy, operation and maintenance, promotion and governance of the smart city services should also follow the concepts of advancing the concept, keeping up with the technology and reviewing once a year. Therefore, specific plans for promotion are proposed to summarize the past and guide the future.
Regional comprehensive development. Since each city, as well as different areas in the city, has obvious characteristics of regional individuation and development differentiation in the recent past. Therefore, in the process of smart city service evaluation, the development characteristics of cities and regions should be fully considered.
Closed-loop feedback. Because of the systematic development concept, dynamic development thinking method and regional collaborative development trend of the smart city services, the engineering development concept of closed-loop feedback has become an important principle. The annual review of the development, the revision of the evaluation indicators and the corresponding applicability and scientificalness all need the guarantee of a feedback mechanism. Through the feedback, the scientific rationality of the indicators, city classification methods can be guaranteed, and the timeliness of the city classification can also be guaranteed.
Expansion and interconnection. On the basis of policy guidance and strategic guarantee, the interconnection and mutual learning among cities should be realized to gradually achieve city interconnection and regional linkage, and to steadily promote the development of smart city services.
4.2 Maturity Model-Based Service Evaluation Framework
Maturity model describes the development process of a thing in a refined way, usually consisting of several limited maturity levels. Each level has a clear definition and sets certain standards, and its implementation includes several necessary conditions. From the first level to the highest level, there is a sequence between levels, and each level is a further improvement of the previous level and forms the basis for moving forward to the next level. In the process of development, things progress continuously from one level to the next, which is a process of progressive development.
The development of the smart city services is a continuously improving process. Considering the outstanding problem of unbalanced development of different cities. In this study, a standardized MMSE framework is proposed. It gives high confidence evaluation for smart city services based on the relevant international and domestic advanced concepts and the objective law of the development, so as to help the healthy and sustainable development of the smart city services from the perspective of evaluation. The overall framework of the MMSE is shown in Figure 3.
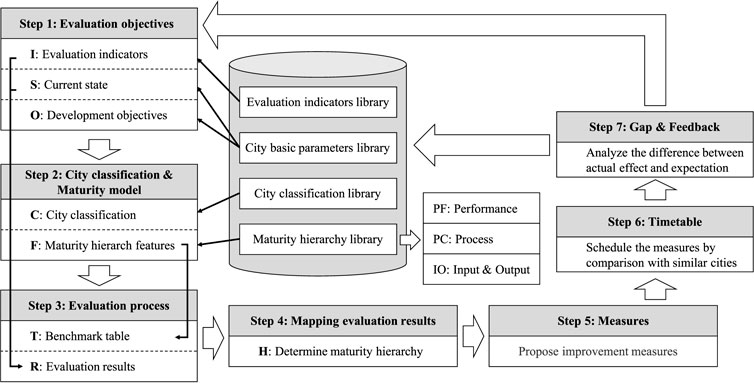
FIGURE 3. The framework of the Maturity Model-based Service Evaluation (MMSE) for smart city services.
There are four basic libraries in MMSE, including evaluation indicators library, city basic parameters library, city classification library, and maturity hierarchy library.
Evaluation indicators library: it contains specific evaluation indicators and evaluation methods for the cities to be evaluated. In this study, this library is constructed by MSES with multi-level indicators and individuation weight. Evaluation indicator library is used to help select indicators (I) and the corresponding weight.
City basic parameters library: it contains the basic information that can be used to describe the current state of the city to be evaluated, such as vision, current situation, and the basic operation indicators. This library is used to define the current state (S) and the development objectives (O).
City classification library: it contains the methods for classifying cities according to different bases, such as administrative region, functions, population, location, geometry, etc. This library is used to choose the classification methods and determine its corresponding category (C) of the evaluated cities.
Maturity hierarchy library: it contains features with clear pain points, difficulties, and needs according to the development of smart city services. The attributes of features include performance (PF), process (PC), and input and output (IO). This library is used to determine the feature (F) corresponding to the development objectives.
4.3 Evaluation Methodology
Based on these libraries, the evaluation of the smart city services is conducted by the ISO-CF evaluation methodology, based on evaluation indicators (I), current state (S), development objectives (O), city classification (C), and corresponding features (F).
The evaluation process consists of seven steps in Figure 3, which are described in detail as follows:
Step 1: Determine the evaluation objectives of the evaluated city. First, the evaluation indicators (I) are decided according to the current state (S) of the evaluated city with evaluation indicators library and city basic parameters library. The evaluation objectives (O) are also determined in the first step.
Step 2: Choose the classification methods and the maturity hierarchy features. In the second step, the city classification (C) methods are selected from the city classification library based on the features of the evaluated city. In addition, the maturity hierarchy features (F) are also determined that describe the details of the evaluation objectives from various aspects of the smart city services.
Step 3: Evaluate based on MSES. When all the elements of ISO-CF are determined in the above steps, the benchmark table (T) is constructed with different indicators of each hierarchy. Then, the results (R) of each indicator are evaluated based on MSES.
Step 4: Map the evaluation results and determine the maturity hierarchy. The evaluation results (R) contain the score of each indicator (I), while the benchmark table (T) consists of different maturity hierarchy features (F) in terms of performance (PF), process (PC), and input and output (IO). Therefore, it is necessary to map the evaluation results (R) to the benchmark table (T). Specifically, indicators that describe the same maturity hierarchy features are summed up and then mapped to the benchmark table (T). The mapping results between the evaluation results and the benchmark table describe whether the evaluated city achieved the expected objectives, and the maturity hierarchy of each feature is also obtained.
Step 5: Propose promotion measures. According to the maturity hierarchy of each feature, the gap between the current state of the evaluated city and the expected objectives should be analyzed. Based on the analysis, the maturity hierarchy is used as the decision basis to formulate suitable measures for promoting each specific aspect of the evaluated city.
Step 6: Make a time plan for the measures. In this step, scientific and reasonable time planning and arrangement of the promotion measures should be made, through horizontal comparison with the current state of similar cities. The timetable consists of several clear time nodes, which are used to refine the specific progress of the promotion measures.
Step 7: Analyze the gap and make feedback. When a specific time node is reached, the effect of the promotion measures should be evaluated, and the gap between the expected objectives is also analyzed at the same time. Meanwhile, the analysis results are fed back as the guidance to adjust the basic library in time. In this way, the closed-loop feedback and the dynamic adjustment of the evaluation are achieved.
5 Demonstration Cases
5.1 Overview
This study takes 10 cities in China as the demonstration cases, and collects a series of data of these cities in 2016 and 2018, respectively. Through the analysis of these data, this study gives a detailed description of the MSES and the MMSE framework. These 10 cities are denoted as {C1, C2, C3, … , C10} in the following cases.
5.2 City Classification
First of all, according to our proposed city classification method, we classify 10 cities with multiple labels according to different classification basis. In our case, we choose three bases for the classification, including population, function, and location. Specifically, population term consists of five categories, including over 10 million (P1), 5–10 million (P2), 1–5 million (P3), 0.5–1 million (P4), and under 0.5 million (P5). Function term contains tourist city (F1), transportation city (F2), education city (F3), technology city (F4). Location term has two different types, coastal city (L1) and inland city (L2). Therefore, the classification result a city can be expressed as {Px, Fy, Lz|x = 1, 2, 3, 4, 5; y = 1, 2, 3, 4; z = 1, 2}.
Cities with different population sizes are included in the demonstration cases, and they have different main functions. In addition, the influence of geographical location on the city development has also been considered. The classification results of {C1, C2, C3, … , C10} are shown in Table 3
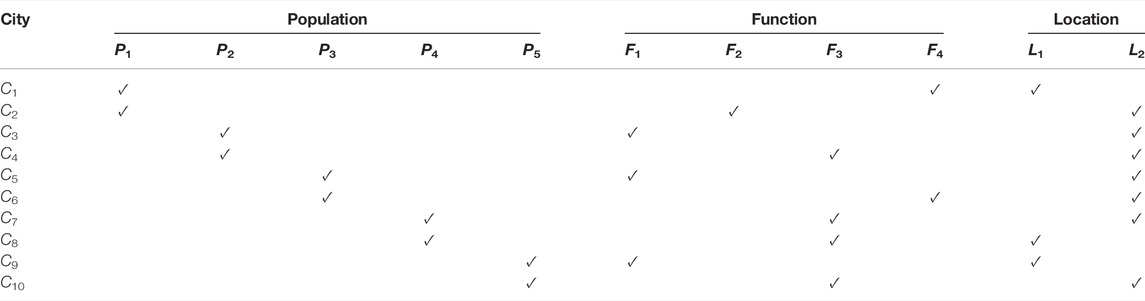
TABLE 3. City classification results.
5.3 Individuation Weight
In this study, we take 18 kinds of secondary indicators from eight different primary indicators including subjective indicator to evaluate the services development of 10 cities.
Considering the different situations of 10 cities in population, function and location, we set different indicator weights respectively. Then, the final weights on indicators of each city are calculated according to Eq. 1. Therefore, 10 cities have individuation weights that reflect their own characteristics on the city development. The specific indicators used in the cases and their corresponding weights are listed in Table 4.
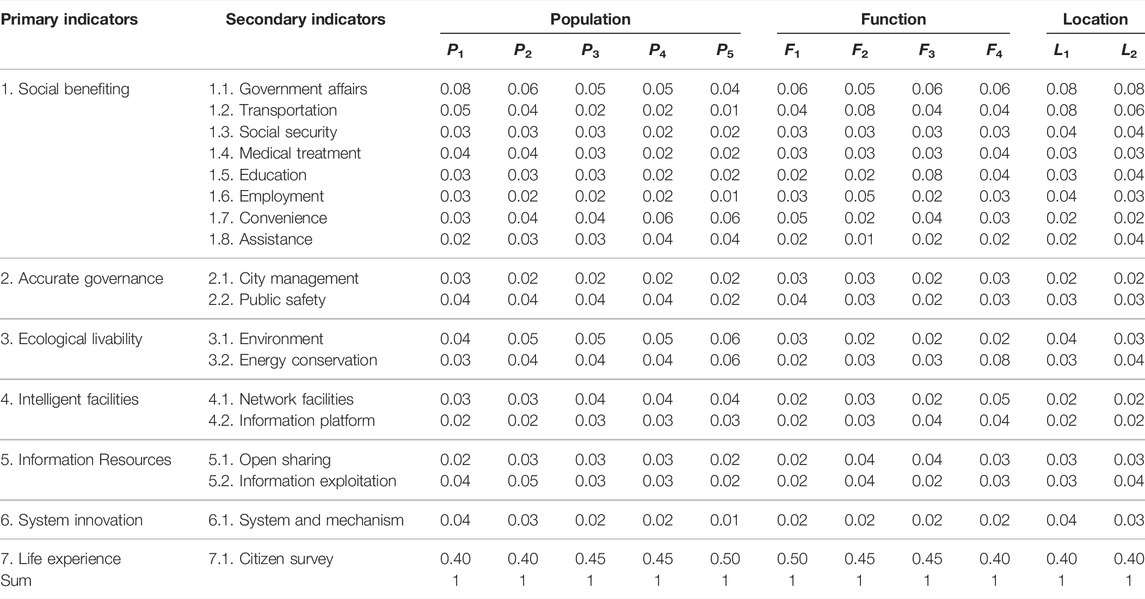
TABLE 4. Indicators and individuation weights.
As shown in Table 5, the indicator weights of each city are different, which reflects their various characteristics and development direction. All the data in the table are agreed after discussion by relevant departments of cities and expert groups. In order to keep the table readable, the weights in the table only keep two decimal places.
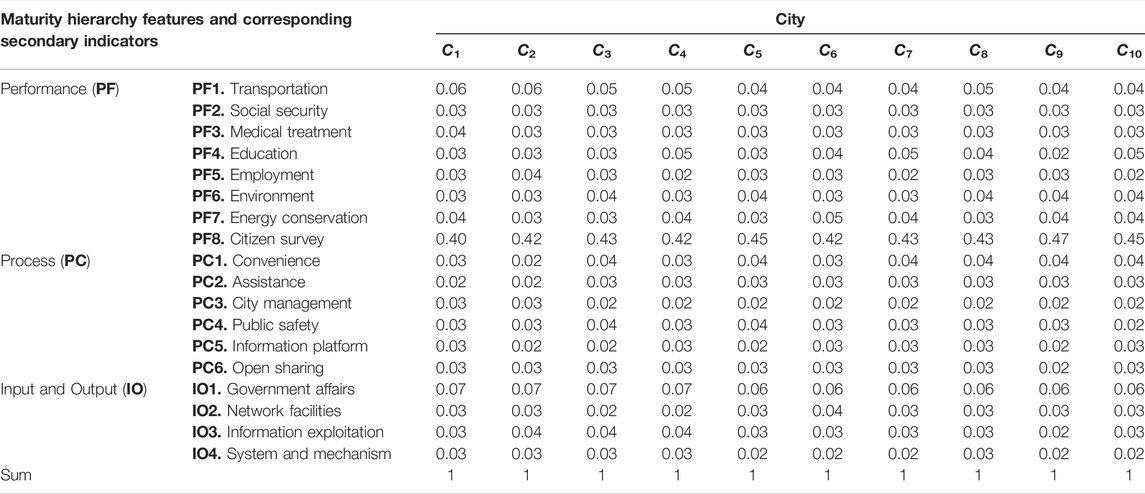
TABLE 5. Indicators weights of ten cities.
Meanwhile, all indicators are divided into three different types of maturity hierarchy features, according to the different aspects of city service development described by each indicator. Specifically, there are eight indicators that describe the performance feature of the city service, including transportation, social security, medical treatment, education, employment, environment, energy conservation, and citizen survey. These indicators reflect the development of city services in terms of outcome performance. As for process features, we consider six indicators for evaluation, including convenience, assistance, city management, public safety, information platform, and open sharing. These procedural indicators reflect the level of city service development in daily life and city management. Another maturity hierarchy feature is the input and output, it describes the development of the city services in terms of system construction and government policies. It consists of four indicators: government affairs, network facilities, information exploitation and system and mechanism.
5.4 Service Evaluation
In order to give each city an accurate service evaluation result, we have jointly carried out a cooperative demonstration project with the competent units of different departments of the city, and investigated the smart city service level of each city by using the MSES proposed in this study. The evaluation of citizen experience is carried out by issuing online questionnaires, and about 50,000 valid questionnaires are collected in each city, covering citizens of different genders, ages, and occupations. The evaluation results of 10 cities in 2016 and 2018 are shown in Table 6.
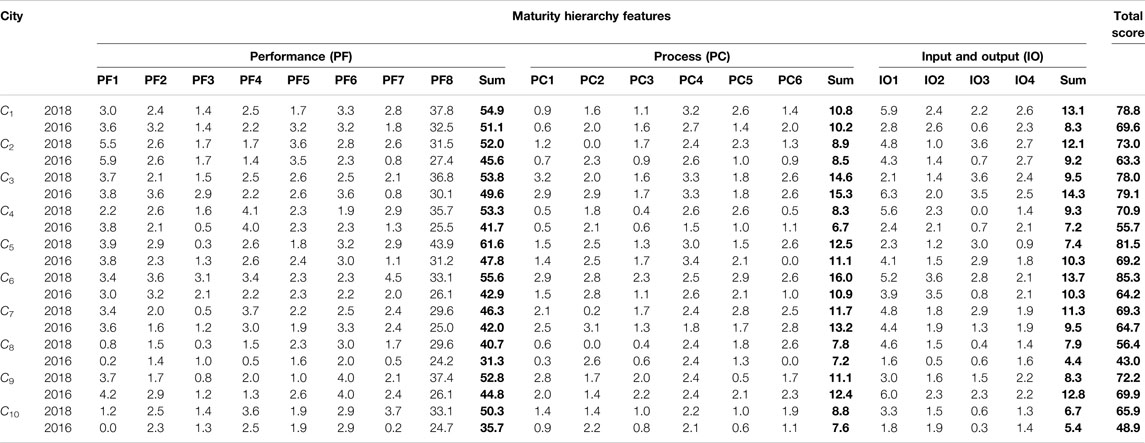
TABLE 6. Indicators weights of ten cities.
In Table 6, all the scores are weighted according to the individual weight of each city. The sum of performance, process, input, and output is shown to describe the evaluation results on each maturity hierarchy feature. In addition, the total score of each city is calculated to indicate their overall performance on smart city service development.
Comparing the data of 2016 and 2018, it can be found that the maturity hierarchy feature scores and the total scores of most cities have improved to some extent expect C3. In terms of C3, the score on IO1 (government affairs) dramatically drops from 6.3 to 2.1, which leads to an unexpected decline in the total score.
Another notable city is C6. The total score increases rapidly from 64.2 to 85.3, and one of the important factors is the development of process features. The procedural score of C6 increases by 5.1, while the change in other cities does not exceed 2.0. This shows that C6 attaches great importance to people’s daily life. The score of C6 on PF8 (citizen experience) increases by 7.0, which verifies the public’s recognition of improving the quality of life.
However, although there is a minor decline on the total score of C3, the scores on PF8 (citizen experience) of all cities have remarkable increases. This phenomenon reflects that the research and development of smart city services in various cities indeed brings different degrees of improvement to the quality of life of local citizens.
5.5 Maturity Model Analysis
In this section, we take C10 as an example to analyze our proposed maturity model in detail. As shown in Table 3, C10 is an inland city with a small population, and education is its main development focus. In Figure 3, the first and the most important step is to determine the development objectives of the city. In terms of C10, the objective on each indicator is determined based on the evaluation results in 2016. The detailed comparison between the actual state and the development objective is shown in Table 7 in logarithmic form. All scores are weighted according to the individual weights of C10 on each indicator. The corresponding objective degree of the maturity is listed within the bracket.
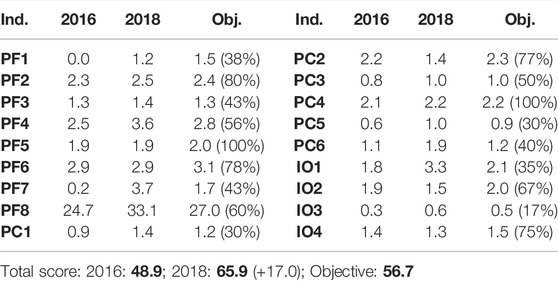
TABLE 7. Comparison between 2016 and 2018 of C10.
The fourth step in MMSE is to map the evaluation results to the development objectives. First of all, in the evaluation cycle from 2016 to 2018, C10 focused on developing intelligent transportation services, such as electronic bus cards and electronic stop signs, so its PF1 (transportation) score was significantly improved, achieving progress from scratch (0–1.2). At the same time, due to the large-scale promotion of the use of electric buses instead of fuel vehicles, C10 has achieved remarkable results in energy-saving construction, and the corresponding PF7 score (energy conservation) has increased dramatically from 0.2 to 3.7.
Another noteworthy score is PF4 (education). C10, as a city focusing on education development, has further improved its education quality in the past 2 years, and the corresponding score has increased from 2.5 to 3.6.
The development of transportation, energy conservation, and education is the concrete embodiment under the guidance of the relevant policies of the local government. Specifically, in government affairs, the government management level of C10 has been improved, and great progress has been made in using digital means to intelligently manage cities. As a result, the corresponding score on IO1 (government affairs) has increased from 1.8 to 3.3.
However, some scores have also declined such as PC2 (assistance), IO2 (network facilities), and IO4 (system and mechanism). The decline of these indicators show that there may be omissions in the local government’s development policies in related areas. Although each city has its own different city features and development objectives, it is necessary to pay attention to the chain reaction in the key areas of city development to avoid abnormal development. The more intuitive comparison of each indicator is shown in Figure 4 by a bar chart.
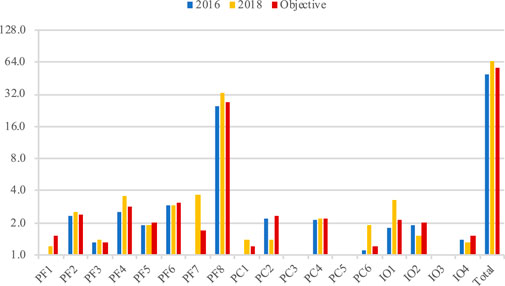
FIGURE 4. Comparison of evaluation results in 2016 and 2018. The red bar is the development objective of C10 in 2018.
In general, the total score of C10 increased from 48.9 to 65.9, 9.2 higher than the development objective. On one hand, according to the evaluation results in 2016, the local government analyzed the advantages and disadvantages of smart city services in various aspects, formulated targeted policies, and concentrated on the development of key items, which brought about the improvement of the overall level of city services. In terms of subjective indicators, the obvious improvement of PF8 (citizen survey) score reflects the affirmation of local citizens on government work and clearly feels the improvement of life quality.
On the other hand, by comparing the evaluation results of smart city services in 2018 and 2016, the local government can summarize and analyze the policy guidelines and construction achievements in the past 2 years more scientifically. In terms of C10 it shows necessity to strengthen the reform and innovation of the overall planning mechanism and management mechanism. Therefore, digital and intelligent innovation of the management can be optimized, thus improving the operational efficiency of the mechanism. Meanwhile, as the hardware foundation of smart city service, it plays a decisive role in service quality and service content, and there is still much room for improvement in the construction of basic network facilities. In terms of assistance services, it is necessary to speed up the construction of electronic information files for the poor, achieve barrier-free access to government portals, websites of various departments, and mainstream media websites, and make full use of information technology to help the poor, disabled people and other difficult groups.
Through the above analysis, the MMSE framework proposed in this study can accurately reflect the development level of smart services in cities through high confident evaluation, and make targeted decision-making assistance by comparing with development objectives. In addition, by analyzing the actual development situation, MMSE has a feedback mechanism to adjust the evaluation indicators and the development objectives. Therefore, the local government can constantly adjust existing policies and formulate new policies according to the actual development situation. As a result, the city’s various services and the overall smart service level can be effectively and iteratively improved.
6 Conclusion
In this study, we first propose a MSES to describe various smart city services with different levels. Both subjective and objective indicators are considered in MSES and several typical indicators are introduced in detail. Then, we use multiple labels to describe cities with different characteristics and introduce a multi-label-based individuation weight algorithm to give personalized weights to specific cities. In addition, we propose a MMSE framework to give a standardized and high confident evaluation for the smart city services and help to analyze and make feedback to the government policies. Finally, taking 10 cities in China as demonstration cases, we analyze the effectiveness of MMSE, and make a more detailed analysis on the policy and smart city service development of one city.
Data Availability Statement
The original contributions presented in the study are included in the article/Supplementary Material; further inquiries can be directed to the corresponding authors.
Author Contributions
HS: conceptualization, project administration, resources, and supervision; YZ: data curation, formal analysis, methodology, and writing—original draft; WW: investigation, methodology, visualization, and writing—review and editing; ZS: project administration, resources, and supervision; YF: funding acquisition and project administration; WL: funding acquisition and resources; and ZX: funding acquisition and resources.
Funding
This study was partially supported by the National Key R&D Program of China (No. 2018YFB2101500), the National Natural Science Foundation of China (Nos. 6210071278 and 61872025) and the Open Fund of the State Key Laboratory of Software Development Environment (No. SKLSDE-2021ZX-03), the Fundamental Research Funds for the Central Universities (buctrc202123). Thank you for the support from HAWKEYE Group.
Conflict of Interest
The authors declare that the research was conducted in the absence of any commercial or financial relationships that could be construed as a potential conflict of interest.
Publisher’s Note
All claims expressed in this article are solely those of the authors and do not necessarily represent those of their affiliated organizations, or those of the publisher, the editors, and the reviewers. Any product that may be evaluated in this article, or claim that may be made by its manufacturer, is not guaranteed or endorsed by the publisher.
References
Akin, T. (2018). Evaluation of Spatio-Temporal Forecasting Methods in Various Smart City Applications. Renew. Sustain. Energy Rev. 82, 424–435. doi:10.1016/j.rser.2017.09.078
Anttiroiko, A.-V., Valkama, P., and Bailey, S. J. (2014). Smart Cities in the New Service Economy: Building Platforms for Smart Services. AI Soc 29 (3), 323–334. doi:10.1007/s00146-013-0464-0
Balakrishna, C. (2012). “Enabling Technologies for Smart City Services and Applications,” in Proceeding of the 2012 sixth international conference on next generation mobile applications, services and technologies (IEEE), 223–227. doi:10.1109/ngmast.2012.51
Batty, M., Axhausen, K. W., Giannotti, F., Pozdnoukhov, A., Bazzani, A., Wachowicz, M., et al. (2012). Smart Cities of the Future. Eur. Phys. J. Spec. Top. 214 (1), 481–518. doi:10.1140/epjst/e2012-01703-3
Caird, S. P., and Hallett, S. H. (2019). Towards Evaluation Design for Smart City Development. J. urban Des. 24 (2), 188–209. doi:10.1080/13574809.2018.1469402
Caragliu, A., Del Bo, C., and Nijkamp, P. (2011). Smart Cities in Europe. J. urban Technol. 18 (2), 65–82. doi:10.1080/10630732.2011.601117
Giordano, A., Spezzano, G., and Vinci, A. (2016). “Smart Agents and Fog Computing for Smart City Applications,” in International Conference on Smart Cities (Springer), 137–146. doi:10.1007/978-3-319-39595-1_14
Hamid, M., Guvenc, I., Akkaya, K., Uluagac, A. S., Kadri, A., and Tuncer, A. (2017). Uav-enabled Intelligent Transportation Systems for the Smart City: Applications and Challenges. IEEE Commun. Mag. 55 (3), 22–28. doi:10.1109/MCOM.2017.1600238CM
Khajenasiri, I., Estebsari, A., Verhelst, M., and Gielen, G. (2017). A Review on Internet of Things Solutions for Intelligent Energy Control in Buildings for Smart City Applications. Energy Procedia 111, 770–779. doi:10.1016/j.egypro.2017.03.239
Khan, Z., Kiani, S. L., and Soomro, K. (2014). A Framework for Cloud-Based Context-Aware Information Services for Citizens in Smart Cities. J. Cloud Comp. 3 (1), 14. doi:10.1186/s13677-014-0014-4
Komninos, N., Bratsas, C., Kakderi, C., and Tsarchopoulos, P. (2015). Smart City Ontologies: Improving the Effectiveness of Smart City Applications. J. Smart Cities 1), 1–16. doi:10.18063/JSC.2015.01.001
Komninos, N. (2006). The Architecture of Intelligent Cities. Intell. Environ. 6, 53–61. doi:10.1049/cp:20060620
Komninos, N. (2008). “Intelligent Cities,” in Electronic Government: Concepts, Methodologies, Tools, and Applications (London: Routledge), 4205–4212. doi:10.4324/9780203894491
Lau, B. P. L., Marakkalage, S. H., Zhou, Y., Hassan, N. U., Yuen, C., Zhang, M., et al. (2019). A Survey of Data Fusion in Smart City Applications. Inf. Fusion 52, 357–374. doi:10.1016/j.inffus.2019.05.004
Lee, J., and Lee, H. (2014). Developing and Validating a Citizen-Centric Typology for Smart City Services. Gov. Inf. Q. 31, S93–S105. doi:10.1016/j.giq.2014.01.010
Li, D., Deng, L., Bhooshan Gupta, B., Wang, H., and Choi, C. (2019). A Novel Cnn Based Security Guaranteed Image Watermarking Generation Scenario for Smart City Applications. Inf. Sci. 479, 432–447. doi:10.1016/j.ins.2018.02.060
Lombardi, P., Giordano, S., Farouh, H., and Yousef, W. (2012). Modelling the Smart City Performance. Innovation Eur. J. Soc. Sci. Res. 25 (2), 137–149. doi:10.1080/13511610.2012.660325
Magrin, D., Centenaro, M., and Vangelista, L. (2017). “Performance Evaluation of Lora Networks in a Smart City Scenario,” in Proceeding of the 2017 IEEE International Conference on Communications (ICC) (IEEE), 1–7. doi:10.1109/icc.2017.7996384
Pan, J-G., Lin, Y-F., Chuang, S-Y., and Kao, Y-C. (2011). “From Governance to Service-Smart City Evaluations in Taiwan,” in Proceeding of the 2011 International Joint Conference on Service Sciences (IEEE), 334–337. doi:10.1109/ijcss.2011.74
Piro, G., Cianci, I., Grieco, L. A., Boggia, G., and Camarda, P. (2014). Information Centric Services in Smart Cities. J. Syst. Softw. 88, 169–188. doi:10.1016/j.jss.2013.10.029
Qian, Y., Wu, D., Bao, W., and Lorenz, P. (2019). The Internet of Things for Smart Cities: Technologies and Applications. IEEE Netw. 33 (2), 4–5. doi:10.1109/mnet.2019.8675165
Sam, A., and Cruickshank, P. (2011). Creating Smart-Er Cities: An Overview. J. urban Technol. 18 (2), 1–16.
Shen, L., Huang, Z., Wai Wong, S., Liao, S., and Lou, Y. (2018). A Holistic Evaluation of Smart City Performance in the Context of china. J. Clean. Prod. 200, 667–679. doi:10.1016/j.jclepro.2018.07.281
Song, H., Bai, J., Yi, Y., Wu, J., and Liu, L. (2020). Artificial Intelligence Enabled Internet of Things: Network Architecture and Spectrum Access. IEEE Comput. Intell. Mag. 15 (1), 44–51. doi:10.1109/mci.2019.2954643
Szabó, R., Farkas, K., Ispány, M., Benczúr, A. A., Bátfai, N., Jeszenszky, P., et al. (2013). “Framework for Smart City Applications Based on Participatory Sensing,” in Proceeding of the 2013 IEEE 4th International Conference on Cognitive Infocommunications (CogInfoCom) (IEEE), 295–300. doi:10.1109/coginfocom.2013.6719260
the People’s Republic of China (2018). Smart City: Application Guide of SOA Standard, GB/T 36445-2018.
Ting, C.-K. (2020). Surfing the Waves of Computational Intelligence [Editor's Remarks]. IEEE Comput. Intell. Mag. 15 (1), 2. doi:10.1109/mci.2019.2954572
Tu, W. (2018). Data-driven Qos and Qoe Management in Smart Cities: A Tutorial Study. IEEE Commun. Mag. 56 (12), 126–133. doi:10.1109/mcom.2018.1700870
Winters, J. V. (2011). Why Are Smart Cities Growing? Who Moves and Who Stays*. J. regional Sci. 51 (2), 253–270. doi:10.1111/j.1467-9787.2010.00693.x
Zhong, J., and Wu, Z. Evaluation of Urban Public Services in china, 2015. China: Social Sciences Academic Press [Chinese].
Keywords: smart city services, high confident evaluation, service evaluation, maturity model, data visualization
Citation: Sheng H, Zhang Y, Wang W, Shan Z, Fang Y, Lyu W and Xiong Z (2022) High Confident Evaluation for Smart City Services. Front. Environ. Sci. 10:950055. doi: 10.3389/fenvs.2022.950055
Received: 22 May 2022; Accepted: 23 June 2022;
Published: 22 July 2022.
Edited by:
Yiping Wu, Xi’an Jiaotong University, ChinaReviewed by:
Cheng Zhang, West Texas A&M University, United StatesTianjie Zhao, Aerospace Information Research Institute (CAS), China
Copyright © 2022 Sheng, Zhang, Wang, Shan, Fang, Lyu and Xiong. This is an open-access article distributed under the terms of the Creative Commons Attribution License (CC BY). The use, distribution or reproduction in other forums is permitted, provided the original author(s) and the copyright owner(s) are credited and that the original publication in this journal is cited, in accordance with accepted academic practice. No use, distribution or reproduction is permitted which does not comply with these terms.
*Correspondence: Yang Zhang, yang_zh@mail.buct.edu.cn; Wei Wang, wangweiinfo@sic.gov.cn