Variation in Vegetation Structure and Composition across Urban Green Space Types
 Caragh G. Threlfall1†
  Alessandro Ossola1*†
  Amy K. Hahs2,3
  Nicholas S. G. Williams1,2
  Lee Wilson1
  Stephen J. Livesley1
- 1School of Ecosystem and Forest Sciences, The University of Melbourne, Richmond, VIC, Australia
- 2Australian Research Centre for Urban Ecology, Royal Botanic Gardens Victoria, Richmond, VIC, Australia
- 3School of BioSciences, The University of Melbourne, Parkville, VIC, Australia
HIGHLIGHTS
• Vegetation structure and composition were measured in four major green space types
• Remnants and golf courses supported highest native plant richness
• Residential neighborhoods and urban parks supported highest exotic plant richness
• Residential neighborhoods lacked key habitat structures including old trees
• Green spaces can achieve complex vegetation with both native and exotic vegetation
The ecological sustainability and function of urban landscapes is strongly influenced by the composition and structure of the local plant community. Taxonomic composition generally refers to the identity of the species comprising the community, while we define structure as the presence of multiple canopy layers, as well as stems of varying diameter and age. These aspects of urban vegetation significantly influence the ecology of cities, yet they are generally poorly quantified across the range of natural and constructed plant communities present in urban landscapes. We quantified vegetation composition and structure to (i) simultaneously assess their variation across four green spaces types (golf courses, public parks, residential neighborhoods, and patches of remnant vegetation) in Melbourne, Australia, and (ii) investigate the relationship between vegetation composition and structure within these green spaces. The four green space types supported distinctly different plant communities. Vegetation composition in the residential neighborhoods differed significantly from the others (p < 0.05), largely due to the increased richness of shrubs and cultivated plants, and the reduced presence of large trees. Residential neighborhoods had the highest plant species richness, although a large proportion of these species occurred infrequently. The structural complexity of understorey vegetation (calculated as % volume occupied) below 0.5 m was highest in remnant patches followed by golf courses, public parks, and residential neighborhoods. The structural complexity of understorey vegetation in remnant vegetation patches was very similar to that of golf courses even though some of the latter were dominated by exotic plant species. Variation in the composition and structure of urban vegetation might have great implications for the retention of faunal diversity within cities because different taxa have specific habitat requirements. Hence, further understanding of variations in the composition and structure of both natural and constructed plant communities in cities will greatly improve our ability to create urban landscapes that enhance both plant and animal biodiversity.
Introduction
The vegetation and soil in urban green spaces determine the capacity of the urban environment to support biodiversity. Green space vegetation and soil are also the components most easily manipulated by humans through disturbance and direct management actions (Byrne, 2007; Faeth et al., 2012; Ossola et al., 2016). Networks of green space in cities all over the world are increasingly recognized as fundamental to the health and wellbeing of urban residents and important in creating a sense of place and a connection to the natural world (Fuller et al., 2007; Tzoulas et al., 2007; Dinnie et al., 2013). Urban green spaces can be comprised of a diverse array of plants and provide habitat to a great diversity of invertebrates, birds and other organisms (Sandström et al., 2006; Beninde et al., 2015). Vegetation also provides direct and indirect ecosystem services such as microclimate cooling, pollution removal, and food provision (Bolund and Hunhammar, 1999; Derkzen et al., 2015; Hunter and Luck, 2015; Livesley et al., 2016). Understanding the nature and variability of the vegetation within networks of green space can help inform our knowledge of the distribution of the ecosystem services it provides and the composition of faunal communities that depend on it. It can also help prioritize strategic management of urban green space vegetation so that it provides the greatest benefit to humans and biodiversity (Fontana et al., 2011).
Any urban green space network is likely to consist of a combination of public spaces (e.g., streetscapes, remnant nature reserves, public parks) and private spaces (e.g., golf courses and residential gardens; Tzoulas et al., 2007). Within these different types of urban green space, vegetation is subject to various formal and informal management practices depending upon the ownership, objectives, available resources (time and money), and current understandings of management best-practice. Differences in ownership and custodianship can contribute greatly to the diversity in green space vegetation management and influence the structure, composition, and distribution of plant communities across the urban landscape. For example, management decisions may be “top-down,” such as those imposed by planning guidelines, conservation obligations, or homeowners associations, and/or the management decisions may be from the “bottom-up” such as those made by individual park management contractors, local friends groups or individual home and garden owners (Kendal et al., 2012a).
Ecosystems that contain many different structural elements are likely to have a variety of resources (e.g., pollen, nectar, leaf litter, hollows, shelter sites) and support a greater diversity of species (Bell et al., 1991; Tews et al., 2004; Bergen et al., 2009). In urban landscapes, the composition, structure, and coverage of vegetation has been recognized as a prime determinant of habitat quality, impacting upon the levels of biodiversity recorded in cities (Beninde et al., 2015). A relationship between vegetation vertical complexity and species richness was first hypothesized and demonstrated through a positive relationship between foliage height diversity and bird species diversity (MacArthur and MacArthur, 1961). Since then, the importance of vegetation composition and structure has been demonstrated for various taxa in natural and managed landscapes (e.g., Skowno and Bond, 2003; White et al., 2005). In urban landscapes, vegetation has been found to be the major habitat for most species of vertebrates and invertebrates living aboveground, while simultaneously influencing the belowground habitat for fungi, microorganisms, and burrowing organisms (Byrne, 2007). The complexity of urban vegetation has also been recently found to be a significant predictor for the diversity of numerous organisms involved in key biogeochemical and hydrological processes (Ossola et al., 2015b, 2016).
Despite the importance of urban vegetation for ecosystem functioning, few attempts have been made to compare vegetation throughout the highly heterogeneous network of urban green spaces in the public and private realm using standard methods. Although many approaches have been developed and used to describe vegetation structure in natural and other human modified landscapes (McElhinny et al., 2005), little data exists on the extent to which urbanization modifies vegetation across the range of urban green spaces (Le Roux et al., 2014). The few studies where a variety of structural attributes have been quantified have usually focused on an individual type of urban green space (e.g., streetscapes, White et al., 2005) or the variability in habitat attributes amongst urban and non-urban areas (e.g., urban vs. agricultural and natural areas, Le Roux et al., 2014). Very few studies have actually evaluated the structural attributes present and differences in vegetation composition in different types of green space. However, by using this combined approach we can gain a deeper understanding the underlying habitat drivers of species distributions and community assemblages (McDonnell and Hahs, 2013).
In this study we aimed to develop and test a robust method to concurrently quantify vegetation taxonomic composition and structure in various urban green space types. Through testing this method, we addressed the following research questions:
1) Are taxonomic composition and structural complexity of vegetation similar within a diverse network of urban green space types; and
2) What is the relationship between vegetation structural complexity and taxonomic composition?
Based on our findings, implications for habitat provision for urban wildlife and biodiversity conservation are also discussed.
Materials and Methods
The greater Melbourne metropolitan area (population 4.4 million) lies at the intersection of four bioregions, and there is a large rainfall gradient across the city ranging from 500 mm per annum in the west to 1100 mm per annum in the Dandenong Ranges to the east (Bull and Stolfo, 2014). To minimize the influence of these environmental and biophysical factors we limited our study sites to the Southern Coastal Plain bioregion in the south east of metropolitan Melbourne (Figure 1).
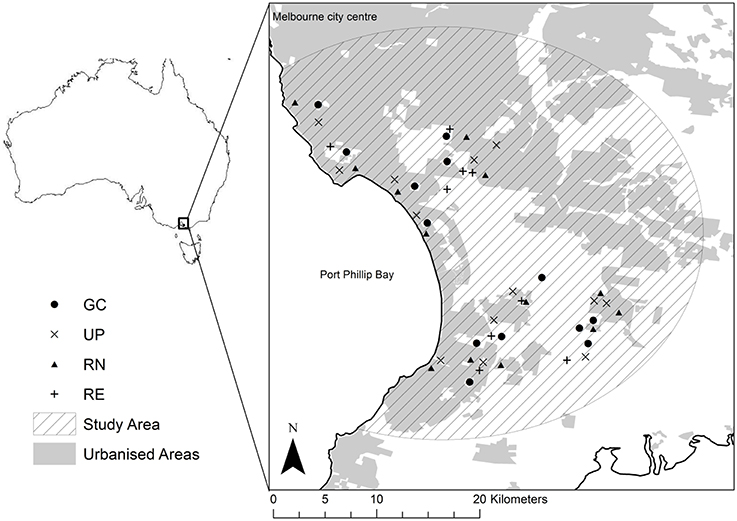
Figure 1. Location of the study sites within the greater Melbourne metropolitan area (light gray), showing the location of the golf courses (•), local urban parks (x), residential neighborhoods with private gardens (▴), and patches of remnant vegetation (+) that were surveyed during this study.
Prior to European settlement the area contained a mosaic of heathland, grassy woodland and swamp vegetation communities. Vegetation patterns were largely driven by geology and soil type. Heathlands occurred on deep, infertile, wind-blown sands deposited during periods of lower sea level with areas of shallower sands and swales supporting heathy woodland or damp heathland. Grassy woodlands, dominated by River Red Gum (Eucalyptus camaldulensis), occurred on more fertile alluvial soils along broad drainage lines and on plains of tertiary sediments not covered by sand sheets. Many different wetland and swamp vegetation communities occurred in depressions, dune swales, and areas of impeded drainage throughout the study area (Scott et al., 2002; Bull and Sinclair, 2014). Since the establishment of Melbourne in the 1830s, most of these wetland areas have been drained for agricultural and then urban development. The landscape of the study area has evolved to a mix of residential, commercial, and industrial developments, interspersed with areas of green space consisting of private residential gardens and streetscapes, small local public parks, public and private golf courses, publically accessible small isolated areas of remnant vegetation, and a few remaining private market gardens. The southern part of the study area is now the focus of new “green field” developments on former agricultural land as the city expands.
Within this region, we identified 13 suburbs and selected within each a golf course (GC), a public park (UP), and a residential neighborhood (RN) within 1 km of the golf course. We randomly selected four streets within each of the 13 RNs, and invited households on those streets to take part in the study by mail. Plots in residential areas were established across the front-yards of willing participants, and the adjacent street vegetation [typically grass verge with street tree(s)]. To compare the vegetation of GC, UP, and RN with that of previous indigenous plant communities, we also identified nine patches of remnant vegetation (RE) within the same bioregion (total number of green spaces n = 48: GC = 13; UP = 13; RN = 13; RE = 9). Information about the age, size, and location for each of our study sites can be found in Supplementary Material 1.
Within our 48 green spaces, we randomly established 225 plots to measure vegetation structure (GC = 53; UP = 32; RN = 99; RE = 41), and due to resource constraints sub-sampled 171 of these plots to measure vegetation composition (GC = 53; UP = 26; RN = 56; RE = 36). A minimum of two plots were established in green space sites < 5 ha in size. Two additional plots were established for every 5 ha increase in green space size, up to a maximum of eight plots in large residential neighborhoods or golf courses. We sampled the structure and composition of the vegetation in GC, UP, and RE using 20 × 30 m vegetation plots which, with the exception of residential plots, were randomly selected and positioned using digital aerial photographs. Within each golf course we established four vegetation plots in “out of play” areas that had a tree canopy and an understorey of grass and/or shrubs (GC). In each patch of remnant vegetation we similarly established four randomly located 20 × 30 m vegetation plots. The UPs were considerably smaller than the GCs and most REs, therefore, at each UP we only established two plots in areas with some tree canopy over an understorey of grass and/or shrubs. Within the RNs we mailed all residents to request access to their front gardens. From those that responded positively we randomly selected four residential properties and established vegetation plots that consisted of the entire front garden and the public space between their garden boundary and the center of the road, including any road side vegetation. The width and depth of each front garden primarily dictated the size of each plot in the residential neighborhoods as we could only sample properties for which we had permission. Sampling of vegetation structure and composition in RN, UP, and GC was undertaken in September and October 2011, whereas RE was sampled in September-October 2012. These months are typically the peak flowering period in Melbourne providing the greatest opportunity to identify species.
Vegetation Composition
The composition of the vegetation within each sampling plot was assessed by systematically traversing the plot and identifying all vascular plant species. Species that could not be identified in the field were collected and identified using taxonomic keys in native and horticultural Floras (Gray, 1993; Walsh and Entwisle, 1994, 1996, 1999; Spencer, 1995). Horticultural cultivars were not considered as taxonomically separate. Species were then categorized depending on whether they were (1) indigenous to the Southern Coastal Plain bioregion, (2) native to Australia (includes the indigenous species), or (3) introduced to Australia (i.e., exotic). Those species that could only be identified to genus were categorized to the two latter groups where possible. Woody species were classified in shrubs and trees based on the Burnley Plant Guide (The University of Melbourne, 2012) and available Floras.
Habitat Structure
Understorey and Ground Cover
To measure structure of understorey vegetation within a plot, we used a point-intercept method which has previously been used to study the response of wildlife to vegetation volume (Mills et al., 1991; McElhinny et al., 2005), and to represent vegetation structure in urban landscapes (Rupprecht and Byrne, 2014). Four parallel 30 m transects were established at 5 m intervals (Figure 2), and used to sample vegetation intercepts at 0, 5, 10, 15, 20, 25, and 30 m from the starting point of each transect (e.g., 4 transects × 7 locations = 28 points sampled). At each sampling point, we recorded: (1) the type of ground cover (bare ground, pavement, leaf litter, rock, gravel, mulch, vegetation) and (2) all instances where vegetation intercepted a vertical measurement pole within five height intervals: 0.0–0.2; 0.2–0.5; 0.5–1.0; 1.0–2.0; and > 2.0 m. Vegetation that intercepted the measurement pole was classified according to plant growth form (tree, shrub, fern, forb, climber/scrambler, tussock grass, rhizomatous grass). For each height interval within the plot, the number of vegetation intercepts were summed and used to calculate the vegetation volume within that height interval using the formula:
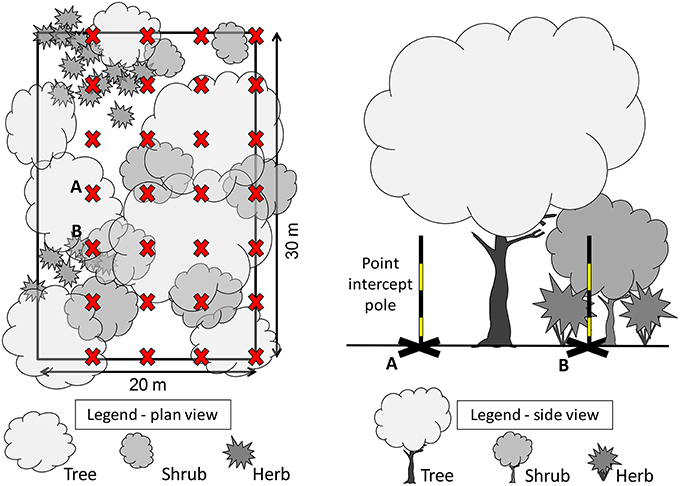
Figure 2. Plan view (left) of a vegetation plot measuring 20 m by 30 m, with 28 points (X) located at 5 m intervals along four 30 m transects. Side view (right) of two vegetation structural complexity measurement points (A and B), showing the point intercept pole estimating a low understorey vegetation volume at location A, and a high understorey vegetation volume estimate at B, where it intercepts shrub and herb beneath a tree over-storey.
VVEGHX = ((PNIHX/PTHX) × VSHX) (1)
where VVEGHX is estimated vegetation volume occupying a specific height interval, PNIHX is the actual number of times vegetation intercepted the pole for that height interval, PTHX is the number of pole point locations surveyed (usually 28 for a 600 m2 plot), and VSHX is the total volume for that height interval based on the area of the plot multiplied by the height interval. To account for irregular plot sizes, we divided the sum of the estimated volumes by the total available volume (area sampled multiplied by total height) to produce a percentage estimate of vegetation volume in that plot.
To specifically measure the contribution of understorey vegetation we removed all “tree” intercept records and present understorey vegetation volume at only three height bands at: 0.0–0.5, 05–1.0, >1.0 m.
Overstorey
Within each plot, the stem diameter at 1.3 m (DBH) of every tree having diameter >8 cm in the plot was recorded, the tree species identified and health of all trees (category ranging 1–8 from healthy tree with no dead limbs to dead stump < 5 m high) assessed to determine the number of “dead” trees. Height of all trees in the plots was calculated using a clinometer.
Data Analysis
Differences in vegetation composition in the four urban green space types were tested using non-metric multidimensional scaling (NMDS) on a Bray-Curtis dissimilarity matrix based on species presence-absence data, followed by one-way permutational anova (PERMANOVA). Plant species accumulation curves for the four green spaces types were built using the function specaccum in R 3.1.0 (R Development Core Team, 2012), randomizing for plot order (Gotelli and Colwell, 2001). NMDS, species accumulation and rank-abundance curves were calculated using the packages vegan (Oksanen et al., 2014) and BiodiversityR (Kindt and Coe, 2005). Species presence/absence data per plot was used to calculate the Chao1 estimator of species richness for each green space type using the iNext online tool (Hsieh et al., 2013).
To examine differences in vegetation and habitat structure amongst green spaces, we used generalized linear mixed models (GLMMs), an approach that allowed us to account for the nested nature of the experimental design. In all models, “site” was specified as a random effect, to account for multiple plots within each of the green spaces sampled. We specifically examined differences across green space habitats for 12 measures of vegetation and habitat structure recorded within each plot: volume of understorey vegetation within the three height bands; % cover of bare soil and leaf litter; density of trees within three diameter classes (<40, 40–80, and >81 cm); in addition to the density of all trees, dead trees, native trees, and trees indigenous to the bioregion. Response variables were logx+1 transformed to improve normality, but for two variables (density of dead trees and trees >80 cm DBH) normality could not be achieved and we instead used presence/absence of the features. We fitted models with a normal distribution, and the presence/absence models with a binomial distribution. We conducted a Tukey-HSD test for each model to assess which green space types significantly differed for each variable. These analyses were performed using the lme4 (Bates et al., 2015) and multcomp (Hothorn et al., 2008) packages in R. To investigate the relationship between vegetation composition and structural complexity we plotted the proportion of native plants within a green space against the percentage of understorey volume occupied by vegetation at <0.5, 0.5–1.0, and 1.0–2.0 m.
Results
Vegetation Composition
A total of 1000 plant species were recorded across the four types of green space. The Chao1 estimate of total plant species richness was 1557 species, where the greatest difference between actual and predicted species richness was for exotic species in the RN (Table 1). We recorded 193 species locally indigenous to the bioregion, and a further 138 species native to Australia (Table 1). Residential neighborhoods contained the highest richness of observed and predicted plant species followed by GC, RE, and UP (Table 1). Golf courses and REs contained the highest proportion of observed native Australian plant species, while RNs and UPs contained the highest proportion of observed exotic species (Table 1).
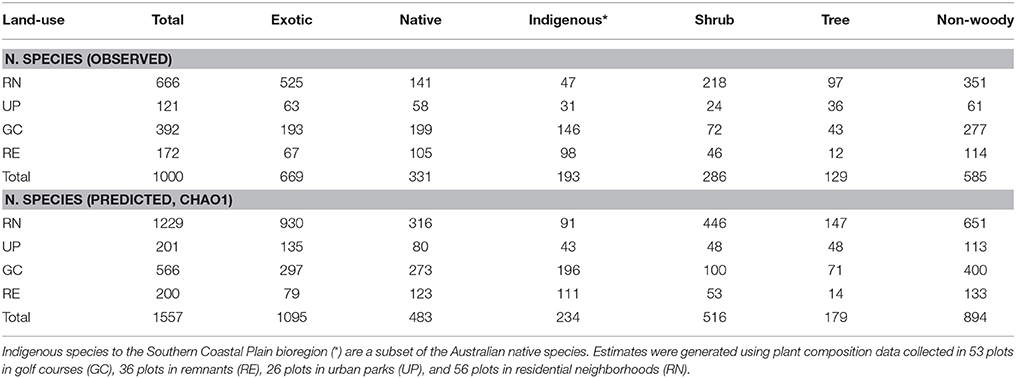
Table 1. The total and predicted number of vascular plant species (native, exotic and locally indigenous) and plant forms (shrub, tree, non-woody) recorded in each of the four green space types.
Public parks (UP) had the lowest rate of species accumulation over the first 20 plots (Figure 3), and therefore the relatively low richness of species is not an artifact of the fewer number of plots sampled. REs had a typical species accumulation curve showing a relatively rapid initial accumulation rate that leveled out after ~20 sample plots (Figure 3). Within GCs there was a relatively steady accumulation of species over the number of plots sampled (Figure 3). The RNs had the highest rate of accumulation, despite the smaller area of each sampled plot, and the accumulation rate was relatively steady across all the plots sampled (Figure 3). This indicates that sampling was sufficient in UP, RE, and GC green space types, however further sampling in RN would have revealed greater species richness, as supported by the predicted species richness estimate of 1229 plant species, which is dominated by the contribution of exotic species (Table 1). When considering woody species accumulation curves separately from all plants (Supplementary Material 2), shrub species were contributing more than tree species to species accumulation within RN. Overall, the patterns amongst the four green space types were consistent regardless of all plant, tree only, or shrub only accumulation curves.
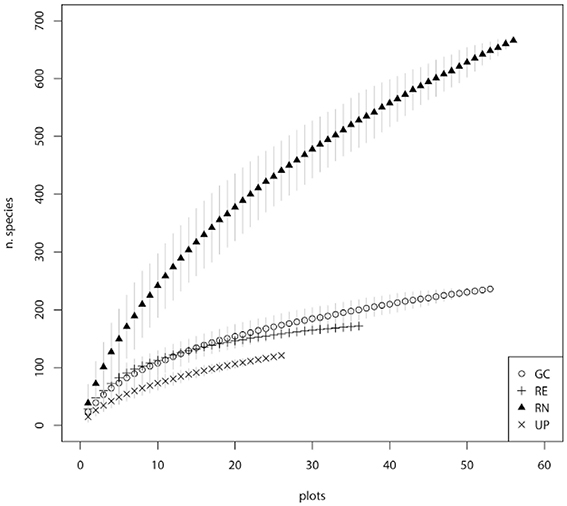
Figure 3. Species accumulation curves for the four major types of green space: golf courses (GC), public parks (UP), residential neighborhoods (RN), and patches of remnant vegetation (RE).
The plant species composition of all four green space types was significantly different to each other (p < 0.001 in all cases). Plant species composition of GCs was most similar to REs (Figure 4), but distinctly different to RNs and UPs, although the vegetation composition of UP appeared intermediate between GC and RN. The stress value of the 2D ordination is 0.22.
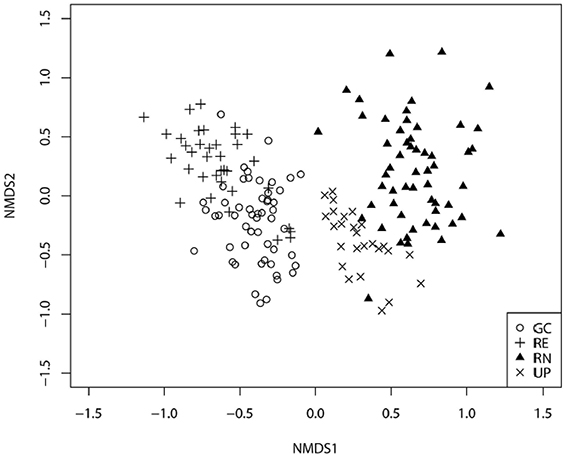
Figure 4. Non-metric multidimensional scaling ordination for plots recorded in the four types of green space: golf courses (GC), public parks (UP), residential neighborhoods (RN), and patches of remnant vegetation (RE).
The rank abundance curves (Figure 5) indicated that species evenness was low for UP and RG as their steep gradients indicates that high-ranking species have much higher proportional abundances (frequency of occurrence in plots as measured here) than low ranking species. Whereas the shallower initial gradients of GC and RE indicate higher evenness as the abundances of different species are more similar (Figure 5). However, UP has the greatest proportional species abundance (>6) and RN the least (<2.5) indicating that RN had only a few species of very high abundance and many species in this green space type were low in abundance, as confirmed by the high species richness (Figure 5).
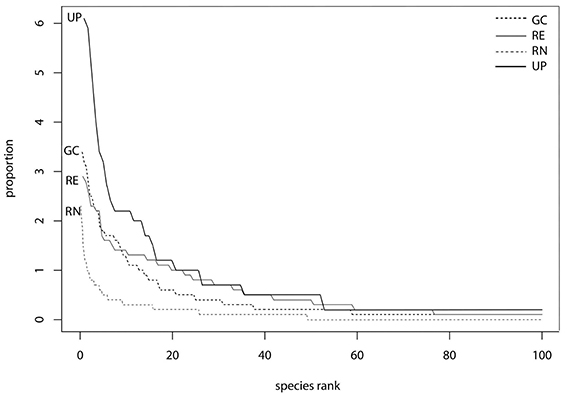
Figure 5. Rank abundance curves based on frequency of all plant species found in golf courses (GC), remnants (RE), residential neighborhoods (RN), and urban park (UP) plots, respectively. Proportional species rank (horizontal axis) has been scaled by the total number of species (n = 1000). Proportional species abundance (vertical axis) has been calculated as species abundance divided total abundance.
Habitat Structure
Tree Stem Density
Across all types of green space, tree stem density was greatest for small trees (<40 cm stem DBH) and stem density decreased as stem diameter increased to medium sized trees (40–80 cm DBH; Figure 6). Total tree stem density was greatest in the patches of RE and GC plots (Figure 6A). The probability of observing large trees (>81 cm DBH) was highest in GC (Figure 6F). The highest density of dead trees was in RE and GC plots. Very few dead trees were recorded in the other green space types (Figure 6J). The majority of trees in UP, GC and RE were native to Australia, and of those in RE plots the vast majority were indigenous to the bioregion, as would be expected. There were few native or locally indigenous trees in RN plots (Figures 6B,C).
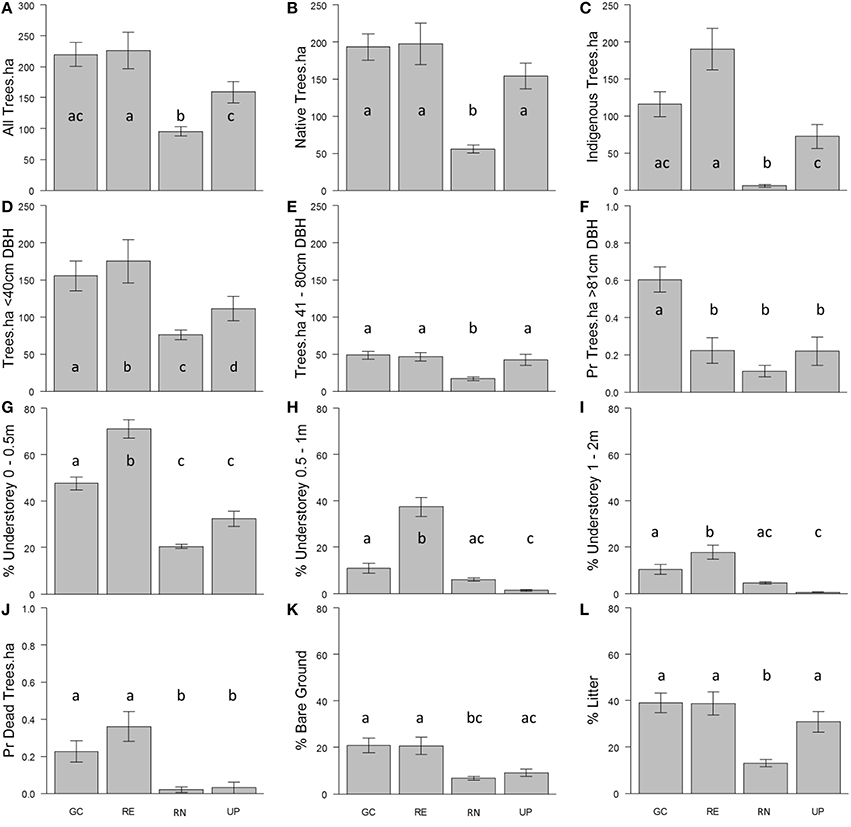
Figure 6. The average density of: (A) all trees per hectare (ha); (B) native trees per hectare; (C) indigenous trees per hectare; (D) trees <40 cm diameter at breast height (DBH) per hectare; (E) trees 41–80 cm DBH per hectare; (F) trees >81 cm DBH per hectare (probability of presence); the average percent volume occupied by vegetation (excluding trees) per plot at: (G) 0.0–0.5 m; (H) 0.5–1.0 m; and (I) >1.0 m height intervals; (J) the probability of presence of dead trees per hectare; and percent cover per plot of: (K) bare ground and (L) leaf litter, recorded in the golf course (GC), remnant vegetation (RE), residential neighborhoods (RN), and public parks (UP) during the vegetation survey. Error bars represent ± 1 standard deviation. Lower-case letters indicate statistically similar values based on pairwise comparisons following GLM (Supplementary Material 3).
Understorey Vegetation Volume
The average volume of vegetation (excluding trees) in all green space types was greatest in the 0.0–0.5 m height interval, as compared to the two taller height classes (Figures 6G–I). The percent volume occupied for all three height classes was greatest in RE followed by GC. Urban parks and RNs had very little vegetation volume above 0.5 m in height (Figures 6H,I).
Ground Cover
The percent cover of leaf litter was greatest in RE, UP, and GC and was lowest in RN (Figure 6L). The percent cover of bare ground was ~20% in GC and RE, where UP and RN recorded half as much bare ground (Figure 6K).
Relationship between Vegetation Composition/Origin and Structure
The relationship between the origin (native or exotic) of the vegetation, and the volume occupied by the understorey (surrogate for structural complexity) indicates that the RE plots were dominated by native plants and yet the volume their understorey (0–0.5 m) occupied ranged from <20 to >95% (Figure 7). The GC plots ranged from being dominated by exotic vegetation to dominated by native vegetation but still recorded very similar volumes of understorey vegetation when compared to RE plots, especially at 0–0.5 m (from 10% to >95%; Figure 7). This suggests that the structural complexity of GC and RE can be very similar although achieved via different vegetation composition.
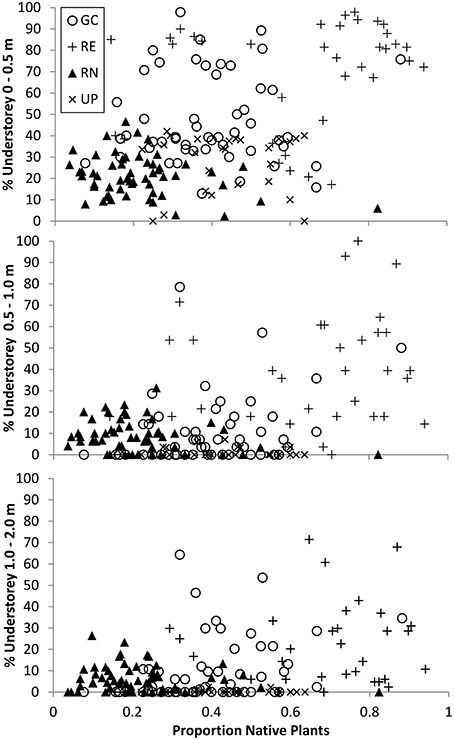
Figure 7. The relationship between percent (%) understorey vegetation structure and composition for three height bands measured in all 171 plots where vegetation composition was recorded. Circles represent golf course (GC), plus sign represents remnant vegetation (RE), triangles represent residential neighborhoods (RN), and crosses represent public parks (UP). Composition data presented is the proportion of species per plot that are native as compared to the total number of species recorded for that plot, and varies between 0 and 1.
Discussion
Taxonomic Composition of Vegetation in Urban Green Spaces
Our study recorded a very high plant species richness across the four urban green spaces (1000 species). However, the allocation of species between green space types indicated different patterns of species richness and composition. This is reflected in the different shapes of the species accumulation curves for the four different green space types (Figure 3). The asymptotic curve for remnants (RE) is typical of those for natural areas and reflects the finite number of native species from the regional species pool that can occupy are particular habitat and the management objectives of remnants which includes alien plant removal. Urban parks (UP) had a relatively shallow curve, indicating that they are being planted with species from a limited pool and managed in a way that produces similar vegetation composition of species across parks. The golf course (GC) curve reflects the greater diversity of plantings within golf courses compared to parks and remnants, as well as the variability in vegetation management approaches between golf courses related to the “style” of the course (links, bushland, or parkland) and subsequent decisions around plant selection. Residential neighborhoods (RN) supported a floristically diverse and heterogeneous plant assemblage evidenced by steeply increasing accumulation curves. These steep curves indicate that the full composition of species is unlikely to have been recorded in this study. This is supported by the Chao 1 estimates which predicts that there are likely to be an additional 557 species present in these green spaces, 72.7% of which are likely to be exotic species in RN (Table 1).
Similar to this study, Loram et al. (2008) reported a high diversity of plant species in residential neighborhoods, and attributed this to the large number of plants available through the nursery industry, the diversity of individual gardening practices and individual residents' preferences and management actions. These would maintain plant populations characterized by high species richness but extremely low abundances (Kendal et al., 2012b,c), a pattern also observed in this study (Figures 3, 5). The result is highly heterogeneous plant assemblages in residential neighborhoods that vary considerably over small spatial scales.
Structural Complexity of Vegetation in Urban Green Spaces
The volume of vegetation that plants occupy within the different green spaces was highly variable (Figures 6G–I,7). Understorey vegetation in RN and UP was relatively sparse above 0.5 m in height (Figures 6G–I). This suggests that management practices in these green spaces produce relatively low vegetation volume in the understorey, and reduced densities of trees relative to other green space types (Figures 6A–C). There are several potentially underlying drivers behind this vegetation structure, including the innate human preferences for savannah-like landscapes, perceptions of safety, aesthetic preferences, or efficiency of management. Exploring these potential drivers lies outside the scope of the current paper, but could provide important avenues for future research.
Ground surface covers and large living or dead trees have all been identified as important for wildlife, but are habitat features that are often limited in urban landscapes (Le Roux et al., 2014; Van Heezik et al., 2014). In our study, residential neighborhoods had little bare soil, little leaf litter, few large trees and few standing dead trees. However, they did contain a high diversity of plant species, particularly flowering species, which may provide pollen and nectar when it is scarce or absent in nearby remnant vegetation patches or large, but structurally simple green spaces (urban parks, some golf courses). The fauna biodiversity that residential neighborhoods support is likely to reflect the available habitat resources. As such, residential neighborhoods are likely to support generalist species, rather than species that require specialized habitat attributes such as bare soil, leaf litter, large trees, dead trees, and complex understorey vegetation or those dependent of particular plant species or genera (Threlfall et al., 2015).
Previous studies of urban golf courses have highlighted their role in urban biodiversity conservation (Hodgkison et al., 2007; Colding and Folke, 2009; Threlfall et al., 2015). Patches of remnant vegetation (RE) and out-of-play areas of golf courses (GC) were similar in vegetation structure and similarly possessed large trees and standing dead trees. However, these two green space types varied considerably in the proportional presence of native plant species. The retention of large trees and standing dead trees in GC may reflect the greater autonomy of golf course managers to assess the potential human safety hazards and make decisions to retain mature or dead trees in these landscapes, where risks can be managed by reducing access to the trees, rather than relying on the more risk-averse pruning or removal options commonly observed in UP where there are public liability legal concerns. Golf course managers may also have more flexibility to retain standing dead trees for their habitat value, as management considerations are evaluated under different criteria to those that are used in landscapes such as public parks or residential neighborhoods. This highlights the importance of protecting these larger private green spaces in addition to the patches of remnant vegetation in nature reserves, because they increase the range and diversity of habitat structures and resources. Despite this, large green spaces like golf courses should not be seen as a replacement for remnant vegetation patches because the latter provide more structurally complex understorey and are an important refuge for indigenous plant species and the specialist fauna that may be dependent on them. Maintaining both green space types within the urban landscape increases the overall availability of structurally complex vegetation for fauna.
The vegetation of public parks was highly simplified in both structure and composition. Public parks have a high evenness as they are planted with a limited suite of plant species that are also found in the three other green space types. The simple vegetation structure in public parks was due to relatively low tree stem density, a sparse understorey volume, and a relatively high cover of imported mulch. This suggests that public parks may provide habitat for animals that favor open vegetation structure such as ants (Norton et al., 2014; Ossola et al., 2015a) and aggressive bird species such as the noisy miner (Manorina melanocephala), who are able to gain dominance over the bird assemblage in areas with reduced structural complexity (Maron et al., 2013). These public parks are often designed and managed for basic amenity, safety and lowest cost of maintenance, rather than biodiverse habitat or ecosystem services. The evenness of plant communities amongst public parks could be perceived as a positive, in that it provides a wide geographic distribution of similar habitat, but it can also be perceived as a “lost-opportunity” if the biodiversity supported is already ubiquitous throughout the urban landscape. Shwartz et al. (2013) demonstrated that simple “differential management” can increase biodiversity in small (0.2–2.0 ha) urban parks regardless of urban landscape context. This highlights that fairly rapid improvements in biodiversity can be achieved easily and at relatively low expense, by simply improving the habitat quality of public parks depending upon the biodiversity priorities and objectives for that site (McDonnell and Hahs, 2013; Shwartz et al., 2013).
Our study quantifies the distinct differences in vegetation composition and structure in four major types of urban green space. These differences highlight that the network of urban green spaces can support a wide variety of habitat forms and in combination, they can all contribute to a high diversity of plant and animal species across the urban landscape. However, many urban vegetation systems are dynamic and variations in their composition can occur fairly rapidly through basic changes in management practices (e.g., mowing regime, irrigation). Identifying and implementing specific vegetation management actions that move the vegetation toward the desired outcome offers urban landscape managers and decision makers an opportunity to enhance the role of individual green spaces in supporting overall urban biodiversity.
Relationships between Vegetation Composition/Origin and Structural Complexity in Urban Green Spaces
The relationship between vegetation composition/origin and structural complexity is a difficult one to describe and compare in any ecosystem. Urban green spaces provide a unique challenge in that these variables can vary greatly within a green space type, and amongst different green space types. This high variability can occur over extremely small spatial and temporal scales based on green space management practices and intensities. Overall, we found that similar vegetation structural complexity can be achieved with different vegetation taxonomic composition and origin (i.e., native vs. exotic species) across the four urban green space types investigated (Figure 7). For example, in the 0–0.5 m height band, GC and RE both contain plots where there is a large volume of vegetation, but a wide range in the proportion of native plants (Figure 7).
One corollary of this is that it is possible to have vegetation consisting of the same species community that have been managed to produce very different structural complexity. For example, many UPs are managed to minimize maintenance costs and as such are dominated by exotic turf grass with interspersed trees—delivering the same vegetation structure regardless of whether those trees and grasses are native or exotic. While the species composition of individual plots is not directly accounted for in Figure 7, there is clearly a wide range of vegetation volume in plots with similar proportions of native species, indicating that structural complexity may be related to, but is not necessarily driven by species composition.
It has been shown in various ecosystem studies globally that vegetation structural attributes can be as important, or more important than plant species composition, as a predictor of biodiversity and habitat value for certain faunal taxa. In African savanna woodlands, Skowno and Bond (2003) noted that floristic composition (presence–absence of plant species) was less important for bird community composition than vegetation structure. Similarly, in Australian eucalypt forests and woodlands, Cork and Catling (1996) concluded that vegetation structural complexity was more important in determining ground-dwelling marsupial diversity than tree species composition. These studies do not dismiss the value of native plant species for habitat provision within an ecosystem, they simply point to the fact that certain taxa may exhibit habitat preference based around structural attributes rather than the vegetation composition that provides that structure. Interestingly, our study revealed that some golf courses provided very similar understorey structural characteristics as observed in remnant woodland patches (Figure 7), but with very different plant species (Figures 4, 7). In light of the existing research highlighting the importance of vegetation structure as opposed to plant composition for many animal species, this finding suggests that that when green spaces dominated by exotic plants are managed in an appropriate way they may provide important habitat structure for a variety of taxa. However, there will also continue to be situations where strong co-evolution means this isn't the case, such as short-tongued Colletid bees in Australia which are reliant on plants that provide nectar in shallow open cups such as those found within the Myrtaceae plant family (Threlfall et al., 2015). Identifying which species respond to structural habitat characteristics, and which species are sensitive to the identity of the plant species will be an important area for future research to ensure that the habitat requirements of both groups are maintained and enhanced in urban landscapes.
Developing Standard Methods for Quantifying Vegetation Structural Complexity
Taxonomic measures of plant species composition and origin are relatively straight forward, whereas universal metrics of habitat structure and complexity have yet to be established. In a comprehensive review of measures of structural complexity in forests and woodland, McElhinny et al. (2005) outline three major categories of measurement indices: (1) those based on the cumulative score of attributes; (2) those based on the average score of groups of attributes; and (3) those based on the interaction of attributes. The method we employed to measure understorey complexity was adapted from that developed and demonstrated by McElhinny et al. (2006) for dry eucalypt woodlands in south east Australia. The objective and generic nature of the McElhinny et al. (2006) method provided the opportunity to adapt this approach and apply it in our study to a wide range of urban green space types. It is only via the use of standard methods such as this that comparative analysis to other green space types within and between cities can occur, something that is desperately required to further urban ecology research globally (McDonnell and Hahs, 2013). Additional investigations are needed to assess relationships between structural complexity and functional characteristics of urban vegetation (e.g., plant functional traits, plant strategies, etc).
Conclusions
This study provides and demonstrates a robust generic and objective approach to quantify and compare the composition and structure of urban vegetation. Quantifying the distinct differences and unique aspects of vegetation in golf courses, public parks, residential neighborhoods, and patches of remnant vegetation provides a fundamental platform from which to interpret the patterns of distribution and diversity for urban animals. Furthermore, comparative quantification of vegetation composition and structure will be invaluable to inform subsequent estimations of ecosystem service delivered by different types of urban green space. Effective management of any urban green space network should recognize the distinct characteristics of each habitat, as well as the provision of complementary resources the network may provide across the broader urban landscape.
Author Contributions
CT designed the experiment, collected the data in the field, analyzed data, and wrote the paper. AO designed the experiment, collected the data in the field, analyzed data, and wrote the paper. AH designed the experiment, collected the data in the field, and reviewed drafts of the paper. NW designed the experiment, collected the data in the field, and reviewed drafts of the paper. LW designed the experiment and collected the data in the field. SL designed the experiment, collected the data in the field, and reviewed drafts of the paper.
Conflict of Interest Statement
The authors declare that the research was conducted in the absence of any commercial or financial relationships that could be construed as a potential conflict of interest.
Acknowledgments
The authors would like to thank all volunteers for their field work assistance, participating residents, municipalities and golf courses for their involvement and for granting access and two anonymous reviewers for their thoughtful and constructive comments. Logistics and financial support was provided by the Australian Golf Course Superintendents Association, in particular John Geary and John Neylan. This work was carried out as part of the Australian Research Council Linkage Project LP110100686. AH acknowledges the financial support of the Baker Foundation.
Supplementary Material
The Supplementary Material for this article can be found online at: https://www.frontiersin.org/article/10.3389/fevo.2016.00066
References
Bates, D., Maechler, M., Bolker, B., Walker, S. (2015). lme4: Linear Mixed-Effects Models Using Eigen and S4. R Package Version 1.1-8. Available online at: http://CRAN.R-project.org/package=lme4
Bell, S., McCoy, E. D., and Mushinsky, H. R. (eds.). (1991). Habitat Structure: The Physical Arrangement of Objects in Space. London: Chapman and Hall.
Beninde, J., Veith, M., and Hochkirch, A. (2015). Biodiversity in cities needs space: a meta-analysis of factors determining intra-urban biodiversity variation. Ecol. Lett. 18, 581–592. doi: 10.1111/ele.12427
Bergen, K. M., Goetz, S. J., Dubayah, R. O., Henebry, G. M., Hunsaker, C. T., Imhoff, M. L., et al. (2009). Remote sensing of vegetation 3-D structure for biodiversity and habitat: Review and implications for lidar and radar spaceborne missions. J. Geophys. Res. 114, G00E06. doi: 10.1029/2008JG000883
Bull, M., and Sinclair, S. (2014). “Habitat: Melbourne's indigenous vegetation communities,” in Flora of Melbourne, ed M. Bull (Melbourne, VIC: Hyland House Publishing), 3–35.
Byrne, L. B. (2007). Habitat structure: a fundamental concept and framework for urban soil ecology. Urban Ecosyst. 10, 255–274. doi: 10.1007/s11252-007-0027-6
Colding, J., and Folke, C. (2009). The role of golf courses in biodiversity conservation and ecosystem management. Ecosystems 12, 191–206. doi: 10.1007/s10021-008-9217-1
Cork, S. J., and Catling, P. C. (1996). Modelling distributions of arboreal and ground-dwelling mammals in relation to climate, nutrients, plant chemical defences and vegetation structure in the eucalypt forests of southeastern Australia. For. Ecol. Manage. 85, 163–175.
Derkzen, M. L., van Teeffelen, A. J., and Verburg, P. H. (2015). Quantifying urban ecosystem services based on high-resolution data of urban green space: an assessment for Rotterdam, The Netherlands. J. Appl. Ecol. 52, 1020–1032. doi: 10.1111/1365-2664.12469
Dinnie, E., Brown, K. M., and Morris, S. (2013). Community, cooperation and conflict: Negotiating the social well-being benefits of urban greenspace experiences. Landsc. Urban Plan. 112, 1–9. doi: 10.1016/j.landurbplan.2012.12.012
Faeth, S. H., Saari, S., and Bang, C. (2012). “Urban biodiversity: patterns, processes and implications for conservation,” in eLS (Chichester: John Wiley & Sons Ltd). doi: 10.1002/9780470015902.a0023572. Available online at: http://www.els.net
Fontana, S., Sattler, T., Bontadina, F., and Moretti, M. (2011). How to manage the urban green to improve bird diversity and community structure. Landsc. Urban Plan. 101, 278–285. doi: 10.1016/j.landurbplan.2011.02.033
Fuller, R. A., Irvine, K. N., Devine-Wright, P., Warren, P. H., and Gaston, K. J. (2007). Psychological benefits of greenspace increase with biodiversity. Biol. Lett. 3, 390–394. doi: 10.1098/rsbl.2007.0149
Gotelli, N. J., and Colwell, R. K. (2001). Quantifying biodiversity: procedures and pitfalls in measurement and comparison of species richness. Ecol. Lett. 4, 379–391. doi: 10.1046/j.1461-0248.2001.00230.x
Hodgkison, S. C., Hero, J. M., and Warnken, J. (2007). The conservation value of suburban golf courses in a rapidly urbanising region of Australia. Landsc. Urban Plan. 79, 323–337. doi: 10.1016/j.landurbplan.2006.03.009
Hothorn, T., Bretz, F., and Westfall, P. (2008). Simultaneous inference in general parametric models. Biom. J. 50, 346–363. doi: 10.1002/bimj.200810425
Hsieh, T. C., Ma, K. H., and Chao, A. (2013). iNEXT Online: Interpolation and Extrapolation. Version 1.3.0. Available online at: https://chao.shinyapps.io/iNEXT/ (Accessed March 3, 2016).
Hunter, A. J., and Luck, G. W. (2015). Defining and measuring the social-ecological quality of urban greenspace: a semi-systematic review. Urban Ecosyst. 18, 1139–1163. doi: 10.1007/s11252-015-0456-6
Kendal, D., Williams, K. J., and Williams, N. S. W. (2012c). Plant traits link people's plant preferences to the composition of their gardens. Landsc. Urban Plan. 105, 34–42. doi: 10.1016/j.landurbplan.2011.11.023
Kendal, D., Williams, N. S. G., and Williams, K. J. (2012b). A cultivated environment: exploring the global distribution of plants in gardens, parks and streetscapes. Urban Ecosyst. 15, 637–652. doi: 10.1007/s11252-011-0215-2
Kendal, D., Williams, N. S. G., and Williams, K. J. H. (2012a). Drivers of diversity and tree cover in gardens, parks and streetscapes in an Australian city. Urban For. Urban Greening 11, 257–265. doi: 10.1016/j.ufug.2012.03.005
Kindt, R., and Coe, R. (2005). Tree Diversity Analysis: A Manual and Software for Common Statistical Methods for Ecological and Biodiversity Studies. Available online at: http://www.worldagroforestry.org/resources/databases/tree-diversity-analysis
Le Roux, D. S., Ikin, K., Lindenmayer, D. B., Blanchard, W., Manning, A. D., and Gibbons, P. (2014). Reduced availability of habitat structures in urban landscapes: implications for policy and practice. Landsc. Urban Plan. 125, 57–64. doi: 10.1016/j.landurbplan.2014.01.015
Livesley, S. J., McPherson, G. M., and Calfapietra, C. (2016). The urban forest and ecosystem services: Impacts on urban water, heat, and pollution cycles at the tree, street, and city scale. J. Environ. Qual. 45, 119–124. doi: 10.2134/jeq2015.11.0567
Loram, A., Thompson, K., Warren, P. H., and Gaston, K. J. (2008). Urban domestic gardens (XII): the richness and composition of the flora in five UK cities. J. Veg. Sci. 19, 321–330. doi: 10.3170/2008-8-18373
Maron, M., Grey, M. J., Catterall, C. P., Major, R. E., Oliver, D. L., Clarke, M. F., et al. (2013). Avifaunal disarray due to a single despotic species. Divers. Distrib. 19, 1468–1479. doi: 10.1111/ddi.12128
McDonnell, M. J., and Hahs, A. K. (2013). The future of urban biodiversity research: moving beyond the ‘low-hanging fruit.’ Urban Ecosyst. 16, 397–409. doi: 10.1007/s11252-013-0315-2
McElhinny, C., Gibbons, P., and Brack, C. (2006). An objective and quantitative methodology for constructing an index of stand structural complexity. For. Ecol. Manage. 235, 54–71. doi: 10.1016/j.foreco.2006.07.024
McElhinny, C., Gibbons, P., Brack, C., and Bauhus, J. (2005). Forest and woodland stand structural complexity: Its definition and measurement. For. Ecol. Manage. 218, 1–24. doi: 10.1016/j.foreco.2006.07.024
Mills, G. S., Dunning, J. B. Jr., and Bates, J. M. (1991). The relationship between breeding bird density and vegetation volume. Wilson Bull. 103, 468–479.
Norton, B. A., Thomson, L. J., Williams, N. S. G., and McDonnell, M. J. (2014). The effect of urban ground covers on arthropods: an experiment. Urban Ecosyst. 17, 77–99. doi: 10.1007/s11252-013-0297-0
Oksanen, J., Blanchet, F. G., Kindt, R., Legendre, P., Minchin, P. R., O'Hara, R. B., et al. (2014). vegan: Community Ecology Package. R Package Version 2.2–0.
Ossola, A., Hahs, A. K., and Livesley, S. J. (2015b). Habitat complexity influences fine scale hydrological processes and the incidence of stormwater runoff in managed urban ecosystems. J. Environ. Manage. 159, 1–10. doi: 10.1016/j.jenvman.2015.05.002
Ossola, A., Hahs, A. K., Nash, M. A., and Livesley, S. J. (2016). Habitat complexity enhances comminution and decomposition processes in urban ecosystems. Ecosystems. doi: 10.1007/s10021-016-9976-z. [Epub ahead of print].
Ossola, A., Nash, M. A., Christie, F., Hahs, A. K., and Livesley, S. J. (2015a). Urban habitat complexity affects species richness but not environmental filtering of morphologically-diverse ants. PeerJ 3:e1356. doi: 10.7717/peerj.1356
R Development Core Team (2012). R: A language and Environment for Statistical Computing. R Foundation for Statistical Computing. Vienna. Available online at: http://www.R-project.org
Rupprecht, C. D. D., and Byrne, J. A. (2014). Informal urban green-space: comparison of quantity and characteristics in Brisbane, Australia and Sapporo, Japan. PLoS ONE 9:e99784. doi: 10.1371/journal.pone.0099784
Sandström, U. G., Angelstam, P., and Mikusiński, G. (2006). Ecological diversity of birds in relation to the structure of urban green space. Landsc. Urban Plan. 77, 39–53. doi: 10.1016/j.landurbplan.2005.01.004
Scott, R., Blake, N., Campbell, J., Evans, D., and Williams, N. S. G. (2002). Indigenous Plants of the Sandbelt: A Gardening Guide for South-Eastern Melbourne. St Kilda, VIC; Melbourne, VIC: Earthcare.
Shwartz, A., Muratet, A., Simon, L., and Julliard, R. (2013). Local and management variables outweigh landscape effects in enhancing the diversity of different taxa in a big metropolis. Biol. Conserv. 157, 285–292. doi: 10.1016/j.biocon.2012.09.009
Skowno, A. L., and Bond, W. J. (2003). Bird community composition in an actively managed savanna reserve, importance of vegetation structure and vegetation composition. Biodivers. Conserv. 12, 2279–2294. doi: 10.1023/A:1024545531463
Spencer, R. (1995). Horticulture Flora of South-eastern Australia. The Identification of Garden & Cultivated Plants. Ferns, Conifers and their Allies. Sydney, NSW: University of New South Wales Press Ltd.
Tews, J., Brose, U., Grimm, V., Tielborger, K., Wichmann, M. C., Schwager, M., et al. (2004). Animal species diversity driven by habitat heterogeneity/diversity: the importance of keystone structures, J. Biogeogr. 31, 79–92 doi: 10.1046/j.0305-0270.2003.00994.x
The University of Melbourne (2012). Burnley Plant Guide. Parkville, MO: University of Melbourne. Available online at: http://mspgh.unimelb.edu.au/ (Accessed September 21, 2015).
Threlfall, C. G., Walker, K., Williams, N. S. G., Hahs, A. K., Mata, L., Stork, N., et al. (2015). The conservation value of urban green space habitats for Australian native bee communities. Biol. Conserv. 187, 240–248. doi: 10.1016/j.biocon.2015.05.003
Tzoulas, K., Korpela, K., Venn, S., Yli-Pelkonen, V., Kaźmierczak, A., Niemela, J., et al. (2007). Promoting ecosystem and human health in urban areas using green infrastructure: a literature review. Landsc. Urban Plan. 81, 167–178. doi: 10.1016/j.landurbplan.2007.02.001
Van Heezik, Y. M., Freeman, C., Porter, S., and Dickinson, K. J. M. (2014). Native and exotic woody vegetation communities in domestic gardens in relation to social and environmental factors. Ecol. Soc. 19, 17. doi: 10.5751/ES-06978-190417
Walsh, N. G., and Entwisle, T. J. (1994). Flora of Victoria: Ferns and Allied Plants, Conifers and Monocotyledons. Melbourne, VIC: Inkata Press.
Walsh, N. G., and Entwisle, T. J. (1996). Flora of Victoria: Dicotyledons. Winteraceae to Myrtaceae. Melbourne, VIC: Inkata Press.
Walsh, N. G., and Entwisle, T. J. (1999). Flora of Victoria: Oligaceae to Asteraceae. Melbourne, VIC: Inkata Press.
Keywords: understorey vegetation, large trees, golf courses, residential neighborhoods, public parks, remnant vegetation, biodiversity, native indigenous and exotic species
Citation: Threlfall CG, Ossola A, Hahs AK, Williams NSG, Wilson L and Livesley SJ (2016) Variation in Vegetation Structure and Composition across Urban Green Space Types. Front. Ecol. Evol. 4:66. doi: 10.3389/fevo.2016.00066
Received: 18 March 2016; Accepted: 27 May 2016;
Published: 10 June 2016.
Edited by:
Galina Churkina, Institute for Advanced Sustainability Studies, GermanyReviewed by:
Iryna Dronova, University of California, Berkeley, USAHyungsuk Kimm, Seoul National University, South Korea
Copyright © 2016 Threlfall, Ossola, Hahs, Williams, Wilson and Livesley. This is an open-access article distributed under the terms of the Creative Commons Attribution License (CC BY). The use, distribution or reproduction in other forums is permitted, provided the original author(s) or licensor are credited and that the original publication in this journal is cited, in accordance with accepted academic practice. No use, distribution or reproduction is permitted which does not comply with these terms.
*Correspondence: Alessandro Ossola, alessandro.ossola@unimelb.edu.au
†These authors have contributed equally to this work.