Transplant Experiments Point to Fire Regime as Limiting Savanna Tree Distribution
 Nicola Stevens
 Sally A. Archibald2
  William J. Bond
- 1Global Change and Biodiversity Group, Department of Botany and Zoology, Stellenbosch University, Stellenbosch, South Africa
- 2School of Animal, Plant and Environmental Sciences, University of the Witwatersrand, Johannesburg, South Africa
- 3Department of Biological Sciences, University of Cape Town, Cape Town, South Africa
- 4Fynbos Node, South African Environmental Observation Network, Cape Town, South Africa
Plant species range shifts are predicted to occur in response to climate change. The predictions are often based on the assumption that climate is the primary factor limiting the distribution of species. However the distribution of grassy biomes in Africa cannot be predicted by climate alone, instead interactions between vegetation, climate and disturbance structure the ecosystems. To test if climatic variables, as predicted by an environmental niche model, determine the distribution limits of two common savanna tree species we established a transplant experiment at a range of latitudes and altitudes much broader than the distribution limits of our study species. We planted seedlings of two common savanna trees, Senegalia nigrescens and Colophospermum mopane, at eight paired high and low elevation sites across an 850 km latitudinal gradient in South African savannas. At each site seedlings were planted in both grassy and cleared plots. After 2 years of growth, rainfall, temperature and location inside or outside their distribution range did not explain species success. Grass competition was the only variable that significantly affected plant growth rates across all sites, but grass competition alone could not explain the distribution limit. Species distributions were best predicted when maximum tree growth rates were considered in relation to local fire return intervals. The probability of sapling escape from the fire trap was the most likely determinant of distribution limits of these two species. As trees grew and survived 100 s of kilometers south of their current range limits we conclude that climate alone does not explain the current distribution of these trees, and that climate change adaptation strategies for savanna environments based only on climatic envelope modeling will be inappropriate.
Introduction
Global change is transforming the planet (Ellis, 2011; Scheffers et al., 2016). One of the most pervasive impacts, which has severe economic and ecological impacts, is that of shifting plant and animal ranges (Parmesan and Yohe, 2003; Thomas et al., 2004; Chen et al., 2011). The shifts are most frequently attributed to the warming of the earth, with the expectation that plant and animal distributions will shift toward the cooler poles or higher elevations (Lenoir et al., 2008; Chen et al., 2011). These expectations (Hutchinson, 1957; Chase and Leibold, 2003) are often derived from the Hutchinson concept of the fundamental and realized niche. The fundamental niche describes the set of environmental factors that determine the space where a species could occur in the absence of biotic interactions (Hutchinson, 1978; Chase and Leibold, 2003). The realized niche describes where a species actually occurs after accounting for the effects of inter-specific competition. This concept has been applied almost globally as a framework to describe the geographic distribution of species (Gaston, 2003; Thomas, 2010). However this framework is generally simplified to assume that climate shapes a plant's distribution range, and is the basis of attempts to predict the future ranges of plants using the correlative climate envelope approach (Thomas et al., 2004; Hijmans et al., 2005) where the current distribution of a species is mapped in climate space and any future shifts in climate space are expected to produce an accompanying shift in the future species distribution range (Elith and Leathwick, 2009). Although there is debate as to the broad applicability of climate models, (Davis et al., 1998; Araújo and Luoto, 2007; Svenning and Skov, 2007; Araújo and Peterson, 2012), the underlying general assumption that climate alone is the primary determinant of species distribution limits (Holdridge, 1967; Gaston, 2003) is seldom questioned.
Much of the empirical support for these climate based assumptions comes from studies in temperate and boreal northern hemisphere systems (Parmesan and Yohe, 2003; Thomas, 2010) where temperature is often the primary factor that limits plant production (Jolly et al., 2005; Körner and Basler, 2010). There remains an acute absence of detailed studies on distribution limits of plants in the tropics (Blach-Overgaard et al., 2010; Thomas, 2010). Here, authors acknowledge that the determinants of ranges in tropical regions are more complex (Root et al., 2003; Blach-Overgaard et al., 2010; Thomas, 2010). Water availability and biotic interactions are considered increasingly important in these systems (Woodward, 1987; Thomas et al., 2004; Jolly et al., 2005) but the underlying assumption that the distribution ranges can be predicted by climate alone remains common. However, we contend that this underlying principle and approach is not sufficient to predict the current, or future distribution of plants occurring in Africa's grassy biomes.
In tropical savanna and grassland biomes, interactions between fire, mammal herbivory and climate structure savannas (Bond et al., 2005; Staver et al., 2011; Lehmann et al., 2014). Tropical grassy biomes (TGBs) are therefore considered the most extensive vegetation area not at equilibrium with climate (Bond et al., 2005; Pausas and Ribeiro, 2017). Fire and mammal herbivory are dominant environmental filters that define community assemblages (Staver et al., 2012; Charles-Dominique et al., 2016; Pausas and Ribeiro, 2017), with the relative importance of these processes changing across the rainfall gradient (Archibald and Hempson, 2016). Herbivory can cause local species extinctions, alter competitive interactions, and reduce or enable tree recruitment (Prins and van der Jeugd, 1993; Bond and Loffell, 2001; Augustine and Mcnaughton, 2004; Asner et al., 2009), and fire regimes can alter the community structure and composition (Trapnell, 1959; Higgins et al., 2007; Pausas and Ribeiro, 2017). Whilst these processes can act on woody plants at all demographic stages (Midgley and Bond, 2001), the demographic stages which are most impacted are the seedling establishment and sapling stage where a critical population bottleneck occurs (Higgins et al., 2000). Here, regular disturbance traps saplings in the grass layer, where they are vulnerable to further topkill by fire and herbivory (Higgins et al., 2000; Midgley et al., 2010; Werner and Prior, 2013). Importantly these suppressed saplings are not reproductive and repeated topkill can prevent the recruitment of reproductive individuals, which would eventually lead to local extinction (Higgins et al., 2000). When trees exceed ~3 m in height, they will often be sufficiently fire proof to be released from the fire trap (Bond, 2008; Wakeling et al., 2012). Therefore the ability of a plant to escape this trap to reach reproductive maturity within the prevailing climatic and disturbance context is the critical component that will determine the presence of a plant in a region.
To explore potential climatic constraints within a disturbance limited system we tested how well the traditional climate based framework of plant species distribution can explain patterns of species distribution ranges in consumer controlled systems. We established a transplant experiment across a latitudinal gradient across South African savannas inside and outside the distribution ranges of two common savanna tree species; Colophospermum mopane (Kirk ex J.Léonard) and Senegalia nigrescens [(Oliv.) P. J. H. Hurter]. The transplant experiment design was guided by the outputs of species distribution models and literature which describe the climatic determinants for the study species; Colophospermum mopane. Low winter temperatures (below a minimum July average of 8°C), high rainfall (greater than 800 mm), and the presence of frost and increases in rainfall are commonly reported climatic limits to the occurrence of this species (Henning and White, 1974; Burke, 2006; Makhado et al., 2014; Scholtz et al., 2014; Stevens et al., 2014b).
To explore the role of these proposed limits the experiment was established across a climate gradient across a wide range of summer rainfall and temperature conditions, whilst remaining within the limits of the savanna biome. The latitudinal gradient follows a rainfall gradient with the driest savanna areas occurring in the lower latitudes with the northernmost site receiving ~350 mm rainfall and the southernmost sites receiving ~1,140 mm (Table 1).To account for the role of temperature and to extend the range of temperatures that the plants were exposed to, we paired each low altitude transplant site across the 850 km latitudinal gradient with a cooler higher elevation savanna site (above 500 m.a.s.l). Within each site, trees were planted with and without grass competition as grass competition is the strongest form of biotic competition in savannas (Riginos, 2009; February et al., 2013).
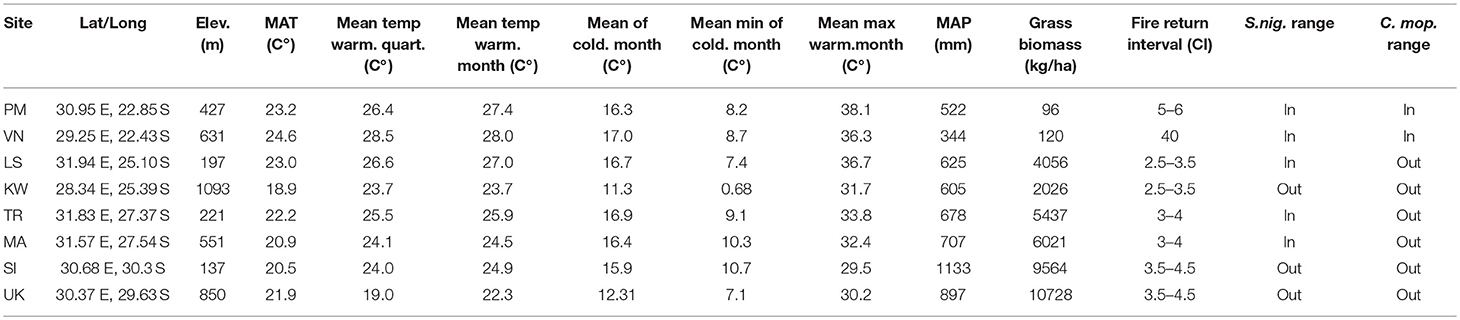
Table 1. Location, climatic and biophysical characteristics of transplant sites.
If climate is the primary limitation on the distribution of our tree species across a latitudinal gradient, then their distribution limits should coincide with climatic conditions where plant performance declines. In line with the literature, we predict that in the absence of grass competition, plant performance will decline with increasing distance from the range edge (Sexton et al., 2009; Hargreaves et al., 2013; Lee-Yaw et al., 2016). In the presence of grass competition, performance declines should match the current distribution limits and plants will not establish at sites outside their range, a result that is frequently recorded in similar experiments in temperate systems (Hargreaves et al., 2013; Lee-Yaw et al., 2016). However if climate (either rainfall or temperature) is not the primary process limiting the current range we predict that the plants will grow and survive both inside and outside their distribution ranges in the absence of fire and herbivory. We excluded fire and herbivory at our experimental sites so as to test for climatic limits alone. However as the degree of fire and herbivory also change across rainfall and temperature gradients we used growth data from the experiment to develop models that link growth rates and observed fire return periods to explore how fire regime might interact with growth constraints to limit species range.
Materials and Methods
Study Species
We transplanted two common savanna trees, Colophospermum mopane (mopane) (Kirk ex Benth.) Kirk ex J.Léon and Senegalia nigrescens (Oliv.). C. mopane is a highly dominant leguminous tree or multi-stemmed shrub, belonging to the detarioideae subfamily of the Fabaceae. Of the 1.5 million km2 of the savannas in southern Africa, C. mopane is estimated to almost singly dominate 550,000 km2 (25–35%) of savannas (Mapaure, 1994; Timberlake, 1995) where it often forms monospecific stands (Timberlake, 1995) on both nutrient rich and nutrient poor substrates. While dominating many thousands of hectares across southern Africa, its southern-most distribution ends abruptly in South Africa at ~-22.5S in the west and at ~24.0S in the east (Mapaure, 1994) (Figure 1). S. nigrescens (Fabacae) or the Knob thorn is a woody tree that can grow up to 20 m in height, although it usually remains between 8 and 10 m (Figure 6). It is most common and widespread in low-altitude savannas occurring from Tanzania to South Africa. The southern distribution limit for this species is at ~28.5 degrees latitude and it is considered frost sensitive, preferring low-lying areas (Smith et al., 2012).
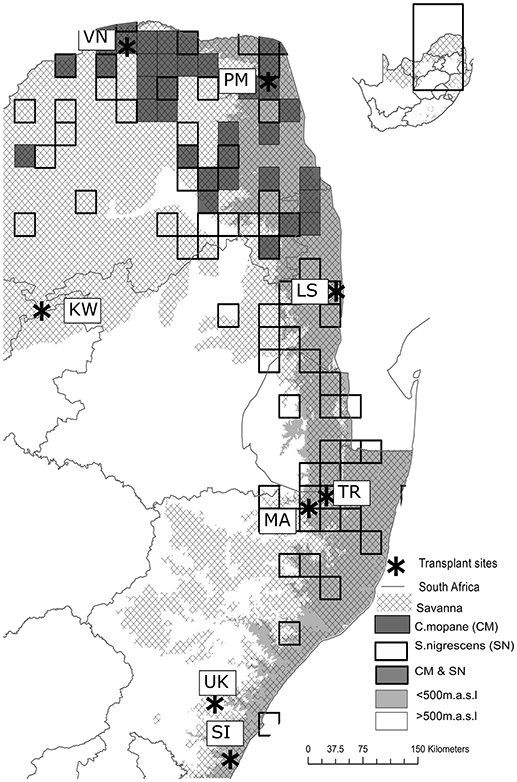
Figure 1. The location of sites across the latitudinal and altitudinal gradient. Four paired sites were placed across a latitudinal gradient. Each site was paired with a higher elevation (white areas) site. The gridded squares indicate the underlying distribution of each of the species planted (C. mopane = gray squares & S. nigrescens = white squares). All sites were placed within the savanna biome. The northern most sites (~ 22°30′S) are referred to as latitude 1 sites and the southernmost sites (~30°30′S) as latitude 4.
Transplant Experiment
Eight transplant sites were established within the South African savanna biome across an 850 km latitudinal gradient (~8°lat.), covering a rainfall gradient from 340 to 1,130 mm (Table 1). Four low elevation sites (< 500 m.a.s.l) were paired with four high elevation sites (>500 m.a.s.l) at the same latitude. The paired cooler higher elevation sites were chosen to ensure adequate representation of cold and frost prone sites (Schulze, 2007). The latitudinal and altitudinal gradients included sites inside and outside the distribution ranges of both C. mopane and S. nigrescens (Figure 1). Sites across these gradients were selected if they occurred within a savanna, had a perennial, undisturbed grass layer and a clay content of 20–30% (both on the surface and at 20 cm). At each site, a 30 × 30 m plot was established and fenced to prevent mammal herbivory. Each plot was divided into 6 sub plots (Figure 2). Three replicated sub-plots were randomly cleared of all grass and forb biomass by the roots using a hoe whilst grass cover in the remaining three was preserved.
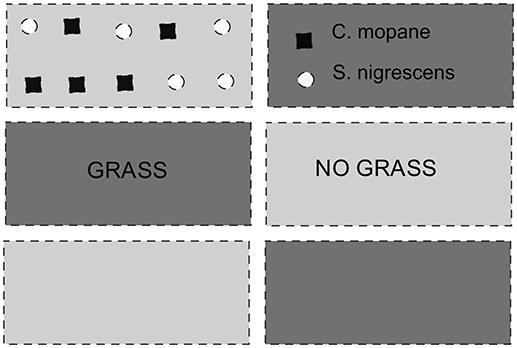
Figure 2. Experimental layout. Each 30 × 30 m plot consisted of 6 blocks with three replicated sub-plots of grassy treatments and three replicates subplots of a cleared treatment, where all grass was removed. Five plants of each species were planted in each replicate, at one meter intervals.
S. nigrescens and C. mopane seeds were collected from within their respective distribution ranges. S. nigrescens seeds were collected within a ~30 km radius of the South African Wildlife College (24.453 S, 31.405 E) and C. mopane seeds were collected within a 30 km radius of All days town (22.67 S, 29.10 E). The collected seeds were mixed and germinated at a nursery in the lowveld savanna at the South African Wildlife College. Seeds were planted in 1 l potting bags in a sand: clay mixture which was inoculated with soil taken from the roots of each species growing in their natural habitat. Following successful germination, the 480 one month old seedlings were transported to the sites and were planted in the early growing season (3 November−21 November 2010). Within each replicate five C. mopane and five S. nigrescens one month old seedlings were planted in random order one meter apart (Figure 3). To reduce losses to transplant stress and to allow the seedlings to establish, an equivalent of a 10 mm rainfall event was supplied every week for 1 month. Recruitment in these species is episodic (Botha, 2006; Stevens et al., 2014a) and by watering at the seedling establishment period we simulated an early growing season with good rainfall that was likely to result in successful establishment. As the requirements for seedling establishment have been documented we replicated these conditions so we could examine the determinants of plant success and growth following early establishment. For successful early seedling establishment the plants require warmth and moisture. These environmental conditions were met at all the savanna sites both inside and outside the distribution range of both species and were therefore not the limiting factor to establishment (Botha, 2006; Stevens et al., 2014a).
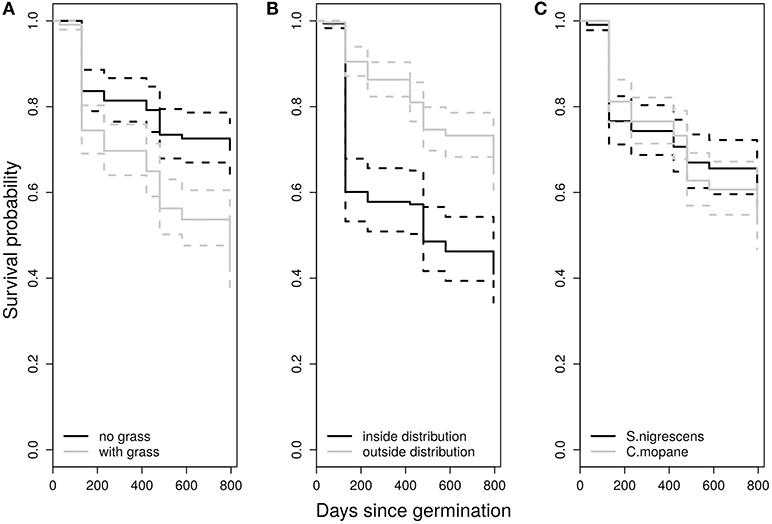
Figure 3. Kaplan-Meier estimates of survival for seedlings grouped into treatment classes (A), inside and outside their distribution range (B), and by species (C). Survival curves in figure were not weighted (alpha = 0).
Seedling Survival
We monitored plant growth for 2 years. Sites were revisited three times annually at the start, middle and end of the growing season (early November, January, April). A round trip between sites was a distance of 5,000 km; therefore more frequent measurements were not taken. During each measuring period seedling survival was assessed and the standing height and stem diameter of each seedling was measured. At the end of the growing season the grass biomass in the grass treatments was measured using a disc pasture meter (DPM). DPM readings were converted to biomass using the conversion developed by Trollope and Potgieter (1986). i-Buttons were placed at each site at 1.2 m above the ground and at 0.15 m above the ground to assess the thermal environment experienced by the seedlings. I-Button data was used to establish the site specific temperatures reported in Table 1. I-Buttons were suspended inside 4 mm thick PVC tubes (20 × 40 cm), and remained in the field for the duration of the experiment.
Data Analysis
The data were analyzed in R. 3.5 (R Core Team, 2018). To examine the survival of seedlings during the course of the experiment we used the survfit function to create Kaplan-Meier survival curves for the full set of seedlings distinguishing between treatment (grass: no grass), distribution (inside: outside the species range) and species. Log-rank tests were used to compare the groups. To examine if there was an effect of transplant shock on seedling survival we ran all the Kaplan-Meier survival curves both with the default alpha, and with an alpha of−10 which reduces the weighting of the first part of the dataset.
We used mixed-effects Cox proportional hazards models using the coxme (version 2.2.10) package (Therneau, 2018) in R to quantify the effects of treatment, distribution, mean annual temperature and mean annual precipitation and species as predictors of seedling survival, as well as the interaction between treatment and species. To account for the ties in the data (due to the limited number of sample dates) we used the “Efron” method for calculating ties. We ran the model for the full dataset, and for a dataset that excludes the transplant period (i.e., only data after day 130 were used in the model). We included both plot and site as random effects (plot nested within site). Candidate models were compared and ranked using Bayesian information criterion (BIC). If the best candidate models differed with a ΔBIC <2 we used model averaging to determine the best model parameters.
In order to determine the relationship between final plant height and climate parameters, mean annual temperature (MAT) and precipitation (MAP) were calculated for each site using temperature data gathered from i-Buttons on site and rainfall records from either long term farm records or the closest SA weather service station. The final mean height differences between sites were analyzed using linear-mixed effects models in the nlme package (Pinheiro et al., 2009). Linear mixed effects modeling fit by maximum likelihood was used to assess the significance of mean annual temperature, mean annual rainfall, grass treatment (grass or no grass) and range (inside or outside of distribution range) on the height of saplings after 2 years of growth. We included mean annual temperature and mean annual precipitation as fixed covariates in the analysis and distribution (inside or outside range) and treatment (grass or no grass) as fixed categorical factors. Site was included as a random factor and plot was nested within site. All possible interactions were considered. The candidate models were compared and ranked using Bayesian information criterion (BIC). The second best candidate model for both species differed with a ΔBIC >2 so model averaging was not used and the first best fit model with the lowest BIC was selected. We present the final parameter estimates, standard errors, and confidence intervals to demonstrate the effect size of the different parameters of the top two models.
Modeling Escape From the Fire Trap
To model the probability of sapling escape from the fire trap we used mean maximum growth rates for the two fastest growing plants of each species from the grass treatment, for each site (Wakeling et al., 2011; Bond et al., 2012). Growth rates were calculated from the beginning of the second growing season to the beginning of the third. We did not include the first season in the growth rate calculations as growth in the first season is characteristic of seedlings which have different allocation patterns and hence different above ground growth rates than that of established saplings (Higgins et al., 2000). We used the growth model from Higgins et al. (2000) to model the height gain of savanna trees, and hence time to reach a fire proof height (~3 m):
where gs is the growth rate of stems (cm year−1) (year 2), hmax is the maximum stem height (10 m), and hy−1 is the stem height in the previous year. Starting stem heights were set at a starting height of 20 cm, the mean stem height after year one across all the transplant sites. We kept the starting height the same across sites so that responses could be restricted to the sapling stage, not the seedling establishment stage. The model was run for 50 years.
As the model produced an output of tree height per year, we could determine the time it took a tree at each site to reach the “escape height” of 3 m, given the maximum growth rate at a site (Wakeling et al., 2012). We used maximum growth rates as they are more likely to be ecologically relevant than mean growth rates as predictors of sapling release and successful recruitment into the adult stage (Wakeling et al., 2011; Bond et al., 2012). We plotted this value against the median fire return interval (FRI) for each experimental site. FRI was calculated based on fire return intervals for low-human density African savanna regions (Archibald, 2016). This was estimated by fitting a Weibull distribution (Johnson and Gutsell, 1994) to fire interval data derived from the MODIS burned area product (see Archibald et al., 2009; Archibald and Hempson, 2016 for methods) for ~ 1,000 points from undisturbed areas.
Results
Site Characteristics
Sites spanned across a latitudinal gradient (Table 1). With increasing latitude mean annual precipitation (MAP) increased from ~400 to 1100 mm and mean annual temperature (MAT) decreased by ~3°C (Table 1).The differences in rainfall between high and low elevation sites were negligible except for the lower latitude northern sites (VN & PM) where the low elevation site received 120 mm more per year. High and low elevation sites differed in their mean annual temperatures with the low elevation sites having higher mean annual temperatures, warmer winters and mild winter minimums. VN, the low latitude higher elevation site was the exception, as it is had the highest MAT, however the mean monthly maximums were higher at the low elevation site. This site is also the driest site receiving a MAP of 344 mm. The wettest site in the low elevation, higher latitude (UK) received a MAP of 1,133 mm. The coldest site was the higher elevation KW site with a MAP of 18.9 and a July mean minimum of 0.68°C (the coldest month). KW was also the only site that received regular frost events during winter.
Seedling Survival
We used Kaplan-Meier survival curves to show how distribution, treatment and species impacted seedling survival during the experiment (Figure 3). The presence or absence of grass had the strongest impact on seedling survival with grasses reducing survival probability by ~50% [X31.0, p < 0.0001]. This effect still remained significant after accounting for transplant induced mortality at the beginning of the experiment [X28.0, p < 0.0001]. Interestingly there was significantly lower survival inside the distribution range [X34.0, p < 0.0001], but the bulk of this effect occurred during the initial transplant period (first 130 days). However distribution range was not significant when the early stages of the experiment were given less weight (alpha−10) [X 1.3, p = 0.253]. There were no significant differences in the survival rates between species with both species showing similar responses to distribution range and grass treatment.
For the first dataset (all time steps included) mixed-effects Cox proportional hazard models with the most support (based on BIC and model inference) included grass treatment and distribution range. Although this model had a weight of 0.51 there were two other important models—one that included MAP, and one that included MAT (Table 2A). As there were three models where ΔBIC < 2, we averaged these three models. The model averaged co-efficients indicate that treatment, distribution range, MAT and MAP all have explanatory power. The terms with the highest weighting were treatment and distribution with a weighting of 1, whilst MAP and MAT each had a weighting of 0.23. The final averaged model indicates that distribution range (p < 0.01) and treatment (p < 0.001) are the only significant explanatory variables in the model. The log of the co-efficient values show that plots without grass had ~2 times the survival rate as plots with grass, and plots inside the distribution range had about half the survival rates as plants outside the range (Table 3A).
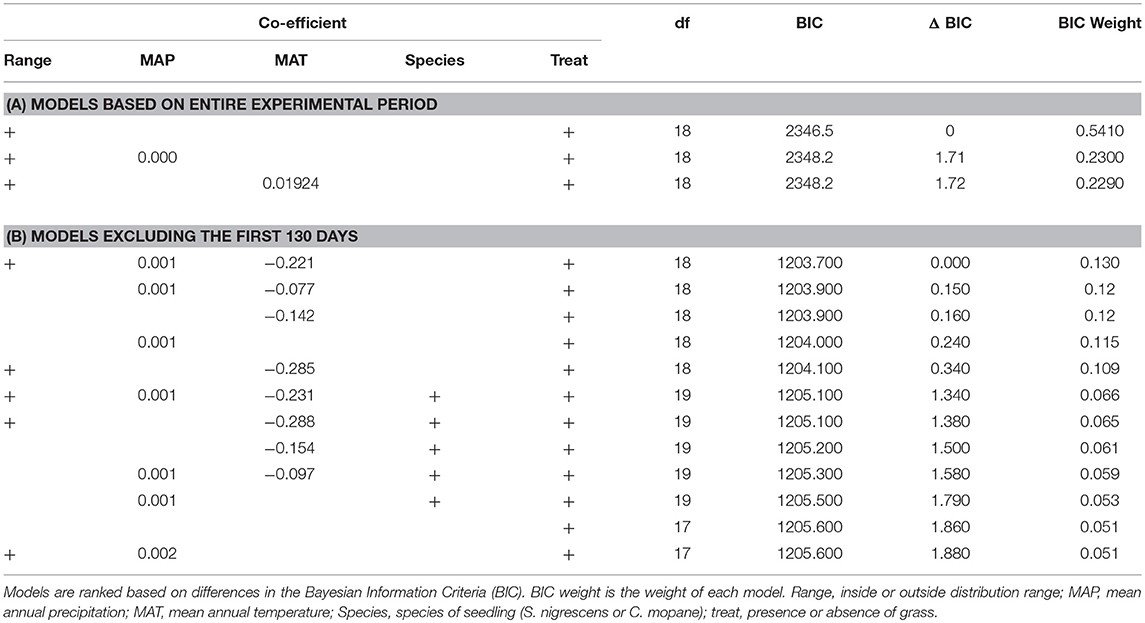
Table 2. Best models (where BIC <2) assessing the relationship between variables and seedling survival for (A) the entire experimental period and (B) the entire experimental period but with the first 130 days receiving a lower weighting (Alpha = −10).
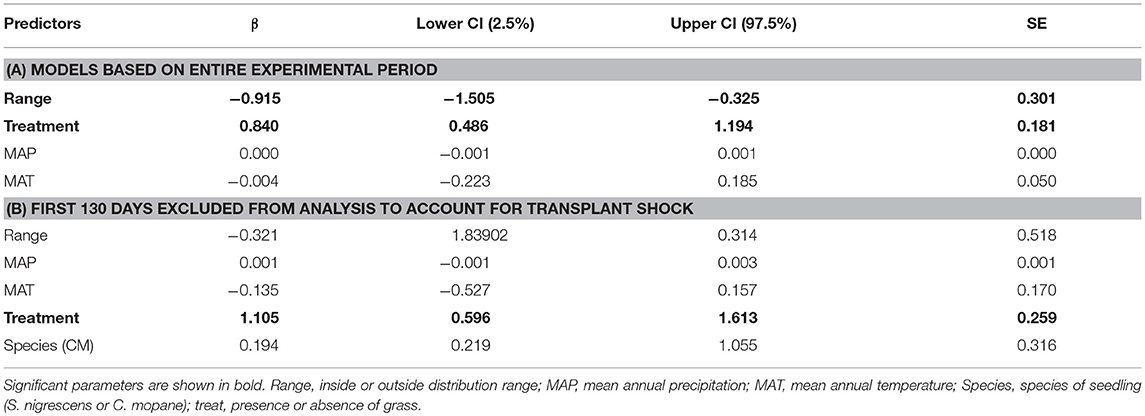
Table 3. Final parameter estimates (β), standard errors (SE) and confidence intervals of model averaging based on top models for (A) analysis of entire experimental period and (B) analysis excluding first 130 days to account for effects of tranplant shock.
To see whether the effect of distribution was limited to the early transplant period, we ran the same model but excluded all data before day 130. In this case the top 4 models all had very similar weights (0.10–0.11) with distribution range, MAP, MAT and treatment appearing as important terms (Table 2B). We therefore averaged the model results from models where ΔBIC <2 (Table 3B). Treatment was the most important variable and received a weight of 1, followed by MAT (0.73), MAP (0.59), distribution range (0.42), and species (0.5). In the final model the grass treatment was the only significant variable (p < 0.0001) and individuals planted with grass were ~three times as likely to die (Table 3B).
Final Sapling Height
We examined how the final height was explained by distribution range, MAT, MAP, grass treatment and all possible interaction terms. We used BIC values and model inference to select the best fit model. The best fit final mixed linear model for both C. mopane and S. nigrescens included only the treatment variable. We did not use model averaging for the results as the next best fit model for both species had a BIC>2. Plants were significantly shorter at the end of the experiment if they were grown in the presence of grass (Table 4, Figures 4, 5).
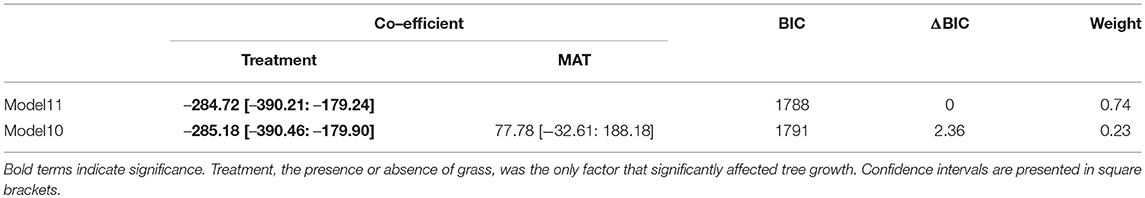
Table 4a. Mixed linear model outputs showing the top two models selected using BIC values for C. mopane.
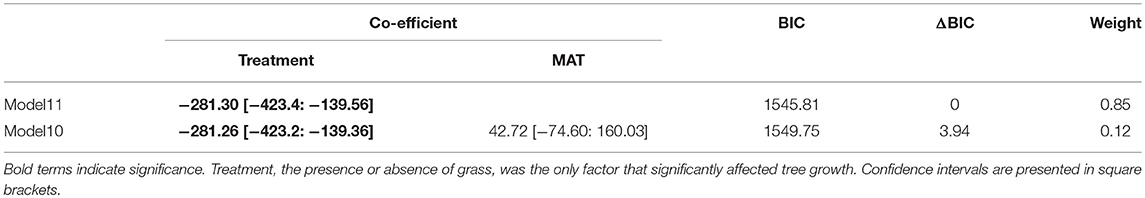
Table 4b. Mixed linear model outputs showing the top two models, selected using BIC values for S. nigrescens.
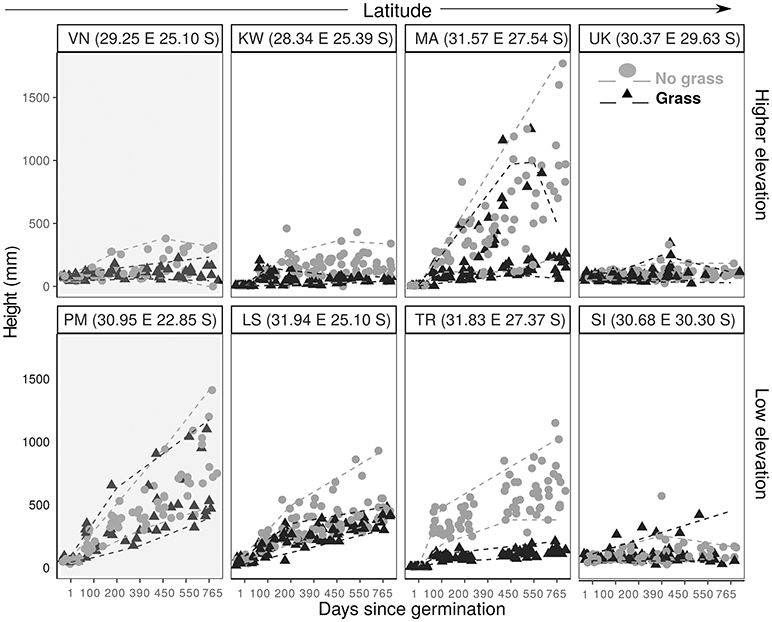
Figure 4. Plant height against time since planting for C. mopane saplings grown with grass (black triangle) and without grass (gray filled circle). Paired sites are arranged (L–R) in order of increasing latitude, with higher elevation sites in the top panel and lower elevation sites in the bottom panel. The dashed lines demonstrate the 5th and 95th quantiles for grassy plots (gray) and non-grass plots (black). Shaded graphs indicate a site which is within the distribution range.
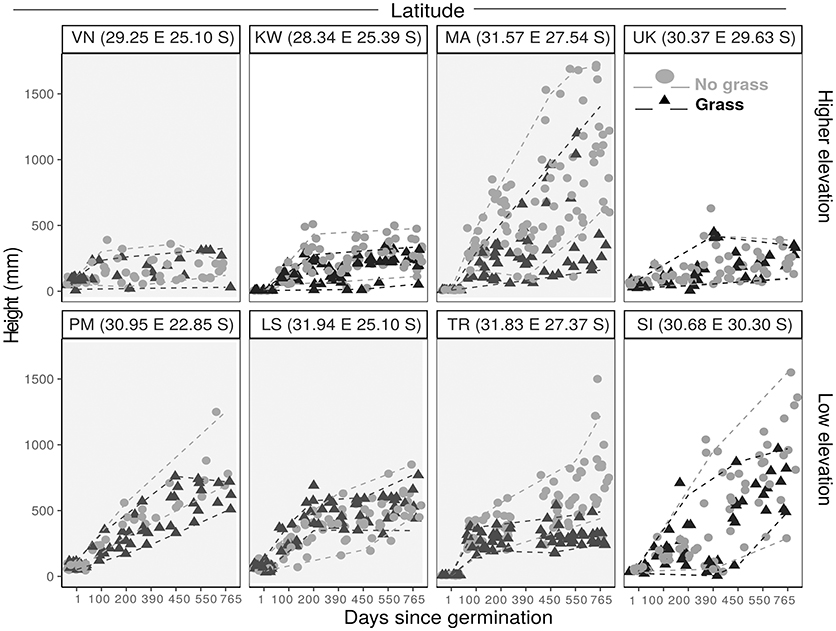
Figure 5. Plant height against time since planting for S. nigrescens saplings grown with grass (black triangle) and without grass (gray filled circle). Paired sites are arranged (L–R) in order of increasing latitude, with higher elevation sites in the top panel and lower elevation sites in the bottom panel. The dashed lines demonstrate the 5th and 95th quantiles for grassy plots (gray) and non-grass plots (black). Shaded graphs indicate a site which is within the distribution range.
Contrary to predictions, frost did not cause sapling mortality. KW was the only site which experienced frost. Several frosts during the dry season in year 1 caused a decline in height for both species, (Figures 4, 5). Frosted trees of both species were topkilled, but both species resprouted from the base in the following growing season. Resprouts were always multistemmed.
As grass is an important factor in sapling growth we investigated how it impacts sapling growth across the transplant experiment. Grass biomass had a significant effect on tree sapling growth within the sites and across the latitudinal gradient for both C. mopane (p < 0.01) and S. nigrescens (p < 0.001) (Figure 6). Sapling growth in the presence of grass for both species was highest where the grass biomass was lowest, and sapling height progressively declined as grass biomass increased across the sites for both species (Figure 6).
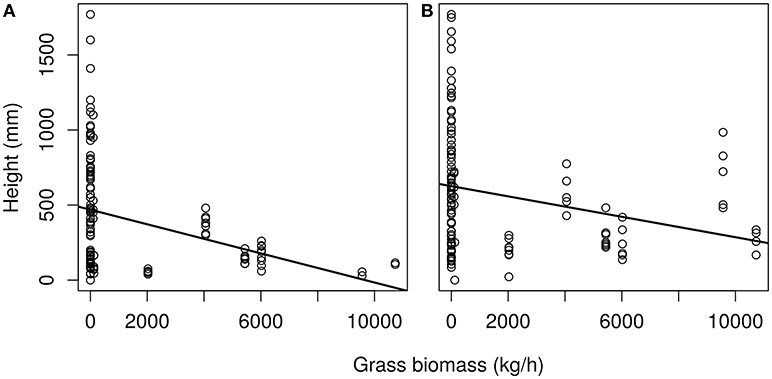
Figure 6. Height of saplings (750 days old) plotted against average grass biomass of the site for (A) C. mopane and (B) S. nigrescens. Final plant height significantly declined as grass biomass increased for C. mopane F(1.121) = 8,835, p < 0.01 and S. nigrescens F(1,129) = 1,993 p < 0.05. Linear equation for (A) is y = −0.048 + 468.87 and (B) y = −0.03 + 627.57.
Modeled Tree Growth and Escape From the Fire Trap
Considering that seedling survival and performance were not well explained by distribution range we then looked at processes preventing sapling recruitment into adult size classes. Grass biomass not only reduces sapling performance (Figure 6), but also provides the fuel that determines fire return intervals (Figure 7). High grass productivity, linked to higher rainfall, permits frequent fires. We therefore predicted that a combination of slower growth rates and more frequent fire return intervals might be a significant factor preventing sapling recruitment. Species growing inside their distribution ranges should be more likely to reach fire escape height within the fire free interval common to their area. Our model indicates that C. mopane fails to escape from the fire trap when maximum growth rates are low (caused by high grass biomass) (Figures 7, 8), or when fire return interval is short (Table 1, Figure 7). Model results (Figure 8) indicate that within C. mopane's distribution range sapling growth rates with grass are fast enough to result in trees escaping the fire trap. Outside the distribution range, although actual growth rates can be higher, fires are more frequent, FRI intervals decrease, and C. mopane is unlikely to reach escape height before the next fire. Likewise for S. nigrescens, the probability of successful escape from the fire trap only occurred within the existing distribution range of this species. At these sites maximum tree growth rate in the presence of grass can out-pace the fire return interval (Figure 8).
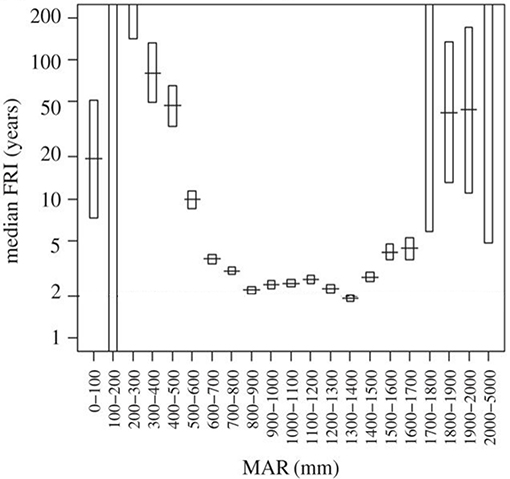
Figure 7. Median fire return intervals (FRI) in savannas are strongly controlled by mean annual rainfall (MAR) by mediating regrowth rates of the grassy fuels. In African savannas fire return intervals are minimized when rainfall exceeds 900 mm as the moisture of the fuel constrains flammability. Adapted from Archibald (2016). Managing the human component of fire regimes: lessons from Africa. Phil. Trans. R. Soc. B, 371:20150346. Adapted with permission of author (S. Archibald).
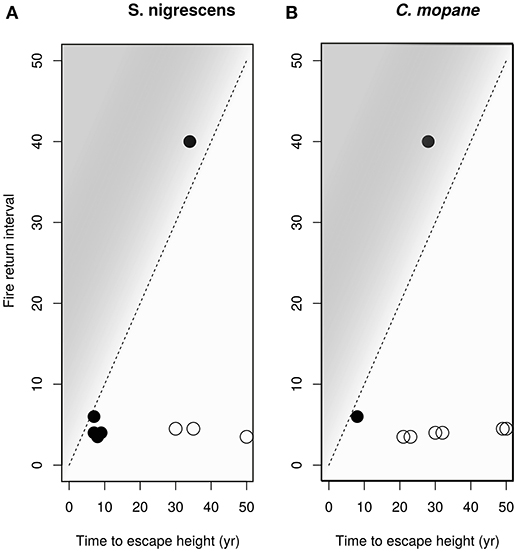
Figure 8. The modeled time to reach escape height in the presence of grass plotted against the approximate fire return period for the site for (A) S. nigrescens and (B) C. mopane. Closed circles show a species was planted within its distribution range, open circles show the plant was grown outside its distribution range. The dashed diagonal line indicates the minimum fire return interval required for each time-to-escape-height value. If the points fall above the 1:1 line, into the shaded area, the plants have a high probability of escaping from the fire trap. Both species, if planted within their distribution range, have a reasonable probability of escaping the fire trap. Estimated growth rates are too slow for saplings to escape the prevailing fire regimes outside their distribution range.
Discussion
The performance of two common savanna trees did not decline with increasing distance from the range edge. Instead plants still survived and grew well hundreds of kilometers outside their distribution ranges. This is contrary to the generally observed pattern that species distribution limits are often niche limits (Lee-Yaw et al., 2016). In our study species, and perhaps more generally in common savanna plants, climate axes of the niche were poor predictors of species performance in and outside range limits. Plant performance instead was most strongly determined by grass biomass. Whilst saplings still survived and grew within the presence of grass, the poorer performance with high grass productivity reduced the probability of saplings escaping the fire trap between successive fires. Our results and modeling suggest an alternative framework for the determinants of species ranges. Prediction of ranges for these and potentially other savanna species requires an understanding of the interactions between tree and grass productivity, climate and disturbance (top-kill) which determine the ability of saplings to escape the fire trap at any given site.
As the plants survived and grew well past their southern limits, a classic interpretation would be that both these species were dispersal-limited since suitable, but unoccupied, areas existed beyond their range boundaries (Hargreaves et al., 2013; Lee-Yaw et al., 2016). While dispersal limitation does occur, it is not common (Sexton et al., 2009; Hargreaves et al., 2013), and it is highly unlikely that these two widely distributed, dominant savanna species are dispersal limited. The fruits of C. mopane are well dispersed by wind and water (Styles and Skinner, 1997; Mlambo and Nyathi, 2004), and allozyme frequencies are similar across Southern African populations, indicating that an effective mechanism of gene flow occurs (Villoen et al., 2003). S. nigrescens retains closed pods on the tree until ripe, when gusting winds, associated with the onset of rains, rip the pods off the tree where they open, scattering the seeds widely (Miller, 1994; Grant and Thomas, 2001).
It is often documented that herbaceous competition strongly suppresses sapling and tree growth (Riginos, 2009; February et al., 2013) and likewise the presence of grasses in our study has a strong suppressive effect on seedling survival and sapling growth. It is through this interaction where climate probably has the strongest indirect influence on tree establishment as grass biomass shows a strong positive increase with increasing rainfall (O'connor et al., 2001). In the juvenile stages, tree competition with grasses is likely to be highest as tree and grass roots occupy the same soil layers (Cramer et al., 2007). We therefore hypothesize that the distribution range of both of these tree species is a product of the interaction between sapling growth rates, grass competition, and the fire return interval which depends on grass biomass for fuel. Here, climate plays an indirect role through its interactions with fire return interval and grass biomass (O'connor et al., 2001; Archibald et al., 2009). Grass biomass can set the maximum annual tree growth rate with growth rates decreasing with increases in grass biomass. The probability that any sapling will successfully escape the fire trap is dependent on its maximum growth rates (Wakeling et al., 2011; Bond et al., 2012). The sapling escape time (the time it takes for savanna tree to reach 3 m) needs to occur within fire free intervals. If a fire burns a sapling it will be top-killed and will have to start growth from a resprout. Our model therefore matches the time taken to reach escape height against the prevailing fire frequency of an area. We suggest that the probability of successful establishment is very low when the time to reach escape height is greater than the prevailing fire return interval. The chances of establishment increase as the times become more closely matched. The highest probability of establishment therefore occurs when escape height can be easily reached within the window of the prevailing fire free interval (Higgins et al., 2000). We therefore suggest that disturbance (e.g., fire) is the critical missing component in determining whether a plant can become a successfully recruiting adult, and hence should be explicitly considered when predicting the future ranges of species. Fire regimes can, and are, being modified by land users (Archibald et al., 2013). Whether climate change, or fire (and herbivore) management has greatest effects on changes in species distribution needs careful consideration in savannas.
Whilst we demonstrate our idea using fire return interval this framework applies to any process that causes top-kill in savannas including mammal herbivory (Staver et al., 2012) and frost (Holdo, 2007; Whitecross et al., 2012). In our experiment, frost caused top-kill in the regularly frosted site (KW). It is a climatic factor considered important in limiting the distribution of C. mopane (Henning and White, 1974; O'Connor and Bredenkamp, 1997; Burke, 2006). However we found that frost did not directly kill these seedlings, as often predicted, instead it acted as a powerful top-kill agent with a similar impact to that of fire. Both species experienced severe frost (Figure 6) and experienced complete topkill. In the subsequent growing season multiple shoots resprouted from the base and the plants continued to survive and grow but lost the previous season's height gains. In sites with regular frost, the equivalent metric would be the frost return interval, and saplings would need to reach a height threshold where frost damage is negligible (Whitecross et al., 2012) or rely on frost free intervals to ensure successful establishment (Holdo, 2007; Wakeling et al., 2012; Whitecross et al., 2012), or experience eventual population exclusion within that area (Wakeling et al., 2012). Likewise mammalian grazers can interact with the distribution of species through the removal of grass and the reduction of fire frequencies which in turn will lessen the fire imposed bottleneck (Hempson et al., 2017). Alternatively a high prevalence of browsers in the landscape has the potential to increase sapling top-kill further reducing the likelihood of escape from the fire trap (Staver et al., 2009).
Similar insights have been made at biome levels across continental scales where fire, vegetation and climate are recognized to be fundamental in predicting the distribution of the savanna biomes (Whittaker, 1970; Bond et al., 2005; Lehmann et al., 2014). As these processes interact to shape the distribution of a biome it should not be surprising that the dominant species within these biomes are shaped by similar forces. Several unrelated studies have demonstrated that fire is an important environmental filter and determinant of species composition (Staver et al., 2012; Pausas and Ribeiro, 2017). For example, fire exclusion can drive a switch in species composition or a shift in the dominant functional types e.g., evergreen species (Trapnell, 1959; Plas et al., 2013; Charles-Dominique et al., 2017). However, we do not know of other studies showing how fire regime can restrict the regional distribution of savanna tree species. Our results indicate that top-down processes are important in explaining the distribution of these two savanna tree species and processes that cause top-kill like fire, frost and herbivory can act as strong environmental filters and thus be as important in shaping plant distributions as temperature in temperate systems. Climate-based species distribution models are widely used as a tool in predicting the future of African plant species and as a tool to shape climate change policy across the developing economies of Africa (Heubes et al., 2011; Bocksberger et al., 2016). We suggest that their assumptions need much wider testing given the growing evidence for consumer-control of these ecosystems.
Author Contributions
NS and WB conceptualized the idea. NS and SA designed the experiment and NS performed field work. SA commented on drafts, provided funding, fire data and advised on statistics, and performed some statistical analysis. WB provided funding, and commented on drafts.
Funding
Funding was received from the Andrew Mellon foundation, NRF Thuthuka, CSIR Land Atmosphere feedback Parliamentary Grant and the fund for Spatial Planning for Protected Areas in Response to Climate Change (SPARC, Conservation International).
Conflict of Interest Statement
The authors declare that the research was conducted in the absence of any commercial or financial relationships that could be construed as a potential conflict of interest.
Acknowledgments
Alweet Hlungani, Henry Malan, Brian Blevin, Trevor Keith, Gail Bowers Winters and Prof Kevin Kirkman are thanked for their assistance and access to land. SANParks, Dinokeng and De Beers are thanked for access to their land. Thanks to Heath Beckett, Julia Wakeling and Chris Barichievy for assistance with the experiment. This submission has been adapted from a chapter in NS PhD thesis (Stevens, 2014).
References
Araújo, M. B., and Luoto, M. (2007). The importance of biotic interactions for modelling species distributions under climate change. Glob Ecol Biogeogr 16, 743–753. doi: 10.1111/j.1466-8238.2007.00359.x
Araújo, M. B., and Peterson, A. T. (2012). Uses and misuses of bioclimatic envelope modeling. Ecology 93, 1527–1539. doi: 10.1890/11-1930.1
Archibald, S. (2016). Managing the human component of fire regimes: lessons from Africa. Phil. Trans. R. Soc. B. 371:20150346. doi: 10.1098/rstb.2015.0346
Archibald, S., and Hempson, G. P. (2016). Competing consumers: contrasting the patterns and impacts of fire and mammalian herbivory in Africa. Phil. Trans. R. Soc. B. 371:20150309. doi: 10.1098/rstb.2015.0309
Archibald, S., Lehmann, C. E., Gómez-Dans, J. L., and Bradstock, R. A. (2013). Defining pyromes and global syndromes of fire regimes. Proc. Natl. Acad. Sci. U.S.A. 110, 6442–6447. doi: 10.1073/pnas.1211466110
Archibald, S., Roy, D. P., Wilgen, V., and Scholes, R. J. (2009). What limits fire? An examination of drivers of burnt area in Southern Africa. Glob. Change Biol. 15, 613–630. doi: 10.1111/j.1365-2486.2008.01754.x
Asner, G. P., Levick, S. R., Kennedy-Bowdoin, T., Knapp, D. E., Emerson, R., Jacobson, J., et al. (2009). Large-scale impacts of herbivores on the structural diversity of African savannas. Proc. Natl. Acad. Sci. U.S.A. 106, 4947–4952. doi: 10.1073/pnas.0810637106
Augustine, D. J., and Mcnaughton, S. J. (2004). Regulation of shrub dynamics by native browsing ungulates on East African rangeland. J. Appl. Ecol. 41, 45–58. doi: 10.1111/j.1365-2664.2004.00864.x
Blach-Overgaard, A., Svenning, J.-C., Dransfield, J., Greve, M., and Balslev, H. (2010). Determinants of palm species distributions across Africa: the relative roles of climate, non-climatic environmental factors, and spatial constraints. Ecography 33, 380–391. doi: 10.1111/j.1600-0587.2010.06273.x
Bocksberger, G., Schnitzler, J., Chatelain, C., Philippe, D., Thomas, J., Marco, S., et al. (2016). Climate and the distribution of grasses in West Africa. J. Veg. Sci. 27, 306–317. doi: 10.1111/jvs.12360
Bond, W. J. (2008). What limits trees in C4 grasslands and savannas? Annu. Rev. Ecol. Evol. Syst. 39, 641–659. doi: 10.1146/annurev.ecolsys.39.110707.173411
Bond, W. J., Cook, G. D., and Williams, R. J. (2012). Which trees dominate in savannas? The escape hypothesis and eucalypts in northern Australia. Austral. Ecol. 37, 678–685. doi: 10.1111/j.1442-9993.2011.02343.x
Bond, W. J., and Loffell, D. (2001). Introduction of giraffe changes acacia distribution in a South African savanna. Afr. J. Ecol. 39, 286–294. doi: 10.1046/j.1365-2028.2001.00319.x
Bond, W. J., Woodward, F. I., and Midgley, G. F. (2005). The global distribution of ecosystems in a world without fire. New Phytol. 165, 525–538. doi: 10.1111/j.1469-8137.2004.01252.x
Botha, S. (2006). The Influence of Rainfall Variability on Savanna Tree Seedling Establishment. Doctoral dissertation, University of Cape Town.
Burke, A. (2006). Savanna trees in Namibia—Factors controlling their distribution at the arid end of the spectrum. Flora-Morphol. Distrib. Funct. Ecol. Plants 201, 189–201. doi: 10.1016/j.flora.2005.06.011
Charles-Dominique, T., Davies, T. J., Hempson, G. P., Bezeng, B. S., Daru, B. H., Kabongo, R. M., et al. (2016). Spiny plants, mammal browsers, and the origin of African savannas. Proc. Natl. Acad. Sci. U.S.A. 113, E5572–E5579. doi: 10.1073/pnas.1607493113
Charles-Dominique, T., Midgley, G. F., and Bond, W. J. (2017). Fire frequency filters species by bark traits in a savanna–forest mosaic. J. Veg. Sci. 28, 728–735. doi: 10.1111/jvs.12528
Chase, J. M., and Leibold, M. A. (2003). Ecological Niches: Linking Classical and Contemporary Approaches. University of Chicago Press.
Chen, I. C., Hill, J. K., Ohlemüller, R., Roy, D. B., and Thomas, C. D. (2011). Rapid range shifts of species associated with high levels of climate warming. Science 333, 1024–1026. doi: 10.1126/science.1206432
Cramer, M. D., Chimphango, S. B., Van Cauter, A., Waldram, M. S., Bond, W. J., et al. (2007). Grass competition induces N2 fixation in some species of African Acacia. J. Ecol. 95, 1123–1133. doi: 10.1111/j.1365-2745.2007.01285.x
Davis, A. J., Jenkinson, L. S., Lawton, J. H., Shorrocks, B., and Wood, S. (1998). Making mistakes when predicting shifts in species range in response to global warming. Nature 391, 783–786. doi: 10.1038/35842
Elith, J., and Leathwick, J. R. (2009). Species distribution models: ecological explanation and prediction across space and time. Annu. Rev. Ecol. Evol. Syst. 40, 677–697. doi: 10.1146/annurev.ecolsys.110308.120159
Ellis, E. C. (2011). Anthropogenic transformation of the terrestrial biosphere. Philos. Trans. R. Soc. Lond. Math. Phys. Eng. Sci. 369, 1010–1035. doi: 10.1098/rsta.2010.0331
February, E. C., Higgins, S. I., Bond, W. J., and Swemmer, L. (2013). Influence of competition and rainfall manipulation on the growth responses of savanna trees and grasses. Ecology 94, 1155–1164. doi: 10.1890/12-0540.1
Gaston, K. J. (2003). The Structure and Dynamics of Geographic Ranges. Oxford: Oxford University Press.
Hargreaves, A. L., Samis, K. E., and Eckert, C. G. (2013). Are species' range limits simply niche limits writ large? A review of transplant experiments beyond the range. Am. Nat. 183, 157–173. doi: 10.1086/674525
Hempson, G. P., Archibald, S., and Bond, W. J. (2017). The consequences of replacing wildlife with livestock in Africa. Sci. Rep. 7:17196. doi: 10.1038/s41598-017-17348-4
Henning, A. C., and White, R. E. (1974). A study of the growth and distribution of Colophospermum mopane (Kirk ex benth.) Kirk ex J. Leon: the interaction of nitrogen, phosphorus and soil moisture stress. Proc. Annu. Congr. Grassl. Soc. South. Afr. 9, 53–60.
Heubes, J., Kühn, I., König, K., Wittig R., Zizka G., Hahn, K., et al. (2011). Modelling biome shifts and tree cover change for 2050 in West Africa. J. Biogeogr. 38, 2248–2258. doi: 10.1111/j.1365-2699.2011.02560.x
Higgins, S. I., Bond, W. J., February, E. C., Bronn, A., Euston-Brown, D. I., Enslin, B., et al. (2007). Effects of four decades of fire manipulation on woody vegetation structure in savanna. Ecology 88, 1119–1125. doi: 10.1890/06-1664
Higgins, S. I., Bond, W. J., and Trollope, W. S. (2000). Fire, resprouting and variability: a recipe for grass–tree coexistence in savanna. J. Ecol. 88, 213–229. doi: 10.1046/j.1365-2745.2000.00435.x
Hijmans, R. J., Cameron, S. E., Parra, J. L., Jones, P. G., Jarvis, A. (2005). Very high resolution interpolated climate surfaces for global land areas. Int. J. Climatol. 25, 1965–1978. doi: 10.1002/joc.1276
Holdo, R. M. (2007). Elephants, fire, and frost can determine community structure and composition in Kalahari woodlands. Ecol. Appl. 17, 558–568. doi: 10.1890/05-1990
Hutchinson, G. E. (1957). “The multivariate niche,” in Cold Spring Harbor Symposia on Quantitative Biology, Vol. 22 (Cold Spring Harbor, NY), 415–421.
Hutchinson, G. E. (1978). An Introduction to Population Ecology. New Haven, CT: Yale University Press.
Johnson, E. A., and Gutsell, S. L. (1994). Fire frequency models, methods and interpretations. Adv. Ecol. Res. 25, 239–287. doi: 10.1016/S0065-2504(08)60216-0
Jolly, W. M., Nemani, R., and Running, S. W. (2005). A generalized, bioclimatic index to predict foliar phenology in response to climate. Glob. Change Biol. 11, 619–632. doi: 10.1111/j.1365-2486.2005.00930.x
Körner, C., and Basler, D. (2010). Phenology under global warming. Science 327, 1461–1462. doi: 10.1126/science.1186473
Lee-Yaw, J. A., Kharouba, H. M., Bontrager, M., Mahony, C., Csergo, A. M., Noreen, A. M., et al. (2016). A synthesis of transplant experiments and ecological niche models suggests that range limits are often niche limits. Ecol. Lett. 19, 710–722. doi: 10.1111/ele.12604
Lehmann, C. E., Anderson, T. M., Sankaran, M., Higgins, S. I., Archibald, S., Hoffmann, W. A., et al. (2014). Savanna vegetation-fire-climate relationships differ among continents. Science 343, 548–552. doi: 10.1126/science.1247355
Lenoir, J., Gégout, J. C., Marquet, P. A., de Ruffray, P., and Brisse, H. (2008). A significant upward shift in plant species optimum elevation during the 20th century. Science 320, 1768–1771. doi: 10.1126/science.1156831
Makhado, R. A., Mapaure, I., Potgieter, M. J., Luus-Powell, W., and Saidi A. (2014). Factors influencing the adaptation and distribution of Colophospermum mopane in southern Africa's mopane savannas-A review. Bothalia-Afr Biodivers. Conserv. 44, 1–9. doi: 10.4102/abc.v44i1.152
Mapaure, I. (1994). The distribution of Colophospermum mopane (Leguminosae: Caesalpinioideae) in Africa. Kirkia 15, 1–5.
Midgley, J. J., and Bond, W. J. (2001). A synthesis of the demography of African acacias. J. Trop. Ecol. 17, 871–886. doi: 10.1017/S026646740100164X
Midgley, J. J., Lawes, M. J., and Chamaillé-Jammes, S. (2010). TURNER REVIEW No. 19. Savanna woody plant dynamics: the role of fire and herbivory, separately and synergistically. Aust. J. Bot. 58, 1–11. doi: 10.1071/BT09034
Miller, M. F. (1994). The fate of mature African Acacia pods and seeds during their passage from the tree to the soil. J. Trop. Ecol. 10, 183–196. doi: 10.1017/S0266467400007835
Mlambo, D., and Nyathi, P. (2004). Seedling recruitment of Colophospermum mopane on the Highveld of Zimbabwe. South. Afr. Forest. J. 202, 45–53. doi: 10.1080/20702620.2004.10431789
O'Connor, T. G., and Bredenkamp, G. J. (1997). “Grassland,” in Vegetation of Southern Africa, eds R. M. Cowling, D. M. Richardson, and S. M. Pierce (Cambridge: Cambridge University Press), 215–257.
O'connor, T. G., Haines, L. M., and Snyman, H. A. (2001). Influence of precipitation and species composition on phytomass of a semi-arid African grassland. J. Ecol. 89, 850–860. doi: 10.1046/j.0022-0477.2001.00605.x
Parmesan, C., and Yohe, G. (2003). A globally coherent fingerprint of climate change impacts across natural systems. Nature 421, 37–42. doi: 10.1038/nature01286
Pausas, J. G., and Ribeiro, E. (2017). Fire and plant diversity at the global scale. Glob. Ecol. Biogeogr. 26, 889–897. doi: 10.1111/geb.12596
Pinheiro, J., Bates, D., DebRoy, S., and Sarkar, D. (2009). nlme: Linear and Nonlinear Mixed Effects Models. R package version 3.1-96. Vienna: R Foundation for Statistical Computing.
Plas, F., Howison, R., Reinders, J., Fokkema, W., and Olff, H. (2013). Functional traits of trees on and off termite mounds: understanding the origin of biotically-driven heterogeneity in savannas. J. Veg. Sci. 24, 227–238. doi: 10.1111/j.1654-1103.2012.01459.x
Prins, H. H., and van der Jeugd, H. P. (1993). Herbivore population crashes and woodland structure in East Africa. J. Ecol. 81, 305–314. doi: 10.2307/2261500
R Core Team (2018). R: A Language and Environment for Statistical Computing. Vienna: R Foundation for Statistical Computing.
Riginos, C. (2009). Grass competition suppresses savanna tree growth across multiple demographic stages. Ecology 90, 335–340. doi: 10.1890/08-0462.1
Root, T. L., Price, J. T., Hall, K. R., Schneider, S. H., Rosenzweig, C., and Pounds, J. A. (2003). Fingerprints of global warming on wild animals and plants. Nature 421, 57–60. doi: 10.1038/nature01333
Scheffers, B. R., De Meester, L., Bridge, T. C., Hoffmann, A. A., Pandolfi, J. M., Corlett, R. T., et al. (2016). The broad footprint of climate change from genes to biomes to people. Science 354:aaf7671. doi: 10.1126/science.aaf7671
Scholtz, R., Kiker, G. A., Smit, I. P. J., and Venter, F. J. (2014). Identifying drivers that influence the spatial distribution of woody vegetation in Kruger National Park, South Africa. Ecosphere 5, 1–12. doi: 10.1890/ES14-00034.1
Schulze, R. E. (2007). “South African atlas of climatology and agrohydrology: terminology,” in South African Atlas of Climatology and Agrohydrology, ed R. E. Schulze (Pretoria: Water Research Commission), WRC Report 1489/1/06.
Sexton, J. P., McIntyre, P. J., Angert, A. L., and Rice, K. J. (2009). Evolution and ecology of species range limits. Annu. Rev. Ecol. Evol. Syst. 40, 415–436. doi: 10.1146/annurev.ecolsys.110308.120317
Smith, A., Page, B., Duffy, K., and Slotow, R. (2012). Using maximum entropy modeling to predict the potential distributions of large trees for conservation planning. Ecosphere 3, 1–21. doi: 10.1890/ES12-00053.1
Staver, A. C., Archibald, S., and Levin, S. A. (2011). The global extent and determinants of savanna and forest as alternative biome states. Science 334, 230–232. doi: 10.1126/science.1210465
Staver, A. C., Bond, W. J., Cramer, M. D., and Wakeling, J. L. (2012). Top-down determinants of niche structure and adaptation among African Acacias. Ecol. Lett. 15, 673–679. doi: 10.1111/j.1461-0248.2012.01784.x
Staver, A. C., Bond, W. J., Stock, W. D., Van Rensburg, S. J., and Waldram, M. S. (2009). Browsing and fire interact to suppress tree density in an African savanna. Ecol. Appl. 19, 1909–1919. doi: 10.1890/08-1907.1
Stevens, N. (2014). Exploring the Potential Impacts of Global Change on the Woody Component of South African Savannas. Doctoral dissertation, University of Cape Town.
Stevens, N., Seal, C. E., Archibald, S., and Bond, W. (2014a). Increasing temperatures can improve seedling establishment in arid-adapted savanna trees. Oecologia 175, 1029–1040. doi: 10.1007/s00442-014-2958-y
Stevens, N., Swemmer, A. M., Ezzy, L., and Erasmus, B. F. (2014b). Investigating potential determinants of the distribution limits of a savanna woody plant: Colophospermum mopane. J. Veg. Sci. 25, 363–373. doi: 10.1111/jvs.12098
Styles, C. V., and Skinner, J. D. (1997). Seasonal variations in the quality of mopane leaves as a source of browse for mammalian herbivores. Afr. J. Ecol. 35, 254–265.
Svenning, J. C., and Skov, F. (2007). Could the tree diversity pattern in Europe be generated by postglacial dispersal limitation? Ecol. Lett. 10, 453–460. doi: 10.1111/j.1461-0248.2007.01038.x
Therneau, T. M. (2018). coxme: Mixed Effects Cox Models. R package version 2.2-7. Available online at: https://CRAN.R-project.org/package=coxme
Thomas, C. D. (2010). Climate, climate change and range boundaries. Divers. Distrib. 16, 488–495. doi: 10.1111/j.1472-4642.2010.00642.x
Thomas, C. D., Cameron, A., Green, R. E., Bakkenes, M., Beaumont, L. J., Collingham, Y. C., et al. (2004). Extinction risk from climate change. Nature 427, 145–148. doi: 10.1038/nature02121
Timberlake, J. R. (1995). Colophospermum mopane: Annotated Bibliography and Review. Harare: Comm Div Res Dev.
Trapnell, C. G. (1959). Ecological results of woodland and burning experiments in Northern Rhodisia. J. Ecol. 47, 129–168. doi: 10.2307/2257252
Trollope, W. S. W., and Potgieter, A. L. F. (1986). Estimating grass fuel loads with a disc pasture meter in the Kruger National Park. J. Grass. Soc. South. Afr. 3, 148–152. doi: 10.1080/02566702.1986.9648053
Villoen, L., Van der Bank, F. H., Van der Bank, M., Grobler, J. P., Wessels, D., and Manning, J. C. (2003). Allozyme variation in five populations of mopane, Colophospermum mopane (Fabaceae). South Afr. J. Bot. 69, 282–286.
Wakeling, J. L., Cramer, M. D., and Bond, W. J. (2012). The savanna-grassland ‘treeline': why don't savanna trees occur in upland grasslands? J. Ecol. 100, 381–391. doi: 10.1111/j.1365-2745.2011.01921.x
Wakeling, J. L., Staver, A. C., and Bond, W. J. (2011). Simply the best: the transition of savanna saplings to trees. Oikos 120, 1448–1451. doi: 10.1111/j.1600-0706.2011.19957.x
Werner, P. A., and Prior, L. D. (2013). Demography and growth of subadult savanna trees: interactions of life history, size, fire season, and grassy understory. Ecol. Monogr. 83, 67–93. doi: 10.1890/12-1153.1
Whitecross, M. A., Archibald, S., and Witkowski, E. T. F. (2012). Do freeze events create a demographic bottleneck for Colophospermum mopane? South Afr. J. Bot. 83, 9–18. doi: 10.1016/j.sajb.2012.07.008
Keywords: species distribution, range limits, savanna, range shifts, transplant, grass competition, Colophospermum mopane, Senegalia nigrescens
Citation: Stevens N, Archibald SA and Bond WJ (2018) Transplant Experiments Point to Fire Regime as Limiting Savanna Tree Distribution. Front. Ecol. Evol. 6:137. doi: 10.3389/fevo.2018.00137
Received: 27 March 2018; Accepted: 23 August 2018;
Published: 18 September 2018.
Edited by:
Daniel M. Griffith, Oregon State University, United StatesReviewed by:
Robert Bagchi, University of Connecticut, United StatesKaty Morgan, University of Bath, United Kingdom
Copyright © 2018 Stevens, Archibald and Bond. This is an open-access article distributed under the terms of the Creative Commons Attribution License (CC BY). The use, distribution or reproduction in other forums is permitted, provided the original author(s) and the copyright owner(s) are credited and that the original publication in this journal is cited, in accordance with accepted academic practice. No use, distribution or reproduction is permitted which does not comply with these terms.
*Correspondence: Nicola Stevens, nicolastvns@gmail.com