Integrating Multiple Data Types to Connect Ecological Theory and Data Among Levels
 Jian D. L. Yen1,2*
  Zeb Tonkin3 Jarod Lyon3 Wayne Koster3 Adrian Kitchingman3 Kasey Stamation3
  Peter A. Vesk1,2
- 1School of BioSciences, The University of Melbourne, Melbourne, VIC, Australia
- 2ARC Centre of Excellence for Environmental Decisions, The University of Melbourne, Melbourne, VIC, Australia
- 3Arthur Rylah Institute for Environmental Research, Department of Environment, Land, Water and Planning, Melbourne, VIC, Australia
Ecological theories often encompass multiple levels of biological organization, such as genes, individuals, populations, and communities. Despite substantial progress toward ecological theory spanning multiple levels, ecological data rarely are connected in this way. This is unfortunate because different types of ecological data often emerge from the same underlying processes and, therefore, are naturally connected among levels. Here, we describe an approach to integrate data collected at multiple levels (e.g., individuals, populations) in a single statistical analysis. The resulting integrated models make full use of existing data and might strengthen links between statistical ecology and ecological models and theories that span multiple levels of organization. Integrated models are increasingly feasible due to recent advances in computational statistics, which allow fast calculations of multiple likelihoods that depend on complex mechanistic models. We discuss recently developed integrated models and outline a simple application using data on freshwater fishes in south-eastern Australia. Available data on freshwater fishes include population survey data, mark-recapture data, and individual growth trajectories. We use these data to estimate age-specific survival and reproduction from size-structured data, accounting for imperfect detection of individuals. Given that such parameter estimates would be infeasible without an integrated model, we argue that integrated models will strengthen ecological theory by connecting theoretical and mathematical models directly to empirical data. Although integrated models remain conceptually and computationally challenging, integrating ecological data among levels is likely to be an important step toward unifying ecology among levels.
Introduction
The search for unifying principles in ecology has spawned many ecological theories (Scheiner and Willig, 2011). These theories often span multiple levels of organization, connecting individuals to population, communities, and ecosystems (e.g., Brown et al., 2004; Falster et al., 2017). Although ecologists regularly translate theoretical models into mathematical frameworks (e.g., Hubbell, 2001; Brown et al., 2004; Kooijman, 2010), it has proven difficult to parameterize these complex, mathematical frameworks so that the resulting models are accurate, realistic, and applicable to real-world challenges (Marquet et al., 2014). We believe that attempts to parameterize complex, process-explicit models have been hampered by the isolation of data collected at different levels of organization. Although theoretical models regularly span multiple levels of organization, statistical models rarely connect data in this way.
Most models of ecological processes are fitted as “forward models,” where model parameters are estimated from data measured at the level of the parameter (e.g., individual survival estimated from data on individuals through time) (Caswell, 2001; Tredennick et al., 2017). Although forward models usually support unique parameter estimates, it is challenging to collect the data required to parameterize forward models reliably while maintaining generality (Manning and Goldberg, 2010; Tredennick et al., 2017). Recently, several statistical advances have enabled “inverse models,” where model parameters are estimated from data measured at higher levels of organization than the model parameters (e.g., Ghosh et al., 2012; González et al., 2016). For example, inverse modeling approaches have been used to estimate individual survival and fecundity from time series of population abundances rather than individual recapture histories (Ghosh et al., 2012). Inverse models make use of widely available data on higher levels of organization (e.g., population abundance surveys), which overcomes issues of data availability (Ghosh et al., 2012; Ovaskainen et al., 2016). However, inverse models often fail to identify unique parameter combinations because observed patterns at one level of organization are often consistent with multiple sets of parameters at lower levels of organization, leading to problems of non-identifiability (Peng et al., 2011; Ghosh et al., 2012).
In general, both forward and inverse models focus on a single type of data. For example, forward models of population dynamics typically are parameterized with data on survival and recruitment (e.g., life tables) (Fujiwara and Diaz-Lopez, 2017). By contrast, inverse models of population dynamics often are parameterized with data on populations (e.g., abundance time series) (Ghosh et al., 2012). Forward and inverse models face different challenges; a lack of data hampers forward models whereas a lack of specificity hampers inverse models. Importantly, these challenges are complementary, which suggests that a potential route is to combine forward and inverse modeling approaches to parameterize models from data collected at multiple levels of organization (Evans, 2012; Dietze, 2017). Connecting data collected at multiple levels—an “integrated” modeling approach—makes full use of available data and enables reliable parameter estimates without loss of generality (Besbeas et al., 2002; Schaub et al., 2007; Maunder and Punt, 2013).
Integrated models potentially overcome the practical challenge of estimating reliable, realistic parameters in complex mathematical models, such as dynamic energy budget models (Kooijman, 2010) or matrix population models (Caswell, 2001). This practical benefit has implications for fundamental ecology. For example, widespread estimates of demographic vital rates in natural conditions might give substantial new insights into spatial and temporal variation in life histories (e.g., McIntyre and Hutchings, 2003). Similarly, simultaneous analysis of data on individuals, populations, communities, and ecosystems might support realistic, data-driven models of biodiversity and ecosystem function (Isbell et al., 2018), and would bridge ecological analyses across distinct spatial scales, which is critical to the development of general ecological theory (Chave, 2013). In the following sections, we give a general introduction to integrated models, outline an illustrative application to real data, and discuss several open challenges.
Connecting Multiple Data Types With Integrated Models
Integrated models connect multiple data types through a composite likelihood function (Maunder and Punt, 2013). Central to this approach is a core process model that connects multiple data types through appropriate likelihoods (Besbeas et al., 2002). With an appropriate process model, a component likelihood can be defined for each data type:
where the subscript i indexes different data types and the function fi(x) is specific to the ith data type. Multiple component likelihoods can be combined into a composite (joint) likelihood function:
where the function g(…) takes multiple component likelihoods and returns a single value for the composite likelihood. Commonly, component likelihoods are assumed to be independent, in which case the function g(…) is the product of all component likelihoods:
The composite likelihood composite can be used with any likelihood-based methods of inference (e.g., maximum likelihood, Markov chain Monte Carlo) (Maunder and Punt, 2013).
The choice of process model is critical to an integrated model. The process model must connect data collected at multiple levels of organization (e.g., individuals and communities) and must be computationally tractable. Existing applications of integrated models have focused predominantly on population processes (e.g., species' occurrences, demographic models; Bird et al., 2014; Koons et al., 2017; Lahoz-Monfort et al., 2017; Zipkin et al., 2017), which facilitates computation while remaining relevant to multiple levels. However, any process model that connects multiple data types could be used (e.g., models of individual or ecosystem dynamics). A potentially useful focus is individual-based models, which could be connected to many data types at the expense of increased computational demands (Grimm and Railsback, 2005).
The primary challenge in the development of an integrated model is computational. Integrated models include potentially complex and dynamic process models, as well as multiple likelihoods that differ in complexity. Although a composite likelihood function is suited to many inference methods, high computational demands mean that fully Bayesian implementations are rare (but see Brooks et al., 2004; Zipkin et al., 2017). In addition, many implementations are hard-coded for particular case studies (Maunder and Punt, 2013), and generalizing these models typically requires knowledge of software for Bayesian hierarchical models (e.g., BUGS or AD Model Builder; Maunder and Punt, 2013; Koons et al., 2017). Recent advances in computational statistics and software are enabling more flexible implementations of integrated models, and we give an example of one such model in the following section.
Example: Estimating Fish Population Dynamics From Multiple Data Types
Background
Globally, freshwater river ecosystems are stressed by a combination of water extraction, changes to flow regimes, commercial and recreational fishing, the introduction of exotic species, and chemical and thermal pollution (Nilsson et al., 2005; Koehn et al., 2014). In many regions of the world, increased frequency of droughts and increases in consumptive water use have led to widespread water shortages, further exacerbating stresses on river ecosystems (Nilsson et al., 2005). In response to water shortages, many government agencies have invested heavily in programs to deliver environmental flows—releases of water to protect biological resources—often with an explicit focus on the viability of fish populations (Beesley et al., 2014; Koehn et al., 2014).
The Murray-Darling Basin in south-eastern Australia is highly valued environmentally, economically, and socially. Environmental values have been heavily affected by river regulation, particularly through the seasonal reversal of the timing of flows and reduced frequency and magnitude of flooding (Maheshwari et al., 1995). The Murray-Darling Basin supports over 40 native fish species, many of which have experienced substantial declines in abundance over the past century (Koehn, 2015). Here, we focus on Murray cod (Maccullochella peelii Mitchell, 1838), a large-bodied freshwater fish species listed as vulnerable under the Australian Commonwealth Environment Protection and Biodiversity Conservation Act, 1999. Murray cod are included in several state and federal conservation programs, which aim to identify management actions that will maintain viable populations, often with an explicit focus on environmental flows (Koehn, 2015). A key requirement of these programs is reliable models of population dynamics that can be used to predict population dynamics in different locations and under different management scenarios (Yen et al., 2013).
Data Types
We used data collected over 20 years in six rivers in the Murray-Darling Basin: the Murray (1999–present), Ovens (2007–present), Loddon (2007–present), Goulburn (2008–present), Campaspe (2007–present), and Broken (2008–present). Available data included sizes of all individuals captured in a given survey, size-at-age data from otoliths collected from 55 individuals from 1999–present, and mark-recapture data from 1999–2017 at several locations in the Murray River. All three data sets had similar ranges of individual sizes and ages.
Statistical Analysis
Our aim was to parameterize an age-structured model of population dynamics from data on size-abundance distributions, size-at-age data, and binary recapture histories (Figure 1). The underlying process model was a density-dependent Leslie matrix model with variation in vital rates among rivers (Caswell, 2001). We used five age classes and binned size-abundance data into eight size classes (round brackets exclude endpoints): [(0 , 200 g), (200 , 500 g), (500 , 1000 g), (1000 , 2000 g), (2000 , 5000 g), (5000 , 10,000 g), (10,000 , 20,000 g), and (20,000 , 60,000 g)]. These bins were chosen arbitrarily, with unequal bin widths to avoid the majority of individuals falling into one or a few size classes.
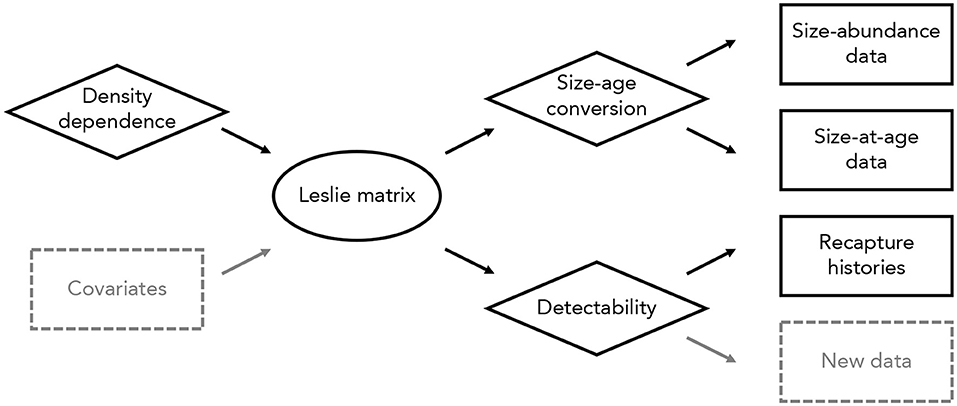
Figure 1. Overview of the integrated modeling approach used here. Different data types (in rectangles) are connected to one another through a density-dependent Leslie matrix model (oval). Several sub-models (diamonds) incorporate density dependence, a conversion from sizes to ages, and detectability. New data types (dashed rectangles) could be included in this model without altering the overall modeling approach. Similarly, data and sub-models could be added or removed as needed, and the main Leslie matrix model could be replaced with an alternative process model (e.g., an integral projection model or individual-based model).
We connected size-abundance data, size-at-age data, and recapture histories to the underlying Leslie matrix with three component likelihoods (Figure 1). First, we assumed size-class abundances were independently Poisson-distributed, conditional on a detection probability, a conversion from size classes to age classes, and the matrix population model (i.e., dependencies among age classes are captured in the Leslie matrix). Second, we used binary recapture histories to estimate the probability of detection, assuming a Cormack-Jolly-Seber model with time-varying survival probabilities (Lebreton et al., 1992). Third, we used size-at-age data to relate size-class abundances to age-class abundances, assuming that the distribution of individuals in a given size class among all age classes followed a multinomial distribution. We provide a detailed description of this model, including specification of prior distributions, in Appendix S1.
We assumed the three component likelihoods were independent, so that the composite likelihood was the product of all three component likelihoods:
Constructing models in this way is fully modular, and allows any or all elements of a given model to be changed (Figure 1). For example, the matrix population model could be replaced with an integral projection model or individual-based model, data sets of the same or different type could be added to the analysis, and data sets could be removed to estimate parameters using a forward or inverse modeling approach (Figure 1). The only requirement is that the component likelihoods can be defined; all other aspects of the modeling process are unchanged.
We used the greta R package to generate fully Bayesian parameter estimates (Golding, 2018). We based parameter estimates on 40000 random-walk Metropolis-Hastings Monte Carlo iterations (four chains of 100000 iterations, retaining every tenth sample), following a 100000 iteration warm-up and burn-in period. We assessed model convergence through visual inspection of chains and used Bayesian r2 values to summarize model fit (Gabry and Goodrich, 2018). We did not use more-rigorous model validation (e.g., cross validation) because our goal was to illustrate the implementation of a simple integrated model rather than to present a full analysis of these data. Links to model code are in Data availability.
Results and Discussion
The integrated model fitted observed abundances moderately well in five of six rivers, with median Bayesian r2 values > 0.4 in all rivers except the Murray river (Figure S1, Table S1). Model fit was very poor in the Murray river (median Bayesian r2 = 0.00) (Figure S1, Table S1). Poor model fit in the Murray river, which had the highest observed abundances, might be due to shared priors on vital rates drawing estimates toward those of other rivers. Fitted abundances did not always track observed abundances closely (Figure S1), due primarily to the constraints imposed by the matrix population model. Although a process-explicit approach might not match observed data as closely as alternative methods (e.g., a purely statistical regression model), the use of an explicit process model potentially guards against overfitting and, therefore, might be expected to yield more-accurate long-term predictions (Cuddington et al., 2013). We acknowledge that more-detailed model validation would be required to test this claim.
Median survival probabilities ranged from 0.32–0.67 in one and two year age classes, with the lowest values in the Murray river and highest in the Loddon river (Figure 2). Median survival probabilities of three and four year age classes was generally between 0.5 and 0.8, with lower values in the Ovens river (0.16 and 0.41 for three and four year age classes, respectively) (Figure 2). Median survival probabilities of the five year old age class were mostly between 0.4 and 0.6, with a slightly lower value in the Loddon river (0.37) and a slightly higher value in the Goulburn river (0.66) (Figure 2). Estimates of survival probabilities in one, two, and four year age classes were similar to values reported in the literature, but estimates in three and five year age classes were generally lower than values in the literature (Figure 2). Median fecundity estimates, which encompass egg and larval survival, ranged from 1 to 5, with low values (<2) in the Campaspe, Goulburn, Ovens, and Loddon rivers, and relatively high values (>4) in the Broken and Murray rivers (Figure 2). These higher estimates of fecundity in the Broken and Murray rivers match closely with existing estimates in the literature (Figure 2). Density dependence was weak in the Murray, Ovens, Goulburn, and Broken rivers (k < 10−4) but strong in the Campaspe (k = 0.01) and Loddon rivers (k = 0.02), indicating relatively low carrying capacities in the Campaspe and Loddon systems (Figure S2, Table S2).
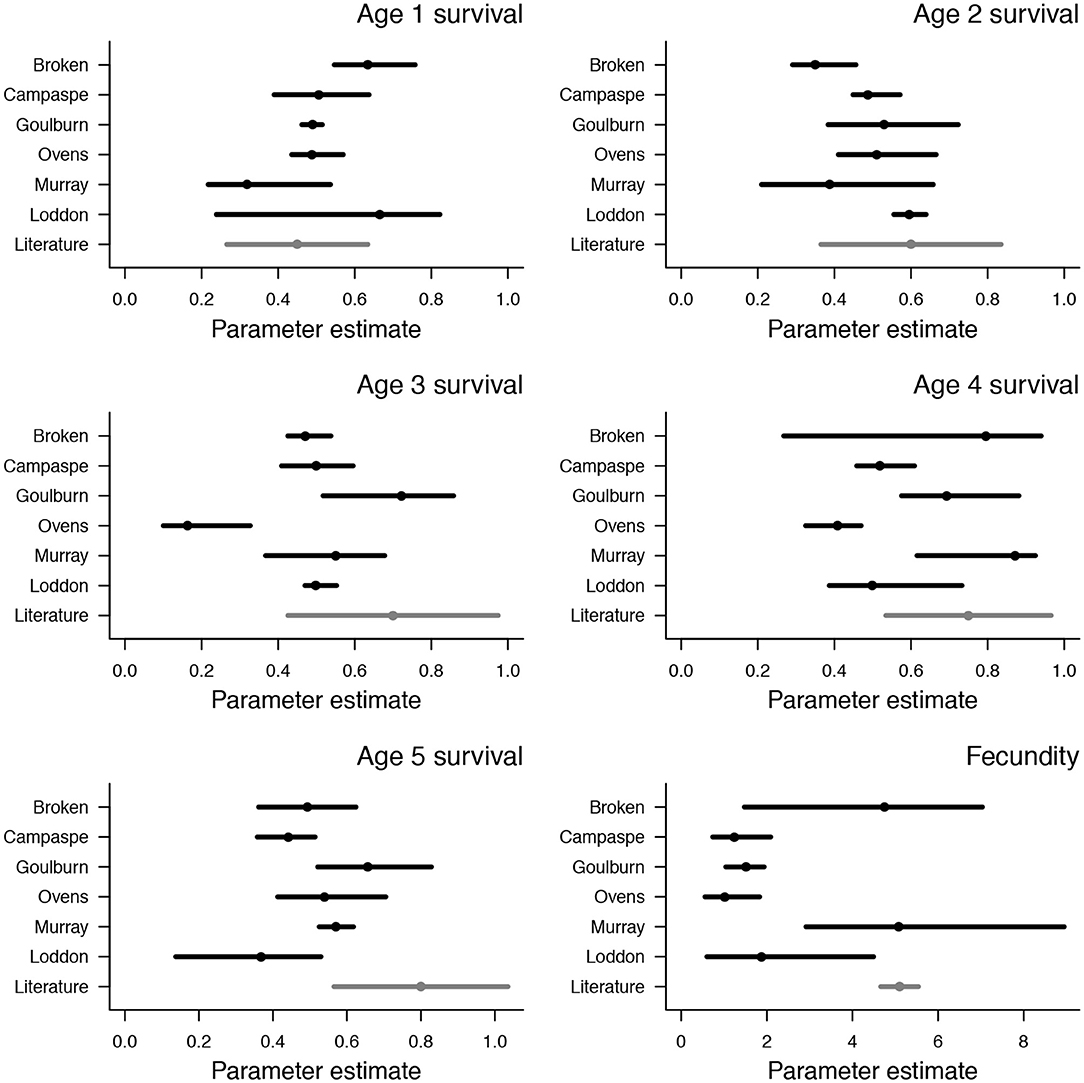
Figure 2. Posterior distributions of survival and fecundity from age-structured population models of Murray cod. Values are shown for each of six rivers in south-eastern Australia (black points and lines), along with independent estimates from Yen et al. (2013) (gray points and lines). Points are median values and bars span 95% credible intervals.
There are several possible extensions to this model. A relatively straightforward extension would consider temporal variation in vital rates, particularly in response to local or regional environmental conditions (Figure 1). Incorporating temporal variation in this way would enable projections of population abundances that are linked closely to contemporary and projected future environments (e.g., Yen et al., 2013). More challenging extensions might include size- or age-structured models of recapture histories or spatially explicit variation in vital rates. Although extensions such as these introduce computational challenges, it is conceptually straightforward to incorporate new data and models into the integrated modeling approach used here (Figure 1).
Next Steps in the Development of Integrated Models
The example presented here illustrates the use of an integrated model to estimate the parameters of a complex, process-explicit model. This approach enabled simultaneous estimates of demographic vital rates, detection probabilities, and size-age associations, which would not be possible without an integrated modeling approach. However, this example also illustrates several challenges. These include the computational demands of increasingly complex model structures (e.g., individual-based models), the development of generalizable likelihoods that allow novel data types to be included in arbitrarily complex model structures, and the development of more-sophisticated composite likelihoods that incorporate dependencies among data types. Rapid development of integrated modeling techniques suggest that these challenges will soon be overcome, enabling many new applications of integrated models. Two particularly exciting applications are the use of integrated models to connect data among many levels, and the use of integrated models to support advances in ecological theory.
Connecting Data Flexibly Among Many Levels
Most integrated models have focused on data collected at one or two levels. For example, integrated models of species distributions use data on populations (e.g., Lahoz-Monfort et al., 2017; Pacifici et al., 2017; Zipkin et al., 2017), while integrated models of demography use data on individuals and populations to estimate demographic vital rates (e.g., Brooks et al., 2004; Schaub et al., 2007; Bird et al., 2014; Koons et al., 2017). Few studies have moved beyond two levels to consider data spanning many levels (but see Péron and Koons, 2012). Given that individual behavior and movement, population dynamics, interspecific interactions, and ecosystem processes are all connected to the same underlying processes, it seems plausible that an integrated model could connect data among many levels.
Although integrated models are restricted by the computational demands of complex process models and likelihood functions, recent advances in computational software and hardware are rapidly overcoming these barriers. High-performance software libraries such as TensorFlow (Abadi et al., 2015) are enabling rapid computation of complex, dynamic models, supported by accessible libraries and packages in the R and Python computing environments (e.g., Golding, 2018). In addition, increasing availability and accessibility of high-performance computing environments is allowing non-specialists to undertake computationally demanding analyses. A major advance will be the development of flexible and modular software for integrated models that include different amounts and types of data.
Advancing Theory With Integrated Models
Integrated models have been used largely as a practical solution to data shortages and non-identifiable models (e.g., Maunder and Punt, 2013; Zipkin et al., 2017). However, a broader benefit of integrated models is their capacity to link ecological data directly with ecological processes. Ecological theory often is quantified through a mathematical process model. Therefore, connecting data with ecological processes supports close ties between theory and data, with theory informing the process models that underpin integrated data analyses. Similarly, an inability to parameterize process models from available data often limits the development of ecological theory. In this case, using all available data to parameterize complex process models has the potential to hasten the development of ecological theory. Examples include the refinement of life-history theory through more accurate demographic models and new insight into biodiversity-ecosystem function theory through models that connect population, community, and ecosystem dynamics. Although it is not entirely clear whether ecologists should emphasize theory developed from first principles or theory derived from data (Marquet et al., 2014), it is likely that close ties between theory and data will improve inferences, predictions, and understanding of ecological processes (Marquet et al., 2014; Rillig et al., 2015; Dietze, 2017).
Data Availability
All model code and data are archived at https://zenodo.org/record/2551819 (DOI: 10.5281/zenodo.2551819). Data are provided specifically for purposes of reproducibility. Raw data suitable for alternative analyses are publicly accessible through the Victorian Biodiversity Atlas (https://vba.dse.vic.gov.au/vba/).
Author Contributions
JY and PV developed the statistical methods presented here. ZT, JL, WK, AK, and KS provided the case study and all data. JY conducted all analyses and wrote the first draft of the manuscript. All authors contributed to subsequent revisions of the manuscript.
Funding
JY and PV were supported by the Australian Research Council Centre of Excellence for Environmental Decisions (CE11001000104). Data collections used in this work were funded by the Murray Darling Basin Authority, the Commonwealth Environmental Water Office Long-Term Intervention Monitoring project, and the Victorian Environmental Flow Monitoring and Assessment Program, Department of Environment, Land, Water and Planning. JY received additional funds from The University of Melbourne and The Robert Johanson and Anne Swann Fund.
Conflict of Interest Statement
The authors declare that the research was conducted in the absence of any commercial or financial relationships that could be construed as a potential conflict of interest.
Acknowledgments
We thank Diego Barneche, Julie Messier, Mary O'Conner, and Angelica Gonzalez for the invitation to write this perspective. Nick Golding provided advice on computational aspects of the work presented here. Many staff at the Arthur Rylah Institute contributed data used in this work, particularly Jason Lieschke, Joanne Kearns, John McKenzie, John Mahoney, Justin O'Mahony, Graeme Hackett, Andrew Pickworth, Scott Raymond, David Dawson, Matt Jones, Justin O'Connor, and Renae Ayres.
Supplementary Material
The Supplementary Material for this article can be found online at: https://www.frontiersin.org/articles/10.3389/fevo.2019.00095/full#supplementary-material
References
Abadi, M., Barhma, P., Chen, J., Chen, Z., Davis, A., Dean, J., et al. (2015). “TensorFlow: a system for large-scale machine learning,” in Proceedings of the 12th USENIX Symposium on Operating Systems Design and Implementation (Savannah, GA).
Beesley, L., King, A. J., Gawne, B., Koehn, J. D., Price, A., Nielsen, D., et al. (2014). Optimising environmental watering of floodplain wetlands for fish. Freshw. Biol. 59, 2024–2037. doi: 10.1111/fwb.12404
Besbeas, P., Freeman, S. N., Morgan, B. J. T., and Catchpole, E. A. (2002). Integrating mark-recapture-recovery and census data to estimate animal abundance and demographic parameters. Biometrics 58, 540–547. doi: 10.1111/j.0006-341X.2002.00540.x
Bird, T., Lyon, J., Nicol, S., McCarthy, M., and Barker, R. (2014). Estimating population size in the presence of temporary migration using a joint analysis of telemetry and capture-recapture data. Methods Ecol. Evol. 5, 615–625. doi: 10.1111/2041-210X.12202
Brooks, S. P., King, R., and Morgan, B. J. T. (2004). A Bayesian approach to combining animal abundance and demographic data. Anim. Biodivers. Conserv. 27, 515–529. Available online at: http://abc.museucienciesjournals.cat/volum-27-1-2004-abc/a-bayesian-approach-to-combining-animal-abundance-and-demographic-data/
Brown, J. H., Gillooly, J. F., Allen, A. P., Savage, V. M., and West, G. B. (2004). Toward a metabolic theory of ecology. Ecology 85, 1771–1789. doi: 10.1890/03-9000
Caswell, H. (2001). Matrix Population Models: Construction, Analysis, and Interpretation, 2nd Edn. Sunderland, MA: Sinauer Associates.
Chave, J. (2013). The problem of pattern and scale in ecology: what have we learned in 20 years? Ecol. Lett. 16, 4–16. doi: 10.1111/ele.12048
Cuddington, K., Fortin, M.-J., Gerber, L. R., Hastings, A., Liebhold, A., O'Connor, M., et al. (2013). Process-based models are required to manage ecological systems in a changing world. Ecosphere 4:20.
Evans, M. R. (2012). Modelling ecological systems in a changing world. Philos. Trans. R. Soc. B 367, 181–190. doi: 10.1098/rstb.2011.0172
Falster, D. S., Brännström, Å., Westoby, M., and Dieckmann, U. (2017). Multitrait successional forest dynamics enable diverse competitive coexistence. Proc. Natl. Acad. Sci. U.S.A. 114, E2719–E2728. doi: 10.1073/pnas.1610206114
Fujiwara, M., and Diaz-Lopez, J. (2017). Constructing stage-structured matrix population models from life tables: comparison of methods. PeerJ 5:e3971. doi: 10.7717/peerj.3971
Gabry, J., and Goodrich, B. (2018). rstantools: Tools for Developing R Packages Interfacing With ‘Stan’. R Package version 1.5.1. Available online at: http://mc-stan.org/rstantools (accessed January 10, 2019).
Ghosh, S., Gelfand, A. E., and Clark, J. S. (2012). Inference for size demography from point pattern data using integral projection models. J. Agric. Biol. Environ. Stat. 17, 641–677. doi: 10.1007/s13253-012-0123-9
Golding, N. (2018). greta. R package version 0.2.3. Available online at: https://greta-stats.org (accessed January 10, 2019).
González, E. J., Martorell, C., and Bolker, B. M. (2016). Inverse estimation of integral projection model parameters using time series of population-level data. Methods Ecol. Evol. 7, 147–156. doi: 10.1111/2041-210X.12519
Grimm, V., and Railsback, S. F. (2005). Individual-Based Modelling and Ecology. Princeton, MA: Princeton University Press.
Hubbell, S. P. (2001). The unified neutral theory of biodiversity and Biogeography. Princeton, MA: Princeton University Press.
Isbell, F., Cowles, J., Dee, L. E., Loreau, M., Reich, P. B., Gonzalez, A., et al. (2018). Quantifying effects of biodiversity on ecosystem functioning across times and places. Ecol. Lett. 21, 763–778. doi: 10.1111/ele.12928
Koehn, J. D. (2015). Managing people, water, food and fish in the Murray-Darling Basin, south-eastern Australia. Fish. Manag. Ecol. 22, 25–32. doi: 10.1111/fme.12035
Koehn, J. D., King, A. J., Beesley, L., Copeland, C., Zampatti, B. P., and Mallen-Cooper, M. (2014). Flows for native fish in the Murray-Darling basin: lessons and considerations for future management. Ecol. Manag. Restorat. 15, 40–50. doi: 10.1111/emr.12091
Kooijman, S. A. L. M. (2010). Dynamic Energy Budget Theory For Metabolic Organisation, 3rd Edn. Cambridge, UK: Cambridge University Press.
Koons, D. N., Arnold, T. W., and Schaub, M. (2017). Understanding the demographic drivers of realized population growth rates. Ecol. Appl. 27, 2102–2115. doi: 10.1002/eap.1594
Lahoz-Monfort, J. J., Harris, M. P., Wanless, S., Freeman, S. N., and Morgan, B. J. T. (2017). Bringing it all together: multi-species integrated population modelling of a breeding community. J. Agric. Biol. Environ. Statis. 22, 140–160. doi: 10.1007/s13253-017-0279-4
Lebreton, J.-D., Burnham, K. P., Clobert, J., and Anderson, D. R. (1992). Modeling survival and testing biological hypotheses using marked animals: a unified approach with case studies. Ecol. Monogr. 62, 67–118. doi: 10.2307/2937171
Maheshwari, B. L., Walker, K. F., and McMahon, T. A. (1995). Effects of regulation on the flow regime of the River Murray, Australia. Regul. Rivers Res. Manag. 10, 15–38. doi: 10.1002/rrr.3450100103
Manning, J. A., and Goldberg, C. S. (2010). Estimating population size using capture-recapture encounter histories created from point-coordinate locations of animals. Methods Ecol. Evol. 1, 389–397. doi: 10.1111/j.2041-210X.2010.00041.x
Marquet, P. A., Allen, A. P., Brown, J. H., Dunne, J. A., Enquist, B. J., Gillooly, J. F., et al. (2014). On theory in ecology. Bioscience 64, 701–710. doi: 10.1093/biosci/biu098
Maunder, M. N., and Punt, A. E. (2013). A review of integrated analysis in fisheries stock assessment. Fish. Res. 142, 61–74. doi: 10.1016/j.fishres.2012.07.025
McIntyre, T. M., and Hutchings, J. A. (2003). Small-scale temporal and spatial variation in Atlantic cod (Gadus morhua) life history. Can. J. Fish. Aquatic Sci. 60, 1111–1121. doi: 10.1139/f03-090
Nilsson, C., Reidy, C. A., Dynesius, M., and Revenga, C. (2005). Fragmentation and flow regulation of the world's large river systems. Science 308, 405–408. doi: 10.1126/science.1107887
Ovaskainen, O., de Knegt, H. J., and del Mar Delgado, M. (2016). Quantitative Ecology and Evolutionary Biology: Integrating Models With Data. Oxford University Press, Oxford, United Kingdom
Pacifici, K., Reich, B. J., Miller, D. A. W., Gardner, B., Stauffer, G., Singh, S., et al. (2017). Integrating multiple data sources in species distribution modelling: a framework for data fusion. Ecology 98, 840–850. doi: 10.1002/ecy.1710
Peng, C., Guiot, J., Wu, H., Jiang, H., and Luo, Y. (2011). Integrating models with data in ecology and paleoecology: advances towards a model-data fusion approach. Ecol. Lett. 14, 522–536. doi: 10.1111/j.1461-0248.2011.01603.x
Péron, G., and Koons, D. N. (2012). Integrated modeling of communities: parasitism, competition, and demographic synchrony in sympatric ducks. Ecology 93, 2456–2464. doi: 10.1890/11-1881.1
Rillig, M. C., Kiessling, W., Borsch, T., Gessler, A., Greenwood, A. D., Hofer, H., et al. (2015). Biodiversity research: data without theory–theory without data. Front. Ecol. Evol. 3:20. doi: 10.3389/fevo.2015.00020
Schaub, M., Gimenez, O., Sierro, A., and Arlettaz, R. (2007). Use of integrated modeling to enhance estimates of population dynamics obtained from limited data. Conserv. Biol. 21, 945–955. doi: 10.1111/j.1523-1739.2007.00743.x
Scheiner, S. M., and Willig, M. R. (eds.).(2011). The theory of ecology. The University of Chicago Press, Chicago, United States.
Tredennick, A. T., Hooten, M. V., and Adler, P. B. (2017). Do we need demographic data to forecast plant population dynamics? Methods Ecol. Evol. 8, 541–551. doi: 10.1111/2041-210X.12686
Yen, J. D. L., Bond, N. R., Shenton, W., Spring, D. A., and Mac Nally, R. (2013). Identifying effective water-management strategies in variable climates using population dynamics models. J. Appl. Ecol. 50, 691–701. doi: 10.1111/1365-2664.12074
Keywords: Bayesian statistics, ecological modeling, population ecology, community ecology, ecological dynamics, integrated models, inverse models, individual based model
Citation: Yen JDL, Tonkin Z, Lyon J, Koster W, Kitchingman A, Stamation K and Vesk PA (2019) Integrating Multiple Data Types to Connect Ecological Theory and Data Among Levels. Front. Ecol. Evol. 7:95. doi: 10.3389/fevo.2019.00095
Received: 01 October 2018; Accepted: 11 March 2019;
Published: 03 April 2019.
Edited by:
Diego Barneche, University of Exeter, United KingdomReviewed by:
Rob Salguero-Gomez, University of Queensland, AustraliaJoey Bernhardt, University of British Columbia, Canada
Copyright © 2019 Yen, Tonkin, Lyon, Koster, Kitchingman, Stamation and Vesk. This is an open-access article distributed under the terms of the Creative Commons Attribution License (CC BY). The use, distribution or reproduction in other forums is permitted, provided the original author(s) and the copyright owner(s) are credited and that the original publication in this journal is cited, in accordance with accepted academic practice. No use, distribution or reproduction is permitted which does not comply with these terms.
*Correspondence: Jian D. L. Yen, jdl.yen@gmail.com