How Does eDNA Compare to Traditional Trapping? Detecting Mosquito Communities in South-African Freshwater Ponds
 Louie Krol1,2*
  Berry Van der Hoorn2
  Erin E. Gorsich3,4
  Krijn Trimbos1
  Peter M. van Bodegom1
  Maarten Schrama1,2
- 1Institute of Environmental Sciences, Leiden University, Leiden, Netherlands
- 2Naturalis Biodiversity Center, Leiden, Netherlands
- 3The Zeeman Institute for Systems Biology and Infectious Disease Epidemiology Research, University of Warwick, Coventry, United Kingdom
- 4School of Life Sciences, University of Warwick, Coventry, United Kingdom
Improved biomonitoring of mosquitoes requires an in-depth understanding on occurrences of both vector and non-vector species, in larval, and adult stages. Accurate descriptions of the ecological context in which mosquitoes thrive remain limited, particularly for larval stages. The aim of this study was to develop a mixed-amplicon eDNA approach to assess (i) whether mosquito larval communities of stagnant fresh-water bodies can be detected using a Culicidae-specific primer and (ii) how these results compare to traditional trapping of adult mosquitoes. Results from 32 ponds inside and outside Kruger National Park, South Africa show that our primer detected mosquito eDNA. However, it yielded only a subset of the species found using adult trapping methods. Particularly the less frequent and container-breeding species were not found. Our approach provides the first steps toward an eDNA-based method to assess the entire community of larval-stage mosquitoes. It may thereby overcome current taxonomic hurdles presented by morphological identification of larvae. As such, it holds great promise for biomonitoring and ecological studies of mosquitoes.
Introduction
Mosquitoes (order: Diptera, family: Culicidae) are known vectors for a wide variety of pathogens. The mosquito community composition is influenced by myriad of biotic and abiotic factors (e.g., resource availability, predation, temperature) that operate mostly at a local scale (Washburn, 1995; Reiter, 2001; Chase and Knight, 2003; Lafferty, 2009; Young et al., 2017; Schrama et al., 2018; Krol et al., 2019). A more comprehensive understanding of the drivers of mosquito community composition, may facilitate better management of mosquito communities (Beketov and Liess, 2007; Stresman, 2010). However, accurate descriptions of the impacts of these drivers on mosquito community composition remain limited, particularly those regarding larval habitats, largely due to logistic, and taxonomic challenges in identifying and quantifying mosquitoes (Cardoso et al., 2011; Ferraguti et al., 2016; Hunt et al., 2017).
A mixed amplicon metagenomics approach based on environmental DNA (eDNA) potentially allows for the simultaneous, DNA-based identification of an entire species community (Taberlet et al., 2012), using species-specific traces of DNA (derived from feces, urine, hair, skin, or other cells). These traces can be extracted from various environments (e.g., water, air, soil) (Ficetola et al., 2008) and selected regions of these traces can be amplified using primers that bind to a well-known region on the genome. For animals, a standardized fragment of the mitochondrial cytochrome c oxidase 1 (CO1) is typically used for DNA-barcoding (Hebert et al., 2003). These, amplicons are then linked to known taxa, using a DNA barcoding reference database. A metagenomics approach to study entire mosquito communities would constitute a potentially powerful method to characterize mosquito communities and supplement traditional sampling approaches for determining larval communities.
Two aspects of the mosquito life history render them an ideal species group to develop an eDNA approach. First, mosquito larvae generally occur in high abundances (Hoekman et al., 2016). These high abundances likely increase the local amount of eDNA which increases the detection probability (Elbrecht et al., 2017). Second, the aquatic environment is required by mosquitoes to deposit eggs, for larvae to hatch and grow, and adults to emerge. For the vast majority of mosquito species, all pre-adult life stages are concentrated at the water surface, including adult emergence (Rejmánková et al., 2013). As a result, most eDNA is likely to be present in the upper part of the water column and the periphery of a given water body, an area that is generally most accessible for sampling. A previous study demonstrated that eDNA methods could detect invasive Aedes species in freshwater (Schneider et al., 2016). However, this study was limited to the detection of invasive Aedes species using a specific-primer targeting the 16S region, for which comprehensive species databases are currently non-existing. Moreover, in the same study, eDNA samples were isolated from small (and relatively clean) container habitats (Schneider et al., 2016), thus begging the question whether the method would also be applicable in larger, turbid environment of temporary ponds, or streams with a more complex community. Given that these challenges exist, it remains unknown if an eDNA approach can also be used to detect entire communities of mosquitoes and differences therein.
The aim of this study was therefore (i) to test if we were able to pick up the mosquito community composition of stagnant fresh-water bodies using a customized local barcode database and a tailored family-specific mosquito eDNA primer on CO1, and (ii) to assess how our eDNA results relate to adult trapping methods. To this end, a field study was conducted, inside Kruger National Park (KNP), South-Africa, and in the fringing rural communities, by sampling both eDNA as well as adult mosquitoes in the same water body.
Materials and Methods
Setup of the Field Study
A field study was conducted between 18 March and 10 May 2017 in and alongside Kruger National Park, South-Africa, at five locations (Figure 1). We sampled four paired locations (Punda Maria, Satara, Skukuza, and Malelane), each with one location inside the park (hereafter “inside”) and one location outside the park (hereafter “outside”), and an additional unpaired location inside the park (Shingwedzi). Locations inside the park have far lower population densities of people and livestock and therefore differ in the degree of anthropogenic impact on the ecosystem, including the freshwater habitat (du Toit et al., 2003). At each location, we sampled three to four stagnant water bodies (depending on availability for adequate sampling; Table S1), which served as biological replicates. As a result, a total of 32 water bodies were sampled. Using a variety of trapping methods at 32 trapping sites across 4 regions, we trapped 3,918 adult female mosquitoes belonging to 43 species; Table S1). For more information about the adult trapping methodology at these water bodies, see Electronic Appendix S1 and a detailed description in Gorsich et al. (2019). Our eDNA approach assessed the larval community in a single discrete water body at a single point in time whereas the adult trapping method assessed the adult community around a given water body during multiple trapping nights.
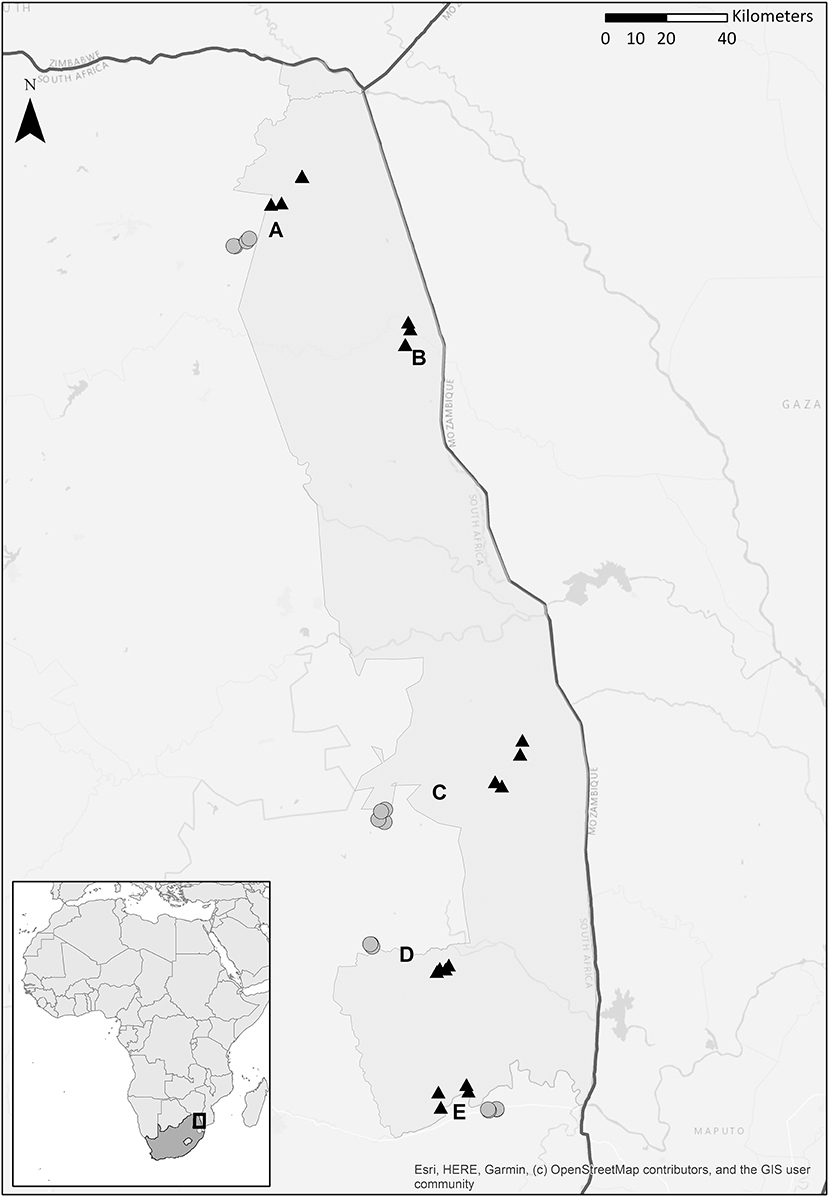
Figure 1. Map depicting four paired locations [Punda Maria (A), Malelane (C), Skukuza (D), and Satara (E)] and a single unpaired location [Shingwedzi (B)], each location has three or four stagnant water bodies. Five locations were situated inside Kruger National Park, South Africa (natural area, depicted with a black triangle); four were situated in the fringing rural communities (rural communities, depicted with a gray dot). See Table S1 for the coordinates. Courtesy of Maarten van't Zelfde.
eDNA Field Sample Collection
A known challenge with eDNA sampling is that eDNA is not homogenously distributed (Turner et al., 2014). To improve the probability of detection, 30 subsamples per water body, each of 25 mL, were collected with a pipet controller (Integra Bioscience), and pooled into a 750 mL bottle. Each subsample was taken from the upper (0–5 cm) water layer along the shore line, approximately two meters apart. These were immediately stored in a cooling box, transferred to a fridge, and stored at 4°C until filtration within 24-h. The effects of using this method of initial eDNA preservation might have reduced the detection probability (Barnes et al., 2014). However, these effects have not been investigated in this study.
In the lab, eDNA was collected using a 250 mL Sartorius filtering tower (Sartorius-stedim), a mobile vacuum pomp (Datura Molecular Solutions), and 0.22-micron polyethersulfone (PES) filters (250 mL per filter, i.e., three filters per water body), with a diameter of 47 mm (Tisch Scientific) (Turner et al., 2014). To prevent cross-contamination, the Sartorius filtering tower was cleaned between water bodies with bottled water (to remove sand particles) and then soaked for 30 min in a 0.9% bleach solution to degrade remaining DNA. Prior to filtration of field samples, bottled water was used as a negative control to test for cross-contamination. After filtration, the filter was immediately placed in separate 2 mL centrifuge tubes and completely immersed in 900 μL Longmire buffer (100 mM Tris, 100 mM EDTA, 10 mM NaCl, 0.5% SDS, 0.2% sodium azide; Williams et al., 2016) and stored at 4°C in a fridge until DNA extraction. The advantage of Longmire buffer above CTAB buffer is that it preserves DNA at room temperature for at least 2 weeks (Renshaw et al., 2015).
eDNA Extraction
For the extraction and purification of DNA from the field samples, an established phenol-chloroform-isoamylalcohol (PCI) protocol for DNA extraction was used followed by a DNA purification step using the Qiagen DNeasy blood and tissue kit (Renshaw et al., 2015). Unfortunately, this method did not remove all PCR inhibitors, which may have negatively impacted the following steps. We considered dilution of the sample undesirable (this would negatively impact the detection probability of less abundant species), and therefore used the OneStep-96TM PCR inhibitor removal kit (Zymo Research) to remove remaining humic acids and other PCR-inhibitors. For the PCI protocol, the stored PES-filters containing the eDNA were incubated for 10 min at 65°C. After this, 900 μL phenol-chloroform-isoamylalcohol (PCI, 25:24:1) was added and vortexed until the PES-filter was completely disintegrated. The 2 mL tubes containing the disintegrated PES-filters were centrifuged at 15,000 × g for 5 min and 700 μL of the aqueous layer was transferred to a fresh 2 mL centrifuge tube. To this mixture, 700 μL chloroform-isoamylalcohol (CI, 24:1) was added, vortexed for 10 s, centrifuged at 15,000 × g for 5 min and 500 μL of the aqueous layer was transferred to a fresh 2 mL centrifuge tube. To this tube, 1.25 mL of ice-cold 96% ethanol and 20 μL 5M NaCl was added and precipitated for 20 min at −20°C, centrifuged at 15,000 × g for 10 min and liquid was decanted. Pellets were left to air-dry until no visible liquid remained (Laramie et al., 2015; Renshaw et al., 2015; Williams et al., 2016). This pellet was resuspended in 180 μL ATL-buffer and DNA extraction was continued with the DNeasy Blood & Tissue kit (Qiagen), for DNA purification, using the manufacture protocol. DNA was finally eluted in 200 μL AE-buffer. From this, 100 μL was transferred to OneStep-96TM PCR inhibitor removal kit plates (Zymo Research). Inhibitors were removed following the protocol of the manufacturer. Samples belonging to the same water body were combined, which made a total of 32 eDNA-samples. The DNA quality and quantity of the eDNA mix-plates were measured with a DropSense96 (Trinean) spectrophotometer.
Construction of a Mosquito DNA Reference Database
For most mosquito species, reference sequences are not available. For example, of the 3,725 species of Culicidae known globally, barcodes are only available for 1,078 species (29%) in the barcoding of life database (BOLD) of which only 716 (19%) are in the public domain (database accessed 12-09-2017). For South Africa, a similar picture arises: 168 species are known within the subfamily Culicinae in South Africa for which only 45 species (26%) have publicly available sequences on BOLD (database accessed 31-08-2018, Figure S1). Therefore, during the field survey (Electronic Appendix S1), we collected 95 adult mosquito specimens from 38 taxa (Table S2) for DNA-barcoding. These morphologically identified specimens were used to construct a customized DNA reference database for the CO1 region, which reduces the probability of non-and misidentification, due to a lack of reference material (Virgilio et al., 2010). DNA extractions on all adult mosquito specimens were performed with the DNeasy Blood & Tissue kit (Qiagen), using the protocol provided by the manufacturer. An 840 bp fragment of the mitochondrial cytochrome c oxidase 1 (CO1) region was amplified using the primers LCO-1490 (forward) (Folmer et al., 1994) and R-COI650 (reverse) (Hemmerter et al., 2007). The reaction mix contained 3 μL 10x CoralLoad PCR-buffer (Qiagen), 0.5 μL 25 mM MgCl2 (Qiagen), 1 μL 10 mg/mL BSA (Life), 0.5 μL 2.5 mM dNTP (Qiagen), 0.25 μL 5U TaqPol (Qiagen), 1 μL of 10 pMol/μL of each primer, 5 μL template DNA and 17.75 μL MQ (Ultrapure). The PCR was performed using a Bio-Rad C1000 thermocycler (Bio-Rad Laboratories) the amplification protocol was as follows: 94°C for 3 min, 45 cycles of 94°C for 30 s, 49°C for 45 s and 72°C for 45 s, then finally 72°C for 5 min (Batovska et al., 2016). After PCR, all reactions were visually assessed with an 2% electrophoresis agarose gel, stained with ethidium bromide. The amplicons were sequenced with Sanger sequencing at BaseClear (Leiden, the Netherlands), reads were assembled and annotated with Geneious, version R10 (Kearse et al., 2012).
eDNA Mosquito Specific Primer Design
A mosquito specific environmental DNA primer was designed for the CO1 region, based upon the sequences obtained during this study as well-upon all Culicidae species in BOLD and GenBank which were batch-downloaded (downloaded at 25-06-2017), and clustered into operational taxonomic units (OTUs) with PrimerMiner (Elbrecht and Leese, 2015, 2017a). Other genomic regions were also considered [e.g., CAD, ITS (Reidenbach et al., 2009; Batovska, 2016)]. However, we decided the use CO1 since most species barcodes are collected for the CO1 region. First, multiple degenerated primers were obtained and tested in-silico on the all compiled sequences using the Primer3 plug-in for Geneious, version R10 (Rozen and Skaletsky, 1999; Kearse et al., 2012). We selected the optimal primer pair based upon three criteria; primer efficacy, taxonomic resolution, and amplicon size (where smaller amplicons were preferred over larger amplicons because of their higher abundance). For the optimal pair: eCul-F, 5′GGRKCHGGDACWGGDTGAAC-3′ (forward) and eCul-R, 5′-GATCAWACAAATAAAGGTAWTCGATC-3′ (reverse), (hereafter “eCul primers”), 92% (1,050 of 1,135) of OTUs could be picked up, with a taxonomic resolution similar to the taxonomic resolution of the entire CO1 barcoding region, and an amplicon size of 200 bp. Upon primer sequence removal, a barcode of 154 bp remains. We did not further optimize the sequences of the primer.
In-situ and in-vitro Primer Evaluation and eDNA Sample PCR Processing
The BF1 and BR1 CO1 general freshwater metabarcoding primers (hereafter, BF primers; Elbrecht and Leese, 2017b) were included as a control for primer evaluation. All three primer pairs, i.e., the barcoding primer pair LCO-1490/R-COI650 and the metabarcoding primer pairs BF and eCul, were tested in-situ on the DNA of the 95 mosquito specimens representing 38 taxa (Figure 2) to assess amplification efficacy and efficiency.
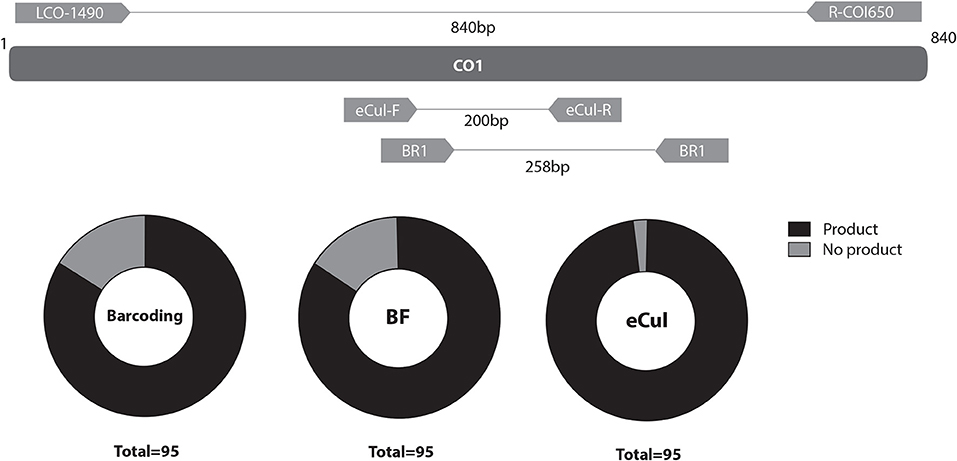
Figure 2. Topography and PCR-efficacy of LCO-1490/R-COI650, BF1/BR1 (BF) and eCul-F/eCul-R (eCul). Primer pairs BF and eCul are shown with their respective position on the CO1-region, as amplified by the LCO-1490/R-COI650 primers. Note that the BF and eCul primers span an overlapping region, highlighting that this is a highly informative region. The black part of the pie chart shows the PCR-efficacy (e.g., the ability of the PCR protocol to generate a PCR fragment), indicating that the primer is able to pick-up the specimen and corresponding species or species complexes. Courtesy of Erik-Jan Bosch.
The in-vitro primer evaluation on the 32 eDNA samples included only the eCul and the BF eDNA metabarcoding primers. The reaction mixes for both eDNA-primers contained 3μL 10x CoralLoad PCR-buffer (Qiagen), 0.5 μL 25 mM MgCl2 (Qiagen), 1 μL 10 mg/mL BSA (Life), 0.5 μL 2.5 mM dNTP (Qiagen), 0.25 μL 5 U TaqPol (Qiagen), 1 μL of 10 pMol/μL of each primer, 3 μL template DNA and 17.75 μL MQ (Ultrapure). The PCR was performed using a Bio-Rad C1000 thermocycler (Bio-Rad Laboratories). The amplification protocol for the BF primers was as follows: 94°C for 3 min, 45 cycles of 94°C for 30 s, 41°C for 30 s, and 72°C for 20 s, then finally 72°C for 5 min. The amplification protocol for the eCul primers was as follows: 94°C for 3 min, 45 cycles of 94°C for 30 s, 60°C for 30 s, and 72°C for 20 s, then finally 72°C for 5 min. Per sample, a single replicate was used. After PCR, all reactions were visually assessed with an 2% electrophoresis agarose gel, stained with ethidium bromide. PCR-efficacy was assessed by presence-absence of a signal and PCR-efficiency was estimated based upon the relative signal intensity. All extraction and amplification negative controls were negative, indicating that there was no cross contamination.
Next-Generation Sequencing
Library preparation was performed with the NEBNext Fast DNA Library Prep Set for Ion Torrent (New England Biolabs) using only half of the described reaction volume. Amplicon concentration was assessed with capillary electrophoresis using the Qiaxcel (Qiagen) and concentration equalization was performed with the Qiagility pipetting robot (Qiagen). Subsequent analysis was done conform the IonPGM Hi-Q handbook with the Ion OneTouch2 (Life Technologies, Guilford, CT, USA) and BioAnalyzer (Agilent). The eDNA amplicons were sequenced on an Ion-Torrrent Personal Genome Machine (Life Technologies, Guilford, CT, USA) with an Ion 218C chip, at Naturalis Biodiversity Center (Leiden, the Netherlands). The output in FASTQ-format was processed using the Galaxy platform, on the Naturalis Galaxy instance (Blankenberg et al., 2010; Afgan et al., 2016). Initial assessment of the NGS data was performed with the PRINSEQ algorithm (Schmieder and Edwards, 2011). Sequences with a phred-score <20 on the 3′side of the sequence were removed. Only reads that contained both the forward and reverse primer, and those that had a minimal length of 200 bp for the eCuL-primers and 258 bp for the BF-primers, were used for further analysis. The primer sequences were not removed. Operational taxonomic units (OTUs) were generated using the VSEARCH algorithm (threshold: 97% similarity; minimal 2 reads) (Rognes et al., 2016). Only OTUs with >10 reads were used for further analysis. The sequences were queried with the BLAST-tool (Camacho et al., 2009) using the megablast algorithm, against the local copies of BOLD, NCBI/GenBank (downloaded at 14-02-2018) and our custom Culicidae KNP reference database, with a maximum e-value of 0.05, a minimum hit coverage of 80%, a minimum sequence identity of 80% and a maximum of 100 hits per sequences per database. We determined the lowest common ancestor from these BLAST-output files by clustering all hits with a bit-score differences lower than 8% from the best hit. All hits above a threshold for minimum hit coverage of 80% and a minimum sequence identity of 97% were described as a best hit. All LCA-output files were merged with OTU-tables and compared using MS Excel (version 16.14.1, for Macintosh). To test the identification accuracy, a phylogenetic analysis was performed on all OTUs that could be identified to family level (Figure S2), where accuracy implied that OTUs belonging to the same family, cluster together. Sequences were aligned by performing multiple sequence alignments, using the MAFFT v.7.222 plug-in for Geneious, version R10 (Katoh et al., 2002; Kearse et al., 2012) with a maximum of 1,000 iterations. The alignment was exported as a Nexus-file to Mesquite (Maddison and Maddison, 2018; Mesquite: a modular system for evolutionary analysis.V.3.31) and exported to the CIPRES science gateway v.3.3 (Miller et al., 2010) as a MrBayes Nexus-input file and run with MrBayes 3.2.2 on XSEDE (Huelsenbeck and Ronquist, 2001; Ronquist and Huelsenbeck, 2003) with the following parameters: (lset nst = 6 rates = invgamma; unlink, statefreq = (all), revmat = (all), shape = (all), pinvar = (all); prset, applyto = (all), ratepr = variable; mcmcp, ngen = 100000000, relburnin = yes, burninfrac = 0.25 printfreq = 1000, samplefreq = 1000, nchains = 4, savebrlens = yes). Posterior summarization and quality control was performed using Tracer V1.7.1 (Rambaut et al., 2018). Cladograms were visualized and annotated with FigTree v1.4.3 (Rambaut, 2012).
Data Analysis
To compare the results of our eDNA approach with those from adult trapping, first we investigated the taxonomic resolution and accuracy of our morphologically and DNA-based species identification and how these relate. Second, we normalized the different measures of abundance (e.g., reads for eDNA vs. number of observations for adult trapping) for comparison of the different methods.
For the first step, we assessed the morphological identification accuracy and validated the reference database by querying all sequences with the BLAST-tool (Camacho et al., 2009). The megablast algorithm was used against the local copies of BOLD and NCBI/GenBank (downloaded at 14-02-2018) on the Galaxy platform (Blankenberg et al., 2010; Afgan et al., 2016), with a maximum e-value of 0.05, a minimum hit coverage of 70% and sequence identity of more than 97%. To assess if the eCul and BF primers were able to pick up all different taxa present in the reference database, an in-silico test was performed. The theoretical amplicons were extracted with Geneious, version R10 (Rozen and Skaletsky, 1999; Kearse et al., 2012) and an in-silico mock-community was constructed. This mock-community was analyzed in the same way as the real NGS data to assess the taxonomic resolution of our approach, which facilitated a comparison between both approaches by harmonizing the taxonomic resolution (Table S3).
For the second step, for both approaches and both primers (eCul and BF), presence-absence matrices were constructed, by transforming abundance data (number of reads or number of observations) to binary data (e.g., present 1 or absent 0). Both approaches and both primers were then compared with a Bray-Curtis similarity matrix. This also allowed comparing between the locations inside Kruger National Park and the locations in the fringing communities. For each location, the proportion of species found in the adult trapping that also was found with either primer was determined and plotted against the Bray-Curtis similarity results. The resulting graph (Figure 4) gives an indication of how the two approaches relate.
To visualize the detection probability (Figure 5), we calculated the average relative abundance (according to adult trapping) for each of the species and plotted this against the number of locations where we observed the corresponding larval stage. Using this method, we investigated the detection probability based on adult abundance and visualized potential insufficient sequencing depth. This graph mimics the theoretical abundance of template DNA during sequencing. To test for insufficient sequencing depth (e.g., the ability to detect the less abundant templates), a rarefaction analysis (Heck et al., 1975) of the sequencing data was performed, including only OTUs that were identified as Culicidae according to both the eCul and BF sequencing data (Figure S3).
Data analysis was conducted with RStudio (R version 3.2.1; R Core Team, 2016) using the Vegan package (Philip, 2009) and graphed using GraphPad Prism (version 7.00 for Macintosh), GraphPad Software, San Diego California USA.
Results
Primer Evaluation and Comparison
h In general, the eCul primer pair performed better than the BF and LCO primer pairs. The in-silico primer evaluation of the eCul and BF primers indicated that the taxonomic coverage (i.e., the proportion of species amplified of the target group) and taxonomic discrimination (i.e., the discrimination capacity at the species, genus or family level) were similar to the complete CO1 barcoding region. The adult mosquito specimens (n = 87) represented 38 taxa (Table S2). Our in-silico test based on the CO1 barcoding data also generated 38 OTUs. However, these OTUs do not always correspond to the level of species, either because of a lack of morphological differentiation between closely related species or because DNA was not informative enough to distinguish between species (Table S3).
The in-situ primer validation of the eCul primers showed the highest PCR-efficacy (97.9%) and efficiency in comparison with the LCO-1490/R-COI650 and BF primers (Figure 2). The LCO-1490/R-COI650 and BF primers generated a similar distribution in PCR-efficacy (84.2%) (Table S2). However, the signal intensity of the fragments on the gel was weak, indicating that the PCR-efficiency of the BF primers for mosquitoes was overall low, which is in line with previous results (Elbrecht and Leese, 2017b). The eCul and BF-primers are topographically overlapping (Figure 2), indicating that this region of CO1 is highly informative. The in-vitro primer evaluation showed that the eCul primers picked up more OTUs (expressed in number of reads) belonging to the order of Diptera (47.5%) when compared to the BF primers (3.6%) (Figure 3). Besides Diptera, the eCul primers also picked up a number of other taxa within the phylum Arthropoda, most notably Podocopida (26.9%) and Diplostraca (11.6%). Within the Diptera, the eCul primers picked up mainly OTUs belonging to families within the infraorder Culicomorpha of which Chironomidae (35.6%) was the most abundant family and Culicidae the second most abundant family (33.3%). In addition, a substantial proportion of the OTUs within the order Diptera (18.7%) could not be linked to any known family. The BF primers picked up taxa from a much wider taxonomic range, including the orders Cyclopoida (34.5%) and Cryptomonadales (22.4%) and taxa belonging to the kingdoms Fungi (0.7%) and Viridiplantae (1%). Within the Diptera, the BF primer pair picked up mainly OTUs belonging to the Culicidae family (98%), most of which were identified as belonging to the genera Culex (70%) and the remainder as Anopheles (30%).
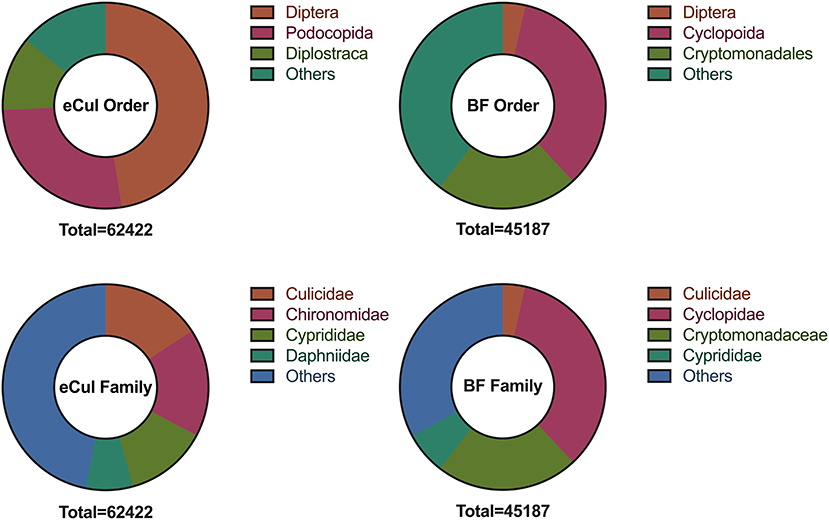
Figure 3. Taxonomic range as picked-up by the BF1/BR1 (BF) eCul-F/eCul-R (eCul) primers, from the eDNA field samples, expressed in number of reads (total number of reads below each pie chart). Note that the number of reads represents the post-PCR distribution, and not the taxa abundance. The BF primers picked up a wide range of unrelated taxa, whereas the eCul primers picked up a narrow range of related taxa, most of which belonged to families within the infraorder Culicomorpha (order: Diptera).
Comparison Between Adult Trapping and eDNA Sampling
In general, the eCul primer pair performed better than the BF primers, although overall similarity between the two approaches was low. Using adult mosquito trapping, 38 mosquito taxa (species and species complexes) were identified in the field. This number of adult taxa was reduced to 25 with species complexes (Table S3). Using eDNA, 34 mosquito OTUs (representing six taxa) were picked-up with the eCul primers, and 10 mosquito OTUs (representing two taxa) were picked-up with the BF primers. A phylogenetic analysis of all sequences indicated that the assigned identities were correct for both the eCul as the BF data (Figure S2). Our results show an OTU overlap of 28% between the eCul data and adult trapping and 4% with the BF data. The eCul primers were able to pick up more than 50% of the species detected with traps at two locations Satara (SatOut; 50%) and Shingwedzi (ShiIn; 67%), and at two locations the similarity was larger than 0.5 (Figure 4): Punda Maria (PunIn; 0.53) and Shingwedzi (ShiIn; 0.53). The BF primers were unable to recover more than 20% of the species detected with traps. The species that were detected with eDNA were generally also the most abundant species complexes in the traps (Culex pipiens species complex and Culex poicilipes species complex; Table S3), indicating that the eDNA method was more likely to pick up more abundant and common (found at more locations) species than rare species (Figure 5). Moreover, we observed a consistent dissimilarity between mosquito communities inside and outside the park for both sampling techniques, thus providing a first indication that an eDNA approach can be used to detect a shift in mosquito communities [average dissimilarity eDNA (eCul primer): 0.54 (± SE 0.04) vs. average dissimilarity adult trapping: 0.34 (± SE 0.11)]. The rarefaction analysis indicated a lack of sequencing depth for both the eCul and the BF sequencing data (Figure S3).
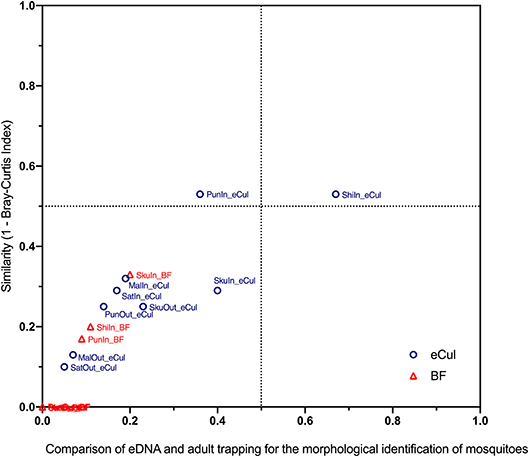
Figure 4. Comparison of eDNA and adult trapping for the morphological identification of mosquitoes. Community similarity between adult trapping and eDNA (expressed as the distance in the Bray Curtis-index) was plotted against the proportion of species that were observed with the eCul or BF primers. In general, the eCul primers performed better than the BF primers, however overall similarity between the two approaches was low.
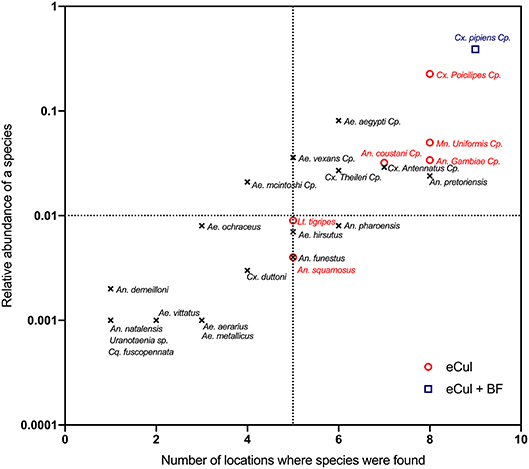
Figure 5. Relationship between the relative species abundance (using eDNA) and the number of locations where these species were found (using adult trapping). Names in red indicate species that were found using both the eCul primer and adult trapping, blue species names indicate those that were detected by eCul and BF primers and adult trapping, black species names indicate species that were only detected using adult trapping. eDNA results always represent a subset of the adult populations. Specimens that could not be identified morphologically to species level were clustered into species complexes, indicated with “Cp”.
Discussion
In this study we developed an eDNA approach based on a family specific primer and a local CO1 DNA reference database that was able to detect the most abundant species observed with traditional trapping methods. Even so, the eDNA method yielded a much smaller number of species than the adult trapping, which has implications for data interpretation and future work. We elaborate on these challenges in the following paragraphs.
Primer Evaluation and Primer Comparison
In this study, presence of mosquito eDNA in South African ponds was detected using the general macroinvertebrate BF1 primers from Elbrecht and Leese (2017b) and a novel eCul mosquito primer. In contrast to other aquatic macroinvertebrate species, like Odonata (unpublished data), the eDNA assessment of mosquito species proved rather successful, which is likely a result of the particular lifestyle of mosquitoes. Mosquito eDNA concentration in the upper layer of the water may be higher than that of most other freshwater macroinvertebrates, because mosquitoes generally occur in high densities, spend a significant part of their life cycle close to the water surface (where eDNA samples are taken) and produce exuviae at the water surface before emerging as an adult mosquito. For example dragonflies and water beetles are generally less numerous and do not emerge at the water surface (Foster and Soluk, 2004; Jäch and Balke, 2008) and may therefore be more difficult to detect. The detection probability of our eCul primer was higher than when using the general BF primers for freshwater invertebrate taxa (Elbrecht and Leese, 2017b). This result highlights that the use of taxa-specific primers with a narrow taxonomic range greatly improves the probability of detection, and in general aligns with the idea that a primer needs to be suited to a question (Elbrecht and Leese, 2017b). However, not all OTUs could be identified to the species level, either because of shortcomings in the morphological or molecular identification process. The morphological issues were mostly restricted to a number of complexes within the genus Anopheles (e.g., An. coustani s.l., An. gambiae s.l.) which is a well-known problem (Gillies and Coetzee, 1987) and is normally resolved using PCR-based identification (Fanello et al., 2002). Challenges regarding the molecular identification were found for a number of species complexes within the genera Culex and Aedes (Table S3), which indicates that, by itself, the CO1 barcoding region might not be informative enough to differentiate between closely related species within these complexes. One way to overcome this issue in future studies is by targeting more than one regions on the mosquito mitochondrial genome [e.g., CAD, ITS, 16S (White et al., 1990; Reidenbach et al., 2009; Batovska, 2016; Schneider et al., 2016)]. Nevertheless, our results provide a proof-of-principle that eDNA-based methods hold great promise when it comes to using it for the detection of mosquito species communities across a range of freshwater habitats.
Comparison Between Adult Trapping and eDNA
Our eDNA approach provided only a subset of the species found when using traditional trapping methods and identification on morphology, with an overall moderate similarity between the two approaches. Particularly species with lower abundance were not readily retrieved using the eDNA method. Results of both adult trapping and eDNA methods indicate that the mosquito community composition differs between locations inside and outside Kruger National park—which may be related to the environmental differences resulting from the higher population densities outside compared to inside the park. In our study, the eDNA-based estimation of the community resulted in a greater dissimilarity between inside and outside locations compared to adult trapping. Possibly, this is due to missing the rarer species that occur both inside and outside Kruger National Park.
There are four main explanations why the community similarity between the two approaches differ. First, there is a possibility that the eDNA based approach did detect the majority of the mosquito species in the sampled water bodies, considering that our eDNA approach assesses the larval community inside a discrete water body whereas the adult trapping method assesses the adult community around a given water body. This suggests that the difference in community composition between eDNA and traps may partly be the result of adult mosquitoes being lured toward the traps from nearby breeding sites (e.g., nearby tires, buckets, and other artificial habitats). This view is strengthened by the absence of Ae. aegypti in the eDNA dataset, which was abundantly present in the adult traps (Figure 5). This species is known to breed almost exclusively in artificial habitats like plastic containers and car tires (Simard et al., 2005). Although this may partly explain the difference between the methods, there is no direct way to test this hypothesis, because mosquito larval communities were not sampled directly. Setting up controlled experiments with mixtures of species with varying abundance will likely resolve this issue.
Second, our sampling strategy might not be sufficient (30 spatially distributes subsamples of 25 mL per water body), decreasing the probability of detection, since it is known that eDNA is heterogeneously distributed (Nathan et al., 2014). Setting up experiments with more subsamples that are not mixed will likely resolve this issue.
Third, the effects of PCR-induced biases (e.g., sequencing depth and primer bias) can decrease the probability of detection (Elbrecht and Leese, 2015, 2017b), particularly for species with a relatively low abundance (Elbrecht et al., 2017). Indeed, our eDNA results suggest that our results may be suffering from a lack of sequencing depth (Figure S3). An inadequate sequencing depth can be one of the causes of missed species because highly abundant reads of non-target species might mask low-abundance sequences (Adams et al., 2013). Species belonging to more abundant genera, like Culex and Mansonia were readily detected whereas species belonging to less abundant genera like Aedes and Anopheles were less likely to be picked up (Figure 5). This picture was even more striking for the general freshwater macroinvertebrate BF primer, which picked up only Culex species belonging to the Culex pipiens species complex (Figure 5) with a very high adult abundance. These results therefore suggest that insufficient sequencing depth (Figure S3) might have reduced the probability of detection of less abundant species. Also, our results might suffer from the effects of overamplification and stochastic effects inherent to mixed amplicon PCR. The effects of overamplification can be mitigated by reducing the number of cycles and the stochastic effects by increasing the number of replicates from one to twelve. If the controlled experiments proposed above indeed show that we are missing the less abundant species, future work should address this gap by adopting methods that produce higher number of reads or by masking highly abundant species.
The effects of PCR induced biases (Elbrecht and Leese, 2015, 2017b) and PCR inhibitors [which environmental samples often contain (Jane et al., 2015)] were not assessed during this study. It is known that such biases and inhibitors may negatively affect the probability of detection, particularly for species with a relatively low abundance and/or biomass (Elbrecht and Leese, 2015; Elbrecht et al., 2017). This is further complicated by the unknown persistence of mosquito eDNA under a range of ecological conditions [e.g., biotic and abiotic degradation (Barnes et al., 2014; Strickler et al., 2015)] in a system where eDNA is spatially heterogeneously distributed (Nathan et al., 2014).
More work is therefore required to link the original amount of template DNA (pre-PCR) and the distribution of reads (post-PCR). The relative abundance of template DNA has to be included, for the use of more comprehensive indices of diversity. Current quantification methods (e.g., qPCR and ddPCR) are unsuitable for mixed amplicon metagenomic approaches (Doi et al., 2015). Fusion primers tagged with unique molecular identifiers (UMIs) (Kivioja et al., 2012) may provide the tools needed to address the effects of primer bias and PCR inhibition in eDNA and metabarcoding samples.
Fourth, the limited availability of a comprehensive and reliable reference database might reduce the detection probability. Accurate species-level identification of mosquitoes can be difficult, often leading to low taxonomic resolution, or misidentifications (Haase et al., 2010). This in turn decreases the accuracy of DNA-based approaches. During this study, not all adult mosquito specimens could be identified to species level (Table S2) and were clustered into species complexes (Table S3). The in-silico test to assess if all taxa present in the mock-community could be picked-up, yielded 38 OTUs, although not all 38 taxa could be identified. This might be due to insufficient taxonomic resolution of the CO1 target region or misidentification of the adult specimen (Table S2). There is likely room for improvement because it is unlikely that all cryptic species were included in our reference library. Furthermore, the underlying classification and phylogenic relationship of mosquitoes remains largely unresolved (Harbach, 2007; Reidenbach et al., 2009; Wilkerson et al., 2015). This highlights the need for taxonomic expertise to properly describe species based upon morphological and molecular evidence (Chan et al., 2014). More work is therefore needed to resolve the underlying classification and phylogeny of mosquitoes, in order to construct a comprehensive and reliable reference database.
Nevertheless, despite the unknowns listed above, the eDNA method detected the most abundant species, thus indicating its potential value in addition to the traditional sampling techniques, and, as such, provide a meaningful addition to the existing tool kit.
Concluding Remarks
This is the first study that applies an eDNA approach to determine the community composition of mosquitoes, based on water samples collected in the field. As such, it provides a proof-of-concept that eDNA-based methods can be used to better understand mosquito larval ecology and provides promising steps toward an eDNA-based biomonitoring of mosquito species communities. The comparison between adult and larval communities shows that less abundant adult species were not detected using our metabarcoding method. More research is needed to evaluate whether this mismatch is due to an overrepresentation of species from other nearby breeding sites or due to an incomplete eDNA-based survey. To improve differentiation between closely related species, eDNA-based surveys of the complete mosquito community require the identification of an additional informative region(s) on the mosquito genome [e.g., CAD, ITS or 16S (Reidenbach et al., 2009; Batovska, 2016; Schneider et al., 2016)]. Nevertheless, our results highlight that environmental DNA holds the potential to assess the larval community composition of mosquitoes quickly and reliably, provided that (i) samples are taken in accordance with the ecological context (i.e., life history traits), and (ii) a comprehensive and reliable local reference database and suitable primers are available. On the short term, given its ability to determine mosquito community composition based on larvae, eDNA is a promising complementary tool for monitoring species communities alongside existing adult and larval trapping methods.
Author Contributions
LK, PB, and MS conceived the idea for this study. LK carried out the measurements together with MS and EG. LK carried out the molecular and bioinformatics work with the help of BV. LK wrote the first draft together with MS. PB, KT, EG, and BV commented on the setup and assisted during writing of the paper.
Funding
This study was supported by the Leiden University Fund (grant L17005) to LK, the Gratama Fund (grant 2016.08) which was awarded to MS, and a grant from the Gieskes Strijbis Foundation for the DNA Waterscan project of Naturalis Biodiversity Center.
Conflict of Interest Statement
The authors declare that the research was conducted in the absence of any commercial or financial relationships that could be construed as a potential conflict of interest.
Acknowledgments
We want to thank Brianna Beechler for assisting with setting up the field study and Vicky Beckers, Nina Haver, Gijs van Nes, Karabo Moloi, Nondumiso Myataza, Skumbuzo Mdletshe, Herman Ntimane, and Thomas Mbokota for excellent help in the field. We thank Elza Duijm, Roland Butôt, Marcel Eurlings, and Ayesha Hassim for assistance in the laboratory. Scientific services and Veterinary wildlife services are gratefully acknowledged for accommodation and the permission to carry out the work at their laboratory facilities in Skukuza, KNP. Danny Govender was gratefully acknowledged for the permission to carry out this study in Kruger National Park.
Supplementary Material
The Supplementary Material for this article can be found online at: https://www.frontiersin.org/articles/10.3389/fevo.2019.00260/full#supplementary-material
References
Adams, R. I., Amend, A. S., Taylor, J. W., and Bruns, T. D. (2013). A unique signal distorts the perception of species richness and composition in high-throughput sequencing surveys of microbial communities: a case study of fungi in indoor dust. Microb. Ecol. 66, 735–741. doi: 10.1007/s00248-013-0266-4
Afgan, E., Baker, D., van den Beek, M., Blankenberg, D., Bouvier, D., Cech, M., et al. (2016). The Galaxy platform for accessible, reproducible and collaborative biomedical analyses: 2016 update. Nucleic Acids Res. 44, W3–W10. doi: 10.1093/nar/gkw343
Barnes, M. A., Turner, C. R., Jerde, C. L., Renshaw, M. A., Chadderton, W. L., and Lodge, D. M. (2014). Environmental conditions influence eDNA persistence in aquatic systems (Supplemental Information). Environ. Sci. Technol. 48, 1819–1827. doi: 10.1021/es404734p
Batovska, J. (2016). Using next-generation sequencing for DNA barcoding: capturing allelic variation in ITS2. 7, 19–29. doi: 10.1534/g3.116.036145
Batovska, J., Blacket, M. J., Brown, K., and Lynch, S. E. (2016). Molecular identification of mosquitoes (Diptera: Culicidae) in southeastern Australia. Ecol. Evol. 6, 3001–3011. doi: 10.1002/ece3.2095
Beketov, M. A., and Liess, M. (2007). Predation risk perception and food scarcity induce alterations of life-cycle traits of the mosquito Culex pipiens. Ecol. Entomol. 32, 405–410. doi: 10.1111/j.1365-2311.2007.00889.x
Blankenberg, D., Coraor, N., Ananda, G., Lazarus, R., Mangan, M., Taylor, J., et al. (2010). Galaxy: a web-based genome analysis tool for experimentalists. Curr. Protoc. Molecul. Biol. Chapter 19:Unit 19.10.1–21. doi: 10.1002/0471142727.mb1910s89
Camacho, C., Coulouris, G., Avagyan, V., Ma, N., Papadopoulos, J., Bealer, K., et al. (2009). BLAST+: architecture and applications. BMC Bioinform. 10:421. doi: 10.1186/1471-2105-10-421
Cardoso, P., Erwin, T. L., Borges, P. A. V., and New, T. R. (2011). The seven impediments in invertebrate conservation and how to overcome them. Biol. Conserv. 144, 2647–2655. doi: 10.1016/j.biocon.2011.07.024
Chan, A., Chiang, L.-P., Hapuarachchi, H., Tan, C.-H., Pang, S.-C., Lee, R., et al. (2014). DNA barcoding: complementing morphological identification of mosquito species in Singapore. Parasit. Vector. 7:569. doi: 10.1186/s13071-014-0569-4
Chase, J. M., and Knight, T. M. (2003). Drought-induced mosquito outbreaks in wetlands. Ecol. Lett. 6, 1017–1024. doi: 10.1046/j.1461-0248.2003.00533.x
Doi, H., Uchii, K., Takahara, T., Matsuhashi, S., Yamanaka, H., and Minamoto, T. (2015). Use of droplet digital PCR for estimation of fish abundance and biomass in environmental DNA surveys. PLoS ONE. 10:e0122763. doi: 10.1371/journal.pone.0122763
du Toit, J., Rogers, K., and Biggs, C. H. (2003). The Kruger Experience: Ecology and Management of Savanna Heterogeneity. Washington, DC: Island Press.
Elbrecht, V., and Leese, F. (2015). Can DNA-based ecosystem assessments quantify species abundance? Testing primer bias and biomass-sequence relationships with an innovative metabarcoding protocol. PLoS ONE 10:324. doi: 10.1371/journal.pone.0130324
Elbrecht, V., and Leese, F. (2017a). PrimerMiner: an r package for development and in silico validation of DNA metabarcoding primers. Methods Ecol. Evol. 8, 622–626. doi: 10.1111/2041-210X.12687
Elbrecht, V., and Leese, F. (2017b). Validation and development of COI metabarcoding primers for freshwater macroinvertebrate bioassessment. Front. Environ. Sci. 5:11. doi: 10.3389/fenvs.2017.00011
Elbrecht, V., Peinert, B., and Leese, F. (2017). Sorting things out: assessing effects of unequal specimen biomass on DNA metabarcoding. Ecol. Evol. 7, 6918–6926. doi: 10.1002/ece3.3192
Fanello, C., Santolamazza, F., and Della Torre, A. (2002). Simultaneous identification of species and molecular forms of the Anopheles gambiae complex by PCR-RFLP. Med. Vet. Entomol. 16, 461–464. doi: 10.1046/j.1365-2915.2002.00393.x
Ferraguti, M., Martínez-de la Puente, J., Roiz, D., Ruiz, S., Soriguer, R., and Figuerola, J. (2016). Effects of landscape anthropization on mosquito community composition and abundance. Sci. Rep. 6:29002. doi: 10.1038/srep29002
Ficetola, G. F., Miaud, C., Pompanon, F., and Taberlet, P. (2008). Species detection using environmental DNA from water samples. Biol. Lett. 4, 423–425. doi: 10.1098/rsbl.2008.0118
Folmer, O., Black, M., Hoeh, W., Lutz, R., and Vrijenhoek, R. (1994). DNA primers for amplification of mitochondrial cytochrome c oxidase subunit I from diverse metazoan invertebrates. Molecul. Mar. Biol. Biotechnol. 3, 294–299. doi: 10.1371/journal.pone.0013102
Foster, S. E., and Soluk, D. A. (2004). Evaluating exuvia collection as a management tool for the federally endangered Hine's emerald dragonfly, Somatochlora hineana Williamson (Odonata: Cordulidae). Biol. Conserv. 118, 15–20. doi: 10.1016/j.biocon.2003.06.002
Gillies, M. T., and Coetzee, M. (1987). A supplement to the Anophelinae of Africa south of the Sahara (Afrotropical Region). Publicat. South African Inst. Med. Res. 55, 1–143.
Gorsich, E. E., Beechler, B. R., Van Bodegom, P., and Govender, D. (2019). A comparative assessment of adult mosquito trapping methods to estimate spatial patterns of abundance and community composition in southern Africa. bioRxiv [Preprint]. doi: 10.1101/633552
Haase, P., Pauls, S. U., Schindehütte, K., and Sundermann, A. (2010). First audit of macroinvertebrate samples from an EU water framework directive monitoring program: human error greatly lowers precision of assessment results. J. North Am. Benthol. Soc. 29, 1279–1291. doi: 10.1899/09-183.1
Harbach, R. E. (2007). The culicidae (Diptera): a review of taxonomy, classification and phylogeny. Zootaxa 638, 591–638. doi: 10.1017/CBO9781107415324.004
Hebert, P. D., Cywinska, A., Ball, S. L., and deWaard, J. R. (2003). Biological identifications through DNA barcodes. Proc. Biol. Sci. 270, 313–321. doi: 10.1098/rspb.2002.2218
Heck, K. L., van Belle, G., and Simberloff, D. (1975). Explicit calculation of the rarefaction diversity measurement and the determination of sufficient sample size. Ecology 56, 1459–1461. doi: 10.2307/1934716
Hemmerter, S., Šlapeta, J., van den Hurk, A. F., Cooper, R. D., Whelan, P. I., Russell, R. C., et al. (2007). A curious coincidence: mosquito biodiversity and the limits of the Japanese encephalitis virus in Australasia. BMC Evolut. Biol. 7:100. doi: 10.1186/1471-2148-7-100
Hoekman, D., Springer, Y. P., Barker, C. M., Barrera, R., Blackmore, M. S., Bradshaw, W. E., et al. (2016). Design for mosquito abundance, diversity, and phenology sampling within the National Ecological Observatory Network. Ecosphere 7:e01320. doi: 10.1002/ecs2.1320
Huelsenbeck, J. P., and Ronquist, F. (2001). MRBAYES: Bayesian inference of phylogenetic trees. Bioinformatics 17, 754–755. doi: 10.1093/bioinformatics/17.8.754
Hunt, S. K., Galatowitsch, M. L., and McIntosh, A. R. (2017). Interactive effects of land use, temperature, and predators determine native and invasive mosquito distributions. Freshw. Biol. 62, 1564–1577. doi: 10.1111/fwb.12967
Jäch, M. A., and Balke, M. (2008). Global diversity of water beetles (Coleoptera) in freshwater. Hydrobiologia 595, 419–442. doi: 10.1007/s10750-007-9117-y
Jane, S. F., Wilcox, T. M., Mckelvey, K. S., Young, M. K., Schwartz, M. K., Lowe, W. H., et al. (2015). Distance, flow and PCR inhibition: EDNA dynamics in two headwater streams. Molecul. Ecol. Resour. 15, 216–227. doi: 10.1111/1755-0998.12285
Katoh, K., Misawa, K., Kuma, K., and Miyata, T. (2002). MAFFT: a novel method for rapid multiple sequence alignment based on fast Fourier transform. Nucleic Acids Res. 30, 3059–3066. doi: 10.1093/nar/gkf436
Kearse, M., Moir, R., Wilson, A., Stones-Havas, S., Cheung, M., Sturrock, S., et al. (2012). Geneious basic: an integrated and extendable desktop software platform for the organization and analysis of sequence data. Bioinformatics 28, 1647–1649. doi: 10.1093/bioinformatics/bts199
Kivioja, T., Vähärautio, A., Karlsson, K., Bonke, M., Enge, M., Linnarsson, S., et al. (2012). Counting absolute numbers of molecules using unique molecular identifiers. Nature Methods 9, 72–74. doi: 10.1038/nmeth.1778
Krol, L., Gorsich, E. E., Hunting, E. R., Govender, D., van Bodegom, P. M., and Schrama, M. (2019). Eutrophication governs predator-prey interactions and temperature effects in Aedes aegypti populations. Parasit. Vect. 12:179. doi: 10.1186/s13071-019-3431-x
Lafferty, K. D. (2009). The ecology of climate change and infectious diseases. Ecology 90, 888–900. doi: 10.1890/09-1656.1
Laramie, M. B., Pilliod, D. S., Goldberg, C. S., and Strickler, K. M. (2015). “Environmental DNA sampling protocol - filtering water to capture DNA from aquatic organisms,” in U.S Geological Survey Techniques and Methods (Reston, VA: U.S. Geological Survey), 15. doi: 10.3133/TM2A13
Maddison, W. P., and Maddison, D. R. (2018). Mesquite: A Modular System for Evolutionary Analysis. Version 3.51. Available online at: http://www.mesquiteproject.org
Miller, M. A., Pfeiffer, W., and Schwartz, T. (2010). “Creating the CIPRES science gateway for inference of large phylogenetic trees,” in 2010 Gateway Computing Environments Workshop (GCE), 1–8. doi: 10.1109/GCE.2010.5676129
Nathan, L. M., Simmons, M., Wegleitner, B. J., Jerde, C. L., and Mahon, A. R. (2014). Quantifying environmental DNA signals for aquatic invasive species across multiple detection platforms. Environ. Sci. Technol. 48, 12800–12806. doi: 10.1021/es5034052
Philip, D. (2009). VEGAN, a package of R functions for community ecology. J. Veget. Sci. 14, 927–930. doi: 10.1111/j.1654-1103.2003.tb02228.x
R Core Team (2016). R: A Language and Environment for Statistical Computing. Vienna: R Foundation for Statistical Computing. Available online at: https://www.R-project.org/
Rambaut, A., Drummond, A. J., Xie, D., Baele, G., and Suchard, M. A. (2018). Posterior summarization in bayesian phylogenetics using tracer 1.7. Systemat. Biol. 67, 901–904. doi: 10.1093/sysbio/syy032
Reidenbach, K. R., Cook, S., Bertone, M. A., Harbach, R. E., Wiegmann, B. M., and Besansky, N. J. (2009). Phylogenetic analysis and temporal diversification of mosquitoes (Diptera: Culicidae) based on nuclear genes and morphology. BMC Evolut. Biol. 9:298. doi: 10.1186/1471-2148-9-298
Reiter, P. (2001). Climate change and mosquito-borne disease. Environ. Health Perspect. 109, 141–161. doi: 10.2307/3434853
Rejmánková, E., Grieco, J., Achee, N., and Roberts, D. R. (2013). Ecology of Larval Habitats. Anopheles Mosquitoes - New Insights into Malaria Vectors.
Renshaw, M. A., Olds, B. P., Jerde, C. L., Mcveigh, M. M., and Lodge, D. M. (2015). The room temperature preservation of filtered environmental DNA samples and assimilation into a phenol-chloroform-isoamyl alcohol DNA extraction. Molecul. Ecol. Resour. 15, 168–176. doi: 10.1111/1755-0998.12281
Rognes, T., Flouri, T., Nichols, B., Quince, C., and Mahé, F. (2016). VSEARCH: a versatile open source tool for metagenomics. Peer J. 4:e2584. doi: 10.7717/peerj.2584
Ronquist, F., and Huelsenbeck, J. P. (2003). MrBayes 3: bayesian phylogenetic inference under mixed models. Bioinformatics 19, 1572–1574. doi: 10.1093/bioinformatics/btg180
Rozen, S., and Skaletsky, H. (1999). “Primer3 on the WWW for general users and for biologist programmers,” in Bioinformatics Methods and Protocols, eds S. Misener, and S. A. Krawetz (Totowa, NJ: Humana Press), 365–386. doi: 10.1385/1-59259-192-2:365
Schmieder, R., and Edwards, R. (2011). Quality control and preprocessing of metagenomic datasets. Bioinformatics 27, 863–864. doi: 10.1093/bioinformatics/btr026
Schneider, J., Valentini, A., Dejean, T., Montarsi, F., Taberlet, P., Glaizot, O., et al. (2016). Detection of invasive mosquito vectors using environmental DNA (eDNA) from water samples. PLoS ONE 11:e0162493. doi: 10.1371/journal.pone.0162493
Schrama, M., Gorsich, E. E., Hunting, E. R., Barmentlo, S. H., Beechler, B., and Bodegom, P. M. (2018). Eutrophication and predator presence overrule the effects of temperature on mosquito survival and development. PLoS Neglected Trop. Dis. 12, 1–13. doi: 10.1371/journal.pntd.0006354
Simard, F., Nchoutpouen, E., Toto, J. C., and Fontenille, D. (2005). Geographic distribution and breeding site preference of Aedes albopictus and Aedes aegypti (Diptera: culicidae) in Cameroon, Central Africa. J. Med. Entomol. 42, 726–731. doi: 10.1603/0022-2585(2005)042
Stresman, G. H. (2010). Beyond temperature and precipitation: ecological risk factors that modify malaria transmission. Acta Trop. 116, 162–72. doi: 10.1016/j.actatropica.2010.08.005
Strickler, K. M., Fremier, A. K., and Goldberg, C. S. (2015). Quantifying effects of UV-B, temperature, and pH on eDNA degradation in aquatic microcosms. Biol. Conserv. 183, 85–92. doi: 10.1016/j.biocon.2014.11.038
Taberlet, P., Coissac, E., Hajibabaei, M., and Rieseberg, L. H. (2012). Environmental DNA. Molecul. Ecol. 21, 1789–1793. doi: 10.1111/j.1365-294X.2012.05542.x
Turner, C. R., Barnes, M. A., Xu, C. C. Y., Jones, S. E., Jerde, C. L., and Lodge, D. M. (2014). Particle size distribution and optimal capture of aqueous macrobial eDNA. Methods Ecol. Evol. 5, 676–684. doi: 10.1111/2041-210X.12206
Virgilio, M., Backeljau, T., Nevado, B., and De Meyer, M. (2010). Comparative performances of DNA barcoding across insect orders. BMC Bioinform. 11:206. doi: 10.1186/1471-2105-11-206
Washburn, J. O. (1995). Regulatory factors affecting larval mosquito populations in container and pool habitats: implications for biological control. J. Am. Mosquito Control Assoc. 11(2 Pt 2), 279–283.
White, T., Bruns, T., Lee, S., and Taylor, J. (1990). “Amplification and direct sequencing of fungal ribosomal RNA genes for phylogenetics,” in PCR Protocols A Guide to Methods and Applications, eds M. A. Innis, D. H. Gelfand, J. J. Sninski, and T. J. White (San Diego, CA: Academic Press), 315–322.
Wilkerson, R. C., Linton, Y. M., Fonseca, D. M., Schultz, T. R., Price, D. C., and Strickman, D. A. (2015). Making mosquito taxonomy useful: a stable classification of tribe Aedini that balances utility with current knowledge of evolutionary relationships. PLoS ONE 10:e0133602. doi: 10.1371/journal.pone.0133602
Williams, K. E., Huyvaert, K. P., and Piaggio, A. J. (2016). No filters, no fridges: a method for preservation of water samples for eDNA analysis. BMC Res. Notes 9:298. doi: 10.1186/s13104-016-2104-5
Keywords: eDNA, culicidae primer, mosquitoes, vector-borne diseases, biomonitoring, Kruger National Park, mosquito communities
Citation: Krol L, Van der Hoorn B, Gorsich EE, Trimbos K, Bodegom PM and Schrama M (2019) How Does eDNA Compare to Traditional Trapping? Detecting Mosquito Communities in South-African Freshwater Ponds. Front. Ecol. Evol. 7:260. doi: 10.3389/fevo.2019.00260
Received: 09 February 2019; Accepted: 20 June 2019;
Published: 10 July 2019.
Edited by:
David Andrew Bohan, INRA Centre Dijon Bourgogne Franche-Comté, FranceReviewed by:
Lingxin Chen, Yantai Institute of Coastal Zone Research (CAS), ChinaGregor Devine, QIMR Berghofer Medical Research Institute, Australia
Copyright © 2019 Krol, Van der Hoorn, Gorsich, Trimbos, Bodegom and Schrama. This is an open-access article distributed under the terms of the Creative Commons Attribution License (CC BY). The use, distribution or reproduction in other forums is permitted, provided the original author(s) and the copyright owner(s) are credited and that the original publication in this journal is cited, in accordance with accepted academic practice. No use, distribution or reproduction is permitted which does not comply with these terms.
*Correspondence: Louie Krol, louie.krol@naturalis.nl