Phylogenetic Patterns of Extinction Risk in the Endemic Flora of a Mediterranean Hotspot as a Guiding Tool for Preemptive Conservation Actions
 Rafael Molina-Venegas
 Ignacio Ramos-Gutiérrez
 Juan Carlos Moreno-Saiz
- 1GLOCEE – Global Change Ecology and Evolution Group, Department of Life Sciences, Universidad de Alcalá, Alcalá de Henares, Spain
- 2Department of Biology (Botany), Universidad Autónoma de Madrid, Madrid, Spain
- 3Research Center on Biodiversity and Global Change (CIBC-UAM), Universidad Autónoma de Madrid, Madrid, Spain
Climate change is a major driver of biodiversity decline with pervasive effects in biodiversity hotspots, where many endemic and threatened species thrive. However, the biological drivers of extinction susceptibility remain largely elusive, which hampers the implementation of effective conservation policies. Here, we advocate for the use of phylogenies as a complementary tool to inform policy makers. If we assume that the traits that determine extinction susceptibility are somewhat evolutionarily conserved, identifying the clades that accumulate a disproportionate amount of threatened species may help to mitigate potential increases in extinction risk among currently unthreatened species in these clades, even if the underlying biological drivers are unknown. We focused on the complete endemic angiosperm flora of a Mediterranean hotpot (Iberian Peninsula) to examine phylogenetic patterns in extinction risk expressed as IUCN categories (Least Concern “LC”, Near Threatened “NT”, Vulnerable “VU”, Endangered “EN” and Critically Endangered “CR”) using alpha and beta diversity metrics, comparative methods and a “hot node” approach. Phylogenetic diversity was significantly low for EN species and marginally significant for NT and CR, while LC and VU categories showed random pattern. Phylogenetic beta diversity (PBD) between IUCN categories was intermediate (0.40 – 0.61) and predominantly due to the “true” turnover component of PBD. Phylogenetic turnover was significantly low between NT – VU and VU – EN, suggesting that closely related species tend to show different threat status. In contrast, the comparisons involving the CR category sit toward the higher tail of the distribution, indicating a somewhat higher degree of clade specificity for CR species. In line with these patterns, phylogenetic signal in extinction risk was rather low (lambda = 0.23). Several of the “hot” clades that accumulated a significantly high number of species with the same threat status were specific to certain IUCN categories, yet few of them were observed across the categories. Most notably, the Caryophyllales stood out as the main threat-accumulating lineage, particularly within the Plumbaginaceae. All in all, our results indicate that few phylogenetic clades concentrate a great fraction of the extinction-risk gradient in the endemic flora of the western Mediterranean, and monitoring programs should pay particular attention to these extinction-prone lineages.
Introduction
Climate change is a major driver of biodiversity decline (Sala et al., 2000) and particularly in biodiversity hotspots where many endemic and threatened species thrive (Bellard et al., 2014). With nearly 22500 plant species and 11700 of them as endemics, the Mediterranean Basin is among the most outstanding plant biodiversity hotspots of the world (Mittermeier et al., 2004), covering over 60% of the world Mediterranean climate extent (Klausmeyer and Shaw, 2009). This extraordinary concentration of plant diversity has urged conservation biologists to find solutions to minimize the projected loss of biodiversity in the region (Galli et al., 2012).
Understanding the association between species biological attributes and extinction susceptibility could help to make conservation planning more efficient (Purvis et al., 2000; Cardillo and Meijaard, 2012). However, and despite few traits have been identified as potential biological drivers of extinction risk in both plants (Lughadha et al., 2017; Mankga and Yessoufou, 2017) and animals (Cardillo et al., 2008), there is a noticeable lack of consistency among studies (Davies, 2019), and the relationship between the vast majority of traits analyzed and extinction risk remains largely elusive (Chichorro et al., 2019). Critically, this lack of empirical consistency hampers the identification of the species that might be most in need of conservation action.
Many traits that are linked to plant extinction risk such as phenology and biotic pollination (Lughadha et al., 2017) are evolutionarily conserved (Davies et al., 2013; Cirtwill et al., 2020), suggesting that climate-driven extinctions may be non-random with respect to phylogeny. For example, Willis et al. (2008) found that flowering-time responses to climate change are shared among closely related species and strongly correlated with species abundances, which explained phylogenetically clumped patterns of species loss. On the other hand, the association between extinction risk and species phenotypes appears to vary geographically (Sodhi et al., 2008; Godefroid et al., 2014), suggesting that the clades that are threatened by climatic stressors may be region-specific if we assume the biological drivers of extinction susceptibility are evolutionarily conserved. For example, if pseudanthia (a strongly conserved floral trait) were associated with high extinction risk in humid regions, Asteraceae representatives could be threatened in the tropics but not in drylands. Therefore, identifying the clades that accumulate a disproportionate amount of threatened species in specific regions may help to guide preemptive conservation actions to mitigate potential increases in extinction risk among currently unthreatened (or near threatened) species in these clades (Yessoufou et al., 2012), even if the underlying biological drivers are unknown. Moreover, considering extinction within a phylogenetic framework allows quantifying its impacts on the tree-of-life as the loss of evolutionary history (Davies and Yessoufou, 2013; Faith, 2018), an increasingly appreciated perspective within conservation goals (Laity et al., 2015; Gumbs et al., 2018; Carta et al., 2019).
Here, we focused on the complete endemic angiosperm flora of the Iberian Peninsula in the western Mediterranean to explore phylogenetic patterns of extinction risk using IUCN assessments and time-calibrated molecular phylogenies. The Iberian Peninsula is one of the two major centers of narrow endemics within the Mediterranean Basin biodiversity hotspot (Medail and Quezel, 1997), and thus represents an ideal system to evaluate the usefulness of phylogenetic tools for the conservation of endemic plants in the Mediterranean. Specifically, we used the phylogenetic diversity metric (Faith, 1992) to assess whether extinction risk is phylogenetic clumped in this flora (phylogenetic diversity of IUCN categories), and further quantified the degree of clade-specificity in threat categories using the “true” turnover component of phylogenetic beta diversity (Leprieur et al., 2012). Complementarily, we used a “hot node” approach (e.g., Saslis-Lagoudakis et al., 2011; Molina-Venegas et al., 2020b) to elucidate the identity of the clades with a significant overabundance of species in each category. Finally, we evaluated the degree of phylogenetic signal in extinction risk using comparative methods.
Materials and Methods
Endemic Flora of the Iberian Peninsula
We compiled all angiosperm species and subspecies included in the published volumes of Flora iberica (Castroviejo, 1986–2019) specifically registered as endemics for said work, which covers continental Portugal, continental Spain (including the Balearic Islands, which are an extension of the Baetic range in southern Spain; see Figure 1A) and Andorra (a small country in the eastern Pyrenees). To make up for the absence of volumes dedicated to the Poaceae family (still unpublished), we took advantage of the comprehensive monography by Romero Zarco (2015) and different generic treatments published in recent years (e.g., Devesa et al., 2013; Ortega-Oliviencia and Devesa, 2018). As the Flora iberica project has been under development for forty years, several taxa have been described after their first volumes were published, many of them being endemics to the territory. Thus, an exhaustive search for these taxa (8.4% of the species in the dataset) was undertaken using the option “new taxa” on the Flora iberica website (floraiberica.es/miscelania/nuevos_taxones.php), revising published generic monographs and descriptions of new species and subspecies during these years (e.g., Salvà, 2006; Zozomová-Lihová et al., 2014; Marques et al., 2017).
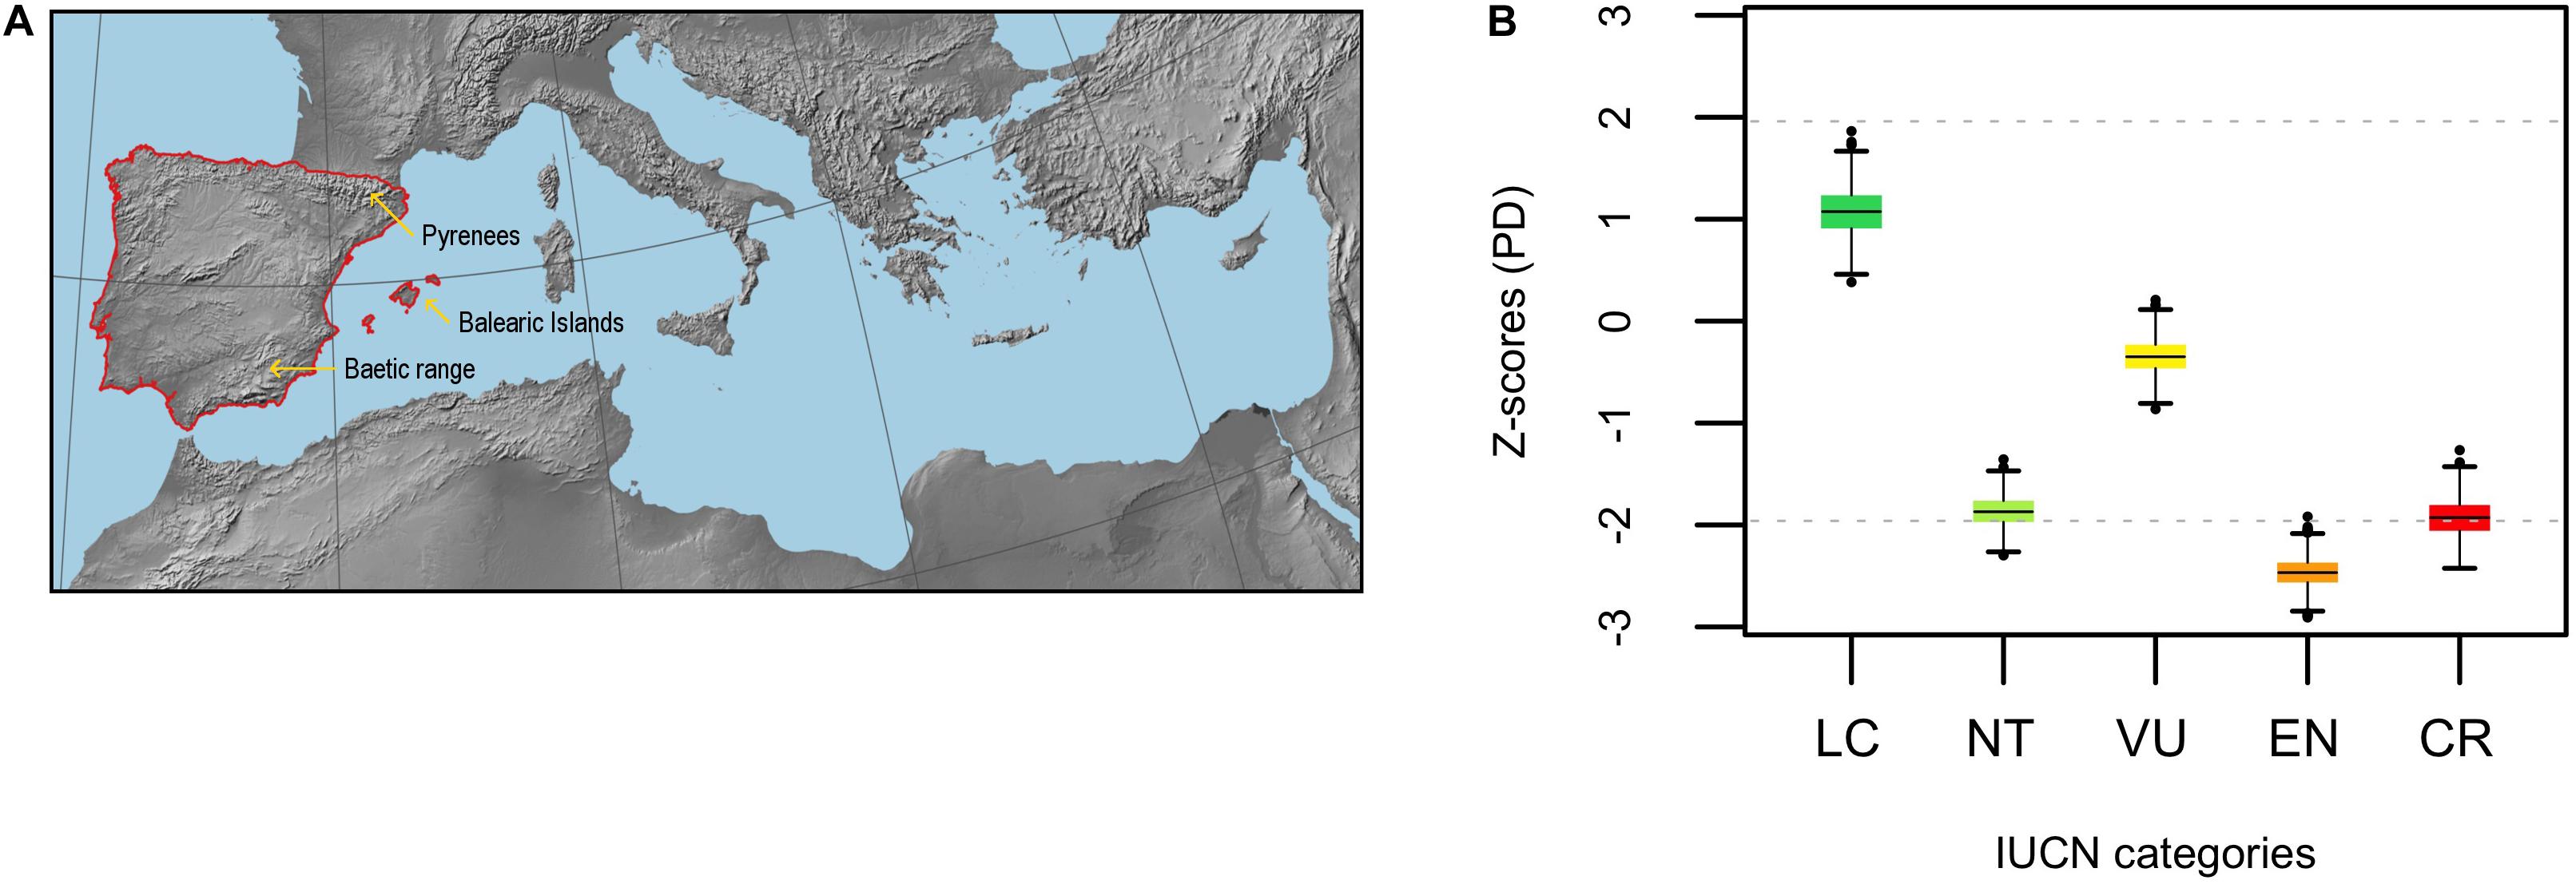
Figure 1. (A) Map of the Mediterranean Basin showing the location of the Iberian Peninsula (region delimited by the red line). (B) Standardized phylogenetic diversity (PD) of extinct risk across IUCN categories (LC, NT, VU, EN, and CR) for the endemic angiosperm flora of the Iberian Peninsula (Z-scores). The horizontal black lines within the boxes represent the mean value of the distribution of Z-scores (n = 1000 phylogenies) in each case, and the horizontal gray dashed lines are visual references at y = ± 1.96 (significance thresholds for a 5% nominal alpha).
The Pyrenees, a mountain range between Spain and France, comprises the northern limit of the Iberian Peninsula (Figure 1A). Therefore, species whose distribution is restricted to the French part of the Pyrenees (a region representing 1.6% of the area of the Iberian Peninsula) can be considered as endemics of the Iberian Peninsula. Such species are very low in number (3–6 species; see Villar and García, 1989), and they were not included in our dataset because we lack detailed floristic information of this region as to rigorously confirm their Iberian-endemic status. The resulting list of Iberian endemics consisted of 2,138 angiosperm species and subspecies. Endemic gymnosperms and ferns were not considered in the analyses because (1) they are comparatively rare in the study area (only 9 species), and (2) the much older most recent common ancestor (MRCA) of vascular plants compared to that of the angiosperms can obscure phylogenetic patterns among the latter (Letcher, 2010; Qian et al., 2017).
IUCN Assessments
The allocation of risk categories according to the IUCN scheme had recently been addressed for all the Spanish flora in a previous work (Muñoz-Rodríguez et al., 2016). These authors combined the last published Spanish Red List (Moreno-Saiz, 2008) with additional information appeared in regional Red Books, and the threat status for the species that were not included in these sources was assigned based on their area of occupation, number of localities, and future distribution trends using environmental niche models (IUCN Standards Petitions Committee, 2019). Some updates on the threat status of the species have been carried out after the publication of the new volume of the Spanish Red Book (Moreno-Saiz et al., 2019). For Iberian endemics whose distribution is restricted to Portugal, the categories adjudged on the Lista Vermelha project website were used (LVFVPC, 2020). Finally, several new taxa described in the last years included a proposed IUCN category in their descriptions, which were used in our analysis (see Supplementary Table 1 for a list of Iberian endemics with IUCN categories).
Phylogenetic Information
We obtained a time-calibrated phylogeny of DNA for the endemic angiosperm flora of the Iberian Peninsula using the R package V.PhyloMaker (Jin and Qian, 2019). This software uses the largest time-calibrated mega-phylogeny of vascular plants available to date (GBOTB.extended; see Jin and Qian, 2019) to generate a subtree from a given species list (standardized to The Plant List, 2013 v 1.1 nomenclatural and spelling criteria) following a three-steps procedure. First, V.PhyloMaker finds for each genus in the list the MRCA of all the tips in the largest monophyletic cluster within GBOTB.extended, and defines it as the crown node of the genus. Second, the species in the list that are missing in GBOTB.extended are bound to the tree using a sticking scenario that is specified by the user. Here, we used scenario 2, which binds the new tips to a randomly selected node at and below the corresponding genus crown node (or family node if the genus is missing in GBOTB.extended). Finally, the resultant tree is pruned to include only the species in the input list. The GBOTB.extended phylogeny does not include infra-specific taxa, which are particularly abundant in biodiversity hotspots. Thus, phylogenetic relationships among accepted subspecies (after The Plant List, 2013 v. 1.1 nomenclatural criteria) were randomly resolved in the corresponding terminal tips (i.e., species) using the R package phytools (Revell, 2012). No infra-subspecific taxa were considered in the study. In order to account for phylogenetic uncertainty (i.e., random binding of species and subspecies), we repeated this procedure iteratively to obtain 1000 different phylogenetic hypotheses, and all subsequent analyses were replicated and results averaged over the 1000 trees (Rangel et al., 2015).
Phylogenetic Patterns of Extinction Risk
First, we explored whether extinction risk is phylogenetic clumped in the endemic angiosperm flora of the Iberian Peninsula. To do so, we grouped species in the following categories: Least Concern (LC, 885 species), Near Threatened (NT, 297 species), Vulnerable (VU, 357 species), Endangered (EN, 180 species), Critically Endangered (CR, 132 species), Data Deficient (DD, 86 species) and Not Evaluated (NE, 196 species). Species categorized as Extinct in the Wild (EW, 2 species) or Extinct (EX, 3 species) were not considered in the analyses. For each category, we quantified whether the phylogenetic diversity (PD sensu Faith, 1992) encapsulated by their constituent species was lower (phylogenetic clustering), random or higher (phylogenetic overdispersion) than expected using a null-model approach. The observed PD values were compared to a null distribution of values generated by shuffling taxa labels in the phylogeny 999 times using the function ses.pd implemented in Picante R package v.1.8 (Kembel et al., 2010) with default settings. For a nominal alpha of 5%, ses.pd values (Z-scores) below and above −1.96 and +1.96 can be considered as significant phylogenetic clustering and overdispersion, respectively (Kembel, 2009). This standardization corrects for differences in species richness between the categories. It is important to note that DD and NE categories do not represent actual threat categories but incomplete sampling or taxonomic knowledge. Thus, in order to assess the impact of these categories in the computation of Z-scores, we conducted the analyses using two different species pools. Pool 1 included the species categorized as LC, NT, VU, EN, and CR (n = 1851) and Pool 2 included also DD and NE species (n = 2133). We also explored the phylogenetic structure of threatened species (i.e., CR + EN + VU as a unique category) following the procedure described above.
Complementarily to phylogenetic diversity analyses, we used a “hot node” approach (e.g., Saslis-Lagoudakis et al., 2011; Molina-Venegas et al., 2020b) to elucidate the identity of the clades with a significant overabundance of species in each category. For each IUCN category i, the number of species assigned to i that descended from each node j of the phylogeny k was counted. Then, this number was compared to a null distribution of values generated by shuffling trait values (i.e., 1 if the species is included in category i, 0 otherwise) across the tips of phylogeny k 999 times to compute a Z-score for each node j of k. Nodes were considered as “hot” if their associated Z-scores were higher than +1.96 (5% nominal alpha). We only evaluated those clades that included 10 species or more, since previous studies have documented unacceptable rates of statistical errors for smaller lineages (Parra et al., 2010). Note that the identity of the hot nodes may change across phylogenies due to (1) different randomization schemes for the missing species (specially below genus-level, where most missing species were inserted) and (2) Z-scores that sit very close to the significance threshold. To account for such uncertainty, we only considered as “hot” those nodes that were observed and showed statistical significance in at least 50% of the trees analyzed.
We quantified the degree of clade-specificity in threat categories (i.e., whether phylogenetic clades include only species with the same threat status) using the PhyloSor similarity index (Bryant et al., 2008) as a metric of phylogenetic beta diversity (PBD). The PhyloSor index computes the fraction of evolutionary units (typically branch-length) that is shared between two samples, and it ranges between 0 (no branch-length is shared) and 1 (all branch-length is shared). Thus, PBD can be defined as 1 – PhyloSor index. PBD can be decomposed into two additive components, namely “true” turnover (pβsim) and nestedness, which represent different aspects of phylogenetic beta diversity (Leprieur et al., 2012). While the nestedness component represents the fraction of PBD that is simply due to differences in PD, the turnover component implies the replacement of an exact amount of branch-length, the branch-length that is replaced being exclusive to each sample. The observed pβsim values between IUCN categories were standardized following the same procedure described earlier for PD. Lower and higher than expected pβsim values indicate that phylogenetic “true” turnover (hereafter “turnover”) between the samples (here IUCN categories) tends to occur toward the tips and the root of the phylogeny, respectively (Molina-Venegas et al., 2015, 2020a). Thus, significantly low turnover between IUCN categories indicates that closely related species tend to show either conservation status (i.e., low clade-specificity in threat categories), while higher than expected turnover indicates that close relatives tend to show the same status (i.e., high clade-specificity).
In addition, we assessed the degree of phylogenetic signal in extinction risk using models of trait evolution. To do so, we assumed that transitions between threat categories (codified as LC = 1, NT = 2, VU = 3, EN = 4, and CR = 5) occur in a stepwise fashion (e.g., from LC to NT, CR to EN, and VU to EN, etc.) without skipping intermediate steps (meristic transitions between neighboring states), and tested three different models: (1) Brownian motion, (2) Pagel’s lambda, and (3) white noise (evolution independent of phylogeny). Pagel’s lambda equates Brownian motion when the estimated parameter lambda is equal to 1 (strong phylogenetic signal), and white noise if lambda = 0 (lack of phylogenetic signal). Model accuracy was estimated using likelihood ratio tests. Although more complex models are possible (e.g., delta time-dependent model, early burst), we are not interested in the specific mode of evolution of the IUCN categories but in providing empirical evidence for phylogenetic signal in extinction risk (i.e., whether closely related species are similarly threatened), and thus the evolutionary models used here suffice to fulfill the objectives of the study. These comparative analyses were conducted using only the species in Pool 1 (LC, NT, VU, EN, and CR) because meristic transitions between DD or NE and any other category would be meaningless.
In order to examine potential variation of the patterns across phylogenetic scales (see Graham et al., 2018), we also conducted the analyses within the eudicot (1887 species) and monocot (244 species) clades, respectively. All the analyses were conducted in R (R Core Team, 2020) using the packages picante (Kembel et al., 2010), geiger (Pennell et al., 2014), betapart (Baselga et al., 2018) and the R code provided in Molina-Venegas et al. (2020b) for the “hot nodes” analysis.
Results
Phylogenetic Diversity of IUCN Categories
Phylogenetic diversity (PD) of LC and VU categories (i.e., averaged Z-score) did not depart from random expectation, while it was significantly low (i.e., phylogenetic clustering) for EN (Figure 1B). The averaged Z-score for NT and CR sit very close to the threshold of significance toward the lower tail of the distribution (i.e., marginally significant clustering, Figure 1B). DD and NE categories showed a strong phylogenetic clustering, yet the averaged Z-scores for the actual threat categories (i.e., LC, NT, VU, EN, and CR) were only very slightly affected when DD and NE species were included in the analysis, the general pattern remaining virtually unchanged (Supplementary Figure 1). Phylogenetic diversity patterns within the eudicots were very similar, the only difference being that NT and CR became even more clumped and EN slightly less (Supplementary Figure 2A,B). In contrast, phylogenetic diversity was randomly distributed within the monocot clade with the only exception of the NE category, which remained clustered (Supplementary Figure 2C,D). The subset of threatened species (i.e., CR + EN + VU) was phylogenetically more clumped than unthreatened species regardless of the phylogenetic scale, although differences were not significant (Supplementary Figure 3). Phylogenetic uncertainty had a low impact in the analyses, as the distribution of Z-scores showed strong kurtosis and very narrow 95% confidence intervals (Supplementary Figure 4).
Phylogenetic Beta Diversity Between IUCN Categories
Phylogenetic beta diversity (PBD, 1 – Phylosor index) was overall intermediate (ranged between 0.40 – 0.61) and predominantly due to the turnover component except in LC – EN and LC – CR comparisons, where PBD was largely due to differences in PD between the categories (i.e., nestedness) (Figure 2A). Phylogenetic turnover was significantly low between NT – VU and VU – EN (Figure 2B), while the averaged Z-score of the comparisons involving the CR category sit toward the higher tail of the distribution. Specifically, phylogenetic turnover was significantly high and marginally significant between CR – NT and CR – VU, respectively. This general pattern of significance persisted when DD and NE species were included in the analyses (Supplementary Figure 5). PBD patterns were very similar for the eudicots, although the CR – NT and CR – VU comparisons shifted away from the significance threshold (Supplementary Figure 6). The only significant turnover within the monocot clade occurred between NT – EN (lower than expected, Supplementary Figure 7). The general pattern of significance persisted for both the eudicots and the monocots when DD and NE species were included in the analyses (Supplementary Figures 8,9), and phylogenetic uncertainty had also a low impact in the PBD analyses (Supplementary Figures 10–12).
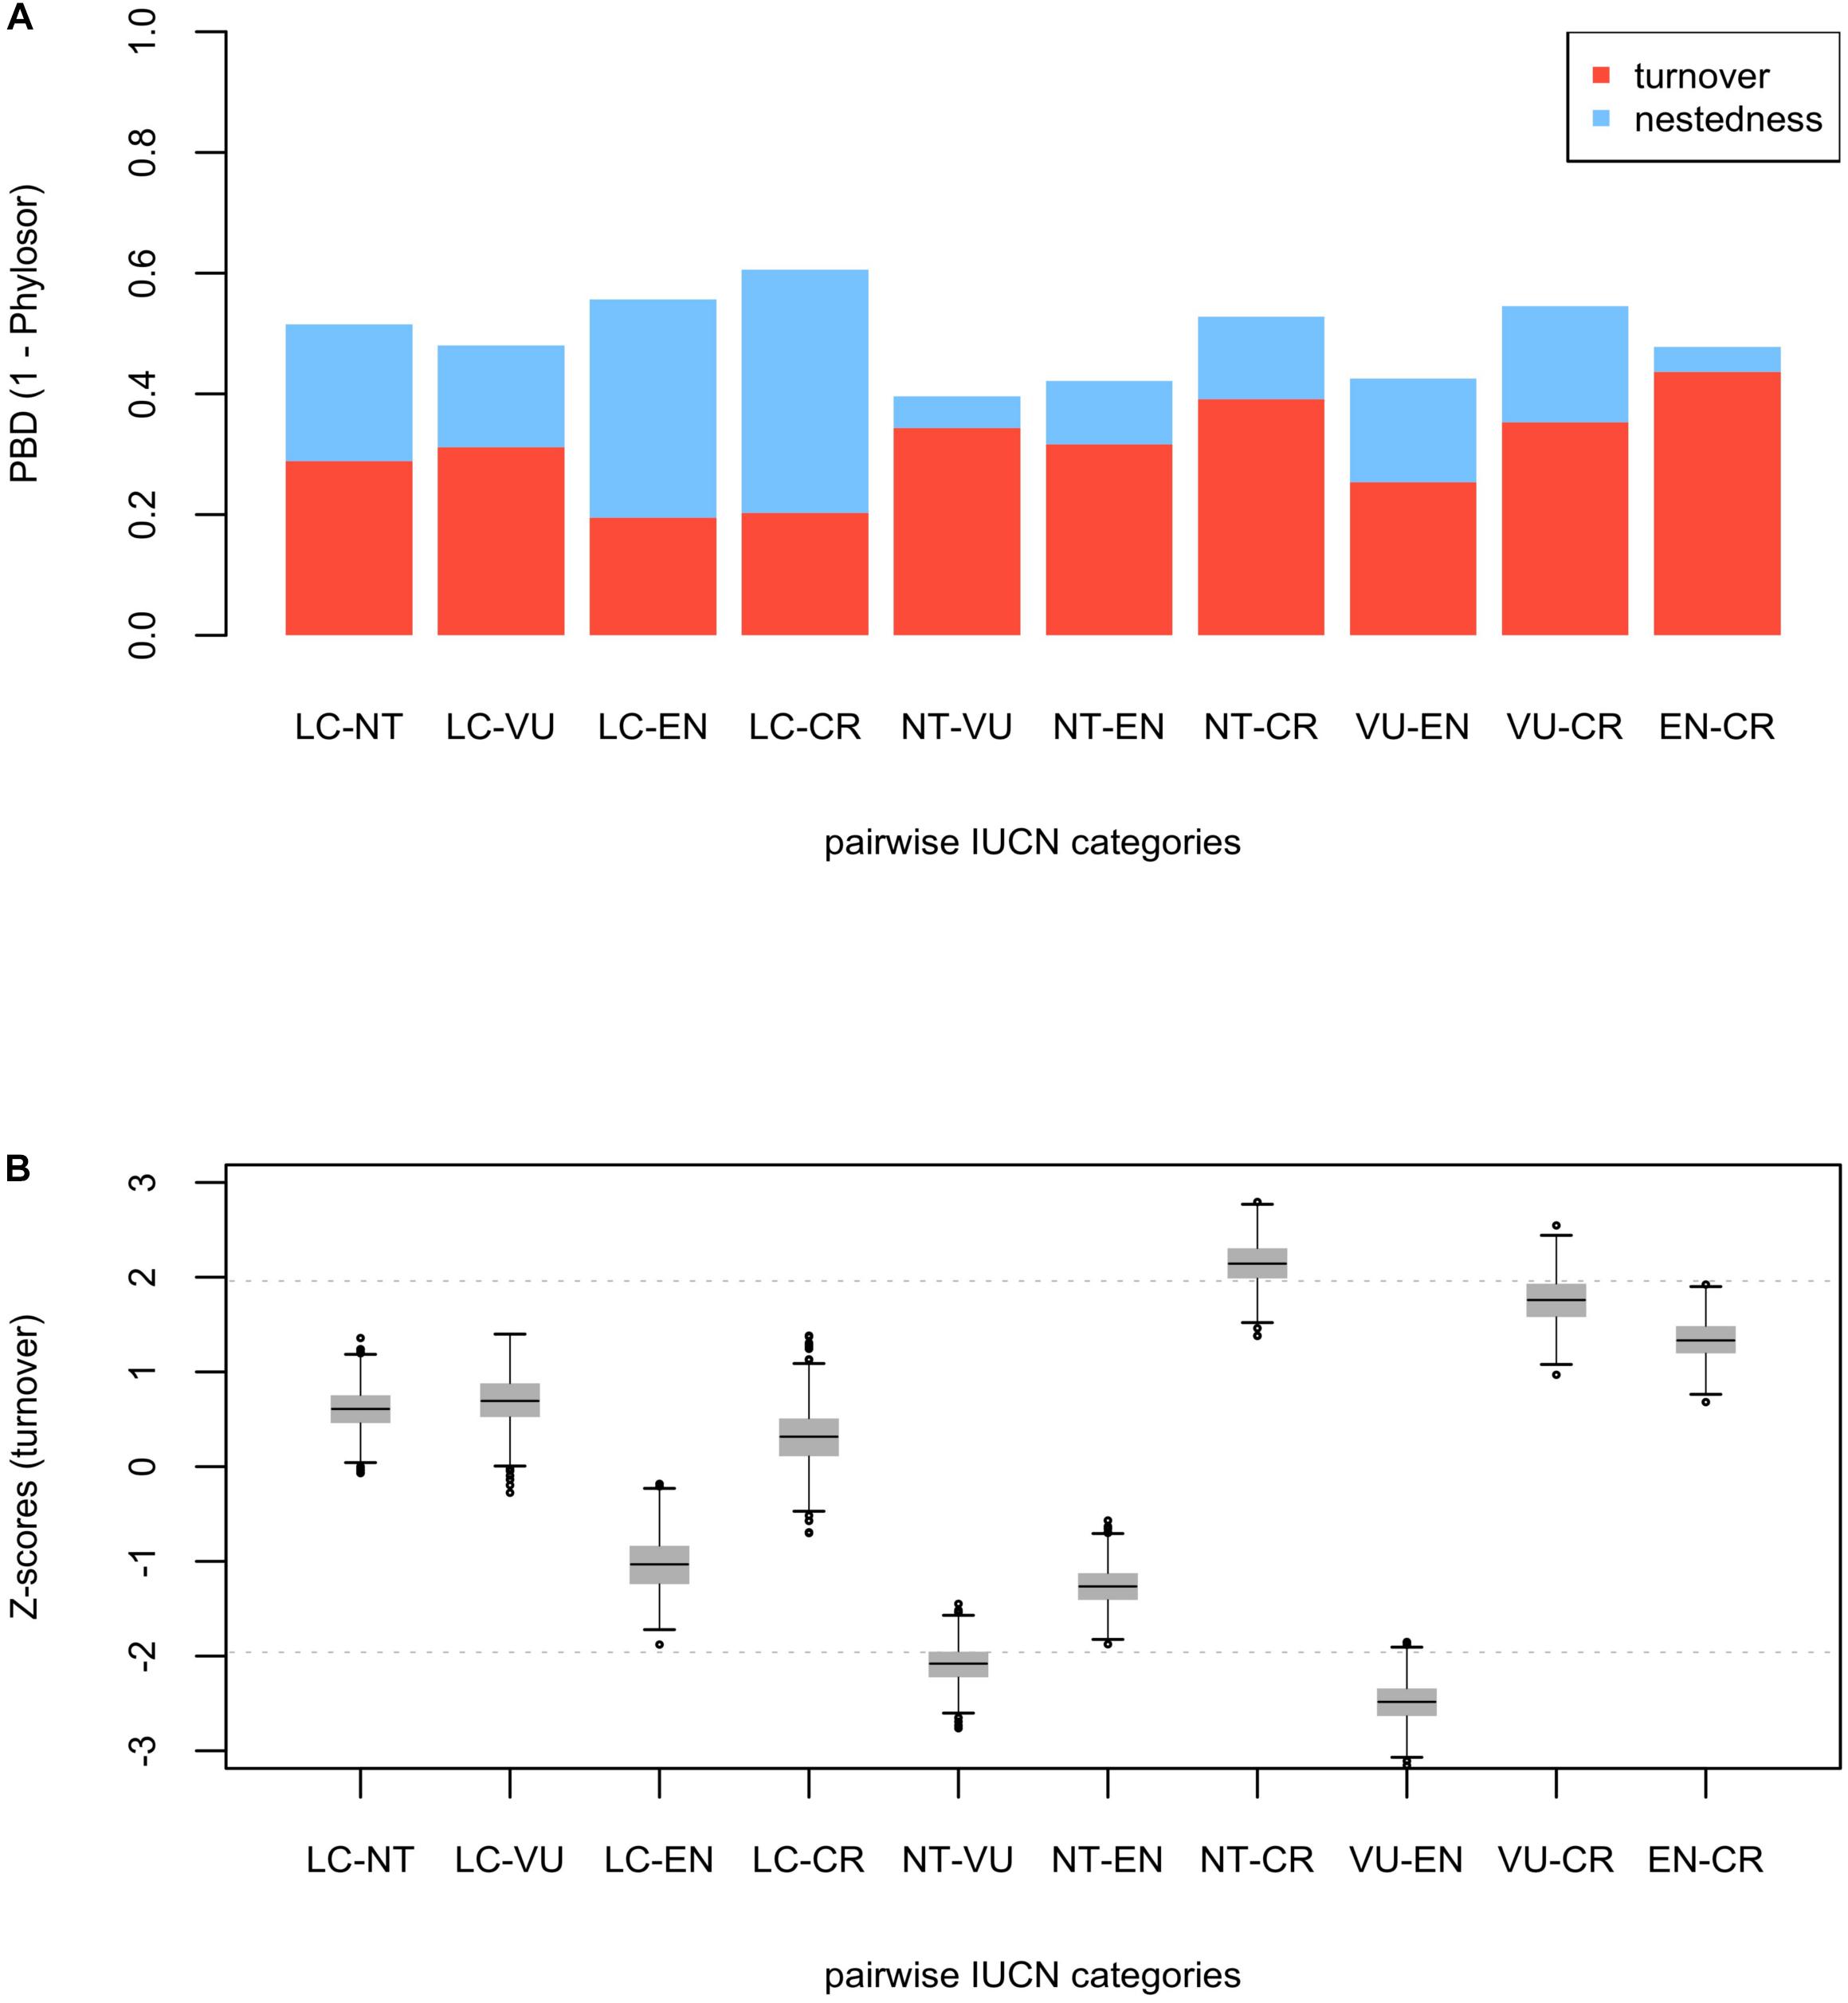
Figure 2. Phylogenetic beta diversity analyses (PBD) among IUCN categories (LC, NT, VU, EN, and CR) for the endemic angiosperm flora of the Iberian Peninsula. The barplot (A) shows the fraction of PBD due to phylogenetic “true” turnover (in red) and nestedness (in blue) for each pairwise comparison. The box-and-whisker plot (B) shows standardized values (Z-scores) for the turnover component. The horizontal black lines within the boxes represent the mean value of the distribution of Z-scores in each pairwise comparison, and the horizontal gray dashed lines are visual references at y = ± 1.96 (significance thresholds for a 5% nominal alpha).
Phylogenetic Hot Nodes
While several of the hot nodes detected in the analysis were specific to certain IUCN categories, few of them were observed across the categories (full details are shown in Table 1). Most notably, the Caryophyllales stood out as the main threat-accumulating clade for CR, EN, and VU categories, particularly within the Plumbaginaceae (Figure 3). The Alchemilla + Potentilla (Rosaceae) clade was also detected as a shared hot node between EN and NT categories (although no Potentilla species were observed in the former category), and the Primulaceae hot node was observed in both VU and NT categories. The eudicots and eudicots excluding Ranunculales clades were identified as deep hot nodes in the NT and EN categories, respectively. LC species were significantly numerous within few deep clades such as monocots, asterids and Saxifragales (Figure 4). No new hot nodes emerged when CR, EN, and VU species were analyzed as a unique thread category (Supplementary Figure 13). We found a strong overdominance of Rosaceae, monocots, Malpighiales, Asterales, and Orobanchaceae representatives in the DD and NE categories (Supplementary Figure 14).
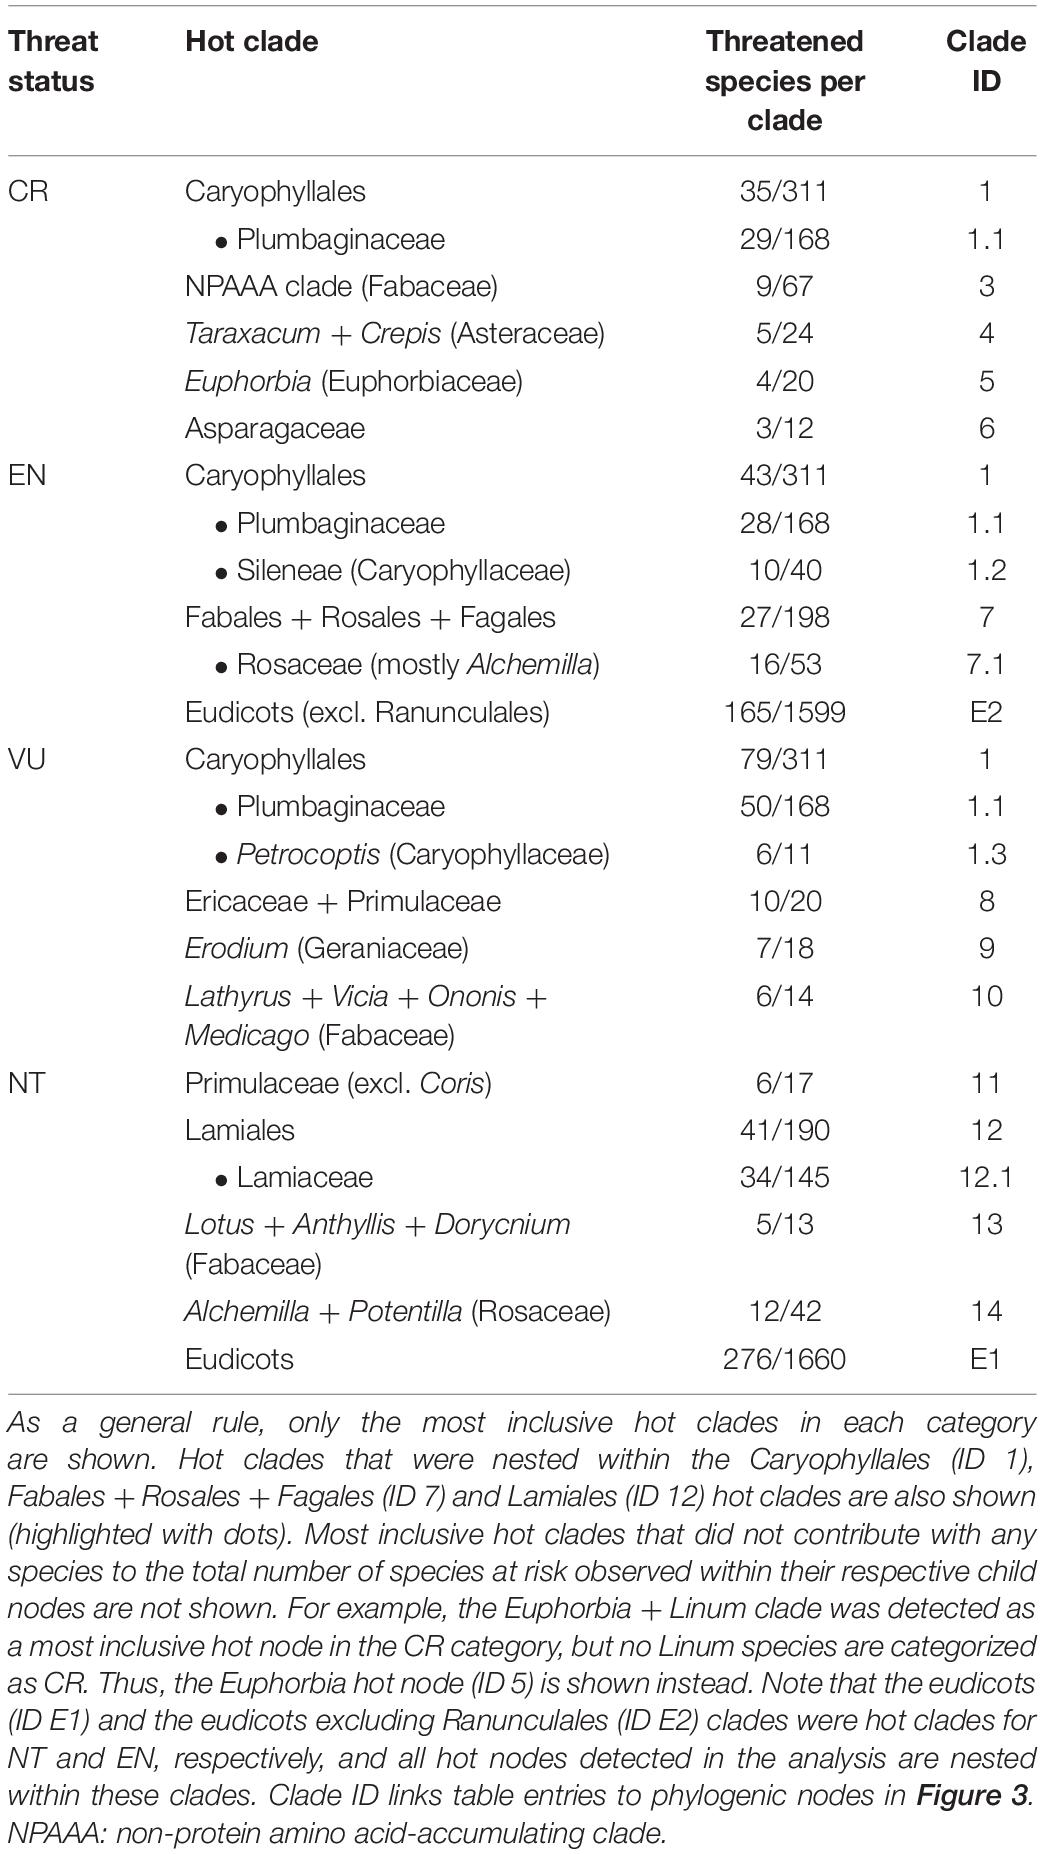
Table 1. Hot clades of the endemic flora of the Iberian Peninsula across IUCN categories.
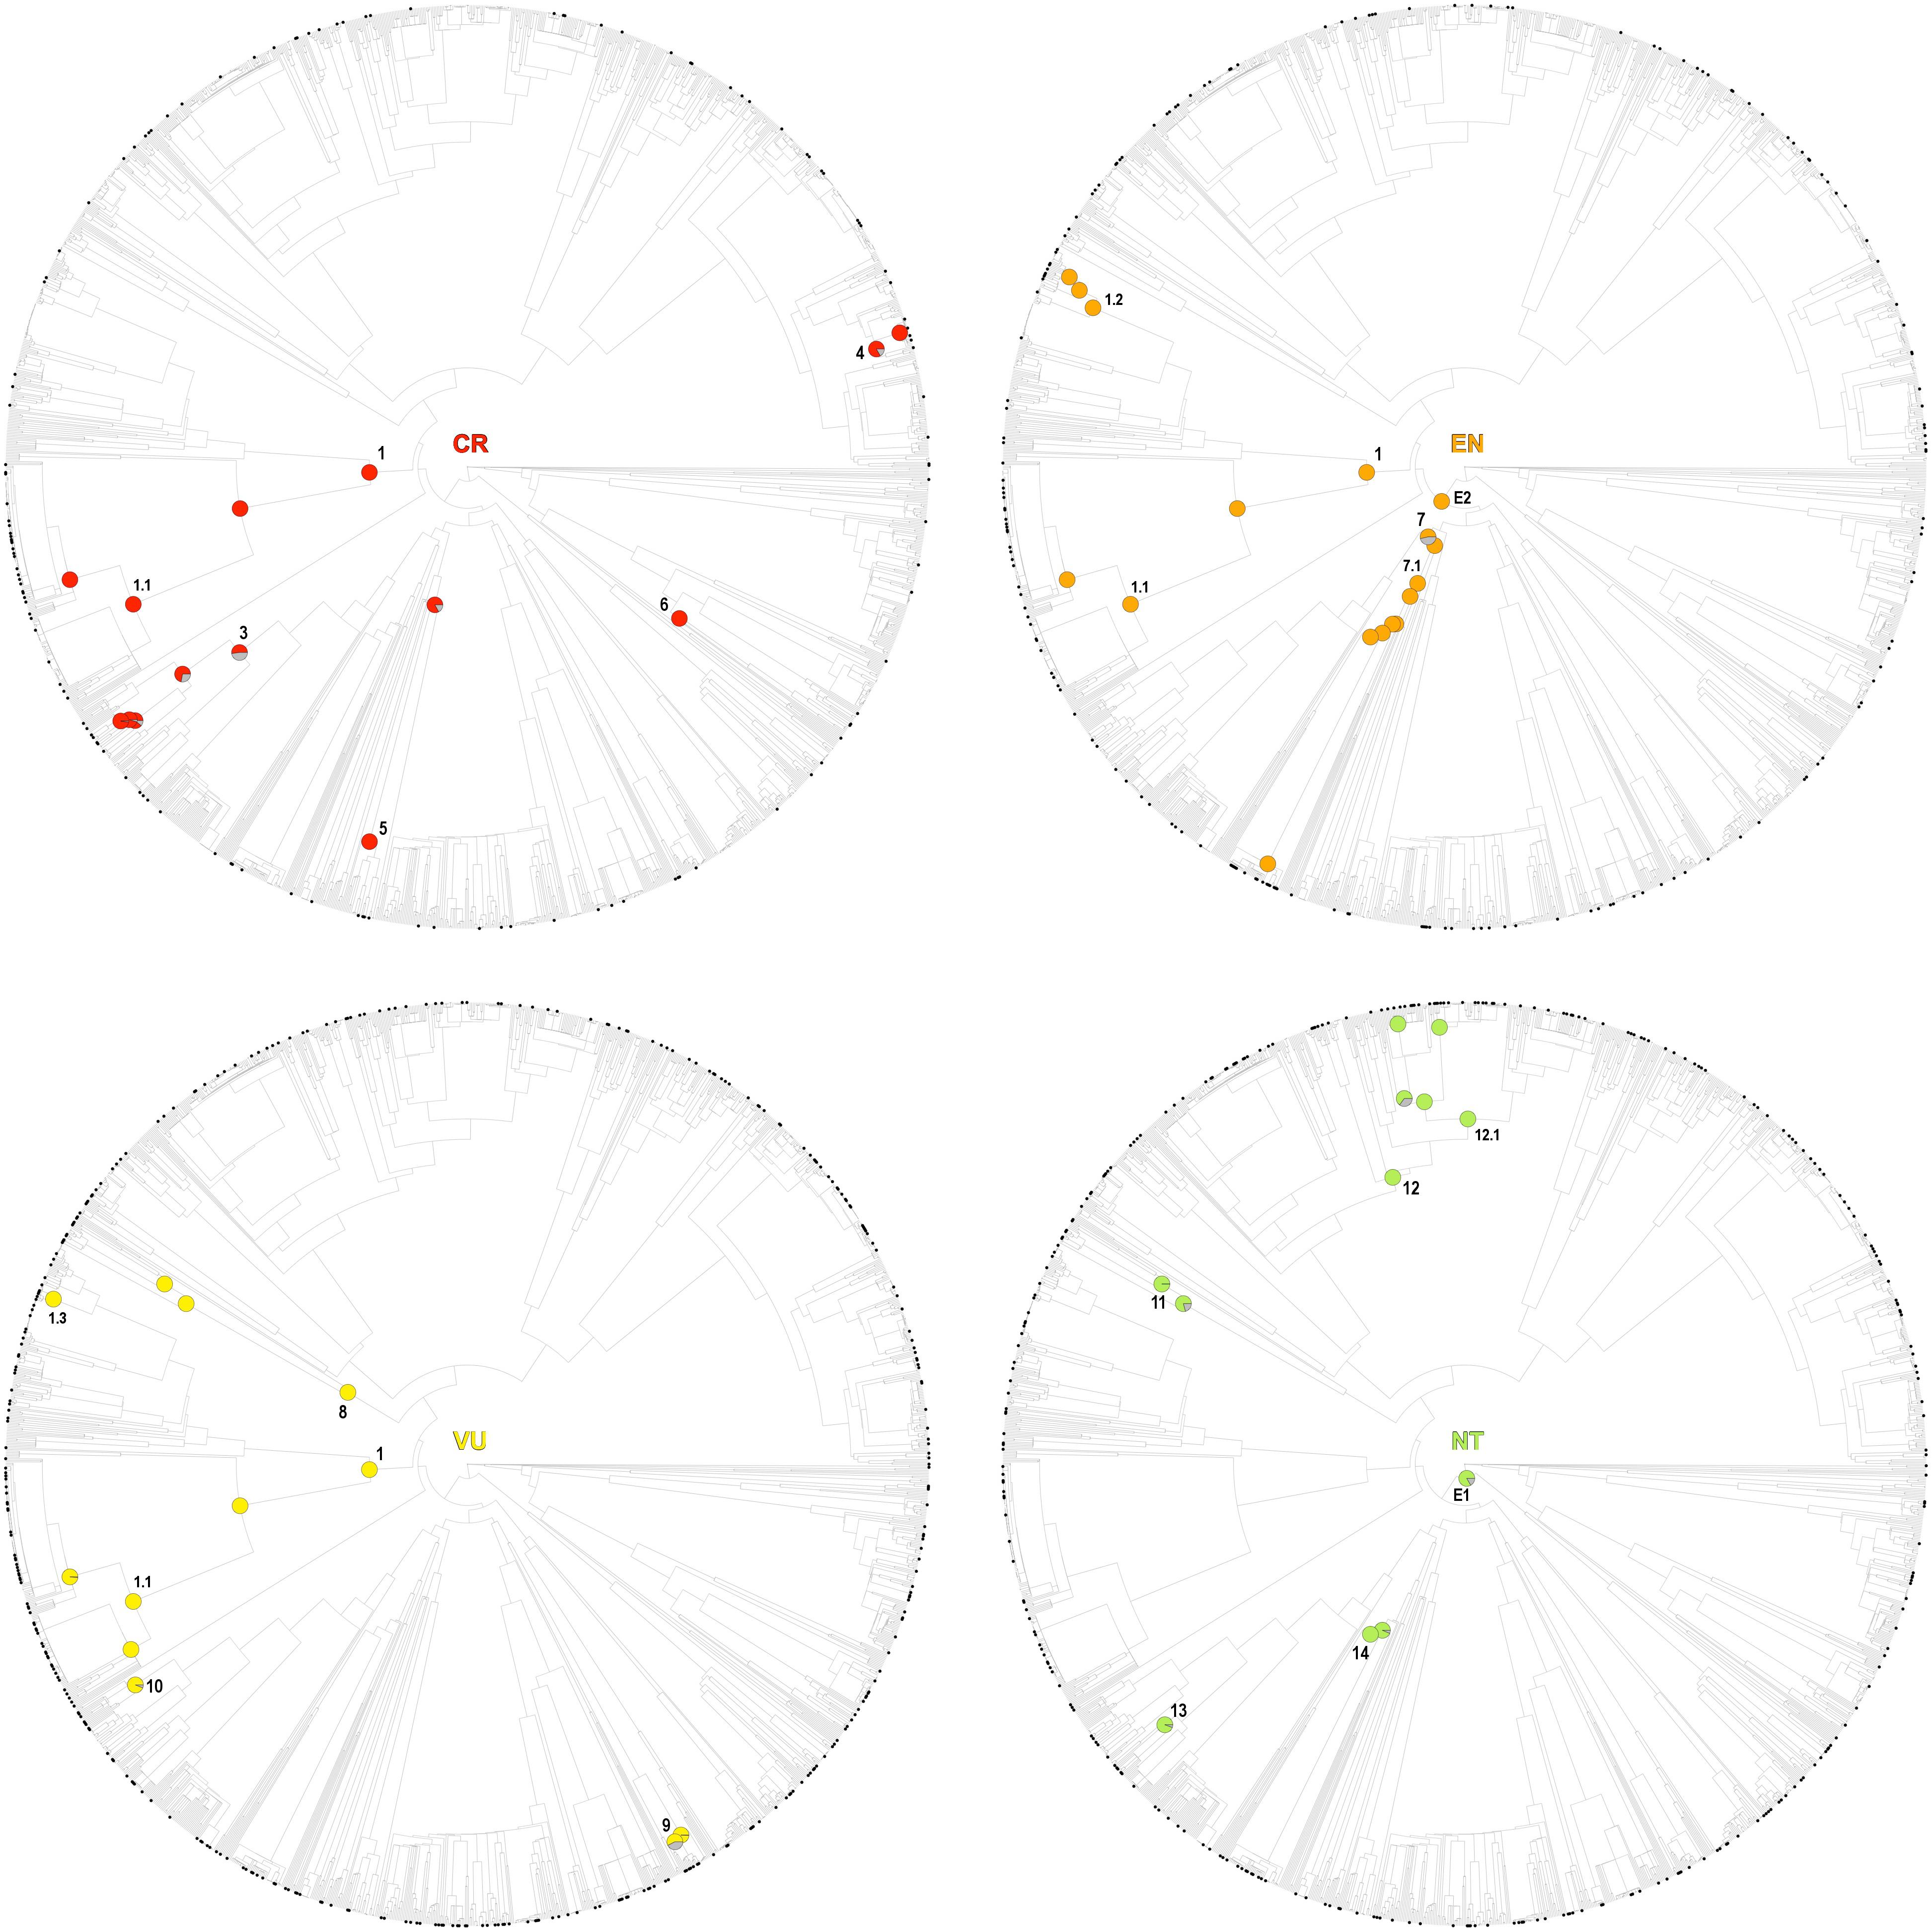
Figure 3. One randomly selected tree topology for the endemic angiosperm flora of the Iberian Peninsula that included all the hot clades detected in the analysis (CR, EN, VU, and NT categories). Hot nodes are marked with pie charts, representing level of support for the nodes, this is, the number of times they were observed with statistical significance (5% nominal alpha) across all the trees analyzed. The circle symbols on the phylogenetic tips represent the species of each category. The numbers correspond to entries in Table 1, where the identity of the nodes is shown.
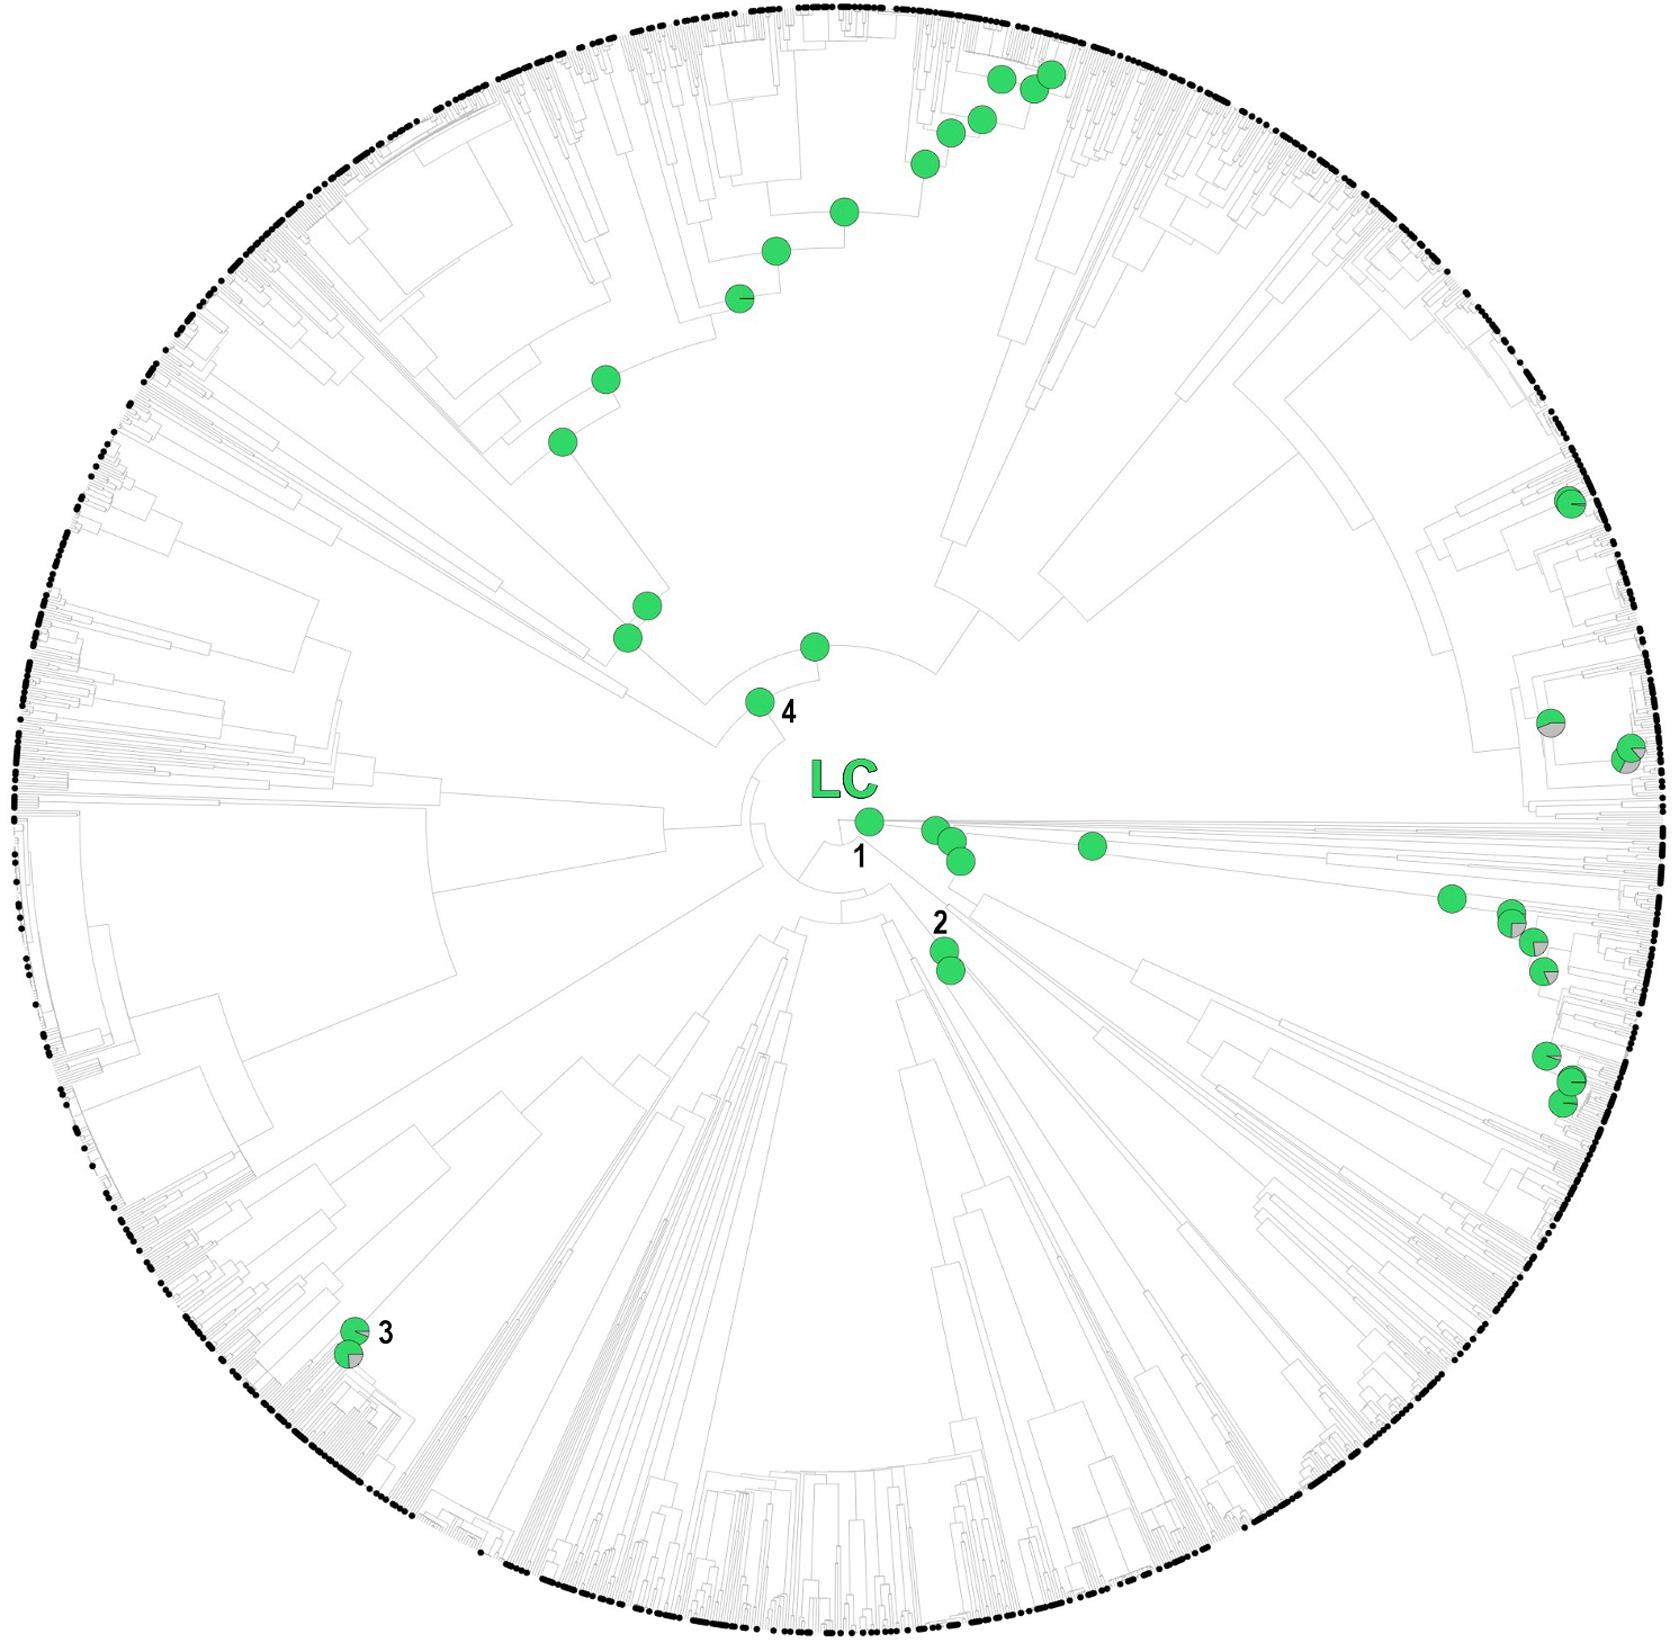
Figure 4. One randomly selected tree topology for the endemic angiosperm flora of the Iberian Peninsula that included all the hot clades detected in the analysis (LC category). Hot nodes are marked with pie charts, representing level of support for the nodes, this is, the number of times they were observed with statistical significance (5% nominal alpha) across all the trees analyzed. The circle symbols on the phylogenetic tips represent LC species. 1: monocots, 2: Saxifragales, 3: Genisteae (Fabaceae), 4: asterids.
Phylogenetic Signal in Extinction Risk
We found no higher support for the Brownian meristic model of evolution than the non-phylogenetic one (p-value of the likelihood ratio test = 1 in all cases). However, the Pagel’s lambda model fit well to our data compared to both the non-phylogenetic (p-value < 0.001 for 99.9% of the trees) and Brownian (p-value < 0.001 in all cases) models, although the signal was rather weak (Pagel’s lambda = 0.23 ± 0.001; mean lambda and 95% confidence interval). Results were very similar for the eudicot clade (lambda = 0.26 ± 0.001), however neither the Brownian, not the Pagel’s lambda models were supported for the monocots (lambda = 0 in all cases).
Discussion
Minimizing expected plant diversity loss in biodiversity hotspots is a major challenge for conservation biologists, and phylogenetic tools may provide a useful handle to assess current and future threats in these endemic species-rich regions (Purvis, 2008). Here, we show that extinction risk in the endemic angiosperm flora of the Iberian Peninsula is largely clumped in the phylogeny (Figure 1), and that specificity in the relationship between IUCN categories and phylogenetic clades is overall low (Figure 2). This lack of association between clades and threat categories is consistent with the low phylogenetic signal detected in our comparative analysis, suggesting that closely related species tend to differ in their threat status (although CR species showed a somewhat higher degree of clade specificity, Figure 2). All in all, our results indicate that few phylogenetic clades concentrate a great fraction of the extinction-risk gradient in the endemic flora of the western Mediterranean, and monitoring programs should pay particular attention to these extinction-prone lineages (Table 1 and Figure 3).
The Caryophyllales clade, and particularly the subclade Plumbaginaceae, stood out as the main threat-accumulating lineage for CR, EN, and VU categories. This pattern is supported by previous non-phylogenetic studies that showed a significant association between several Caryophyllales representatives such as Limonium (Plumbaginaceae), Armeria (Plumbaginaceae), Silene (Caryophyllaceae), or Petrocoptis (Caryophyllaceae) and high extinction risk (Buira et al., 2020). Most species in these genera are associated to coastal, rocky habitats, salt marshes and edaphic islands that are either naturally or anthropogenically fragmented, which may have largely contributed to their current threat status (Lienert, 2004). The genus Limonium (Plumbaginaceae) is well-known for its ability to produce apomictic off-spring (Róis et al., 2016), which may represent a particular adaptation to maintain small populations in fragmented landscapes. Many Alchemilla representatives (Rosaceae) show a similar apomictic reproduction mode and low-sized populations in restricted rocky habitats, and the clade was also identified as an endangered group (Table 1 and Figure 3). Delimiting taxonomic species within these species-rich genera is often difficult due to the overwhelming number of locally restricted microspecies they contain, which has resulted in many taxa being left out of current species-oriented conservation legislation (Ennos et al., 2005; Domínguez Lozano et al., 2007). The phylogenetic perspective presented here may help to bridge this gap between conservation law and threatened biodiversity, as many taxa that are taxonomically difficult to distinguish would be preemptively protected under the phylogenetic “umbrella”.
While few clades concentrated a great fraction of the extinction-risk gradient in the study area (Table 1 and Figure 3), others stood out as accumulators of species categorized as “least concern” instead, particularly the monocots and the asterids (Figure 4). Both clades include species-rich genera (e.g., Teucrium, Thymus, Linaria, Centaurea, Narcissus, and Festuca) that unlike the ones discussed earlier (e.g., Limonium, Armeria, and Potentilla) they do not appear to be particularly threatened (with the exception of Taraxacum, Table 1). A considerable number of these unthreatened endemic species occur in mountainous habitats of the study area (Buira et al., 2020), which might be acting as refugia against extinction. However, increasing global warming cast reasonable doubts on the persistence of these putative refugia (Ohlemüller et al., 2008), which makes long-term monitoring programs in mountainous areas such as the GLORIA, 2020 project1 an indispensable reference for policy makers.
Although threatened species were overall more clumped in the phylogeny than unthreatened ones (Figure 1), we found that IUCN categories showed contrasting phylogenetic diversity values. As such, EN and CR species were phylogenetically clumped, but VU species were not. This suggests that the trend toward phylogenetic clustering in extinction risk reported here (Figure 1 and Supplementary Figure 3) is driven by the most threatened species. In a previous study conducted in the Eastern Arc Mountains biodiversity hotspot in Africa, Yessoufou et al. (2012) found just the opposite pattern, this is, phylogenetic clustering in VU and random pattern in EN and CR categories. These authors conducted their analyses on the native flora of Tanzania regardless of the endemic status of the species, while we focused on the endemic flora of the Iberian Peninsula, which is largely concentrated in species-rich lineages that have experienced recent evolutionary diversification during the late Pliocene and Quaternary (Rundel et al., 2016). Some authors have reported a tight relationship between young and fast-evolving plant lineages (neo-endemics) and high extinction risk (Davies et al., 2011; Tanentzap et al., 2020), which may explain the discrepancies between our findings and the study by Yessoufou et al. (2012). Further, our results support the idea that evolutionary history itself might be an important predictor of extinction risk, to the extent that the latter could be simply determined by differential diversification rates between lineages (Davies et al., 2011; Tanentzap et al., 2020). Nonetheless, such hypothesis is yet to be confirmed for the endemic flora of the western Mediterranean.
It is remarkable that although the gaps of information in the conservation status of Iberian endemics did not affect the phylogenetic patterns reported here, species categorized as “Data Deficient” (DD) and “Not Evaluated” (NE) were strongly clumped in the phylogeny (Supplementary Figure 1). The significant relatedness among DD species may respond to the taxonomic challenge posed by the clades where these species are largely clumped, namely Rosaceae (mostly Alchemilla and Rubus) and Taraxacum (Supplementary Figure 14). As such, these species are often referred to as aggregates in the botanical literature (i.e., group of similar species) due to extreme lack of consistency in diagnostic traits (Graham and Woodhead, 2009) or simply because they have remained understudied. On the other hand, many Poaceae and Asteraceae species that are endemic to the study area have been described very recently without being assigned a threat status, which may explain the overwhelming accumulation of NE species in the monocot and Asterales clades, respectively. Finally, lack of taxonomic consensus between specialists may have also contributed to the accumulation of NE species in certain groups that are currently evolving, such as Narcissus (monocots). Therefore, future conservation efforts should be directed to fill in these gaps of data if we are to take well-informed conservation actions to preserve the endemic flora of this emblematic hotspot in the western Mediterranean.
Data Availability Statement
The list of Iberian endemics and their IUCN status is provided as part of the Supplementary Material for this article.
Author Contributions
RM-V and JCM-S conceived the ideas. RM-V conducted the analyses and led the writing. JCM-S and IR-G compiled the dataset and contributed to the writing. IR-G contributed to Figure 1 (map). All authors approved the submitted version.
Funding
RM-V was supported by the TALENTO program (2018-T2/AMB-10332), and IR-G by the Garantía Juvenil program (PEJ-2018-AI/AMB-9865), both from the Regional Government of the Community of Madrid, Spain. This paper contributes to the project REMEDINAL TE (P2018/EMT-4338) from the Regional Government of the Community of Madrid.
Conflict of Interest
The authors declare that the research was conducted in the absence of any commercial or financial relationships that could be construed as a potential conflict of interest.
Acknowledgments
We thank the Scientific Computation Center of Andalusia (CICA) for the computing services they provided, and the Spanish Ministry of Agriculture, Food and Environment commissioned the project to award threat categories to the endemic flora of Spain.
Supplementary Material
The Supplementary Material for this article can be found online at: https://www.frontiersin.org/articles/10.3389/fevo.2020.571587/full#supplementary-material
Supplementary Appendix 1 | Supplementary results and species list.
Footnotes
References
Baselga, A., Orme, D., Villeger, S., de Bortoli, J., and Leprieur, F. (2018). betapart: Partitioning Beta Diversity into Turnover and Nestedness Components. R package version 1.5.1. Available online at: https://cran.r-project.org/web/packages/betapart/index.html (accessed April, 2020).
Bellard, C., Leclerc, C., Leroy, B., Bakkenes, M., Veloz, S., Thuiller, W., et al. (2014). Vulnerability of biodiversity hotspots to global change. Glob. Ecol. Biogeogr. 23, 1376–1386. doi: 10.1111/geb.12228
Bryant, J. A., Lamanna, C., Morlon, H., Kerkhoff, A. J., Enquist, B. J., and Green, J. L. (2008). Microbes on mountainsides: contrasting elevational patterns of bacterial and plant diversity. Proc. Natl. Acad. Sci. U.S.A. 105, 11505–11511. doi: 10.1073/pnas.0801920105
Buira, A., Cabezas, F., and Aedo, C. (2020). Disentangling ecological traits related to plant endemism, rarity and conservation status in the Iberian Peninsula. Biodivers. Conserv. 29, 1937–1958. doi: 10.1007/s10531-020-01957-z
Cardillo, M., Mace, G. M., Gittleman, J. L., Jones, K. E., Bielby, J., and Purvis, A. (2008). The predictability of extinction: biological and external correlates of decline in mammals. Proc. Biol. Sci. 275, 1441–1448. doi: 10.1098/rspb.2008.0179
Cardillo, M., and Meijaard, E. (2012). Are comparative studies of extinction risk useful for conservation? Trends Ecol. Evol. 27, 167–171. doi: 10.1016/j.tree.2011.09.013
Carta, A., Gargano, D., Rossi, G., Bacchetta, G., Fenu, G., Montagnani, C., et al. (2019). Phylogenetically informed spatial planning as a tool to prioritise areas for threatened plant conservation within a Mediterranean biodiversity hotspot. Sci. Total Environ. 665, 1046–1052. doi: 10.1016/j.scitotenv.2019.02.127
Chichorro, F., Juslén, A., and Cardoso, P. (2019). A review of the relation between species traits and extinction risk. Biol. Conserv. 237, 220–229. doi: 10.1016/j.biocon.2019.07.001
Cirtwill, A. R., Riva, G. V. D., Baker, N. J., Ohlsson, M., Norström, I., Wohlfarth, I.-M., et al. (2020). Related plants tend to share pollinators and herbivores, but strength of phylogenetic signal varies among plant families. New Phytol. 226, 909–920. doi: 10.1111/nph.16420
Davies, T. J. (2019). The macroecology and macroevolution of plant species at risk. New Phytol. 222, 708–713. doi: 10.1111/nph.15612
Davies, T. J., Smith, G. F., Bellstedt, D. U., Boatwright, J. S., Bytebier, B., Cowling, R. M., et al. (2011). Extinction risk and diversification are linked in a plant biodiversity hotspot. PLoS Biol. 9:e1000620. doi: 10.1371/journal.pbio.1000620
Davies, T. J., Wolkovich, E. M., Kraft, N. J. B., Salamin, N., Allen, J. M., Ault, T. R., et al. (2013). Phylogenetic conservatism in plant phenology. J. Ecol. 101, 1520–1530. doi: 10.1111/1365-2745.12154
Davies, T. J., and Yessoufou, K. (2013). Revisiting the impacts of non-random extinction on the tree-of-life. Biol. Lett. 9:20130343. doi: 10.1098/rsbl.2013.0343
Devesa, J. A., Catalán, P., Muller, J., Cebolla, C., and Rubio, E. O. (2013). Checklist de Festuca L. (Poaceae) en la Península Ibérica. Lagascalia 33, 183–274.
Domínguez Lozano, F., Moreno-Saiz, J. C., Sainz Ollero, H., and Schwartz, M. W. (2007). Effects of dynamic taxonomy on rare species and conservation listing: insights from the Iberian vascular flora. Biodivers. Conserv. 16, 4039–4050. doi: 10.1007/s10531-007-9206-2
Ennos, R. A., French, G. C., and Hollingsworth, P. M. (2005). Conserving taxonomic complexity. Trends Ecol. Evol. 20, 164–168. doi: 10.1016/j.tree.2005.01.012
Faith, D. P. (1992). Conservation evaluation and phylogenetic diversity. Biol. Conserv. 61, 1–10. doi: 10.1016/0006-3207(92)91201-3
Faith, D. P. (2018). “Phylogenetic diversity and conservation evaluation: perspectives on multiple values, indices, and scales of application,” in Phylogenetic Diversity: Applications and Challenges in Biodiversity Science, eds R. Scherson and D. P. Faith (New York, NY: Springer).
Galli, A., Moore, D., Brooks, N., Iha, K., and Cranston, G. (2012). Mediterranean Ecological Footprint Trends. Oakland, CA: Global Footprint Network (GFN).
GLORIA (2020). Global Observation Research Initiative in Alpine Environments. Available online at: https://gloria.ac.at/ (accessed February, 2020).
Godefroid, S., Janssens, S., and Vanderborght, T. (2014). Do plant reproductive traits influence species susceptibility to decline? Plant Ecol. Evol. 147, 154–164. doi: 10.5091/plecevo.2014.863
Graham, C. H., Storch, D., and Machac, A. (2018). Phylogenetic scale in ecology and evolution. Glob. Ecol. Biogeogr. 27, 175–187. doi: 10.1111/geb.12686
Graham, J., and Woodhead, M. (2009). “Raspberries and Blackberries: the Genomics of Rubus,” in Genetics and Genomics of Rosaceae. Plant Genetics and Genomics: Crops and Models, Vol. 6, eds K. M. Folta and S. E. Gardiner (New York, NY: Springer). doi: 10.1007/978-0-387-77491-6_24
Gumbs, R., Gray, C. L., Wearn, O. R., and Owen, N. R. (2018). Tetrapods on the EDGE: overcoming data limitations to identify phylogenetic conservation priorities. PLoS One 13:e0194680. doi: 10.1371/journal.pone.0194680
IUCN Standards and Petitions Committee (2019). Guidelines for Using the IUCN Red List Categories and Criteria. Version 14. Prepared by the Standards and Petitions Committee. Available online at: http://www.iucnredlist.org/documents/RedListGuidelines.pdf (accessed January, 2020).
Jin, Y., and Qian, H. (2019). V.PhyloMaker: an R package that can generate very large phylogenies for vascular plants. Ecography 42, 1353–1359. doi: 10.1111/ecog.04434
Kembel, S. W. (2009). Disentangling niche and neutral influences on community assembly: assessing the performance of community phylogenetic structure tests. Ecol. Lett. 12, 949–960. doi: 10.1111/j.1461-0248.2009.01354.x
Kembel, S. W., Cowan, P. D., Helmus, M. R., Cornwell, W. K., Morlon, H., Ackerly, D. D., et al. (2010). Picante: R tools for integrating phylogenies and ecology. Bioinformatics 26, 1463–1464. doi: 10.1093/bioinformatics/btq166
Klausmeyer, K. R., and Shaw, M. R. (2009). Climate change, habitat loss, protected areas and the climate adaptation potential of species in Mediterranean ecosystems worldwide. PLoS One 4:e6392. doi: 10.1371/journal.pone.0006392
Laity, T., Laffan, S. W., González-Orozco, C. E., Faith, D. P., Rosauer, D. F., Byrne, M., et al. (2015). Phylodiversity to inform conservation policy: an Australian example. Sci. Total Environ. 534, 131–143. doi: 10.1016/j.scitotenv.2015.04.113
Leprieur, F., Albouy, C., Bortoli, J. D., Cowman, P. F., Bellwood, D. R., and Mouillot, D. (2012). Quantifying phylogenetic beta diversity: distinguishing between ‘true’ turnover of lineages and phylogenetic diversity gradients. PLoS One 7:e42760. doi: 10.1371/journal.pone.0042760
Letcher, S. G. (2010). Phylogenetic structure of angiosperm communities during tropical forest succession. Proc. Biol. Sci. 277, 97–104. doi: 10.1098/rspb.2009.0865
Lienert, J. (2004). Habitat fragmentation effects on fitness of plant populations – a review. J. Nat. Conserv. 12, 53–72. doi: 10.1016/j.jnc.2003.07.002
Lughadha, N. E., Canteiro, C., Bachman, S., Baines, D., Gardiner, L., Meagher, T. R., et al. (2017). “Extinction risk and threats to plants,” in State of the World’s Plants 2017, ed. K. J. Willis (Richmond, VA: Royal Botanic Gardens), 72–77.
LVFVPC (2020). Lista Vermelha da Flora Vascular de Portugal Continental. https://listavermelha-flora.pt/ (accessed March 13, 2020).
Mankga, L. T., and Yessoufou, K. (2017). Factors driving the global decline of cycad diversity. AoB Plants 9:plx022. doi: 10.1093/aobpla/plx022
Marques, I., Aguilar, J. F., Martins-Loução, M. A., Moharrek, F., and Nieto Feliner, G. (2017). A three-genome five-gene comprehensive phylogeny of the bulbous genus Narcissus (Amaryllidaceae) challenges current classifications and reveals multiple hybridization events. Taxon 66, 832–854. doi: 10.12705/664.3
Medail, F., and Quezel, P. (1997). Hot-spots analysis for conservation of plant biodiversity in the Mediterranean Basin. Ann. MO. Bot. Gard. 84, 112–127. doi: 10.2307/2399957
Mittermeier, R. A., Robles, G. P., Hoffmann, M., Pilgrim, J., Brooks, T., Mittermeier, C. G., et al. (2004). Hotspots Revisited: Earth’s Biologically Richest and Most Endangered Ecoregions. Mexico: CEMEX.
Molina-Venegas, R., Aparicio, A., Lavergne, S., and Arroyo, J. (2015). The building of a biodiversity hotspot across a land-bridge in the Mediterranean. Proc. Biol. Sci. 282:20151116. doi: 10.1098/rspb.2015.1116
Molina-Venegas, R., Fischer, M., and Hemp, A. (2020a). Plant evolutionary assembly along elevational belts at Mt. Kilimanjaro: using phylogenetics to asses biodiversity threats under climate change. Environ. Exp. Bot. 170:103853. doi: 10.1016/j.envexpbot.2019.103853
Molina-Venegas, R., Fischer, M., Mollel, N. P., and Hemp, A. (2020b). Connecting plant evolutionary history and human well-being at Mt. Kilimanjaro, Tanzania. Bot. J. Linn. Soc 1:boaa049.
Moreno-Saiz, J. C. (ed.) (2008). “Lista Roja de la flora vascular española,” in Ministerio de Medio Ambiente y Medio Rural y Marino (Madrid: Sociedad Española de Biología de la Conservación de Plantas).
Moreno-Saiz, J. C., Iriondo, J. M., Martínez-García, F., Martínez, J., and Salazar-Mendias, C. (eds) (2019). “Atlas y libro rojo de la flora vascular amenazada de Espanþa. Adenda 2017,” in Ministerio para la Transicioìn Ecoloìgica (Madrid: Sociedad Española de Biología de la Conservación de Plantas).
Muñoz-Rodríguez, P., Munt, D. D., and Saiz, J. C. M. (2016). Global strategy for plant conservation: inadequate in situ conservation of threatened flora in Spain. Isr. J. Plant Sci. 63, 297–308. doi: 10.1080/07929978.2016.1257105
Ohlemüller, R., Anderson, B. J., Araújo, M. B., Butchart, S. H. M., Kudrna, O., Ridgely, R. S., et al. (2008). The coincidence of climatic and species rarity: high risk to small-range species from climate change. Biol. Lett. 4, 568–572. doi: 10.1098/rsbl.2008.0097
Ortega-Oliviencia, A., and Devesa, J. A. (2018). Updated checklist of Poa in the Iberian Peninsula and Balearic Islands. PhytoKeys 103, 27–60. doi: 10.3897/phytokeys.103.26029
Parra, J. L., McGuire, J. A., and Graham, C. H. (2010). Incorporating clade identity in analyses of phylogenetic community structure: an example with hummingbirds. Am. Nat. 176, 573–587. doi: 10.1086/656619
Pennell, M. W., Eastman, J. M., Slater, G. J., Brown, J. W., Uyeda, J. C., FitzJohn, R. G., et al. (2014). geiger v2.0: an expanded suite of methods for fitting macroevolutionary models to phylogenetic trees. Bioinformatics 30, 2216–2218. doi: 10.1093/bioinformatics/btu181
Purvis, A. (2008). Phylogenetic approaches to the study of extinction. Ann. Rev. Ecol. Evol. Syst. 39, 301–319. doi: 10.1146/annurev-ecolsys-063008-102010
Purvis, A., Gittleman, J. L., Cowlishaw, G., and Mace, G. M. (2000). Predicting extinction risk in declining species. Proc. Biol. Sci. 267, 1947–1952. doi: 10.1098/rspb.2000.1234
Qian, H., Jin, Y., and Ricklefs, R. E. (2017). Patterns of phylogenetic relatedness of angiosperm woody plants across biomes and life-history stages. J. Biogeogr. 44, 1383–1392. doi: 10.1111/jbi.12936
R Core Team (2020). R: A Language and Environment for Statistical Computing. Vienna: R Foundation for Statistical Computing.
Rangel, T. F., Colwell, R. K., Graves, G. R., Fučíková, K., Rahbek, C., and Diniz-Filho, J. A. F. (2015). Phylogenetic uncertainty revisited: implications for ecological analyses. Evolution 69, 1301–1312. doi: 10.1111/evo.12644
Revell, L. J. (2012). phytools: an R package for phylogenetic comparative biology (and other things). Met. Ecol. Evol. 3, 217–223. doi: 10.1111/j.2041-210X.2011.00169.x
Róis, A. S., Sádio, F., Paulo, O. S., Teixeira, G., Paes, A. P., Espírito-Santo, D., et al. (2016). Phylogeography and modes of reproduction in diploid and tetraploid halophytes of Limonium species (Plumbaginaceae): evidence for a pattern of geographical parthenogenesis. Ann. Bot. 117, 37–50. doi: 10.1093/aob/mcv138
Romero Zarco, C. (2015). Las Gramíneas de la Península Ibérica e Islas Baleares. Claves Ilustradas para la determinación de los Géneros y Catálogo Preliminar de las Especies. Monografías de Botánica Ibérica. País: España.
Rundel, P. W., Arroyo, M. T., Cowling, R. M., Keeley, J. E., Lamont, B. B., and Vargas, P. (2016). Mediterranean biomes: evolution of their vegetation, floras, and climate. Ann. Rev. Ecol. Evol. Syst. 47, 383–407. doi: 10.1146/annurev-ecolsys-121415-032330
Sala, O. E., Chapin, F. S., Iii, Armesto, J. J., Berlow, E., and Bloomfield, J. (2000). Global biodiversity scenarios for the year 2100. Science 287, 1770–1774. doi: 10.1126/science.287.5459.1770
Salvà, A. J. P. (2006). Nuevas combinaciones nomenclaturales y aportaciones florísticas en el género Orobanche L. (Orobanchaceae). Lagascalia 26, 246–248.
Saslis-Lagoudakis, C. H., Klitgaard, B. B., Forest, F., Francis, L., Savolainen, V., Williamson, E. M., et al. (2011). The use of phylogeny to interpret cross-cultural patterns in plant use and guide medicinal plant discovery: an example from Pterocarpus (Leguminosae). PLoS One 6:e22275. doi: 10.1371/journal.pone.0022275
Sodhi, N. S., Koh, L. P., Peh, K. S.-H., Tan, H. T. W., Chazdon, R. L., Corlett, R. T., et al. (2008). Correlates of extinction proneness in tropical angiosperms. Divers. Distrib. 14, 1–10. doi: 10.1111/j.1472-4642.2007.00398.x
Tanentzap, A. J., Igea, J., Johnston, M. G., and Larcombe, M. J. (2020). Does evolutionary history correlate with contemporary extinction risk by influencing range size dynamics? Am. Nat. 195, 569–576. doi: 10.1086/707207
The Plant List (2013). Version 1.1. Published on the Internet. Available online at: http://www.theplantlist.org/ (accessed January, 2020).
Villar, L., and García, B. (1989). Vers una banque de données des plantes vasculaires endémiques des Pyrénées. Acta Biol. Mont. 9, 216–274.
Willis, C. G., Ruhfel, B., Primack, R. B., Miller-Rushing, A. J., and Davis, C. C. (2008). Phylogenetic patterns of species loss in Thoreau’s woods are driven by climate change. Proc. Natl. Acad. Sci. U.S.A. 105, 17029–17033. doi: 10.1073/pnas.0806446105
Yessoufou, K., Daru, B. H., and Davies, T. J. (2012). Phylogenetic patterns of extinction risk in the Eastern Arc ecosystems, an African biodiversity hotspot. PLoS One 7:0047082. doi: 10.1371/journal.pone.0047082
Zozomová-Lihová, J., Marhold, K., and Španiel, S. (2014). Taxonomy and evolutionary history of Alyssum montanum (Brassicaceae) and related taxa in southwestern Europe and Morocco: diversification driven by polyploidy, geographic and ecological isolation. Taxon 63, 562–591. doi: 10.13039/501100000780
Keywords: IUCN categories, phylogenetic alpha diversity, phylogenetic beta diversity, phylogenetic signal, hot nodes, Iberian Peninsula, endemic flora
Citation: Molina-Venegas R, Ramos-Gutiérrez I and Moreno-Saiz JC (2020) Phylogenetic Patterns of Extinction Risk in the Endemic Flora of a Mediterranean Hotspot as a Guiding Tool for Preemptive Conservation Actions. Front. Ecol. Evol. 8:571587. doi: 10.3389/fevo.2020.571587
Received: 11 June 2020; Accepted: 02 October 2020;
Published: 23 October 2020.
Edited by:
David Jack Coates, Conservation and Attractions (DBCA), AustraliaReviewed by:
Angelino Carta, University of Pisa, ItalyKowiyou Yessoufou, University of Johannesburg, South Africa
Copyright © 2020 Molina-Venegas, Ramos-Gutiérrez and Moreno-Saiz. This is an open-access article distributed under the terms of the Creative Commons Attribution License (CC BY). The use, distribution or reproduction in other forums is permitted, provided the original author(s) and the copyright owner(s) are credited and that the original publication in this journal is cited, in accordance with accepted academic practice. No use, distribution or reproduction is permitted which does not comply with these terms.
*Correspondence: Rafael Molina-Venegas, rafmolven@gmail.com