Deer Behavior Affects Density Estimates With Camera Traps, but Is Outweighed by Spatial Variability
 Maik Henrich1,2*
  Florian Hartig3
  Carsten F. Dormann4
  Hjalmar S. Kühl5 Wibke Peters6 Frederik Franke6 Tomáš Peterka7,8 Pavel Šustr8 Marco Heurich1,2,9
- 1Wildlife Ecology and Wildlife Management, University of Freiburg, Freiburg, Germany
- 2Department of Visitor Management and National Park Monitoring, Bavarian Forest National Park, Grafenau, Germany
- 3Theoretical Ecology, University of Regensburg, Regensburg, Germany
- 4Institute of Biometry and Environmental System Analysis, University of Freiburg, Freiburg, Germany
- 5German Centre for Integrative Biodiversity Research (iDiv) Halle-Jena-Leipzig, Leipzig, Germany
- 6Department of Biodiversity, Conservation & Wildlife Management, Bavarian State Institute of Forestry, Freising, Germany
- 7Faculty of Forestry and Wood Sciences, Czech University of Life Sciences Prague, Praha-Suchdol, Czechia
- 8Šumava National Park, Kašperské Hory, Czechia
- 9Institute for Forest and Wildlife Management, Inland Norway University of Applied Sciences, Koppang, Norway
Density is a key trait of populations and an essential parameter in ecological research, wildlife conservation and management. Several models have been developed to estimate population density based on camera trapping data, including the random encounter model (REM) and camera trap distance sampling (CTDS). Both models need to account for variation in animal behavior that depends, for example, on the species and sex of the animals along with temporally varying environmental factors. We examined whether the density estimates of REM and CTDS can be improved for Europe’s most numerous deer species, by adjusting the behavior-related model parameters per species and accounting for differences in movement speeds between sexes, seasons, and years. Our results showed that bias through inadequate consideration of animal behavior was exceeded by the uncertainty of the density estimates, which was mainly influenced by variation in the number of independent observations between camera trap locations. The neglection of seasonal and annual differences in movement speed estimates for REM overestimated densities of red deer in autumn and spring by ca. 14%. This GPS telemetry-derived parameter was found to be most problematic for roe deer females in summer and spring when movement behavior was characterized by small-scale displacements relative to the intervals of the GPS fixes. In CTDS, density estimates of red deer improved foremost through the consideration of behavioral reactions to the camera traps (avoiding bias of max. 19%), while species-specific delays between photos had a larger effect for roe deer. In general, the applicability of both REM and CTDS would profit profoundly from improvements in their precision along with the reduction in bias achieved by exploiting the available information on animal behavior in the camera trap data.
Introduction
Population densities and their trends provide essential information in ecological research, wildlife management and biodiversity conservation (Gibbs et al., 1998; Barnes et al., 2016). For example, they are crucial for evaluating the success of conservation measures aimed at threatened species (Serrouya et al., 2019), for setting sustainable harvesting quotas (Clausen et al., 2017), for determining the influence of keystone species on the ecosystem (Siddig et al., 2016) and for tracking the spread of invasive species (Bogich et al., 2008). Additionally, they serve as key parameters for fundamental research on habitat use and trophic cascades (Berger et al., 2008; Filla et al., 2017).
Since complete animal counts are rarely feasible in practice, population densities are usually estimated based on indirect observations, such as tracks, feces or hair samples (Silveira et al., 2003; Campbell et al., 2004), or from a limited number of direct local observations. In the latter case, a proven method relies on live-trapping animals, marking them and quantifying the proportion of marked individuals in recaptures (Otis et al., 1978; Efford, 2004). Alternative minimally invasive forms of data collection have been facilitated by the increased availability of remote sensors, such as camera traps (Delisle et al., 2021), which can operate at multiple locations over long periods. Additional advantages include their relatively low long-term cost, low levels of expertise required for fieldwork and diverse analysis options (Silveira et al., 2003; Rovero et al., 2013; Burton et al., 2015).
Estimates of population size or density can be derived from camera trapping data based on a known number of animals, whenever at least a proportion of the individuals in a population can be identified visually (Chandler and Royle, 2013; Gilbert et al., 2021). While techniques such as spatially explicit capture-recapture (Efford, 2004; Efford and Fewster, 2013) are widely used for naturally marked felids (Karanth, 1995; Palmero et al., 2021), the identification of individuals is not possible for the majority of wildlife species (Rowcliffe et al., 2008). In these cases, researchers have often used trapping rates (observations per unit time) as an index of abundance (Gilbert et al., 2021). Trapping rates are, however, influenced by many factors other than animal density (Burton et al., 2015; Hofmeester et al., 2019). Animal behavior is a particularly important aspect governing the probability that an individual will encounter a camera trap (Hofmeester et al., 2019). It includes the selection for and avoidance of habitat features, leading to a heterogeneous distribution of individuals across the landscape and potentially large differences in encounter probabilities. Furthermore, animal movement speed has a strong impact on trapping rates: Populations of animals that move on average faster through the landscape, are more likely to encounter one of the cameras in a given camera trap cluster (Gurarie and Ovaskainen, 2013; Broadley et al., 2019).
Obtaining estimates of absolute population densities of unmarked species thus requires models that incorporate these factors, either inherently by design or explicitly as additional parameters. In order to generate density estimates that are representative of an entire area, camera trap placement needs to be random with respect to habitat features (Rowcliffe et al., 2013; Cusack et al., 2015). While this is a prerequisite for all methods developed to date, there are multiple approaches to account for animal movement speed. The first of these approaches was introduced by the random encounter model (REM), which directly incorporates a movement speed parameter (Rowcliffe et al., 2008) that is often derived from telemetry data (Rovero and Marshall, 2009; Zero et al., 2013; Anile et al., 2014; Balestrieri et al., 2016; Caravaggi et al., 2016; Marcon et al., 2020). To avoid the substantial underestimation of travel distances resulting from the summation of straight-line displacements between GPS fixes (Rowcliffe et al., 2012), recent techniques, such as continuous-time movement modeling, can use the autocorrelation in the data to simulate more realistic, tortuous movement paths (Noonan et al., 2019) (Supplementary Figure 7). However, since animal movement is motivated by complex interactions of internal and external factors, including food availability, reproduction and risk avoidance (Nathan et al., 2008), variation in the sex ratio of the population as well as seasonal or annual changes in biotic and climatic features might influence average movement speeds. If GPS telemetry and camera trapping are not conducted exactly in the same period and area, there might be a mismatch between the estimated movement speed and the movement speed shaping trapping rates, causing bias in REM estimates. Another potential source of bias in the REM is the correct estimation of group sizes, whenever independent encounters between animals and camera traps involve cohesive groups instead of individuals. A group size parameter is added to the REM in this case (Rowcliffe et al., 2008; Zero et al., 2013). The greater the spatial dispersal of groups of unmarked animals, the more easily this parameter may be underestimated based on camera trap observations.
In contrast to the REM, camera trap distance sampling (CTDS) (Howe et al., 2017) does not require a movement parameter. Instead, it derives information on animal movement from the camera trap observations themselves. Animals are counted during so-called snapshot moments, i.e., at known intervals at which they can be potentially photographed. Each snapshot moment may coincide with an observation of one or more animals. The number of snapshot moments with observations of the same animal crossing the field of view can thus be regarded as an indicator of that animal’s movement speed. Since resting animals are rarely observed by camera traps, an estimate of the daily proportion of time spent active is also needed. It can be obtained from a circular probability density function fitted to the daily distributions of the camera trap observations (Rowcliffe et al., 2014). Variable staying times of animals in the field of view contribute to the importance of random camera trap placement for this method, since resting, foraging or locomotion may have a strong connection to certain habitats (Mysterud and Ims, 1998) and the proportions of these behaviors in the camera trap observations should be representative of the whole study area. Behavioral responses of animals to the presence of a camera trap may also affect their staying times in the field of view, thereby creating a systematic bias in CTDS estimates. For example, based on observations of 14 species in the African rainforest, Bessone et al. (2020) found varying degrees of behavioral reactions to camera traps, leading to increased staying times for seven of those species. In the most extreme case, population density estimates of forest elephants (Loxodonta cyclotis) were inflated by >100-fold. Animal behavior may also influence the choice of an appropriate snapshot interval: When motion-triggered photos are used for CTDS, the movement of an animal within the field of view needs to be sufficient to trigger the camera trap repeatedly. If there are differences in the frequency of such movements between species, snapshot intervals will need to be adjusted accordingly.
As the previous examples show, animal behavior affects population density estimation, both by REM and CTDS, although for different reasons. While some of these factors have been discussed in previous studies (e.g., Manzo et al., 2012; Bessone et al., 2020), a systematic analysis of the biases arising from their improper consideration in density estimation is lacking. In addition, the influence of the uncertainties in the estimation of model parameters on the precision of the density estimates is largely unknown.
These issues are addressed in the present study, which is based on a year-round camera trapping dataset of two deer species widely distributed in Europe: red deer (Cervus elaphus) and roe deer (Capreolus capreolus). The body mass of red deer is on average four to seven times larger than that of roe deer, for females and males, respectively (Geist and Bayer, 1988). In addition, red deer are more gregarious than roe deer and their home ranges in the same area are often at least four times larger (Barja and Rosellini, 2008; Richard et al., 2011). The populations of both species are currently increasing throughout most of their respective ranges (Linnell et al., 2020), providing increased opportunities for hunting and ecotourism but also causing extensive damage to forests and agricultural lands, increasing the number of collisions with vehicles and facilitating infectious disease transmission (MacMillan and Phillip, 2008; Valente et al., 2020). Reliable population density estimates are therefore essential to allow evidence-based management decisions (Apollonio et al., 2017).
We hypothesized that movement speed and activity estimates do not only differ between species, sexes and seasons, but also in their relationship with the observed trapping rates. In addition, we tested for species-specific differences in group cohesion, behavioral reactions to camera traps and delays between subsequent photos (Figure 1). In the next step, we explored the biases in REM and CTDS estimates that occur when these differences are not fully taken into account, as well as their magnitude relative to the overall precision. Finally, we assessed which model parameters have the largest impact on the precision of the density estimates.
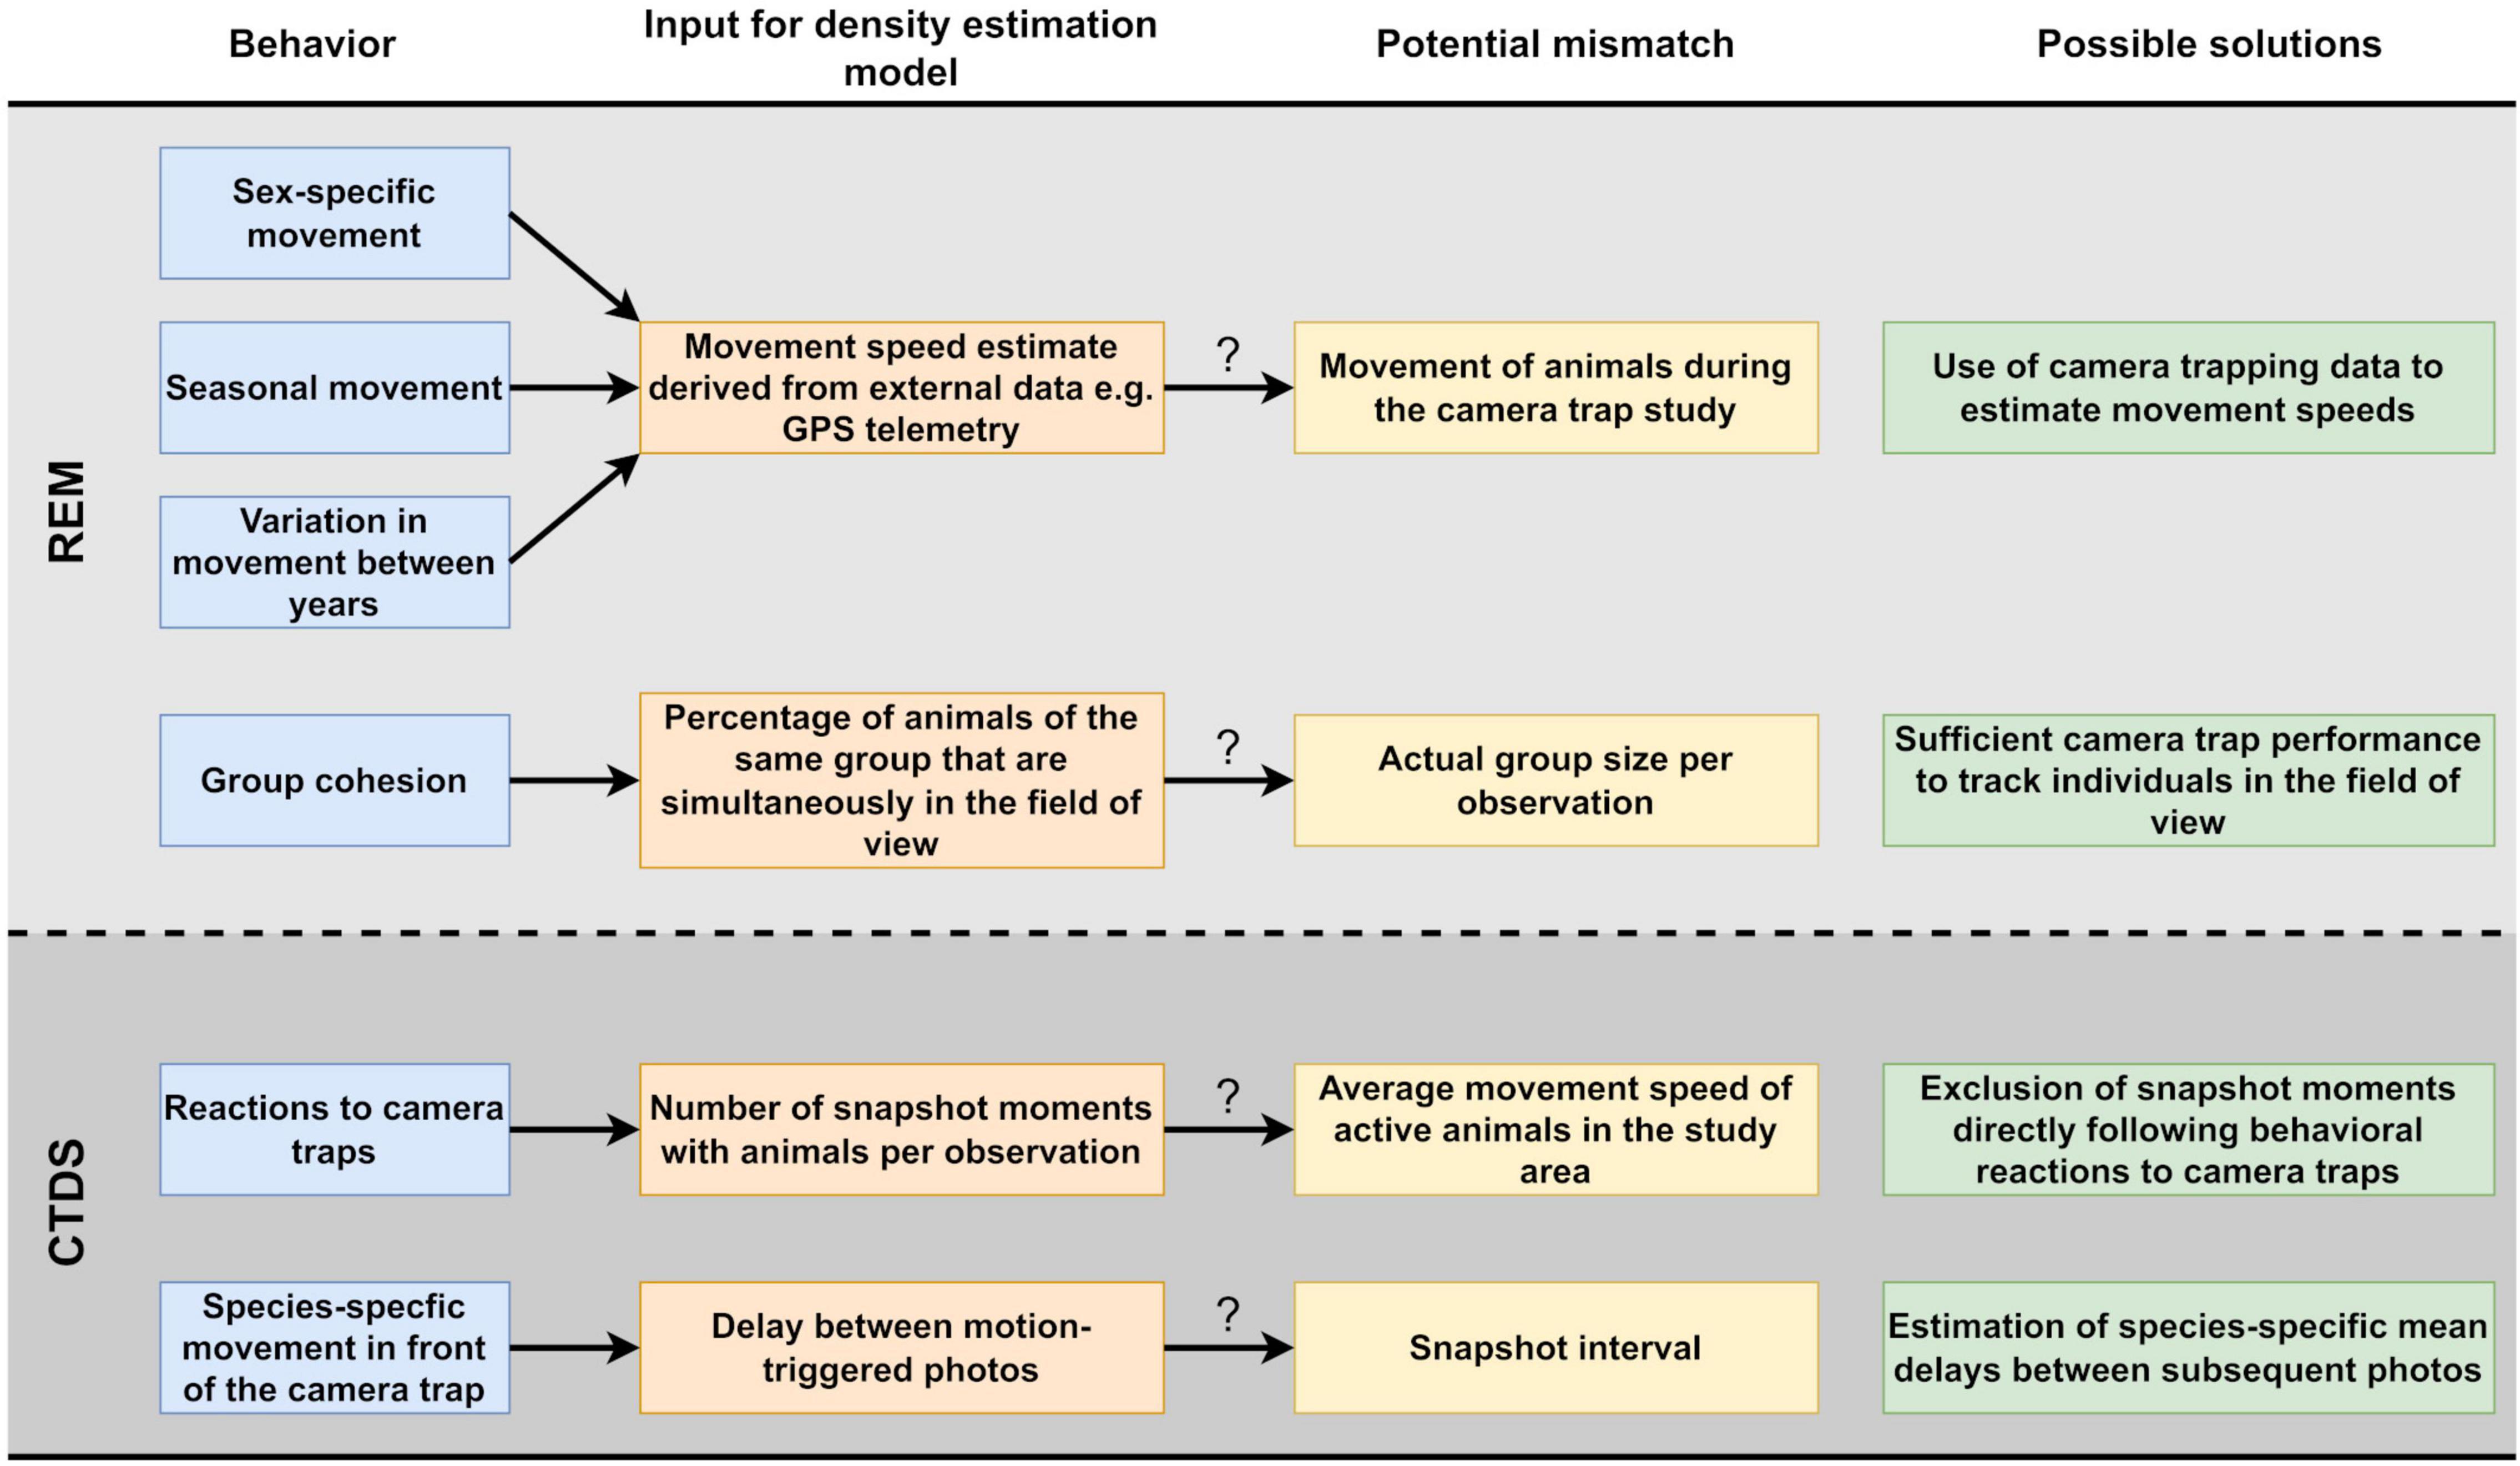
Figure 1. Potential problems caused by animal behavior in the estimation of population densities of unmarked animal species using camera traps and our proposed solutions.
Materials and Methods
Study Site
The 230-km2 site of our camera trap study was located within the Bavarian Forest National Park in south-eastern Germany and also covered parts of the neighboring Šumava National Park in the Czech Republic (Figure 2). The mountain range within the area encompasses an altitude between 570 and 1,453 m above sea level and is oriented from northwest to southeast. Annual mean temperatures decrease with elevation, from 7 to 3°C, and precipitation increases, from 1200 to 1850 mm (Ewald et al., 2011). The dominant habitat types are coniferous forest (43%) and mixed forest (31%) with Norway spruce (Picea abies), European beech (Fagus sylvatica) and white fir (Abies alba) (Cailleret et al., 2014; Pflugmacher et al., 2019). The study site within the national parks includes nature zones without forestry intervention (85% of the area), non-hunting zones (84%) and core zones within which human visitors are not allowed to leave the trails (49%). The red deer population is controlled by hunting between June and January, while roe deer have not been hunted since 2012. Natural predators of deer in the area are Eurasian lynx (Lynx lynx) and wolf (Canis lupus).
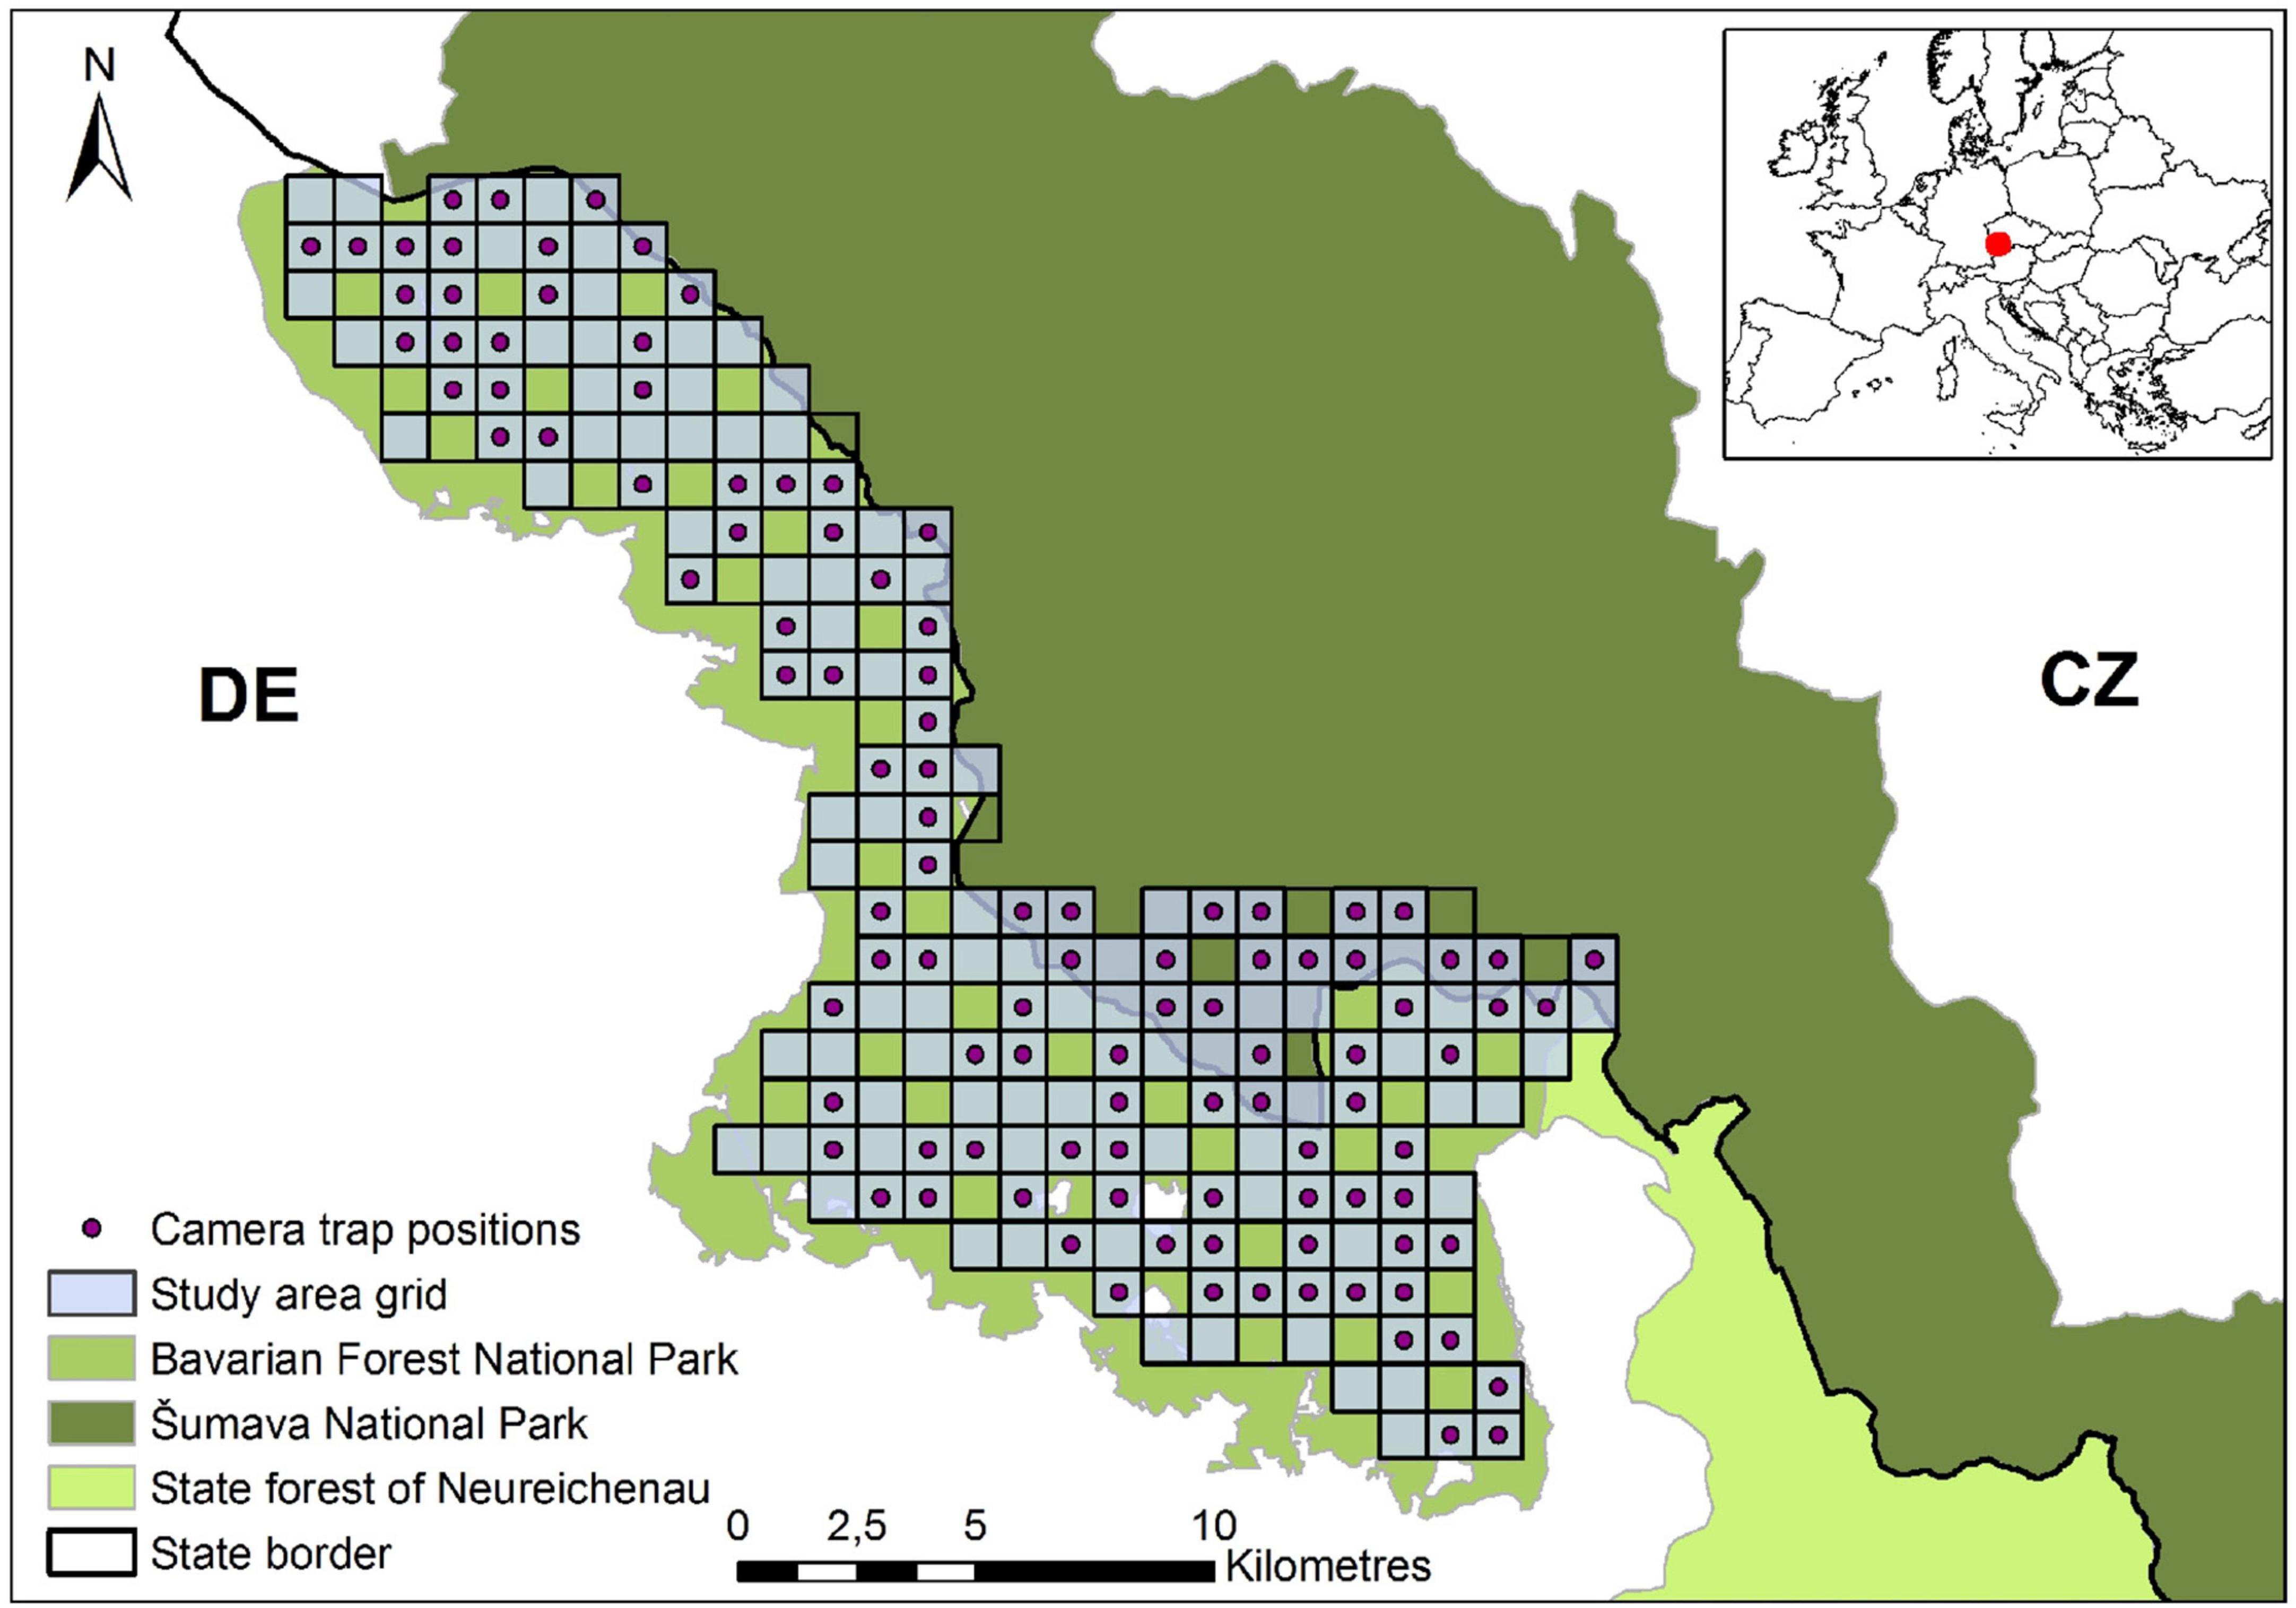
Figure 2. Locations of the camera trap positions within the study area grid, located at the border of Germany (DE) and Czechia (CZ).
Four winter enclosures within the study site allow the overwintering of red deer in an area outside their natural winter range, from which they are excluded by state law to minimize damage to agricultural fields and forests. Depending on the vegetation season and snow cover, the enclosures are maintained between October and January and opened between late March and mid-May (Möst et al., 2015).
Camera Trapping Design
Using a systematic-random design, we deployed 108 camera traps with infrared flash (C2, Cuddeback, Green Bay, WI, United States) for a period of one year (June 2018–May 2019). The delay between triggers was set to the minimum (“FAP”: fast as possible) and a series of five photos with the same timestamp was recorded each time the camera trap was triggered. The range of the flash was set to “far” and the field of the pyroelectric infrared sensor to “wide.” A daily time-lapse photo was taken from November 2018 onward to keep track of the time periods when the camera traps were covered by snow.
The study design was based on a grid of 1-km2 cells, which excluded settlements (three cells) and was subsampled to retain a subset of grid cells covering 80% of the site (Henrich et al., 2021). The camera traps were placed at the center coordinates of 108 cells randomly selected from the subsampled grid (Figure 2). In five cells, camera traps could not be installed within a 15-m radius around the selected locations, e.g., due to steep slopes or very dense vegetation, and had to be moved to randomly chosen replacement grid cells. The camera traps were mounted on tree trunks 60–70 cm above the ground, facing northeast to northwest to avoid backlighting. The vertical angle of the camera traps was adjusted to match the slope of the terrain.
The photo series were tagged in digiKam 5.7.0 with information on the number of adult animals per species and sex. If individuals could not be tracked throughout a series, the maximum number of animals in one photo of the series was used. Adult animals were also counted in the first photo of each series. Behavioral reactions of animals that moved their heads to face the camera trap or looked directly at the camera trap for several photos were categorized as neutral, attracted, or alarmed. The reactions were defined based on subsequent changes in the direction of movement of the animal, which might either not happen at all or be directed either towards or away from the camera trap. A record table was compiled using “camtrapR” (Niedballa et al., 2016). Independent observations were objectively defined based on a minimum time interval of 5 min between consecutive photos, following the same principle as Rovero and Marshall (2009) and Gray (2018) (see Supplementary Figure 1 for the effect of different time intervals on event numbers and Supplementary Table 1 for monthly sample sizes). Animals that were observed together were ascribed to the same group.
Camera traps that malfunctioned during the deployment period were assumed to have stopped working the day after recording the last photo. Days when the camera trap lenses were partially covered by snow were not included in trapping rate computations.
Model Parameters
Estimation of the Effective Detection Zone (Random Encounter Model)/Detection Probability (Camera Trap Distance Sampling)
The effective detection radius of REM can be easily transformed into the detection probability parameter of CTDS and vice versa (Table 1). Ten events per species were randomly sampled for each camera trap position and month to estimate these parameters (see Supplementary Figure 3 for the sensitivity analysis). As a reference, the camera traps were triggered to photograph a ranging pole at distances of 1–15 m in 1-m steps along their visual axis. These reference photos were taken during camera trap controls in summer and autumn (July 21, 2018–September 21, 2018). Transparent photos of the ranging poles were superimposed on the first photo of each event containing a visible animal to estimate the animal’s distance to the camera trap along the visual axis. The observation distance to the deer that moved the furthest into the field of view upon first detection was determined trigonometrically, by taking the horizontal distance to the visual axis into account (Pfeffer et al., 2018).
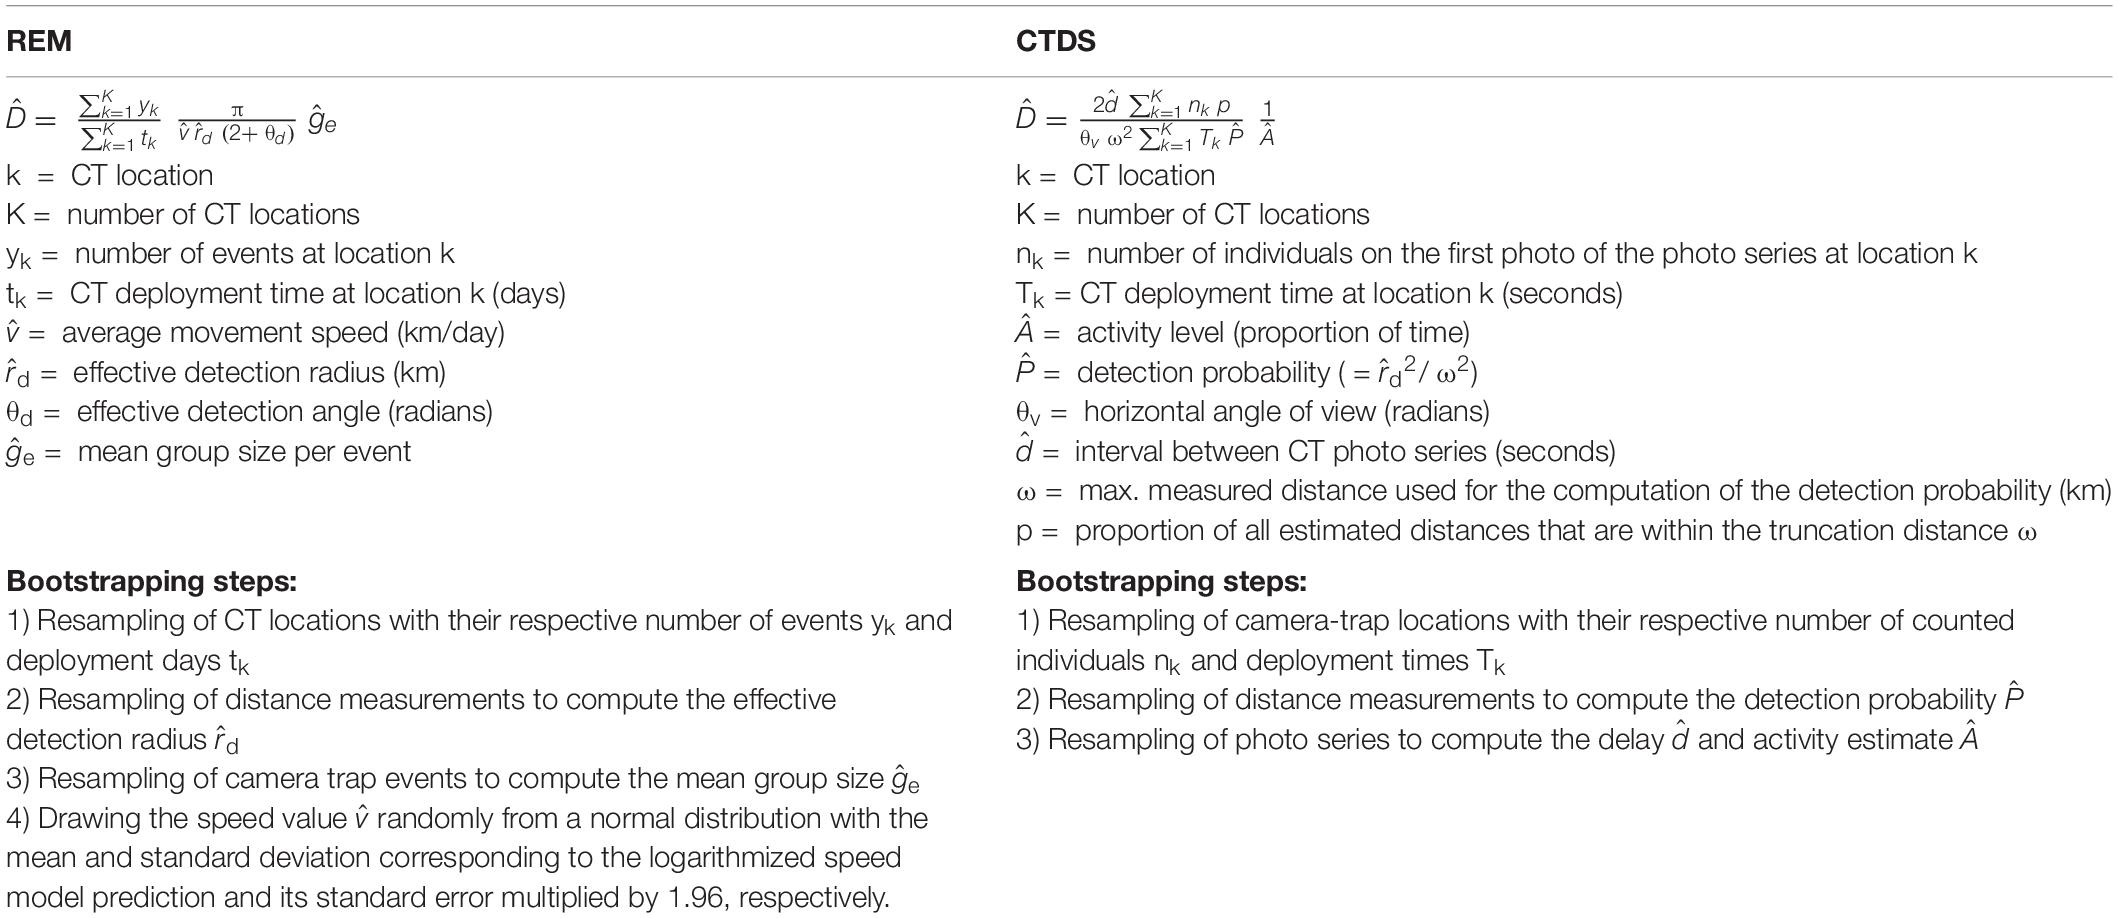
Table 1. Overview of the parameters of the random encounter model (REM) and camera trap distance sampling (CTDS) as adapted for use in this camera trap (CT) study. Parameters accounting for similar influences are shown side by side in the two columns.
“Distance” 1.02 (Miller et al., 2019) was used to calculate the detection probability and effective detection radius d for each species and season (summer = June–August, autumn = September–November, winter = December–February, spring = March–May) (see Supplementary Figure 4 for the fitted detection functions). The range of observation distances was truncated at 14.5 m, because all distances >15 m were out of range of the reference photographs depicting the ranging pole. Observation distances were sorted in 1-m bins. The exception was the first bin, which comprised all values up to 2.5 m, because distances were difficult to estimate when only parts of an animal were visible. Selection between half-normal detection functions with and without a cosine expansion term was based on Akaike’s information criterion. We restricted the set of models to choose from in order to avoid overfitting spikes in the data [see Supplementary Figures 10, 11 and Table 7 for the results of model selection with the nine candidate models of Howe et al. (2017)].
The effective detection angle of the REM θd was assumed to be the same as the optical angle of the camera trap (55°) since there was no indication that the distribution of observation angles deviated from uniformity (Supplementary Figure 5). It was therefore equivalent to the horizontal angle of view θv, which was used in CTDS.
Random Encounter Model
Movement speed estimates were based on GPS telemetry data of 159 red deer and 174 roe deer, which was collected in the Bavarian Forest National Park (89% forest cover), Šumava National Park (84% forest cover) and the neighboring state forest of Neureichenau (85% forest cover) between 2002 and 2019 (see Supplementary Figure 6 for sampling intervals). Outliers were identified based on the criteria of the EURODEER database (fulfillment of all of the following conditions: turning angle: 170–190°, step length: >5,000 m, speed: >15,000 m/s) and subsequently removed (Bjørneraas et al., 2010; Urbano and Cagnacci, 2014). The first week of collaring was excluded, to avoid possible behavioral anomalies resulting from capture (Morellet et al., 2009), as was the last day of available data for each individual. Data from the months during which a red deer individual was confined to a winter enclosure between October and May were filtered out based on a threshold of >10% of days per month featuring ≥90% of the hourly GPS fixes within the fenced area. Initial parameters were obtained for each individual and subsequently used to fit continuous-time movement models for each individual and month with at most two missing days (Calabrese et al., 2016; Noonan et al., 2019). A median GPS telemetry error of 10 m (Stache et al., 2012) was assumed for this step. Movement speed estimates and their confidence intervals were derived from simulated trajectories using the “speed” function, with the “fast” option enabled. Estimates across individuals were summarized in a meta-regression (“metafor”: Viechtbauer, 2010) of the logarithmic estimates and standard errors per species and sex, using month or season as a moderator. Year and individual were included as random effects. In accordance with recommendations to avoid bias, movement models with <10 degrees of freedom were not considered (Fleming, personal communication).
Average movement speed estimates were computed for all combinations of species, sex, and month to assess their relationship with the corresponding camera trapping rates using Spearman’s rank correlation test. Seasonal speed estimates per species for population density estimation were obtained by multiplying the sex-specific estimates by the proportion of that sex in the population, as determined for the periods described by Heurich et al. (2016) using the maximum number of females and males per event. Additionally, seasonal speed estimates were calculated for red deer females using GPS telemetry data obtained during the camera trapping period only. For roe deer and red deer males, no GPS data was available for that period.
A paired Wilcoxon signed rank test was employed to evaluate group cohesion, by comparing the group size per event based on either complete photo series or only the first photo of each series. Mean group sizes per event () were calculated for each species and season based on the maximum number of adults recorded in the photo series of the events. They were also computed for adult red deer females only.
Reference population densities estimates were generated for each species and season based on the number of events yk for adult red deer and roe deer and the deployment time tk (in days) at each camera trap location. Model parameters were generated under consideration of season (all of them), sex ratio (movement speed), and group size information from the whole photo series. Reference density estimates of red deer females enabled the use of year-specific movement speed estimates. Bias-corrected 95% confidence intervals (95% CIs) were obtained by non-parametric bootstrapping with 10,000 iterations (Table 1). The magnitude of potential biases in the density estimates was investigated by repeating the calculation of species-and season-specific density estimates (a) with males and females contributing equally to the speed estimate or (b) with movement speed estimates derived from year-round data or (c) with group size estimates based only on the first photo of the photo series. The density of female red deer was also computed using season- and sex-specific movement speed estimates inferred from GPS data collected outside of the camera trapping period. The 95% confidence intervals of the differences to the reference estimates were calculated based on the bootstrap results. Significant differences had confidence intervals that did not contain zero.
Camera Trap Distance Sampling
The time spent active was estimated based on the daily distribution of camera trapping events (“activity”: Rowcliffe, 2019). Activity estimates were calculated for all combinations of species, sex and month with a minimum sample size of ten events to analyze their relationship with the corresponding camera trapping rates using Spearman’s rank correlation test. Activity estimates were calculated per species and season to be used for population density estimation.
The number of photo series per event was compared with respect to species, season and behavioral reactions to the camera trap using a Poisson GLMM with nested random intercepts on the levels of the camera trap location and the observation (“glmmTMB”: Brooks et al., 2017). The response variable was transformed by subtracting 1 from all values to be able to correct for overdispersion. Model fit was checked with DHARMa (Hartig, 2020).
For each species, the mean delay between successive photos of the same animals in the field of view was estimated based on the time differences between photo series within events. The values were truncated at the third quartile q3 to exclude cases in which it was unclear whether an animal in the field of view could re-trigger the camera trap, e.g., because it was partly concealed by vegetation or the terrain. was defined as the mean for each species and replaced the pre-defined interval t between snapshot moments in the CTDS formula. The 95% confidence interval of the difference in between species was derived from bootstrapping with 10,000 iterations.
The sum nk of adult individuals of each species observed in the first photo of a photo series (= snapshot moment with animals) was computed for each season and camera trap location along with the deployment time Tk (in seconds). nk was corrected for the proportion of distance measurements p beyond the truncation distance ω (Table 1). For the reference density estimates, photo series directly following behavioral reactions to the camera trap within q3 were excluded, except in the case of alarmed responses, to account for prolonged staying times in front of the camera trap (Bessone et al., 2020). Furthermore, species-specific values were used for . Density estimation was repeated (d) with all photo series regardless of the occurrence of behavioral reactions or (e) with the parameter derived from observations of both red deer and roe deer. The confidence intervals of the estimates and the comparison to the reference estimates were inferred from bootstrapping with 10,000 iterations, analogous to REM.
Precision of Population Density Estimates
The impacts of the uncertainties in REM and CTDS parameters on the confidence intervals of the reference density estimates were assessed by running a linear regression with the bootstrapped density estimate as the dependent variable (n = 10,000). Model parameters that were resampled for each bootstrap iteration served as independent variables and interactions between all of them were included. For CTDS, nk was defined as the number of events multiplied by the average number of photo series per event multiplied by the average number of animals per photo series. The contributions of the model parameters to the model sum of squares were calculated by means of an ANOVA.
All analyses were conducted in R version 3.5.1 (R Core Team, 2019).
Results
Behavioral Parameters and Potential Sources of Bias in Density Estimates
Random Encounter Model
The estimated average movement speeds of red deer and roe deer showed considerable seasonal variation, dependent on the sex (Figure 3). There was a strong correlation between the number of events per day and the movement speed estimates of males of both species, but the relationship was not significant for red deer females and was even negative for roe deer females (Figure 4 and Supplementary Table 4). Neglecting seasonal variation for movement speed estimation meant overestimating red deer population densities by ∼14% in autumn and spring (Figure 5 and Table 2). In contrast, this type of error caused an underestimation (11%) of roe deer population densities in autumn. When GPS telemetry data originated from the correct season, but different years, population densities of red deer females were overestimated by up to 14% in autumn (Figure 6 and Table 2).
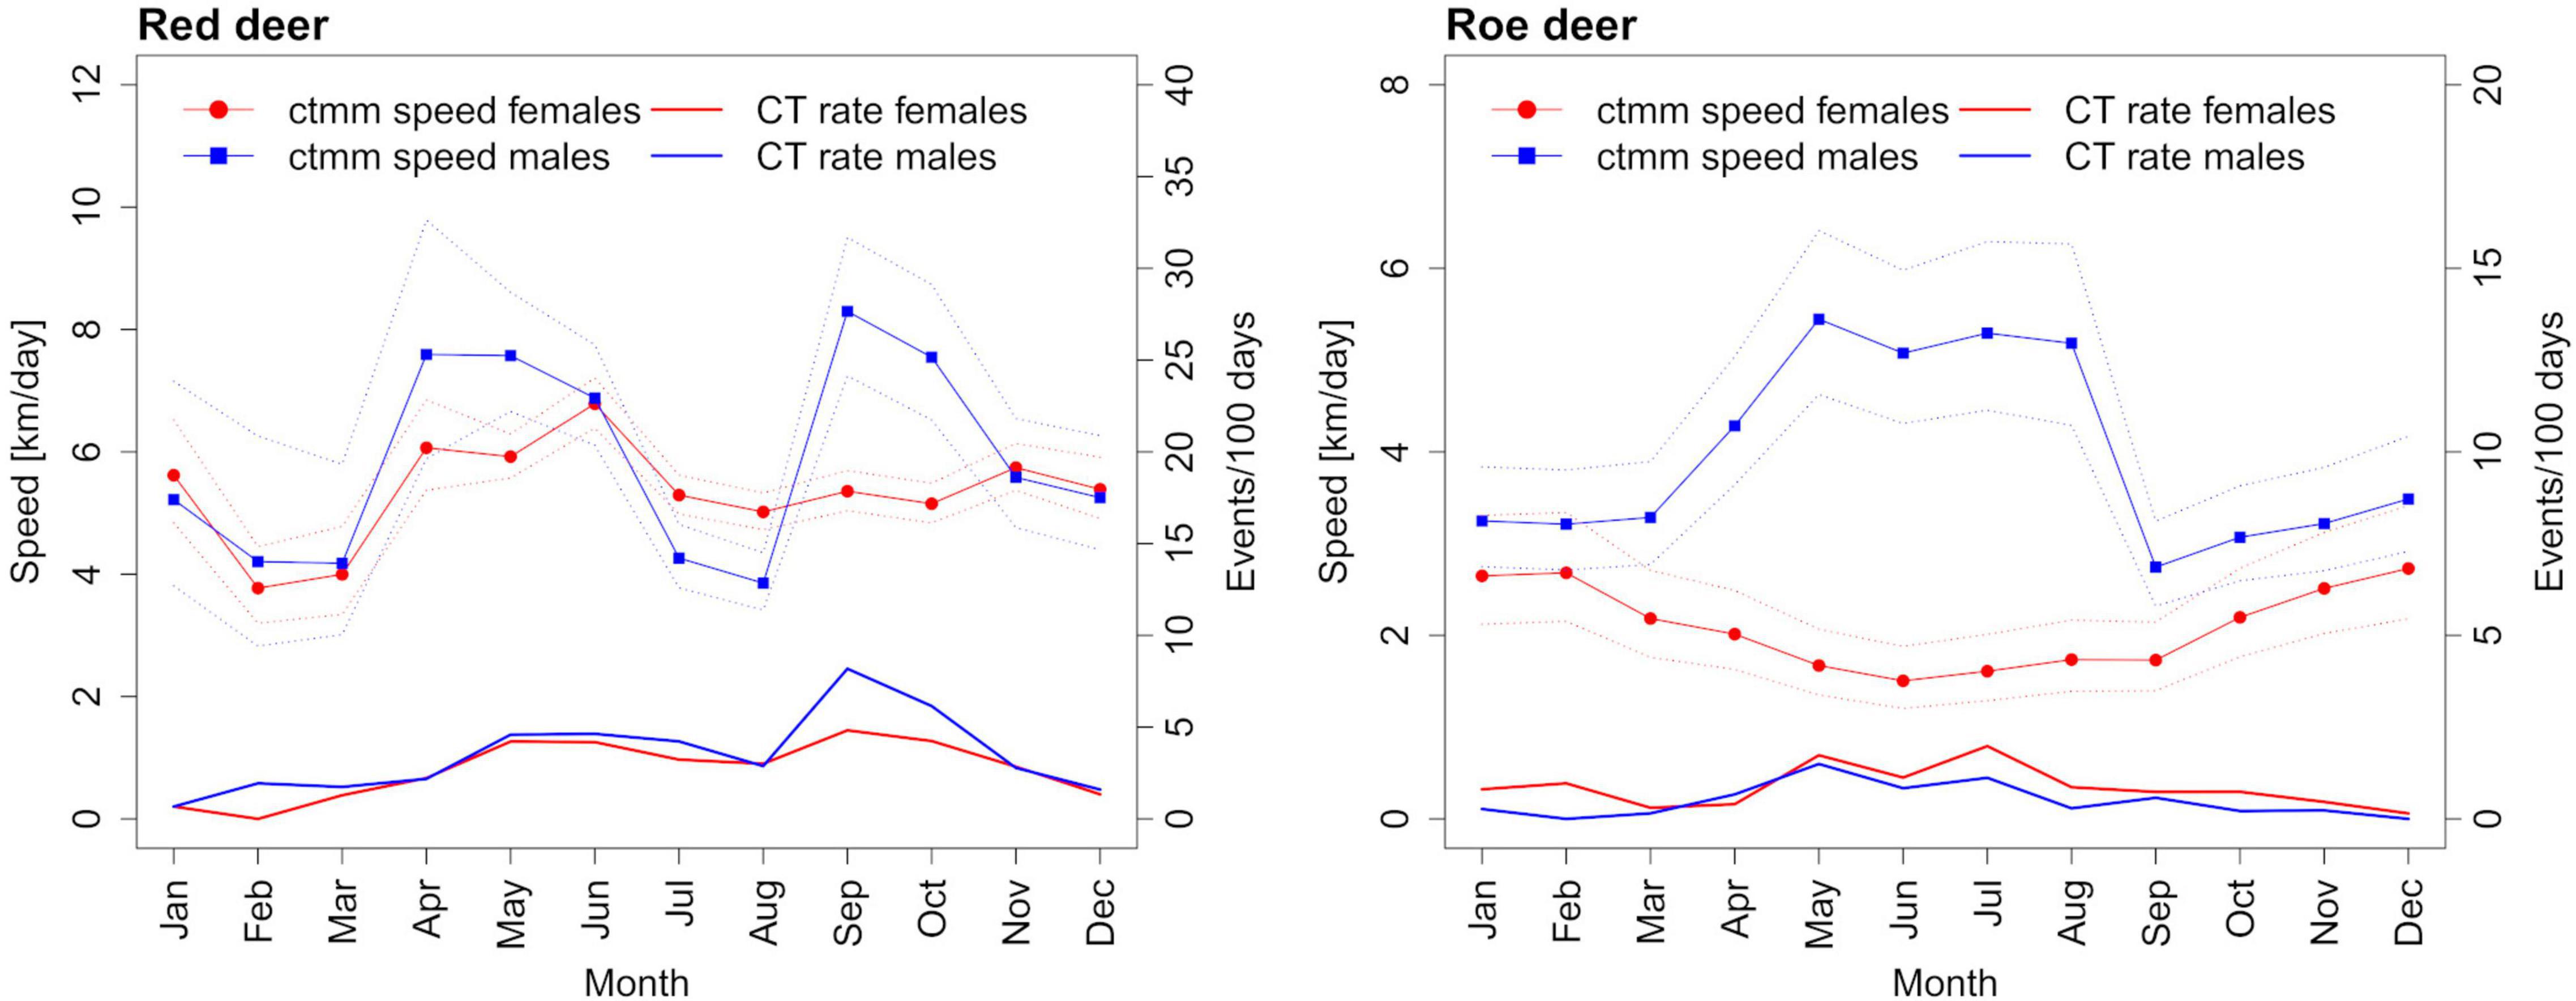
Figure 3. Seasonal trends in movement speed, as estimated by continuous time-movement modeling (ctmm), compared with the camera trapping (CT) rates.
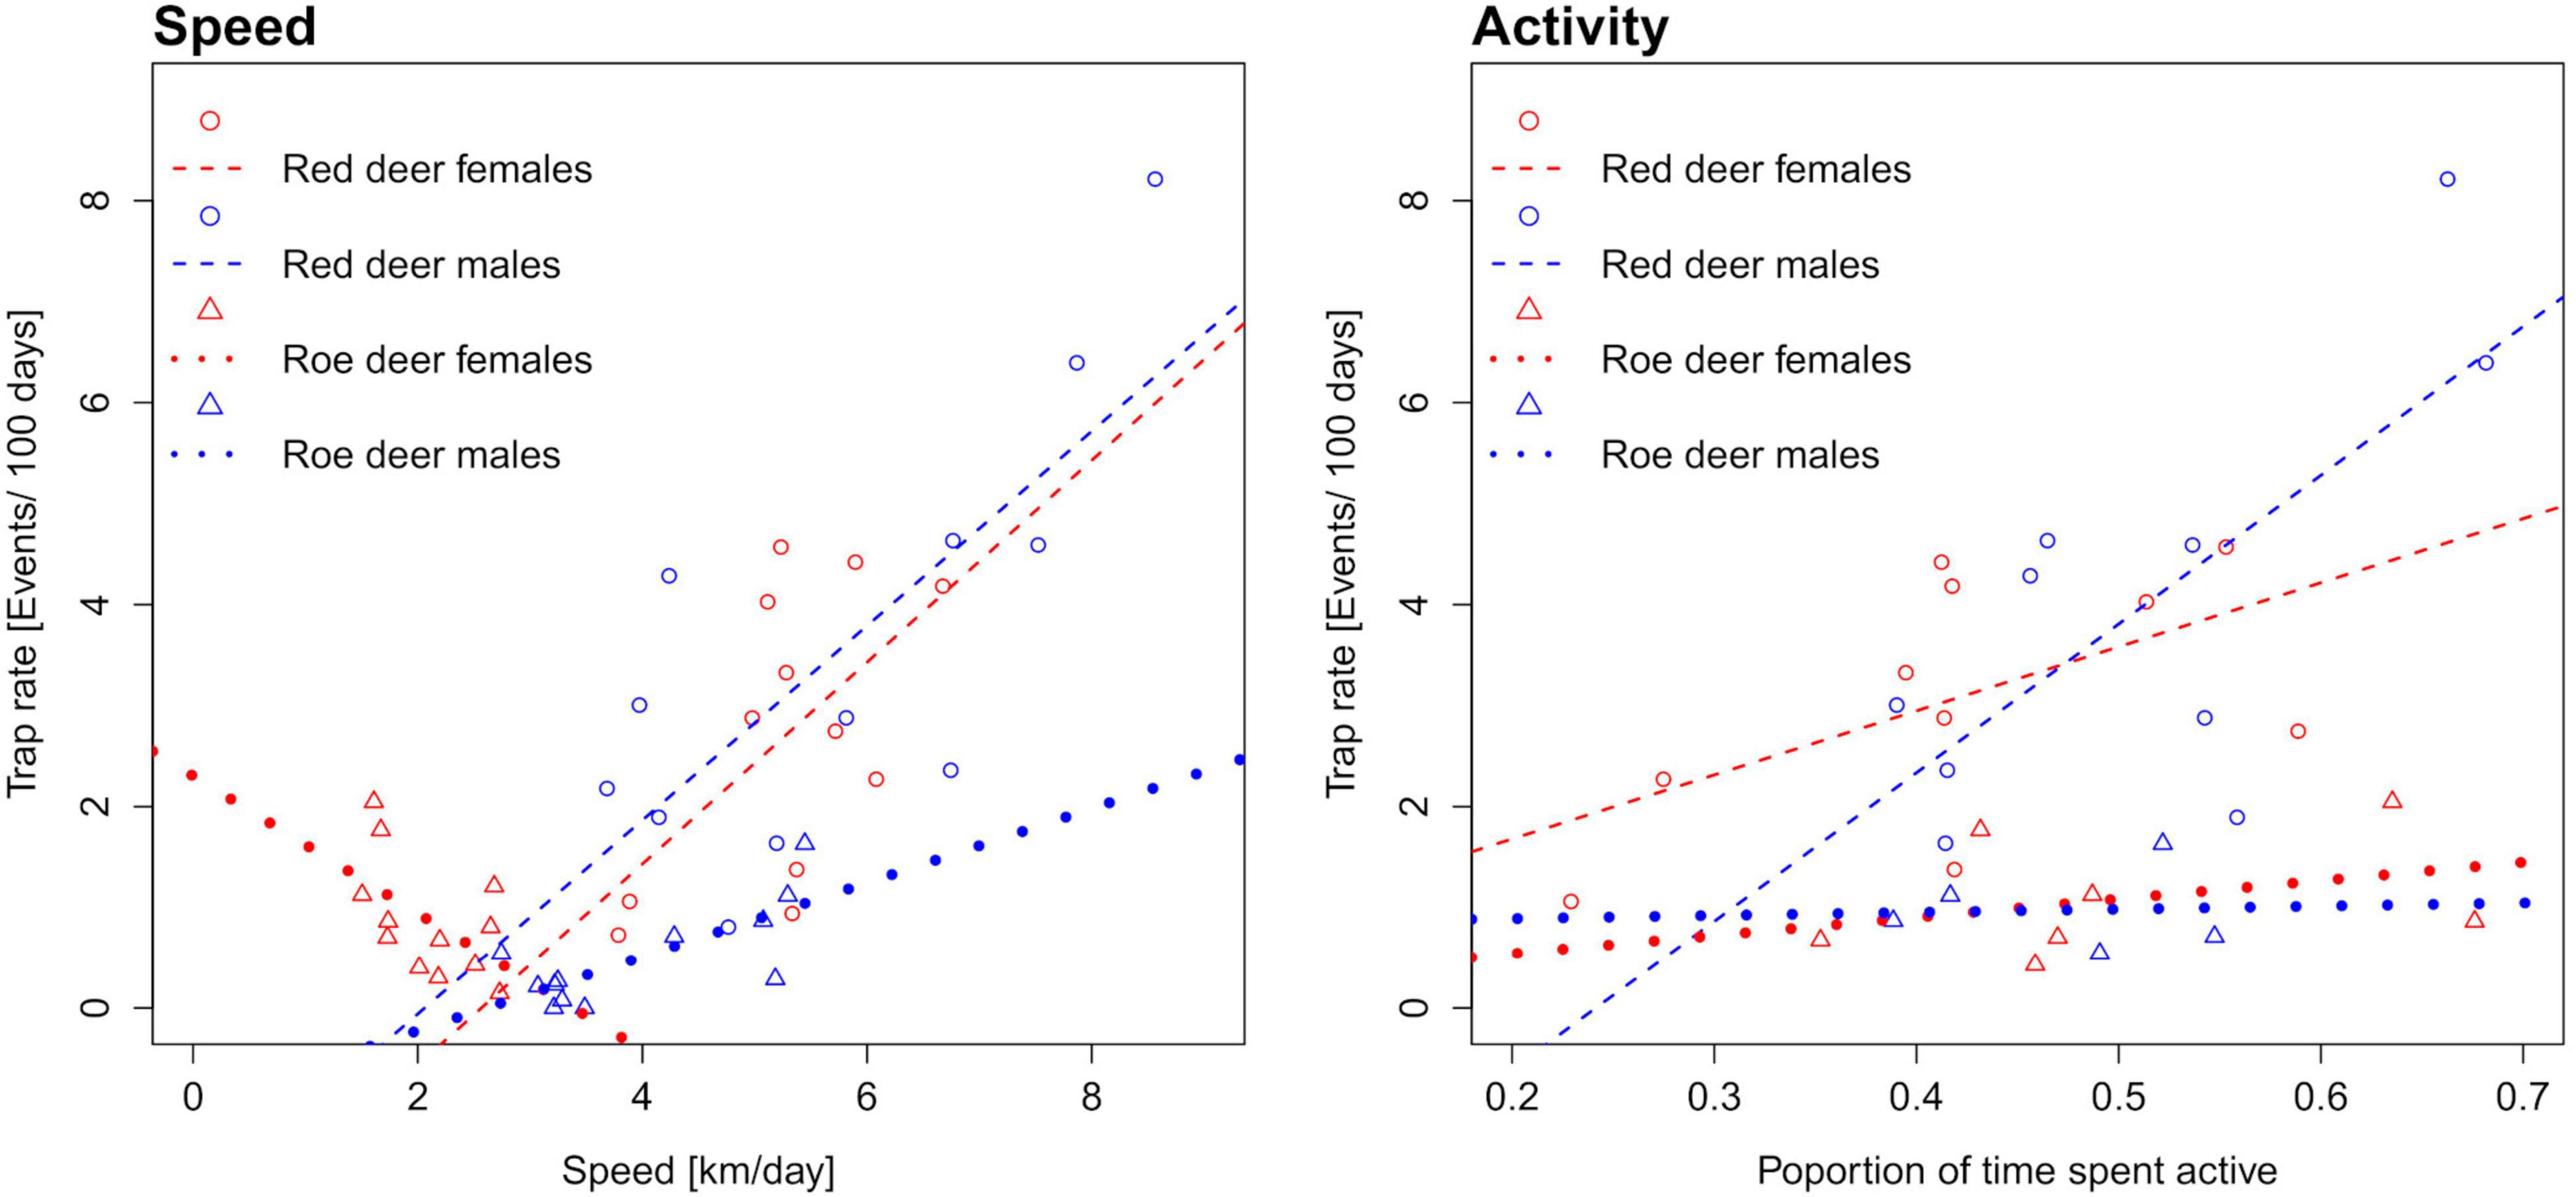
Figure 4. Correlation of monthly activity and movement speed estimates with the trapping rates of red deer and roe deer of both sexes. Activity estimates were computed for all months with at least ten events.
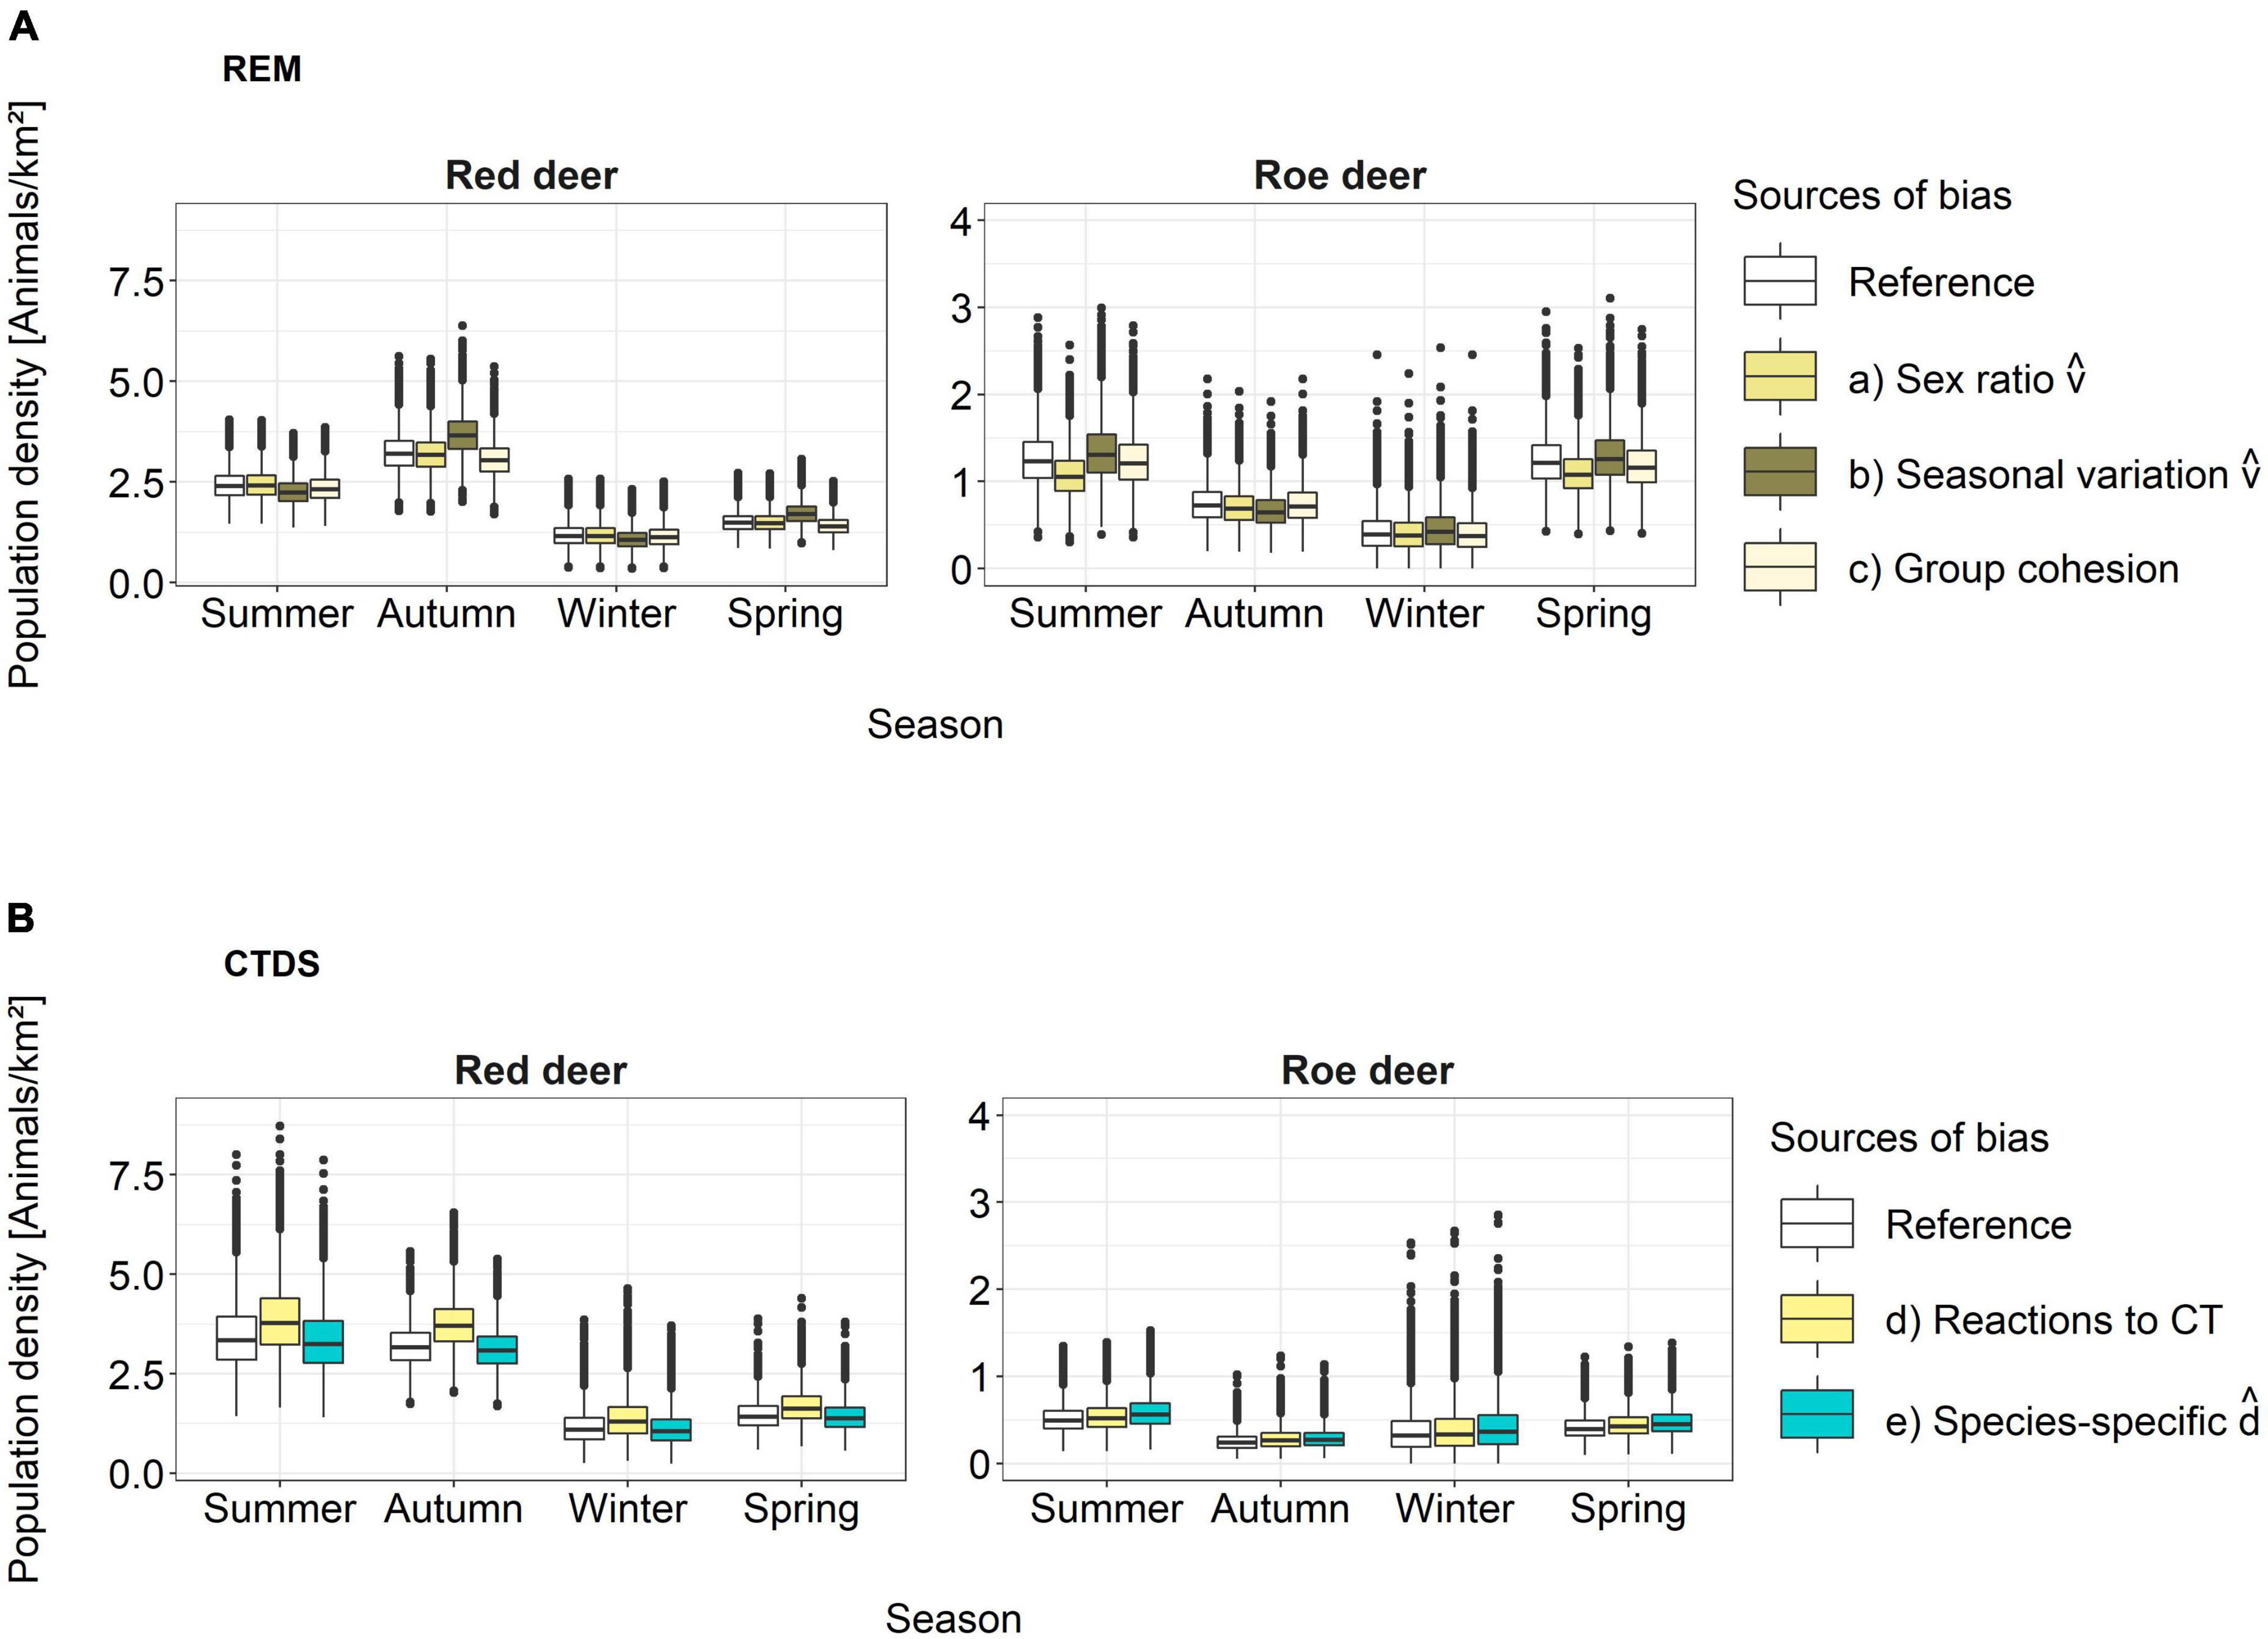
Figure 5. The influence of biased model parameters on population density estimates of REM and CTDS. These include (A) for REM, (a) the assumption of a balanced sex ratio, (b) the use of year-round GPS telemetry data to estimate movement speed and (c) the use of the first photo per series only for group size estimation, and (B) for CTDS, (d) the inclusion of photos regardless of behavioral reactions to camera traps and (e) the use of a non-species-specific mean delay between photo series .
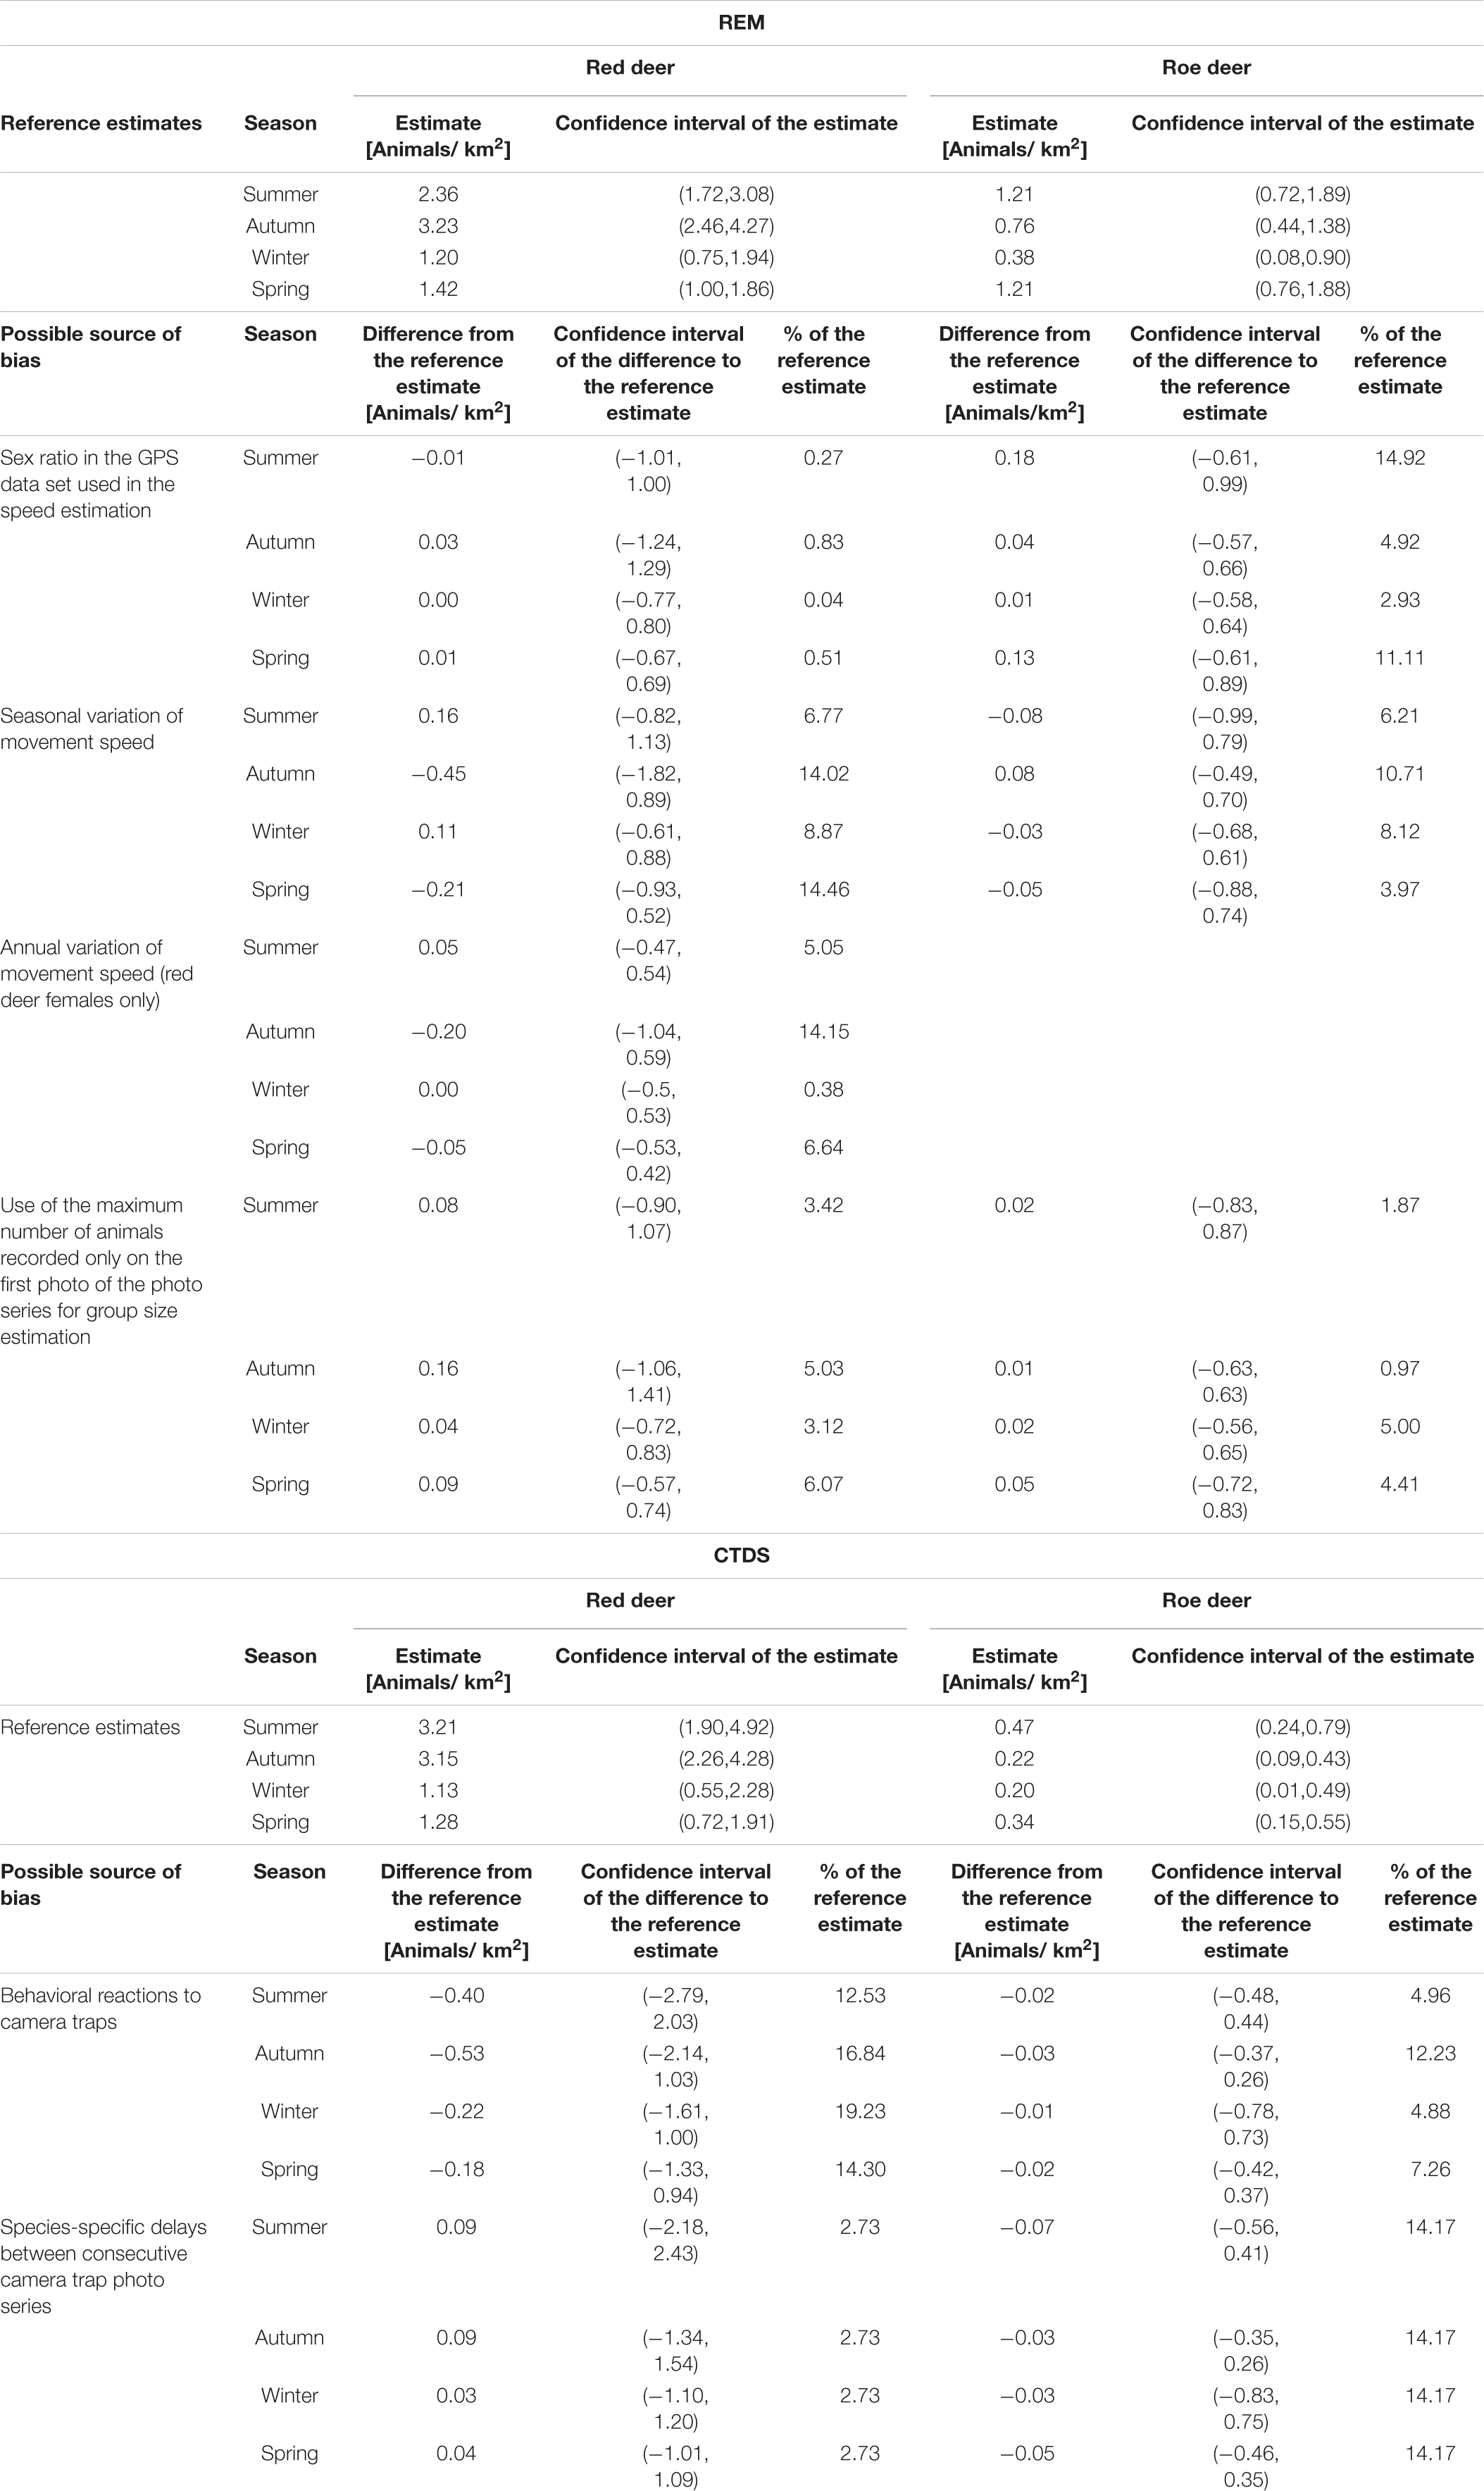
Table 2. Biases in population density estimates of REM and CTDS caused by insufficient consideration of animal behaviors in relation to the reference estimates that account for them.
Figure 6. Comparison between the REM estimates of red deer females obtained using speed estimates derived from GPS telemetry data from the study period and from other years. GPS telemetry data from the camera trap study period was available only for red deer females; therefore the analysis was restricted to this subgroup (number of individuals in the study period: 46, total number of collared red deer females: 104).
The sex ratio was balanced in red deer but shifted towards females in roe deer (red deer: 52% females, roe deer: 64% females). The assumption of a balanced sex ratio for the estimation of an average movement speed across a population therefore resulted in a bias of <1% in REM estimates for red deer but up to 15% for roe deer in summer relative to the reference estimate (Figure 5 and Table 2).
The mean difference between the group sizes derived from the whole photo series and their first photos only was 0.35 individuals for red deer and 0.23 individuals for roe deer (red deer: p < 0.001, roe deer: p = 0.03). The maximum bias in seasonal density estimates due to an underestimation of the group size parameter by only counting the individuals in the first photo of a series was 6% in spring for red deer and 5% in winter for roe deer (Figure 5 and Table 2).
Camera Trap Distance Sampling
Activity level estimates did not differ significantly between red deer and roe deer (Supplementary Table 2), but a positive correlation with camera trapping rates was only detected in red deer females and males combined (Figure 4 and Supplementary Table 4). The number of photos per event was significantly larger if an animal reacted to the camera trap, especially for an individual attracted to the device (Figure 7 and Supplementary Table 3). Events with behavioral reactions to camera traps were 15% more frequent for red deer than for roe deer. Failure to remove snapshot moments influenced by animal reactions to the camera traps led to a maximum positive bias in CTDS estimates of 19% for red deer in winter and 12% for roe deer in autumn (Figure 5 and Table 2).
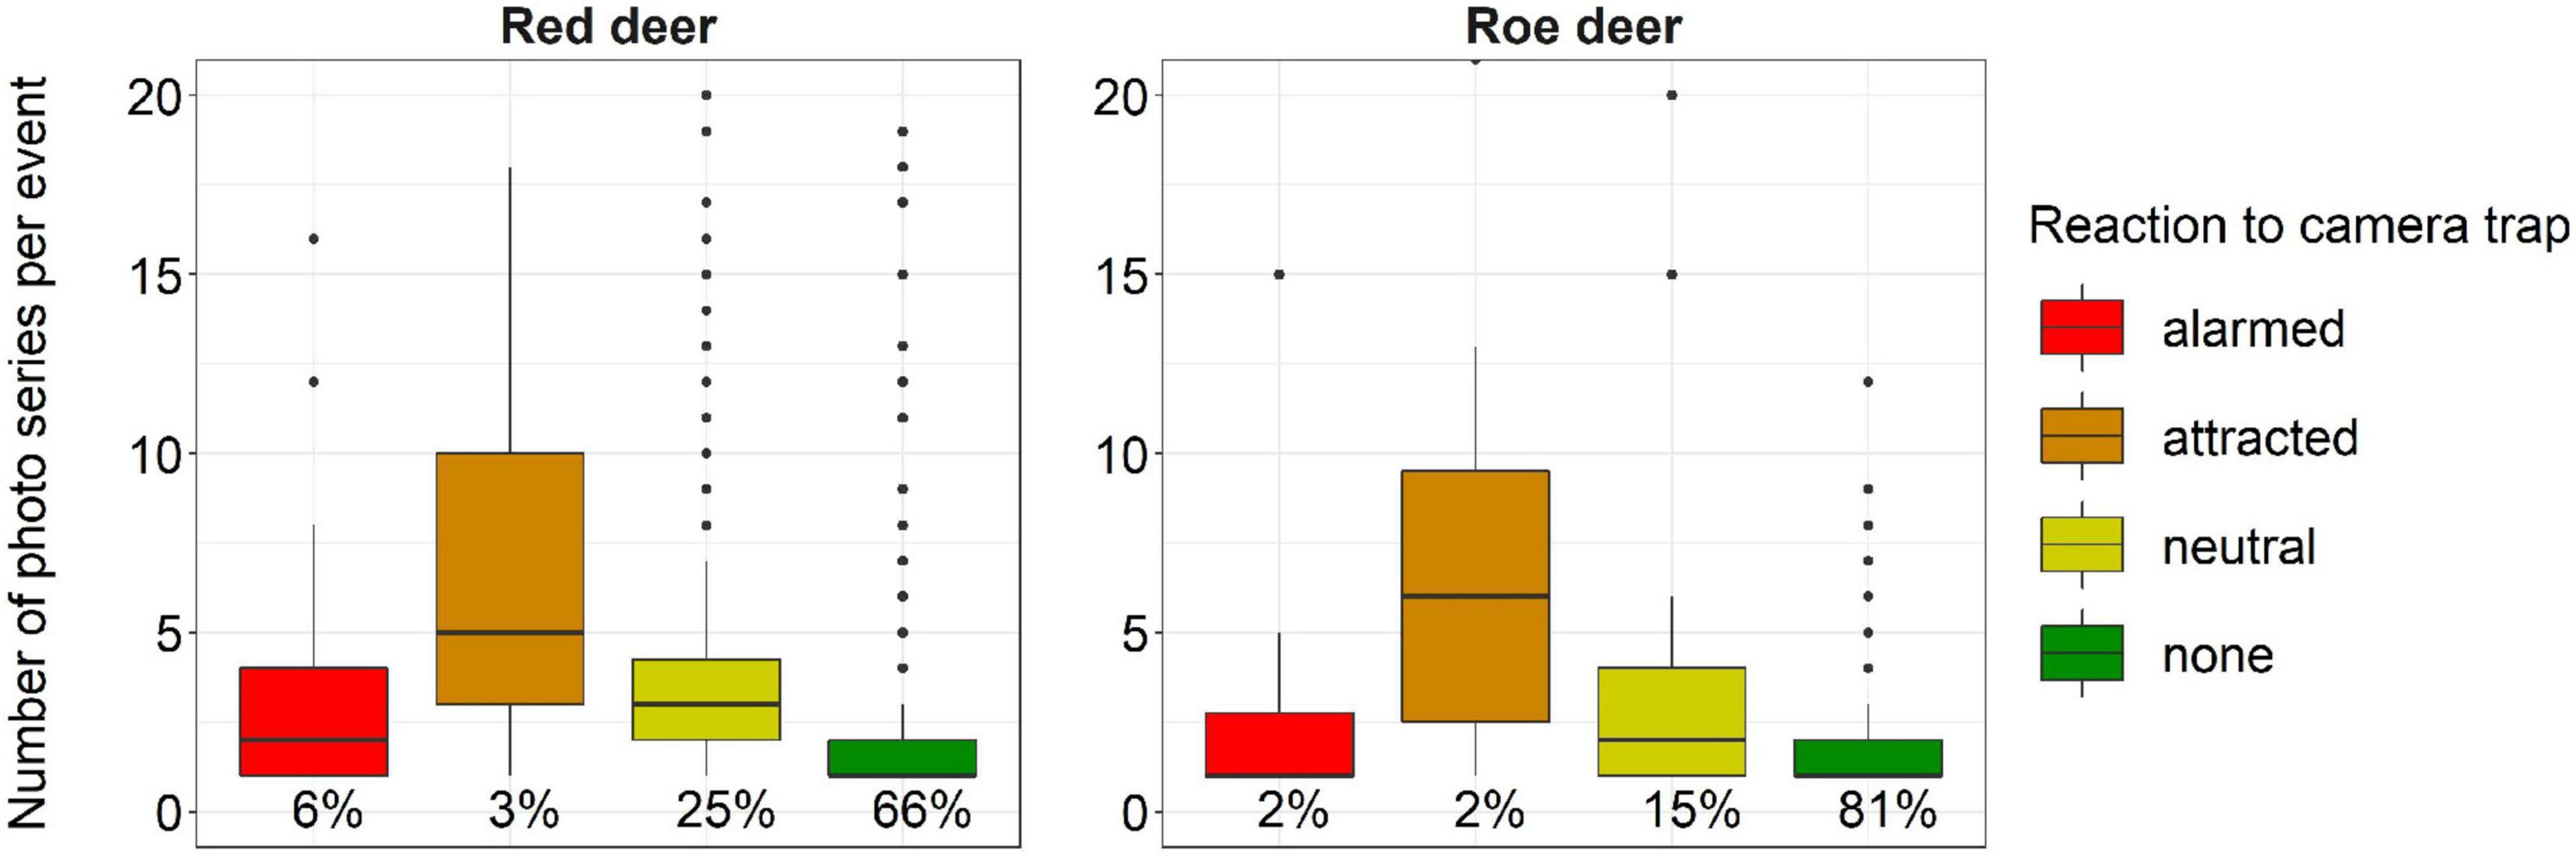
Figure 7. Number of photo series per event for red deer and roe deer, classified by reaction to the camera trap: neutral = the event contains at least one photo series of an animal moving its head to face the camera trap or of an animal looking directly at the camera trap for several photos; attracted = the event contains at least one photo series with an animal moving towards the camera trap, following a neutral reaction; alarmed = the event contains at least one photo series of an animal quickly moving away from the camera trap after a neutral reaction, also after an initial attraction. The percentage of each subgroup in the total number of events n is indicated beneath each box (25 red deer events and 2 roe deer events had >20 photo series and are not shown).
The mean delay between successive photo series was significantly larger for red deer than for roe deer (12.82 vs. 10.92 s, 95% CI of the difference: 1.49–2.31 s). If this was not accounted for in density estimation, roe deer densities were overestimated by 14% (Figure 5 and Table 2).
None of the sources of bias related to animal behavior or their combination had a significant impact on REM and CTDS estimates, as evidenced by the confidence intervals (Table 2 and Supplementary Table 5).
Precision of Density Estimates
The uncertainty in the movement speed estimates contributed <20% to the overall uncertainty in the REM estimates, except for red deer in autumn and roe deer in summer and spring when its contribution reached at maximum 27%. By contrast, the two variables describing movement behavior in CTDS, i.e., activity levels and average numbers of photo series per event, had together a much larger impact, with the latter alone being responsible for 38% of the uncertainty in red deer density estimates in summer.
The largest part of the variance in the REM estimates was explained by differences in the trapping rates between camera trap locations. It was ≥65% in all cases except for red deer and roe deer in spring. In contrast, its importance for the CTDS estimates was not only exceeded by that of the average number of photo series per event for red deer in summer and roe deer in winter, but also by that of the detection probability for red deer in spring (Figure 8 and Supplementary Table 6).

Figure 8. Contributions of the model parameters to the uncertainty in REM- and CTDS-based population density estimates of red deer and roe deer as derived from data obtained from 108 camera traps, which were deployed for one year. The y axis shows the proportion of the total sum of squares attributable to the parameters, their interactions and the residuals in a linear regression with population density as the response variable and the input parameters as independent variables. For the REM, the trap rate TRe corresponds to the total number of events y divided by the total deployment days t. For CTDS, TRe multiplied by the average number of snapshot moments with animals (the first photos of the photo series) per event and the average number of individuals per snapshot moment equals n/T.
Discussion
Our study shows that the strategy to account for animal movement behavior can be critical for obtaining unbiased population density estimates of unmarked species from camera trap data, evidenced by the mismatch between movement speed estimates derived from GPS telemetry data and trapping rates of roe deer females. The neglect of sex-specific differences in movement speeds in REM and species-specific delays between photo series in CTDS caused larger biases in the population density estimates of roe deer than in red deer. In contrast, seasonal variation of movement speeds and behavioral reactions to camera traps were more problematic for red deer. However, the impacts of all of these behavior-related potential sources of bias (max. 19%) were masked by a lack of precision in the density estimates. For most species and seasons, precision was mainly determined by trapping rates independent of the model used for density estimation, although other parameters were more influential for CTDS than for REM.
Random Encounter Model Parameters
The lack of unbiased movement speed estimates has long been recognized as a major problem of REM (Manzo et al., 2012). Among the potential sources of bias analyzed in this study, the effect of assuming a balanced sex ratio was in most cases negligible, except for roe deer in spring and summer. A correction factor for the sex ratio of a roe deer population can be directly derived from camera trap observations, since the sex of adult animals is easily identified from photos. For many other species with a less pronounced sexual dimorphism, serious problems may arise for populations with an unbalanced sex ratio. The impact of seasonal variation in movement speeds also had a species-specific component: It was especially strong for red deer in spring and autumn. In spring, red deer follow the vegetation green-up along the elevational gradient (Rivrud et al., 2016b). In contrast, the migration and movement patterns in autumn do not only depend on forage availability, but also rutting activities and the onset of hunting (Rivrud et al., 2016a). In temperate environments, such distinct seasonal cycles of environmental, but also anthropogenic influences, may strongly impact the movement of many animal species (Shaw and Couzin, 2013). In addition, animals also adapt their movement to variation in climatic conditions, human disturbance or other influences between years (Jeppesen, 1987; Fieberg et al., 2008). This had a visible effect on the REM estimates of red deer females in autumn. For other groups with larger inter-annual differences in movement patterns, such as roe deer males (Supplementary Figure 9), the potential bias is likely even larger. Moreover, even when sex, season and year are taken into account, movement speed estimates are biased when the GPS fix interval is too coarse to fully capture the tortuosity of the movement path (Rowcliffe et al., 2012). This might explain the negative relationship between movement speed estimates and trapping rates of roe deer females. Roe deer in Central Europe typically give birth between the middle and end of May (Peláez et al., 2020), consistent with the peak of the marked asynchrony between movement speeds and trapping rates determined in our study. Roe deer fawns remain hidden for 1–2 months (Linnell et al., 2020), during which time the size of their mothers’ home ranges decreases significantly (Bongi et al., 2008). The less directionally persistent movement paths within these smaller home ranges were seemingly underestimated despite the use of continuous-time movement modeling (Supplementary Figure 8). A less-pronounced effect on red deer may reflect more directional movement, on average smaller GPS intervals and shorter time periods of only 2–3 weeks, during which red deer calves remain hidden (Clutton-Brock and Guinness, 1975). Further complications arise from significant relationships between movement speeds and population densities, requiring a good match between the density of the source population of the movement speed parameter and the density to be estimated to avoid bias (Broadley et al., 2019).
A possible solution to the manifold problems associated with the use of GPS-telemetry derived movement speed estimates for REM, might be to estimate this parameter directly from the travel paths captured by the camera traps, a method suggested by Rowcliffe et al. (2016) and Palencia et al. (2019). This would ensure that the population structure and environmental conditions used in the movement speed estimation fit the camera trapping period exactly. Furthermore, the approach considers small-scale movements, which would be masked by the inaccuracy of GPS telemetry fixes. Running animals, on the other hand, may be missed by camera traps, but very rapid movements only constitute a negligible proportion of the daily time budget (Turner, 1979) and can therefore be expected to have a limited impact on camera trap-based average movement speed estimates. Prerequisite of this method, which can be applied to multiple species in the same dataset, is a camera trap with fast trigger speeds and delays between photos of <1 s, or the ability to record videos of sufficient length. The daily proportion of time spent active also has to be considered just as in CTDS. While the manual measurement of movement paths is laborious and difficult in the absence of distinct landmarks, this problem can be resolved by the anticipated development of automatic processing tools (Rowcliffe et al., 2016; Johanns et al., 2022). Regardless of the source of the movement speed estimates, random camera trap placement is important to reflect their dependence on habitat type. In this way it is ensured that area-wide speed estimates from GPS telemetry can be used to explain trapping rates at the camera trap locations and that camera trap-based speed estimates are representative of the study area.
The underestimation of group sizes based on a single photo instead of photo series was a minor problem for both red deer and roe deer in our study. While group sizes of red deer are low in the area, as confirmed by aerial surveys (Henrich et al., 2021), they can be much larger in other parts of Europe [e.g., in Białowieża; Jędrezejewski et al. (2006)]. In these regions, only a proportion of a group will often be captured on the same photo and even the same photo series, increasing the risk to underestimate the group size parameter of REM. As an alternative, events can be defined based on individuals entering and exiting the field of view (Cusack et al., 2015; Marcon et al., 2020). However, camera trap malfunctions due to technical or external factors might create gaps between consecutive photos, during which individuals might leave and then re-enter the field of view. Furthermore, the same animal staying at the very edge of the field of view may become visible repeatedly in a short time span, which would inflate event numbers. While no ideal solution exists, longer photo series or videos and faster trigger speeds can in general help to track individuals in the field of view, thereby improving group size estimates.
The seasonal variation of the effective detection radius can be even more important to consider than animal behavior, as demonstrated by the potential bias for red deer in spring (Supplementary Table 5). It can be accounted for along with the physical characteristics of animal species when using detection functions to estimate effective detection radii in REM, analogous to the detection probability of CTDS.
While the previously mentioned sources of bias should be taken seriously, it is just as important to address the major sources of uncertainty in population density estimates. The precision of the density estimates can in general be expected to increase with the number of camera trap locations. Since precision is mainly determined by variation in trapping rates between camera trap locations, it might also help to better incorporate knowledge on the habitat selection of the animals in the density estimation process in future.
Camera Trap Distance Sampling Parameters
While the movement speed estimates of red deer as derived from GPS telemetry data were higher than of roe deer, activity estimates were similar for both species and the average number of snapshot moments per event was larger for red deer (Supplementary Table 2). This discrepancy can in part be explained by more frequent reactions of red deer to the camera traps. While deer reactions to camera traps did not have a demonstrable influence on the number of events in our study area (Henrich et al., 2020), they did affect staying times. Animals that reacted to the camera trap stayed in its field of view for a prolonged time period, apparently to observe the unknown object. The number of photo series per event increased on average by 121% if deer responded neutrally and by 281% if they were attracted to the camera trap. Both motionlessness and attraction to the camera trap can be accounted for straightforwardly by not considering the animals depicted in those photos. If observation distances are influenced by these responses to the camera trap, e.g., an overabundance of short distances in the case of attraction, they also need to be removed from the dataset before detection functions can be fitted. Since our distance measurements were based solely on the first animal photo of an event, reactions to the camera trap, defined herein as having been inferred from preceding images, could not have occurred at that moment. Alarmed reactions are more problematic than the aforementioned responses to camera traps, because it is impossible to estimate how long the animals would have otherwise stayed. However, as alarmed reactions occurred in only 6 and 2% of the red deer and roe deer events, respectively, they were rare enough such that they presumably had little influence on the population density estimates.
Conversely, CTDS estimates may be strongly influenced by a few camera trap locations where the staying times of animals in the field of view are above average, independent of reactions to the camera trap, as might occur at sites with abundant forage or preferred resting places. This phenomenon was observed for adult red deer in summer, when only three cameras accounted for 31% of the photo series (Supplementary Figure 2). When extreme outlier locations, with above-average numbers of photos per unit time among sites with confirmed red deer presence, were removed from the dataset, the estimated summer population density decreased by 38% (Supplementary Table 5). Furthermore, the reliance on a limited number of camera trap locations to estimate animal movement parameters leads to a pronounced contribution of these parameters to the uncertainty in population density estimates. Similar problems can be expected for the estimation of movement speeds from camera trap data and the staying time parameter of the random encounter and staying time model (REST), a modification of REM (Nakashima et al., 2018). However, the effect of extreme staying times on REST is limited, because the model includes a pre-defined threshold. In both movement speed estimation and REST, data can be censored to exclude any behavioral reactions to camera traps, and a maximum sample size for each camera trap location can be defined to restrict the outsize influence of a minority of camera trap locations. For CTDS, a solution to this problem is thus far lacking.
The number of photos of an animal species also depends on the delay between successive photos, which reflects both the technical recovery time of the camera trap and the re-trigger time depending on animal movement in the field of view. Based on our results, roe deer exhibited such movements more frequently than red deer. This questions the assumption of CTDS that present animals will be detected with certainty during snapshot moments. The original adaptation of distance sampling for camera traps (Howe et al., 2017) used videos that were long enough such that delays between subsequent recordings were negligible, which allowed an arbitrary discretization into snapshot moments. However, videos need more energy and storage capacity than photos and their classification is more time-consuming (Rovero et al., 2013; Findlay et al., 2020). While photos can be obtained by triggering the camera at pre-defined time intervals, this produces large numbers of empty photos and passing animals might be missed in the intervening moments. The majority of camera trapping studies therefore uses motion-triggered photos (Hamel et al., 2013; Hofmeester et al., 2020), although variable delays between photos are inevitable, due in part to large variability in the technical recovery times of different camera trap models (Trolliet et al., 2014). Since re-trigger times have to be considered additionally, relying on manufacturer specifications alone may severely underestimate the actual delay between photos (Corlatti et al., 2020). It is therefore advisable to determine an appropriate snapshot interval using the mean time difference between successive photos of the same observation in the camera trap dataset itself. This strategy allows potential differences between species and individual camera traps to be taken into account. Species-specific snapshot intervals are especially important for less abundant species as exemplified by roe deer, since characteristics of re-trigger times might otherwise be overshadowed by other species with larger numbers of observations.
Two strategies might help to improve precision of the CTDS estimates: First, it may be useful to analyze the relationship between the number of photos and the characteristics of the camera trap locations in order to be able to incorporate this knowledge in the model. Second, more robust detection functions can be expected if distances to the camera traps are estimated for all animals observed during snapshot moments. Automatized methods have been developed that can help to achieve such a large amount of distance estimates time- and cost-efficiently in future studies (Haucke et al., 2022; Johanns et al., 2022).
Further Considerations
Since the “true” seasonal population densities of red deer and roe deer in our study area are unknown, we cannot assess the absolute correctness of the REM and CTDS estimates. That can only be determined for fenced enclosures, where migration does not play a role and the whole area can be surveyed at once (e.g., Marcon et al., 2020). We purposefully chose to study free-ranging populations to observe the effect of natural animal behavior, including habitat selection, movement speed and group formation, on population density estimation with camera traps. For this reason, we had to assess the relative impact of different sources of bias on the best estimates, which we could obtain for each method with the available data.
While several potential solutions can be considered to address these sources of bias and improve the precision of density estimates for our study species, density estimation for unmarked populations by means of camera trapping becomes increasingly difficult for animals with a low body mass, a strong selection for certain habitats or pronounced use of established trails and low density populations (Balestrieri et al., 2016; Schaus et al., 2020; Cappelle et al., 2021). The lower the number of observations and the more variable it is between camera trap locations, the larger becomes the relative uncertainty of the REM and CTDS estimates and the more challenging it will be to properly fit detection functions and to derive movement characteristics from activity estimates and the number of photos per camera trap event (Bessone et al., 2020). Within events, the likelihood of being able to track small individuals on the images for movement speed estimation also decreases. Under these circumstances, alternative methods, e.g., based on non-invasive genetic samples (Balestrieri et al., 2016), should be considered.
Whenever the estimation of behavioral parameters is possible from camera trap data, it might be of general interest beyond its application for density estimation. While individual-based methods such as GPS telemetry with activity sensors provide information with a much higher resolution, it is often unclear how representative the GPS-collared individuals are of the whole population (Hebblewhite and Haydon, 2010). Although the uncertainty in camera trap-based estimates can be expected to be much larger, they are based on observations of many different individuals of all ages and sexes, with a range of personality traits.
Conclusion
The use of camera traps to estimate the population densities of unmarked animal species has gained increasing acceptance since publication of the REM (Rowcliffe et al., 2008; Gilbert et al., 2021), but the potential for biases arising from inadequate consideration of complex animal behavior has not been systematically analyzed. Our study found that biases caused by the failure to adjust movement speed estimates of red deer and roe deer for the sex ratio, season and year were masked by the low precision of the REM estimates. Nonetheless, we advocate caution in using GPS telemetry data within REM, especially for species and time periods characterized by low directional persistence in animal movement paths in relation to the GPS fix interval. Instead, our results may support the recent trend of estimating movement speeds directly from camera trapping data (e.g., Rademaker et al., 2016; Monteiro-Alves et al., 2019; Schaus et al., 2020; Palencia et al., 2021). While CTDS derives necessary information on animal movement behavior from the camera trap data by default, this can lead to bias in population density estimates arising from the potentially large influence of outlier locations. The largest confirmed bias in our study could be ascribed to reactions of red deer to camera traps. The effort of behavioral classifications can therefore be worthwhile, and should be carefully evaluated against the risk of bias for each study system. Furthermore, the consideration of species-specific delays between photos proved to be useful for roe deer and should always be a factor when CTDS is applied to motion-triggered photos. In order to fully take advantage of estimates with minimal bias, additional efforts are needed to develop methods that can effectively improve the precision of REM and CTDS, which would be a prerequisite to enable the detection of small changes in population density. By properly considering animal behavior, addressing the sources of variance (e.g., inter-camera variation of trapping rates) and automatization of image processing, both methods can be potentially reliable and feasible tools within regular monitoring programs and in the adaptive management of common ungulate populations.
Data Availability Statement
The datasets presented in this study can be found in online repositories. The names of the repository/repositories and accession number(s) can be found below: The raw GPS telemetry data used in this study are accessible via the Eurodeer database (https://eurodeer.org/). Camera trapping data and R scripts that were used for the analyses can be found at Henrich, M. (2022, April 12). Deer behavior affects density estimates with camera traps, but is outperformed by spatial variability. Retrieved from osf.io/z3wmu.
Ethics Statement
The animal study was reviewed and approved by the Ethics Committees of the District Government of Upper Bavaria (reference numbers: ROB 55.2-1-54-2531-82-10/ROB-55.2Vet-2532.Vet_02-17-190) and of the Ministry of Environment of Czech Republic (reference number: MZP/2018/630/694).
Author Contributions
MHen, FH, CD, HK, and MHeu conceived the ideas, proposed the research questions, and developed analysis approaches to answer them. MHen, WP, FF, TP, and MHeu designed the methodology of the camera trap field study. MHen, WP, FF, TP, PŠ, and MHeu collected the camera trap and GPS telemetry data. MHen analyzed the data and led the writing of the manuscript. All authors contributed critically to the drafts and gave final approval for publication.
Funding
This study was funded by the Bavarian State Ministry of the Environment and Consumer Protection (project ID 77262). The field work was financed by the program Ziel ETZ FreeState of Bavaria – Czech Republic 2014–2020 (INTERREG V) (project number 184).
Conflict of Interest
The authors declare that the research was conducted in the absence of any commercial or financial relationships that could be construed as a potential conflict of interest.
Publisher’s Note
All claims expressed in this article are solely those of the authors and do not necessarily represent those of their affiliated organizations, or those of the publisher, the editors and the reviewers. Any product that may be evaluated in this article, or claim that may be made by its manufacturer, is not guaranteed or endorsed by the publisher.
Acknowledgments
We thank Christen H. Fleming, Marcus Rowcliffe, Stephen Buckland, Eric Rexstad, Len Thomas, and Eric Howe for their excellent support in resolving methodological difficulties. We are also grateful to Martin Gahbauer and Joseph Premier for their technical support and to our field workers Almuth Küppers, Anabel Bouvier, Anna-Lena Lindner, Annika Abele, Federica Ferrario, Fritz Fokken, Hanna Reuter, Hannah Ballé, Helena Kinzel, Helena Schütte, Jasmin Ebernau, Joachim Schwane, Julia Eberspach, Katharina Vogl, Lena Schneider, Lisa Deak, Lisa Heim, Miriam Jakob, Manon Morel, Markus Grünzinger, Matthias Kratzer, Natalie Eder, Robert Materne, Sandrina Muther, Stefanie Wimmer-Schmidt, Stephan Schreiber, Teresa Gläser, and Viktoria Frank for their assistance in camera trap management and data classification.
Supplementary Material
The Supplementary Material for this article can be found online at: https://www.frontiersin.org/articles/10.3389/fevo.2022.881502/full#supplementary-material
References
Anile, S., Ragni, B., Randi, E., Mattucci, F., and Rovero, F. (2014). Wildcat population density on the Etna volcano, Italy: a comparison of density estimation methods. J. Zool. 293, 252–261. doi: 10.1111/jzo.12141
Apollonio, M., Belkin, V. V., Borkowski, J., Borodin, O. I., Borowik, T., Cagnacci, F., et al. (2017). Challenges and science-based implications for modern management and conservation of European ungulate populations. Mamm. Res. 62, 209–217. doi: 10.1007/s13364-017-0321-5
Balestrieri, A., Ruiz-González, A., Vergara, M., Capelli, E., Tirozzi, P., Alfino, S., et al. (2016). Pine marten density in lowland riparian woods: a test of the Random Encounter Model based on genetic data. Mamm. Biol. 81, 439–446. doi: 10.1016/j.mambio.2016.05.005
Barja, I., and Rosellini, S. (2008). Does habitat type modify group size in roe deer and red deer under predation risk by Iberian wolves? Can. J. Zool. 86, 170–176. doi: 10.1139/Z07-129
Barnes, M. D., Craigie, I. D., Harrison, L. B., Geldmann, J., Collen, B., Whitmee, S., et al. (2016). Wildlife population trends in protected areas predicted by national socio-economic metrics and body size. Nat. Commun. 7:12747. doi: 10.1038/ncomms12747
Berger, K. M., Gese, E. M., and Berger, J. (2008). Indirect effects and traditional trophic cascades: a test involving wolves, coyotes and pronghorn. Ecology 89, 818–828. doi: 10.1890/07-0193.1
Bessone, M., Kühl, H. S., Hohmann, G., Herbinger, I., N’Goran, K. P., Asanzi, P., et al. (2020). Drawn out of the shadows: surveying secretive forest species with camera trap distance sampling. J. Appl. Ecol. 57, 963–974. doi: 10.1111/1365-2664.13602
Bjørneraas, K., Van Moorter, B., Rolandsen, C. M., and Herfindal, I. (2010). Screening global positioning system location data for errors using animal movement characteristics. J. Wildl. Manage. 74, 1361–1366. doi: 10.2193/2009-405
Bogich, T. L., Liebhold, A. M., and Shea, K. (2008). To sample or eradicate? A cost minimization model for monitoring and managing an invasive species. J. Appl. Ecol. 45, 1134–1142. doi: 10.1111/j.1365-2664.2008.01494.x
Bongi, P., Ciuti, S., Grignolio, S., Del Frate, M., Simi, S., Gandelli, D., et al. (2008). Anti-predator behaviour, space use and habitat selection in female roe deer during the fawning season in a wolf area: roe deer anti-predator behaviour in a wolf area. J. Zool. 276, 242–251. doi: 10.1111/j.1469-7998.2008.00481.x
Broadley, K., Burton, A. C., Avgar, T., and Boutin, S. (2019). Density-dependent space use affects interpretation of camera trap detection rates. Ecol. Evol. 9, 14031–14041. doi: 10.1002/ece3.5840
Brooks, M. E., Kristensen, K., van Benthem, K. J., Magnusson, A., Berg, C. W., Nielsen, A., et al. (2017). glmmTMB Balances Speed and Flexibility Among Packages for Zero-inflated Generalized Linear Mixed Modeling. R J. 9, 378–400. doi: 10.32614/rj-2017-066
Burton, A. C., Neilson, E., Moreira, D., Ladle, A., Steenweg, R., Fisher, J. T., et al. (2015). Wildlife camera trapping: a review and recommendations for linking surveys to ecological processes. J. Appl. Ecol. 52, 675–685. doi: 10.1111/1365-2664.12432
Cailleret, M., Heurich, M., and Bugmann, H. (2014). Reduction in browsing intensity may not compensate climate change effects on tree species composition in the Bavarian Forest National Park. For. Ecol. Manag. 328, 179–192. doi: 10.1016/j.foreco.2014.05.030
Calabrese, J. M., Fleming, C. H., and Gurarie, E. (2016). ctmm: an r package for analyzing animal relocation data as a continuous-time stochastic process. Methods Ecol. Evol. 7, 1124–1132. doi: 10.1111/2041-210X.12559
Campbell, D., Swanson, G. M., and Sales, J. (2004). Methodological insights: comparing the precision and cost-effectiveness of faecal pellet group count methods: faecal pellet group count methods. J. Appl. Ecol. 41, 1185–1196. doi: 10.1111/j.0021-8901.2004.00964.x
Cappelle, N., Howe, E. J., Boesch, C., and Kühl, H. S. (2021). Estimating animal abundance and effort–precision relationship with camera trap distance sampling. Ecosphere 12:e03299. doi: 10.1002/ecs2.3299
Caravaggi, A., Zaccaroni, M., Riga, F., Schai-Braun, S. C., Dick, J. T. A., Montgomery, W. I., et al. (2016). An invasive-native mammalian species replacement process captured by camera trap survey random encounter models. Remote Sens. Ecol. Conserv. 2, 45–58. doi: 10.1002/rse2.11
Chandler, R. B., and Royle, J. A. (2013). Spatially explicit models for inference about density in unmarked or partially marked populations. Ann. Appl. Stat. 7, 936–954. doi: 10.1214/12-AOAS610
Clausen, K. K., Christensen, T. K., Gundersen, O. M., and Madsen, J. (2017). Impact of hunting along the migration corridor of pink-footed geese Anser brachyrhynchus - implications for sustainable harvest management. J. Appl. Ecol. 54, 1563–1570. doi: 10.1111/1365-2664.12850
Clutton-Brock, T. H., and Guinness, F. E. (1975). Behaviour of red deer (Cervus elaphus L.) at calving time. Behaviour 55, 287–300. doi: 10.1163/156853975X00506
Corlatti, L., Sivieri, S., Sudolska, B., Giacomelli, S., and Pedrotti, L. (2020). A field test of unconventional camera trap distance sampling to estimate abundance of marmot populations. Wildl. Biol. 2020:wlb.00652. doi: 10.2981/wlb.00652
Cusack, J. J., Swanson, A., Coulson, T., Packer, C., Carbone, C., Dickman, A. J., et al. (2015). Applying a random encounter model to estimate lion density from camera traps in Serengeti National Park, Tanzania. J. Wildl. Manage. 79, 1014–1021. doi: 10.1002/jwmg.902
Delisle, Z. J., Flaherty, E. A., Nobbe, M. R., Wzientek, C. M., and Swihart, R. K. (2021). Next-generation camera trapping: systematic review of historic trends suggests keys to expanded research applications in ecology and conservation. Front. Ecol. Evol. 9:617996. doi: 10.3389/fevo.2021.617996
Efford, M. (2004). Density estimation in live-trapping studies. Oikos 106, 598–610. doi: 10.1111/j.0030-1299.2004.13043.x
Efford, M. G., and Fewster, R. M. (2013). Estimating population size by spatially explicit capture-recapture. Oikos 122, 918–928. doi: 10.1111/j.1600-0706.2012.20440.x
Ewald, J., Jehl, H., Braun, L., and Lohberger, E. (2011). Die Vegetation des Nationalparks Bayerischer Wald als Ausdruck von Standort und Walddynamik. Tuxenia 31, 9–38.
Fieberg, J., Kuehn, D. W., and DelGiudice, G. D. (2008). Understanding variation in autumn migration of Northern white-tailed deer by long-term study. J. Mammal. 89, 1529–1539. doi: 10.1644/07-MAMM-A-277.1
Filla, M., Premier, J., Magg, N., Dupke, C., Khorozyan, I., Waltert, M., et al. (2017). Habitat selection by Eurasian lynx (Lynx lynx) is primarily driven by avoidance of human activity during day and prey availability during night. Ecol. Evol. 7, 6367–6381. doi: 10.1002/ece3.3204
Findlay, M. A., Briers, R. A., and White, P. J. C. (2020). Component processes of detection probability in camera-trap studies: understanding the occurrence of false-negatives. Mamm. Res. 65, 167–180. doi: 10.1007/s13364-020-00478-y
Geist, V., and Bayer, M. (1988). Sexual dimorphism in the Cervidae and its relation to habitat. J. Zool. 214, 45–53. doi: 10.1111/j.1469-7998.1988.tb04985.x
Gibbs, J. P., Droege, S., and Eagle, P. (1998). Monitoring populations of plants and animals. BioScience 48, 935–940. doi: 10.2307/1313297
Gilbert, N. A., Clare, J. D. J., Stenglein, J. L., and Zuckerberg, B. (2021). Abundance estimation of unmarked animals based on camera-trap data. Conserv. Biol. 35, 88–100. doi: 10.1111/cobi.13517
Gray, T. N. E. (2018). Monitoring tropical forest ungulates using camera-trap data. J. Zool. 305, 173–179. doi: 10.1111/jzo.12547
Gurarie, E., and Ovaskainen, O. (2013). Towards a general formalization of encounter rates in ecology. Theor. Ecol. 6, 189–202. doi: 10.1007/s12080-012-0170-4
Hamel, S., Killengreen, S. T., Henden, J.-A., Eide, N. E., Roed-Eriksen, L., Ims, R. A., et al. (2013). Towards good practice guidance in using camera-traps in ecology: influence of sampling design on validity of ecological inferences. Methods Ecol. Evol. 4, 105–113. doi: 10.1111/j.2041-210x.2012.00262.x
Hartig, F. (2020). DHARMa: Residual Diagnostics for Hierarchical (Multi-Level/Mixed) Regression Models. Available Online at: https://CRAN.R-project.org/package=DHARMa (accessed December 4, 2020).
Haucke, T., Kühl, H. S., Hoyer, J., and Steinhage, V. (2022). Overcoming the distance estimation bottleneck in estimating animal abundance with camera traps. Ecol. Inform. 68:101536. doi: 10.1016/j.ecoinf.2021.101536
Hebblewhite, M., and Haydon, D. T. (2010). Distinguishing technology from biology: a critical review of the use of GPS telemetry data in ecology. Philos. Trans. R. Soc. B 365, 2303–2312. doi: 10.1098/rstb.2010.0087
Henrich, M., Franke, F., Peterka, T., Bödeker, K., Červenka, J., Ebert, C., et al. (2021). Future perspectives for the monitoring of red deer populations – a case study of a transboundary population in the Bohemian Forest ecosystem. Silva Gabreta 27, 161–192.
Henrich, M., Niederlechner, S., Kröschel, M., Thoma, S., Dormann, C. F., Hartig, F., et al. (2020). The influence of camera trap flash type on the behavioural reactions and trapping rates of red deer and roe deer. Remote Sens. Ecol. Conserv. 86, 399–410. doi: 10.1002/rse2.150
Heurich, M., Zeis, K., Küchenhoff, H., Müller, J., Belotti, E., Bufka, L., et al. (2016). Selective predation of a stalking predator on ungulate prey. PLoS One 11:e0158449. doi: 10.1371/journal.pone.0158449
Hofmeester, T. R., Cromsigt, J. P. G. M., Odden, J., Andrén, H., Kindberg, J., and Linnell, J. D. C. (2019). Framing pictures: a conceptual framework to identify and correct for biases in detection probability of camera traps enabling multi-species comparison. Ecol. Evol. 9, 2320–2336. doi: 10.1002/ece3.4878
Hofmeester, T. R., Young, S., Juthberg, S., Singh, N. J., Widemo, F., Andrén, H., et al. (2020). Using by-catch data from wildlife surveys to quantify climatic parameters and timing of phenology for plants and animals using camera traps. Remote Sens. Ecol. Conserv. 6, 129–140. doi: 10.1002/rse2.136
Howe, E. J., Buckland, S. T., Després-Einspenner, M., and Kühl, H. S. (2017). Distance sampling with camera traps. Methods Ecol. Evol. 8, 1558–1565. doi: 10.1111/2041-210X.12790
Jędrezejewski, W., Spaedtke, H., Kamler, J. F., Jędrezejwska, B., and Stenkewitz, U. (2006). Group size dynamics of red deer in Białowieża primeval forest, Poland. J. Wildl. Manage. 70, 1054–1059.
Jeppesen, J. L. (1987). Impact of human disturbance on home range, movements and activity of red deer (Cervus elaphus) in a Danish environment. Dan. Rev. Game Biol. 13, 1–38.
Johanns, P., Haucke, T., and Steinhage, V. (2022). Distance estimation and animal tracking for wildlife camera trapping. arXiv [Preprint]. doi: 10.48550/ARXIV.2202.04613
Karanth, K. U. (1995). Estimating tiger Panthera tigris populations from camera-trap data using capture—recapture models. Biol. Conserv. 71, 333–338. doi: 10.1016/0006-3207(94)00057-W
Linnell, J. D. C., Cretois, B., Nilsen, E. B., Rolandsen, C. M., Solberg, E. J., Veiberg, V., et al. (2020). The challenges and opportunities of coexisting with wild ungulates in the human-dominated landscapes of Europe’s Anthropocene. Biol. Conserv. 244:108500. doi: 10.1016/j.biocon.2020.108500
MacMillan, D. C., and Phillip, S. (2008). Consumptive and non-consumptive values of wild mammals in Britain. Mamm. Rev. 38, 189–204. doi: 10.1111/j.1365-2907.2008.00124.x
Manzo, E., Bartolommei, P., Rowcliffe, J. M., and Cozzolino, R. (2012). Estimation of population density of European pine marten in central Italy using camera trapping. Acta Theriol. 57, 165–172. doi: 10.1007/s13364-011-0055-8
Marcon, A., Bongi, P., Battocchio, D., and Apollonio, M. (2020). REM: performance on a high-density fallow deer (Dama dama) population. Mamm. Res. 65, 835–841. doi: 10.1007/s13364-020-00522-x
Miller, D. L., Rexstad, E., Thomas, L., Marshall, L., and Laake, J. L. (2019). Distance sampling in R. J. Stat. Softw. 89. doi: 10.18637/jss.v089.i01
Monteiro-Alves, P. S., Helmer, D. M., Ferreguetti, A. C., Pereira-Ribeiro, J., Rocha, C. F. D., and Bergallo, H. G. (2019). Occupancy, detectability, and density of crab-eating fox (Cerdocyon thous) in two protected areas of restinga habitats in Brazil. Can. J. Zool. 97, 952–959. doi: 10.1139/cjz-2018-0322
Morellet, N., Verheyden, H., Angibault, J.-M., Cargnelutti, B., Lourtet, B., and Hewison, M. A. J. (2009). The effect of capture on ranging behaviour and activity of the European roe deer (Capreolus capreolus). Wildl. Biol. 15, 278–287. doi: 10.2981/08-084
Möst, L., Hothorn, T., Müller, J., and Heurich, M. (2015). Creating a landscape of management: unintended effects on the variation of browsing pressure in a national park. For. Ecol. Manag. 338, 46–56. doi: 10.1016/j.foreco.2014.11.015
Mysterud, A., and Ims, R. A. (1998). Functional responses in habitat use: availability influences relative use in trade-off situations. Ecology 79, 1435–1441. doi: 10.1890/0012-9658(1998)079[1435:frihua]2.0.co;2
Nakashima, Y., Fukasawa, K., and Samejima, H. (2018). Estimating animal density without individual recognition using information derivable exclusively from camera traps. J. Appl. Ecol. 55, 735–744. doi: 10.1111/1365-2664.13059
Nathan, R., Getz, W. M., Revilla, E., Holyoak, M., Kadmon, R., Saltz, D., et al. (2008). A movement ecology paradigm for unifying organismal movement research. Proc. Natl. Acad. Sci. U. S. A. 105, 19052–19059. doi: 10.1073/pnas.0800375105
Niedballa, J., Sollmann, R., Courtiol, A., and Wilting, A. (2016). camtrapR: an R package for efficient camera trap data management. Methods Ecol. Evol. 7, 1457–1462. doi: 10.1111/2041-210X.12600
Noonan, M. J., Fleming, C. H., Akre, T. S., Drescher-Lehman, J., Gurarie, E., Harrison, A.-L., et al. (2019). Scale-insensitive estimation of speed and distance traveled from animal tracking data. Mov. Ecol. 7, 1–15. doi: 10.1186/s40462-019-0177-1
Otis, D. L., Burnham, K. P., White, G. C., and Anderson, D. R. (1978). Statistical inference from capture data on closed animal populations. Wildl. Monogr. 62, 3–135.
Palencia, P., Rowcliffe, J. M., Vicente, J., and Acevedo, P. (2021). Assessing the camera trap methodologies used to estimate density of unmarked populations. J. Appl. Ecol. 58, 1583–1592. doi: 10.1111/1365-2664.13913
Palencia, P., Vicente, J., Barroso, P., Barasona, J. Á, Soriguer, R. C., and Acevedo, P. (2019). Estimating day range from camera–trap data: the animals’ behaviour as a key parameter. J. Zool. 309, 182–190. doi: 10.1111/jzo.12710
Palmero, S., Belotti, E., Bufka, L., Gahbauer, M., Heibl, C., Premier, J., et al. (2021). Demography of a Eurasian lynx (Lynx lynx) population within a strictly protected area in Central Europe. Sci. Rep. 11:19868. doi: 10.1038/s41598-021-99337-2
Peláez, M., Gaillard, J., Bollmann, K., Heurich, M., and Rehnus, M. (2020). Large-scale variation in birth timing and synchrony of a large herbivore along the latitudinal and altitudinal gradients. J. Anim. Ecol. 89, 1906–1917. doi: 10.1111/1365-2656.13251
Pfeffer, S. E., Spitzer, R., Allen, A. M., Hofmeester, T. R., Ericsson, G., Widemo, F., et al. (2018). Pictures or pellets? Comparing camera trapping and dung counts as methods for estimating population densities of ungulates. Remote Sens. Ecol. Conserv. 4, 173–183. doi: 10.1002/rse2.67
Pflugmacher, D., Rabe, A., Peters, M., and Hostert, P. (2019). Mapping pan-European land cover using Landsat spectral-temporal metrics and the European LUCAS survey. Remote Sens. Environ. 221, 583–595. doi: 10.1016/j.rse.2018.12.001
R Core Team (2019). R: A Language and Environment for Statistical Computing. Vienna: Foundation for Statistical Computing. Available online at: https://www.R-project.org
Rademaker, M., Meijaard, E., Semiadi, G., Blokland, S., Neilson, E. W., and Rode-Margono, E. J. (2016). First ecological study of the Bawean warty pig (Sus blouchiy), one of the rarest pigs on earth. PLoS One 11:e0151732. doi: 10.1371/journal.pone.0151732
Richard, E., Said, S., Hamann, J.-L., and Gaillard, J.-M. (2011). Toward an identification of resources influencing habitat use in a multi-specific context. PLoS One 6:e29048. doi: 10.1371/journal.pone.0029048
Rivrud, I. M., Bischof, R., Meisingset, E. L., Zimmermann, B., Loe, L. E., and Mysterud, A. (2016a). Leave before it’s too late: anthropogenic and environmental triggers of autumn migration in a hunted ungulate population. Ecology 97, 1058–1068. doi: 10.1890/15-1191.1
Rivrud, I. M., Heurich, M., Krupczynski, P., Müller, J., and Mysterud, A. (2016b). Green wave tracking by large herbivores: an experimental approach. Ecology 97, 3547–3553. doi: 10.1002/ecy.1596
Rovero, F., and Marshall, A. R. (2009). Camera trapping photographic rate as an index of density in forest ungulates. J. Appl. Ecol. 46, 1011–1017. doi: 10.1111/j.1365-2664.2009.01705.x
Rovero, F., Zimmermann, F., Berzi, D., and Meek, P. (2013). “Which camera trap type and how many do I need?” A review of camera features and study designs for a range of wildlife research applications. Hystrix 24, 148–156. doi: 10.4404/hystrix-24.2-8789
Rowcliffe, J. M., Field, J., Turvey, S. T., and Carbone, C. (2008). Estimating animal density using camera traps without the need for individual recognition. J. Appl. Ecol. 45, 1228–1236. doi: 10.1111/j.1365-2664.2008.01473.x
Rowcliffe, J. M., Jansen, P. A., Kays, R., Kranstauber, B., and Carbone, C. (2016). Wildlife speed cameras: measuring animal travel speed and day range using camera traps. Remote Sens. Ecol. Conserv. 2, 84–94. doi: 10.1002/rse2.17
Rowcliffe, J. M., Kays, R., Carbone, C., and Jansen, P. A. (2013). Clarifying assumptions behind the estimation of animal density from camera trap rates: density estimates from camera trap rates. J. Wildl. Manage. 77, 876–876. doi: 10.1002/jwmg.533
Rowcliffe, J. M., Kays, R., Kranstauber, B., Carbone, C., and Jansen, P. A. (2014). Quantifying levels of animal activity using camera trap data. Methods Ecol. Evol. 5, 1170–1179. doi: 10.1111/2041-210X.12278
Rowcliffe, M. (2019). Activity: Animal Activity Statistics. Available Online at: https://CRAN.R-project.org/package=activity (accessed February 24, 2021).
Rowcliffe, M. J., Carbone, C., Kays, R., Kranstauber, B., and Jansen, P. A. (2012). Bias in estimating animal travel distance: the effect of sampling frequency: estimating animal travel distance. Methods Ecol. Evol. 3, 653–662. doi: 10.1111/j.2041-210X.2012.00197.x
Schaus, J., Uzal, A., Gentle, L. K., Baker, P. J., Bearman-Brown, L., Bullion, S., et al. (2020). Application of the Random Encounter Model in citizen science projects to monitor animal densities. Remote Sens. Ecol. Conserv. 6, 514–528. doi: 10.1002/rse2.153
Serrouya, R., Seip, D. R., Hervieux, D., McLellan, B. N., McNay, R. S., Steenweg, R., et al. (2019). Saving endangered species using adaptive management. Proc. Natl. Acad. Sci. U. S. A. 116, 6181–6186. doi: 10.1073/pnas.1816923116
Shaw, A. K., and Couzin, I. D. (2013). Migration or residency? The evolution of movement behavior and information usage in seasonal environments. Am. Nat. 181, 114–124. doi: 10.1086/668600
Siddig, A. A. H., Ellison, A. M., Ochs, A., Villar-Leeman, C., and Lau, M. K. (2016). How do ecologists select and use indicator species to monitor ecological change? Insights from 14 years of publication in Ecological Indicators. Ecol. Indic. 60, 223–230. doi: 10.1016/j.ecolind.2015.06.036
Silveira, L., Jácomo, A. T. A., and Diniz-Filho, J. A. F. (2003). Camera trap, line transect census and track surveys: a comparative evaluation. Biol. Conserv. 114, 351–355. doi: 10.1016/S0006-3207(03)00063-6
Stache, A., Löttker, P., and Heurich, M. (2012). Red deer telemetry: dependency of the position acquisition rate and accuracy of GPS collars on the structure of a temperate forest dominated by European beech and Norway spruce. Silva Gabreta 18, 35–48.
Trolliet, F., Huynen, M.-C., Vermeulen, C., and Hambuckers, A. (2014). Use of camera traps for wildlife studies. A review. Biotechnol. Agron. Soc. Environ. 18, 446–454.
Turner, D. C. (1979). An analysis of time-budgeting by roe deer (Capreolus capreolus) in an agricultural area. Behaviour 71, 246–289. doi: 10.1163/156853979X00188
Urbano, F., and Cagnacci, F. (eds) (2014). Spatial Database for GPS Wildlife Tracking Data: A Practical Guide to Creating a Data Management System with PostgreSQL/PostGIS and R. Cham: Springer.
Valente, A. M., Acevedo, P., Figueiredo, A. M., Fonseca, C., and Torres, R. T. (2020). Overabundant wild ungulate populations in Europe: management with consideration of socio-ecological consequences. Mamm. Rev. 50, 353–366. doi: 10.1111/mam.12202
Viechtbauer, W. (2010). Conducting meta-analyses in R with the metafor package. J. Stat. Softw. 36, 1–48. doi: 10.18637/jss.v036.i03
Keywords: population density estimation, camera traps, animal movement, behavioral responses, sensitivity analysis
Citation: Henrich M, Hartig F, Dormann CF, Kühl HS, Peters W, Franke F, Peterka T, Šustr P and Heurich M (2022) Deer Behavior Affects Density Estimates With Camera Traps, but Is Outweighed by Spatial Variability. Front. Ecol. Evol. 10:881502. doi: 10.3389/fevo.2022.881502
Received: 22 February 2022; Accepted: 26 April 2022;
Published: 18 May 2022.
Edited by:
Dennis Murray, Trent University, CanadaReviewed by:
Stan Boutin, University of Alberta, CanadaWilliam J. McShea, Smithsonian Conservation Biology Institute (SI), United States
Copyright © 2022 Henrich, Hartig, Dormann, Kühl, Peters, Franke, Peterka, Šustr and Heurich. This is an open-access article distributed under the terms of the Creative Commons Attribution License (CC BY). The use, distribution or reproduction in other forums is permitted, provided the original author(s) and the copyright owner(s) are credited and that the original publication in this journal is cited, in accordance with accepted academic practice. No use, distribution or reproduction is permitted which does not comply with these terms.
*Correspondence: Maik Henrich, Maik.Henrich@npv-bw.bayern.de