Photosynthetic and Respiratory Responses of Two Bog Shrub Species to Whole Ecosystem Warming and Elevated CO2 at the Boreal-Temperate Ecotone
 Eric J. Ward1,2*
  Jeffrey M. Warren2
  David A. McLennan2
  Mirindi E. Dusenge3
  Danielle A. Way3,4,5
  Stan D. Wullschleger2
  Paul J. Hanson2
- 1Wetland and Aquatic Research Center, US Geological Survey, Lafayette, LA, United States
- 2Oak Ridge National Laboratory, Environmental Sciences Division, Climate Change Science Institute, Oak Ridge, TN, United States
- 3Department of Biology, University of Western Ontario, London, ON, Canada
- 4Nicholas School of the Environment, Duke University, Durham, NC, United States
- 5Division of Plant Sciences, Research School of Biology, The Australian National University, Canberra, ACT, Australia
Peatlands within the boreal-temperate ecotone contain the majority of terrestrial carbon in this region, and there is concern over the fate of such carbon stores in the face of global environmental changes. The Spruce and Peatland Response Under Changing Environments (SPRUCE) facility aims to advance the understanding of how such peatlands may respond to such changes, using a combination of whole ecosystem warming (WEW; +0, 2.25, 4.5, 6.75, and 9°C) and elevated CO2 (eCO2; +500 ppm) treatments in an intact bog ecosystem. We examined photosynthetic and respiration responses in leaves of two ericaceous shrub species–leatherleaf [Chamaedaphne calyculata (L.) Moench] and bog Labrador tea [Rhododendron groenlandicum (Oeder) Kron & Judd]–to the first year of combined eCO2 and WEW treatments at SPRUCE. We surveyed the leaf N content per area (Narea), net photosynthesis (AST) and respiration (RD25) at 25°C and 400 ppm CO2 and net photosynthesis at mean growing conditions (AGR) of newly emerged, mature and overwintered leaves. We also measured leaf non-structural carbohydrate content (NSC) in mature leaves. The effects of WEW and eCO2 varied by season and species, highlighting the need to accommodate such variability in modeling this system. In mature leaves, we did not observe a response to either treatment of AST or RD25 in R. groenlandicum, but we did observe a 50% decrease in AST of C. calyculata with eCO2. In mature leaves under eCO2, neither species had increased AGR and both had increases in NSC, indicating acclimation of photosynthesis to eCO2 may be related to source-sink imbalances of carbohydrates. Thus, productivity gains of shrubs under eCO2 may be lower than previously predicted for this site by models not accounting for such acclimation. In newly emerged leaves, AST increased with WEW in R. groenlandicum, but not C. calyculata. Overwintered leaves exhibited a decrease in RD25 for R. groenlandicum and in AST for C. calyculata with increasing WEW, as well as an increase of AGR with eCO2 in both species. Responses in newly emerged and overwintered leaves may reflect physiological acclimation or phenological changes in response to treatments.
Introduction
Saturated soil systems in boreal and tundra regions (i.e., peatlands) have been estimated to contain 24% of terrestrial soil carbon, and concern over the fate of these carbon stores has been expressed for decades (Gorham, 1991; Schlesinger and Bernhardt, 2013). It is hard to overstate the importance of peatlands to the carbon storage in the boreal-temperate ecotone. Peatland forests typically contain more than six times the soil carbon of non-peatland forests in Minnesota, USA (Grigal et al., 2011). In this region, landscape level carbon storage is primarily determined by the extent of peatlands due to this bimodal distribution. Experimental manipulation of peatland communities from boreal regions have shown the potential for rapid responses in the carbon cycling, particularly associated with hydrological changes and increased temperatures (Weltzin et al., 2000; Bridgham et al., 2008; Breeuwer et al., 2010; Potvin et al., 2015). Soil carbon in peatlands initially enters the ecosystem through photosynthesis of both vascular and non-vascular plants, so one of the first steps to understanding how such carbon accumulates or is lost from these ecosystems is understanding the carbon economy of the plants living in them.
The Spruce and Peatland Response Under Changing Environments (SPRUCE; mnspruce.ornl.gov.) facility aims to advance the understanding of how such peatlands in the boreal-temperate ecotone may respond to whole ecosystem warming (WEW) and elevated atmospheric CO2 concentration (eCO2) at a Sphagnum bog in northern Minnesota (Hanson et al., 2017). These treatments are scheduled to run for a full decade, so that long-term effects of WEW and eCO2 may emerge through both functional and structural changes to the plant community and ecosystem.
At the bog where the SPRUCE facility is located, the annual net primary productivity of the understory was estimated to be 34% higher than that of overstory trees (Griffiths et al., 2017). This understory is dominated by two ericaceous shrub species: leatherleaf [Chamaedaphne calyculata (L.) Moench] and bog Labrador tea [Rhododendron groenlandicum (Oeder) Kron & Judd]. Many shrubs of the family Ericaceae can tolerate low nutrient and high acidity environments, such as Sphagnum bogs, thanks in part to symbiotic associations with ericoid mycorrhiza (Cairney and Meharg, 2003) that provide roots with both inorganic and organic forms of nitrogen (Hébert and Thiffault, 2011). It also has been suggested that the evergreen habit in bog species is an adaptive use of nitrogen that allows for greater photosynthetic gain for a given unit of nitrogen (Small, 1972). Approximately 70% of leaves on C. calyculata overwinter and abscise early in their second growing season (Hileman and Lieto, 1981), and R. groenlandicum exhibits similar evergreen habit (Small, 1972; Hébert and Thiffault, 2011). Such shrubs' low light and nutrient requirements, resilience to disturbance, and ability to spread through vegetative reproduction make them dominant components of the plant community of many boreal peatlands. At SPRUCE, similar light-saturated rates of photosynthesis per unit leaf area (~7.5 to 10 μmol m−2 s−1) were documented for trees and shrubs (Jensen et al., 2019). In other sites, R. groenlandicum has been noted to have photosynthetic rates three times higher than that of black spruce [Picea mariana (Mill.) Britton, Sterns & Poggenburg] (Hébert and Thiffault, 2011).
In the long term, the storage of carbon in northern peatlands is dependent on the maintenance of a neutral or net uptake of carbon in the balance of gross primary productivity and ecosystem respiration. Large flux collar measurements that incorporate the full understory community of this site (shrubs, forbs, and bryophytes), indicate that productivity of this community is very similar to ecosystem respiration losses, with some years having net carbon uptake and others having net losses (Hanson et al., 2016). Indeed, pretreatment assessment of carbon fluxes was unable to resolve whether this ecosystem as a whole was a net source or sink of CO2 in a typical year, with estimated annual net ecosystem exchange (NEE) ranging from −60 to +50 g C m−2 y−1 (Griffiths et al., 2017). High interannual variability in NEE may be typical of such bogs. For instance, a similar North American bog had NEE ranging from −9 to −70 g C m−2 y−1 over a 4 year eddy covariance study (Lafleur et al., 2003).
Photosynthesis and leaf respiration are two key components in predicting ecosystem NEE and how it may change in response to global change factors. Previous research into warming effects found that respiration acclimated more to warming than did photosynthesis, resulting in a net increase in carbon assimilation in the majority of tree species studied, especially those from temperate and boreal regions (Way and Oren, 2010; Atkin et al., 2015; Reich et al., 2016). However, the acclimation of these processes to warming can take many forms, and only one-half the plant species thus studied show “constructive adjustment” that increases net photosynthesis at growth conditions (Way and Yamori, 2014). As a substrate of carbon assimilation, elevated CO2 (eCO2) generally increases leaf-level net photosynthesis in the short-term, but longer-term acclimation as a result of decreased investment in photosynthetic enzymes per unit leaf area or source-sink imbalances of photosynthates is also commonly, but not universally, observed (Ainsworth and Long, 2005; McDowell, 2011; Smith and Dukes, 2013). A recent meta-analysis (Li et al., 2018) found a mean increase of 26.2% in leaf non-structural carbohydrates (NSC) for woody species grown in eCO2, an indicator of such source-sink imbalances. The impacts of eCO2 on respiration are less clear than those on photosynthesis and in many cases no effect is observed (Smith and Dukes, 2013).
The SPRUCE study is distinguished from previous open-top chamber studies by the combination of WEW and eCO2 treatments, as well as the degree of warming (up to +9°C), elevation of [CO2] (more than double ambient levels), scale (intact mature forest), and planned duration of study (10 years). These highest levels of WEW are more than twice the projected annual temperature increase under IPPC RCP 8.5, however SPRUCE was designed to robustly calibrate temperatures over a large range of temperatures to accommodate model uncertainty and the projection of extreme heat events (Hanson et al., 2017). The design of SPRUCE allows for the study of eCO2 effects near the upper range of projections for 2100 and, importantly, possible interactions between the WEW and eCO2 treatments. Resolving such interactions is an essential element to understanding the response of plant communities and biogeochemical cycling in a context of global change (Schlesinger and Bernhardt, 2013; Way et al., 2015; Dusenge et al., 2019).
The application of WEW and eCO2 to an otherwise intact ecosystem using large open-top chambers permits the assessment of not just direct effects of the treatments on these processes, but also feedbacks from effects on other processes, such as nutrient and water cycling. One such feedback can be in the form of altered phenology as a result of either treatment, but particularly WEW. Such changes in phenology have potential impacts not just on the relative length of the growing season in each WEW treatment, but other factors such as the duration of frost-hardiness in evergreen leaves (Richardson et al., 2018). Thus, it is important not just to evaluate the responses of mature leaves to treatments, but responses throughout the leaf life-cycle.
In this study, we examine the photosynthetic and respiration responses of C. calyculata and R. groenlandicum to the first year of combined eCO2 and WEW treatments at the SPRUCE facility. We examined the first cohort of leaves of these evergreen shrubs to grow under treatment conditions through their entire life cycle from June 2016 until May 2017. We measured light-saturated photosynthesis (AST) and dark-acclimated respiration (RD25) in newly emerged, mature and overwintered leaves from each plot under standardized conditions (25°C and 400 ppm CO2) as an indicator of acclimation to treatments. We also examined the photosynthetic rate (AGR) under the treatment growth temperature and [CO2] to assess likely differences in carbon assimilation realized in the field. Finally, we examined leaf N and NSC as potential indicators of investment of photosynthetic enzymes or source-sink imbalances of photosynthates, respectively.
From past research indicating a greater acclimation of respiration than photosynthesis to long-term warming in many species (Way and Oren, 2010; Atkin et al., 2015; Reich et al., 2016), we expected that WEW would increase net photosynthesis and decrease respiration at standard conditions, as well as increase net photosynthesis at growth conditions. We expected eCO2 to reduce photosynthesis at standard conditions, increase photosynthesis at growth conditions and have no effect on respiration. We expected increases in NSC under eCO2 due to previous research on source-sink limitations in other species. Based on pretreatment data (Jensen et al., 2019), we expected that leaf N would not be effected by treatments or correspond well with photosynthetic rates, but given potential changes with WEW and eCO2 treatments at the leaf, plant and ecosystem level, it was deemed important to investigate.
Materials and Methods
Site Description
The Spruce and Peatland Response Under Changing Environments (SPRUCE) facility is located in northern Minnesota, in the Laurentian Mixed Forest Province (McNab and Avers, 1994) of the temperate-boreal ecotone (N 47° 30.476'; W 93° 27.162'; 410 m ASL). The main SPRUCE experiment consists of 10 chambered plots and 2 unchambered plots located in the S1 Bog of the Marcell Experimental Forest. The S1 Bog is an 8.1 ha ombrotrophic Sphagnum bog with a mean peat depth of 2.5 m (Boelter and Verry, 1977; Nichols, 1998) and peat depth exceeding 9 m in some areas (Parsekian et al., 2012). The site has a continental climate, with mean annual precipitation of 780 mm and mean monthly air temperatures ranging from −15°C in January to 19°C in July (Sebestyen et al., 2011).
The bog surface is dominated by a bryophyte layer of Sphagnum species, with minor components of aulacomnium moss [Aulacomnium palustre (Hedw.) Schwägr.], Schreber's big red stem moss [Pleurozium schreberi (Brid.) Mitt.], and juniper polytrichum moss (Polytrichum juniperinum Hedw.). The vascular plant community consists of a discontinuous overstory of P. mariana and tamarack [Larix laricina (Du Roi) K. Koch] and an understory composed of shrubs and graminoids. The understory is dominated (~80% of aboveground biomass) by the ericaceous shrubs R. groenlandicum and C. calyculata, but also contains bog rosemary (Andromeda polifolia L.), bog laurel (Kalmia polifolia Wangenh.), creeping snowberry (Gaultheria hispidula (L.) Muhl. ex Bigelow), three-seeded sedge (Carex trisperma Dewey), tussock cottongrass (Eriophorum vaginatum L.), pitcherplant (Sarracenia purpurea L.), and threeleaf false lily of the valley [Maianthemum trifolium (L.) Sloboda] (Hanson et al., 2017).
The SPRUCE experimental plots are octagonal with a width of ~9 m, surrounded by a boardwalk with moveable walkways to limit the impact of sampling the plot interior (Hanson et al., 2017). The interior measurement plots are each surrounded by a 12 m wide, 7 m high octagonal open-top enclosure sealed to the peat surface made of double walled 16 mm acrylic glazing, with a 35° frustum designed to limit heat loss while permitting inputs of natural precipitation; the frustum adds an additional ~1.4 m height. Each plot was hydrologically isolated from the surrounding bog with interlocking vinyl sheet-pile walls (Sebestyen and Griffiths, 2016), placed outside of the enclosure circumference to allow water running off the walls to remain within the plot. This method of hydrologic isolation allows for drainage of the plots when water levels approach the acrotelm, analogous to outflow from the bog, while allowing for collection of outflow for chemical analysis and drops in the water table from treatment effects, especially increased evapotranspiration from WEW. The 10 enclosed and 2 non-enclosed plots shared a common set of measurements, both automated and manual (Krassovski et al., 2015; Hanson et al., 2017). We focused measurements on only the 10 chambered plots to keep chamber effects on environmental conditions, such as light, consistent between treated plots and controls (Hanson et al., 2017). Each chambered plot had a unique combination of treatment levels in a regression design (Cottingham et al., 2005). The WEW treatments were relative to the chambered control plot, with targets of +0.00, +2.25, +4.50, +6.75, and +9.00°C above the control. In one-half of the plots, elevated atmospheric [CO2] treatments (eCO2, +500 ppm) began 15 June 2016. Control depth for soil temperature was −2 m and control height for air temperature and atmospheric CO2 was 2 m, while tests of control systems show consistent vertical profiles in the treatment targets. These profiles and further details on CO2 and temperature regulation, as well as chamber effects on light and precipitation can be found in Hanson et al. (2017).
Gas Exchange Measurements
We sampled the 2016 cohort of leaves on the two major shrub species (C. calyculata and R. groenlandicum) during three sample periods over their lifespan. The typical lifespan of leaves of these species at this site extends from early May to the following early June, with a dormant period during the winter. This dormant period typically begins in October, but the WEW treatments extend canopy greenness until up to early December (Richardson et al., 2018). Thus, we targeted measurements of newly emerged (8–14 June 2016), mature (1–19 September 2016), and overwintered leaves (12–14 May 2017). During each of these sampling periods, we measured gas exchange in the field on one to three individuals per plot per species, using dual infrared gas-analyzer (IRGA) photosynthesis systems (either LI-6400XT or LI-6800; LI-COR, Inc., Lincoln, Nebraska, USA) with a red-blue light-emitting diode (LED) light source and 6 cm2 chamber. Up to four systems were used in a given sample period. IRGA zeros and spans were checked at the beginning of each day and matched before each measurement. Samples within a plot for a sample period were summarized as a mean value and the plot was treated as the experimental unit.
For each sample, we measured net photosynthesis (AST) at standard temperature (25°C) and [CO2] (400 ppm). After 20 min of dark acclimation, we also measured respiration (RD25) at this temperature and [CO2]. Finally, we measured net photosynthesis in the growing conditions of each chamber (AGR). These measurements were made at either 400 ppm (as an approximation of ambient [CO2]) or 900 ppm [CO2] (ambient +500 ppm) and growing temperature, which we defined as the mean daytime temperature of the 10 days preceding the measurement period for the species at 1 m height in the control plot, plus the WEW target for each plot. The control plot target temperatures were 18.9 and 13.1°C for the June 2016 and May 2017 campaigns, respectively. In the September 2016 campaign, we measured each species in a different week, so separate control targets were set: 20.2°C for C. calyculata and 23.0°C for R. groenlandicum. Data analyses for AGR, however, was performed using measured leaf temperature, not the targets for each plot.
Earlier gas exchange measurements at this site indicated that net CO2 assimilation rates generally saturate at or below a photosynthetic photon flux density (PPFD) of 700 μmol m−2 s−1 (Jensen et al., 2019). Accordingly, we conducted all photosynthesis measurements at 1,000 μmol m−2 s−1 to ensure light saturation while avoiding photoinhibition. Leaves from gas exchange were marked and measured for leaf area inside the gas exchange cuvette before being harvested.
While we tried to capture a snapshot of growing conditions using AGR, actual field conditions show great variability over a given day or month. To illustrate, the mean half-hourly air temperature in June 2016 at 1 m height in the control chamber ranged from 3.4 to 34.6°C, with the differences in daily maxima and minima often exceeding 20°C. Thus, while 25°C may seem high for a “standard” temperature in a climate where the highest monthly mean temperature is 19°C, it is not an uncommon daytime temperature in the growing season. However, given possible non-linearities in the temperature responses of photosynthesis and respiration, measurements under only one or two sets of conditions are only indicators of possible acclimation to growth conditions.
Leaf Structure and Chemical Analyses
All harvested leaves from gas-exchange samples were placed on ice until transport to facilities off-site for oven drying at 70°C for several weeks before being ground to powder. Leaf mass per area (LMA) was determined as the projected (one-sided) leaf area, divided by dry mass. To determine N concentration, a subsample was taken from the powder of each leaf sample and analyzed via combustion gas chromatography using an ECS 4010 CHNSO Analyzer (Costech Analytical Technologies Inc., Valencia, California, USA).
Foliar samples for NSC analyses were collected in a separate campaign in August 2016. These samples microwaved (90 s) at on-site facilities to halt enzyme activity, then immediately placed into a freezer until shipped on ice off-site for oven drying and grinding. Samples were assayed for NSC with defined categories: free sugars (glucose and fructose), all soluble sugars (free sugars and sucrose), and starch, following procedures outlined in Woodruff and Meinzer (2011). Distilled water was combined with 10–15 mg of plant sample powder and extracted in steam for 1.5 h. Photometric determination was made based on a 340 nm absorbance of samples in solution against a reference [D-(+)-Glucose solution 1 mg mL−1 in 0.1% benzoic acid; Sigma-Aldrich, St. Louis, Missouri, USA] on a Synergy 2 Multi-Mode Microplate Reader (Biotek, Winooski, Vermont, USA) after glucose conversion to glucose-6-P. Aliquots were taken from centrifuged water extracted samples to determine free sugars. Another set of aliquots was combined with invertase from baker's yeast (Saccharomyces cerevisiae Hansen, Grade VII, ≥300 units mg−1) for sucrose extraction. Sucrose concentration was determined by subtracting the initial free sugar concentration from this post-sucrose-extraction NSC concentration. Total non-structural carbohydrates (TNC) was determined with the final set of aliquots by placement in a water bath overnight at 48°C after combination with amyloglucosidase from Aspergillus niger van Tieghem. Starch concentrations were determined by subtracting post-sucrose-extraction NSC concentration from TNC.
Statistical Analyses
For each measurement period and species, we fit a series of models with temperature (T; degrees Celsius) and eCO2 as a factor (C; 1 for eCO2, 0 for ambient), then ranked them according to Akaike's Information Criterion corrected for sample size (AICc) (Bolker, 2008). For AGR, T was measured leaf temperature. For all other variables, T was the mean growing season temperature (April–October 2016) difference at 1-m canopy height, relative to the control chamber. Because the response over five levels of WEW may not be linear, we considered second-order polynomial terms for T. Models included lower order terms if an interaction or polynomial term was included. Models considered for the June measurements, before initiation of the eCO2 treatment, were: T2 + T, T, and an intercept only model. For other measurement dates, these models were considered, as well as: C × (T2 + T), C + T2 + T, C × T, C + T, and C. All analyses were conducted in R version 3.4.3 (R Core Team, 2018) using the MuMIn package (Barton, 2018) to compare all models using AICc. All data used in these analyses are publicly available (Ward et al., 2019).
Results
The top statistical models (those with Akaike weights > 0.10), as selected by Akaike Information Criterion corrected for sample size (AICc), are presented in Table 1 for gas exchange variables and Table 2 for leaf chemistry variables. We also present coefficient of determination (R2) for these models, not as the basis for model selection, but as a metric of variance explained by the model. In the following figures, we present the top ranked model along with plot means for newly emerged (June 2016), mature (September 2016), and overwintered (May 2017) leaves of each species. Note that eCO2 treatment (atmospheric [CO2] + 500 ppm) was initiated following the June 2016 measurement period. Warming treatments are presented as mean growing season temperature (April–October 2016) difference at 1 m canopy height, relative to the control chamber (e.g., Figures 1, 2), except for net photosynthesis at treatment [CO2] and air temperature (AGR; Figure 3) where measured leaf temperature is presented.
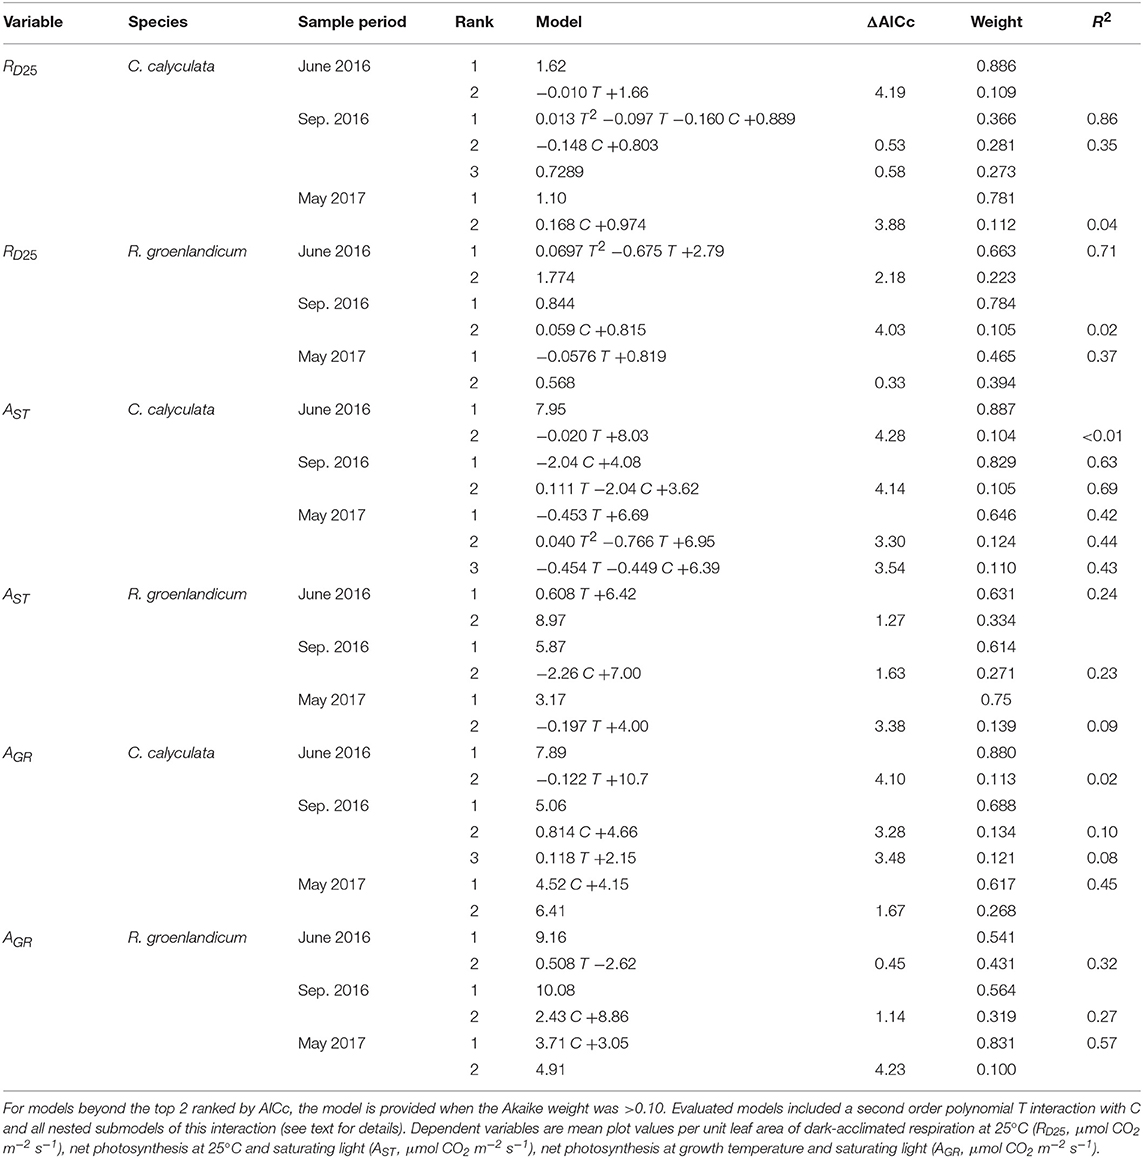
Table 1. Top two models for each gas exchange variable, species, and measurement period as evaluated by Akaike Information Criterion corrected for sample size (AICc) for the independent variables temperature (T, Celsius) and elevated [CO2] treatment (C, 0 = ambient [CO2], 1 = +500 ppm).
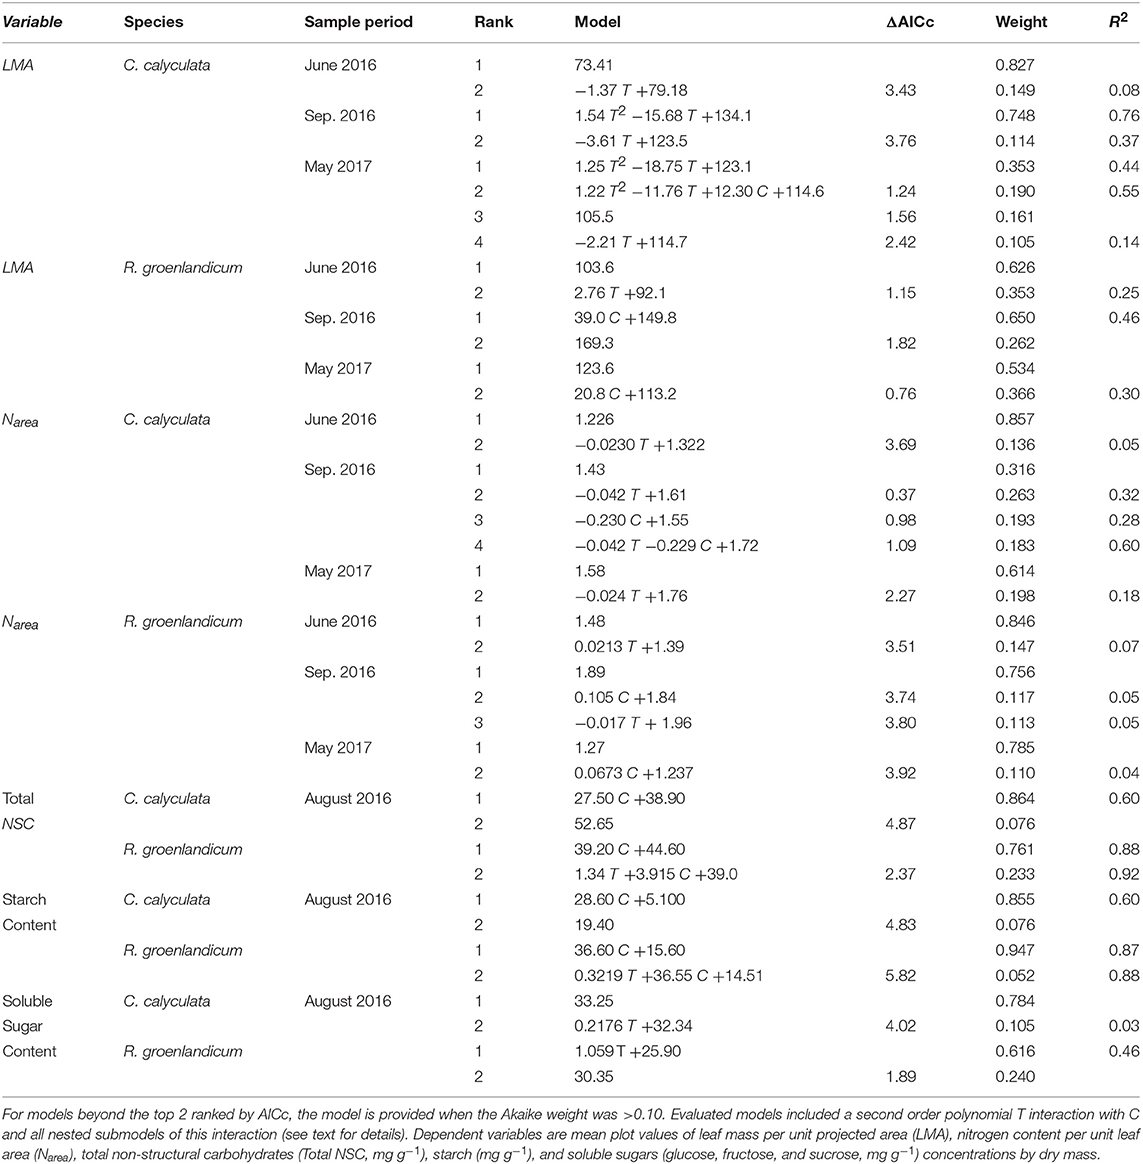
Table 2. Top two models for each leaf structure and chemistry variable, species, and measurement period as evaluated by Akaike Information Criterion corrected for sample size (AICc) for the independent variables temperature (T, Celsius) and elevated [CO2] treatment (C, 0 = ambient [CO2], 1 = +500 ppm).
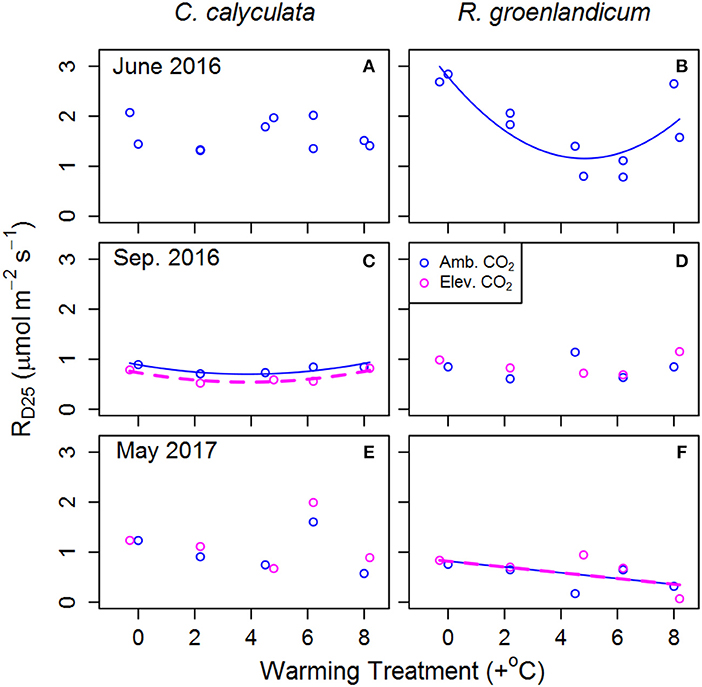
Figure 1. Mean dark-acclimated respiration per unit leaf area at 25°C (RD25) for two shrub species at the SPRUCE site, for newly expanded (A,B; June 2016), mature (C,D; September 2016), and overwintered (E,F; May 2017) leaves in each plot. Warming treatments indicate growing season (April–October) mean daytime temperature difference from the control plot and color indicates ambient (400 ppm) or elevated (900 ppm) [CO2] treatments. Lines indicate fit of best model, as evaluated using Akaike Information Criterion corrected for sample size (AICc). Panels without lines have intercept-only best models as shown in Table 1.
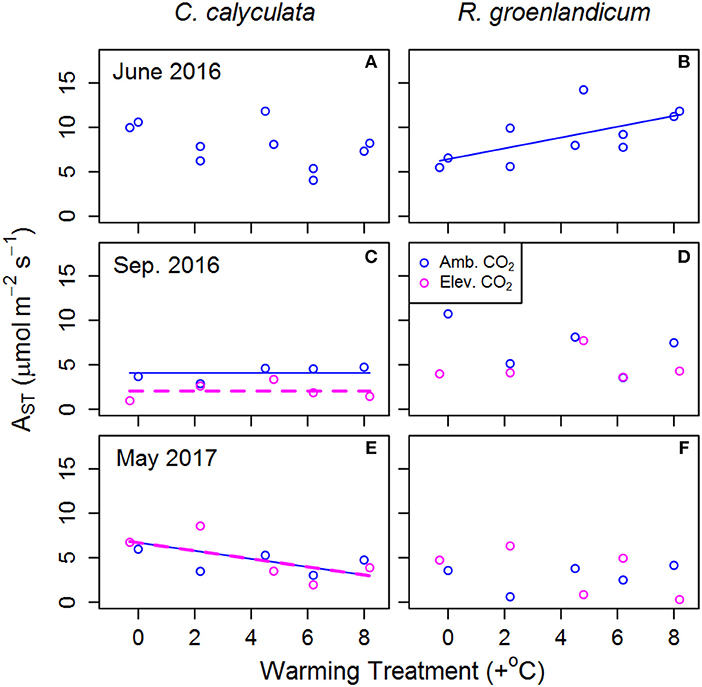
Figure 2. Mean net photosynthesis per unit leaf area at 25°C, 400 ppm [CO2] and saturating light (AST) for two shrub species at the SPRUCE site in each plot, for newly expanded (A,B; June 2016), mature (C,D; September 2016), and overwintered (E,F; May 2017) leaves. Warming treatments indicate growing season (April–October) mean daytime temperature difference from the control plot and color indicates ambient (400 ppm) or elevated (900 ppm) [CO2] treatments. Lines indicate fit of best model, as evaluated using Akaike Information Criterion corrected for sample size (AICc). Panels without lines have intercept-only best models as shown in Table 1.
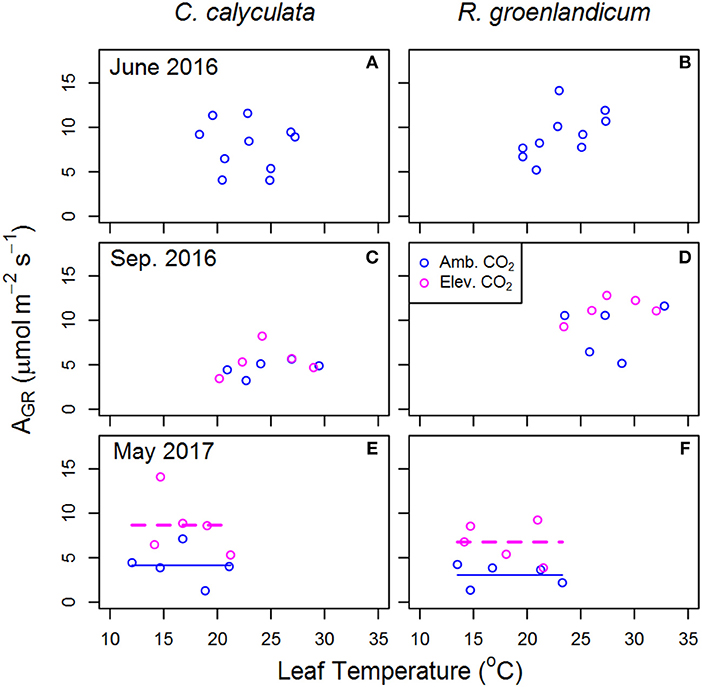
Figure 3. Mean net photosynthesis per unit leaf area at saturating light (AGR) for two shrub species at the SPRUCE site in each plot, for newly expanded (A,B; June 2016), mature (C,D; September 2016), and overwintered (E,F; May 2017) leaves vs. mean measured leaf temperature. Leaf temperature and chamber [CO2] were targeted to growth conditions of each plot. Elevated atmospheric [CO2] treatments (+500 ppm) began the week following the June 2016 measurements. Lines indicate fit of best model, as evaluated using Akaike Information Criterion corrected for sample size (AICc). Panels without lines have intercept-only best models as shown in Table 1.
Gas Exchange
We examined RD25 (dark respiration rate at 25°C) as an indicator of thermal acclimation of respiration to WEW treatments, with RD25 expected to decline with increasing WEW in cases of thermal acclimation. In newly emerged leaves of C. calyculata, RD25 exhibited no response to WEW, while it exhibited a curvilinear response in those of R. groenlandicum (Figures 1A,B). In mature leaves, RD25 was lower in eCO2 plots with a weak curvilinear response to temperature in C. calyculata, while showing no response to either treatment in R. groenlandicum (Figures 1C,D). In overwintered leaves, C. calyculata did not exhibit a clear response to WEW, while R. groenlandicum exhibited lower RD25 with increasing WEW. Neither species exhibited a response of RD25 to eCO2 treatment in overwintered foliage.
Net photosynthesis at 25°C, saturating light and [CO2] at 400 ppm (AST) was examined as an indicator of changes in basal photosynthetic rates under a common set of conditions. In newly emerged leaves in R. groenlandicum, AST increased with WEW, but not in those in C. calyculata (Figures 2A,B). In mature leaves of C. calyculata, there was a decrease in AST with eCO2, but not in R. groenlandicum (Figures 2C,D). Overwintered leaves of C. calyculata exhibited lower AST with increasing WEW, while those of R. groenlandicum did not exhibit a clear response to WEW (Figures 2D,E). Neither species exhibited a response of AST to eCO2 treatment in overwintered foliage.
Estimates of net photosynthesis at treatment [CO2] and air temperature (AGR) are presented as an indicator of differences in photosynthetic rates realized in field conditions. In newly emerged leaves, we saw that the best model for AGR response to WEW in R. groenlandicum was a constant value, although this model was nearly equally weighted by AICc with a positive response to temperature (Table 1). Despite a decrease in AST with eCO2 in mature leaves of C. calyculata (Figure 2C), AGR did not show a notable response to eCO2 in either species (Figures 3C,D). As in June, high variability in AGR of R. groenlandicum in September led to similar weights between an intercept-only model and a positive response (+27%) to eCO2 (Akaike weight 0.564 vs. 0.319; Table 1). What may be more notable was that, even at more than double [CO2], AGR was not higher under eCO2 across WEW treatments in C. calyculata during this season (Figure 3C), with an intercept-only model being weighted much more heavily than a positive effect of eCO2 (Akaike weight 0.688 vs. 0.134; Table 1). On the other hand, overwintered leaves grown in eCO2 showed consistently higher AGR across WEW treatments in both species (Figures 3E,F).
Leaf Structure and Chemistry
Leaf mass per area (LMA) in newly emerged leaves showed no consistent response to WEW in either species (Figures 4A,B; Table 2). We saw a non-linear dependence of LMA on WEW temperature in mature and overwintered leaves of C. calyculata (Figures 4C,E), with warmed plots having lower LMA than the control, but no impact of eCO2 on LMA in this species. LMA increased from June to September for R. groenlandicum (Figure 4B vs. Figure 4D), with mature leaves grown in eCO2 exhibiting higher LMA in this species. In overwintered leaves of R. groenlandicum, we did not observe a consistent response to either treatment.
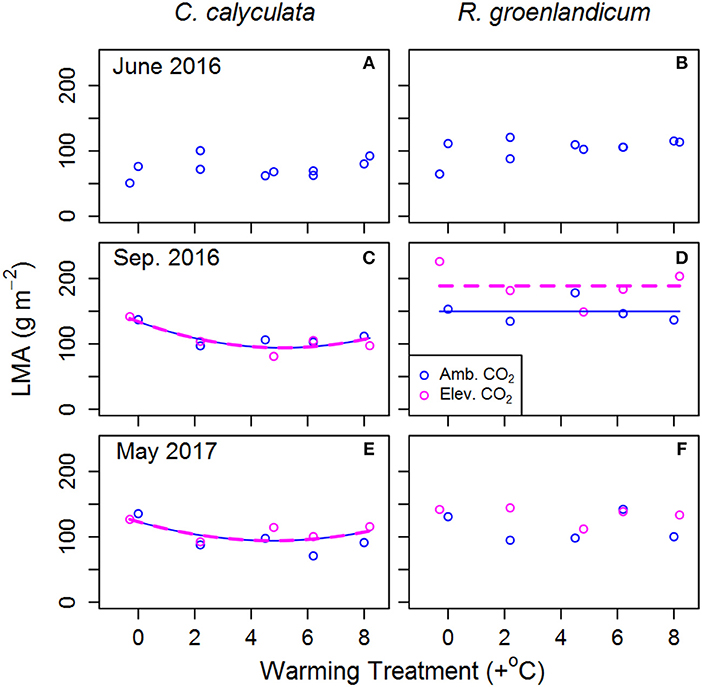
Figure 4. Mean leaf mass per unit projected leaf area (LMA) for two shrub species at the SPRUCE site in each plot, for newly expanded (A,B; June 2016), mature (C,D; September 2016), and overwintered (E,F; May 2017) leaves. Lines indicate fit of best model, as evaluated using Akaike Information Criterion corrected for sample size (AICc). Panels without lines have intercept-only best models as shown in Table 2.
We found no consistent response to nitrogen content per unit leaf area (Narea) to either treatment in either species in any season (Table 2). Mature leaves collected in August 2016 exhibited consistently higher total NSC under eCO2 across WEW treatments in both species (Figure 5; Table 2). In C. calyculata, this is attributable almost exclusively to starch, with soluble sugars being relatively consistent across treatments. In R. groenlandicum, elevated starch levels under eCO2 are still the primary source of variability, with soluble sugars increasing somewhat with WEW but not eCO2.
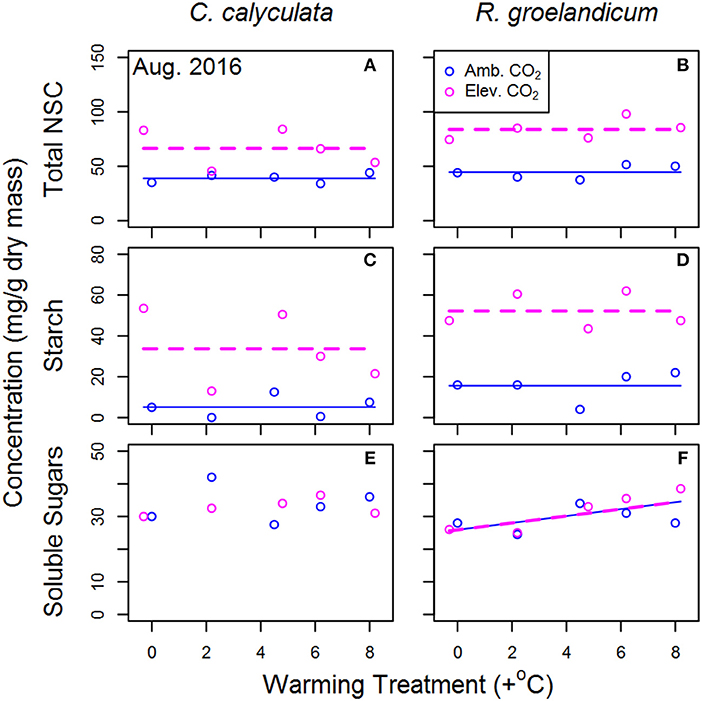
Figure 5. Mean proportion of non-structural carbohydrates (NSC) by dry mass for mature leaves of two shrub species at the SPRUCE site in each plot. Warming treatments indicate mean growing season temperature (April–October 2016) difference at 1 m canopy height, relative to the control chamber (Plot 6). Lines indicate fit of best model, as evaluated using Akaike Information Criterion corrected for sample size (AICc). Panels without lines have intercept-only best models as shown in Table 2. Total non-structural carbohydrates (NSC; A,B), starch (C,D) and soluble sugars (sucrose and fructose; E,F).
Discussion
Treatment Effects on Mature Leaves
Experimental treatment effects on plant physiology are often assessed on mature leaves during the peak growing season. In our study, this would correspond to our September 2016 sample period (Figures 1C,D, 2C,D, 3C,D, 4C,D). There was a minor effect of WEW in mature leaves of C. calyculata, with moderate levels of WEW associated with decreased respiration (RD25) (Figure 1C) and lower LMA (Figure 4C). Photosynthesis under standardized temperature and [CO2] (AST) decreased by ~50% in leaves grown under eCO2 relative to those grown under ambient [CO2] in this species (Figure 2C), whereas photosynthesis under growth temperatures and [CO2] (AGR) showed no response to either treatment (Figure 3C).
Past CO2 studies have shown a decreased investment in photosynthetic enzymes per unit leaf area, such as Rubisco, with eCO2 (Ainsworth and Long, 2005). While we did not measure Rubisco content, we did not observe a decrease in Narea that corresponded to decreased AST in C. calyculata. In a field fertilization study with a much greater range of Narea than our study, no relation between Narea and AST was found for R. groenlandicum and only a weak relation was found for C. calyculata (Bubier et al., 2011). Pretreatment data for these species at this site also exhibited poor correlation between leaf N and photosynthetic parameters (Jensen et al., 2019). Thus, it seems that decreased AST under eCO2 cannot be explained by changes in Narea.
In mature leaves of R. groenlandicum, we saw no consistent response in RD25, AST, or AGR to either treatment (Figures 1D, 2D, 3D, respectively). We would note, however that high plot-to-plot variability would have made it difficult to resolve an impact of eCO2 on AST or AGR in mature leaves of this species. We did observe an increase of LMA with eCO2 in this species (Figure 4). Increases in LMA may impact light absorption, gas diffusion and, in Rhododendron species, increase drought tolerance while reducing frost tolerance via thermonasty (Niinemets and Sack, 2006; Niinemets, 2016). Thus, while we see no correspondence of this LMA change to net photosynthesis or respiration rates measured in this study, it may warrant future investigation in evaluating other aspects of leaf-level physiology.
Source-sink imbalance in carbohydrates has also been observed in previous eCO2 studies and linked to reduce photosynthesis (Ainsworth and Long, 2005; Li et al., 2018). In both species, measurements of NSC content (Figure 5) increased dramatically in response to eCO2, particularly in the form of starch. The seasonal pattern of NSC in foliage of these species is typically near a minimum in September, as reserves have been drawn down through canopy expansion in preceding months (Furze et al., 2018). Thus, the accumulation of NSC under eCO2 may warrant further investigation across seasons (and in tissues beyond leaves) as an indicator of such source-sink imbalances.
One limitation to photosynthesis not considered in our measurements is P availability, which is commonly associated with increased leaf starch concentrations (Marschner, 2012). Pretreatment data from this site indicate colimitation of growth by P and N with a P:N ratio of ~16 (Phillips et al., 2017). There exists some uncertainty that, if N availability increased as a result of WEW, these species would assimilate additional N into photosynthetic enzymes. At a similar bog in North America, where N:P ratios are typically 15–20 in these species (Wang and Moore, 2014), fertilization with N decreased leaf P content and changes in foliar polyamines and amino acids were consistent with those under physiological stress from excess N (Bubier et al., 2011). Whatever the cause of lower AST in eCO2 in C. calyculata, it does not result in reductions of realized photosynthesis as represented by AGR, given the positive effects of eCO2 on carbon assimilation (Figures 3C,E). Neither, however, are there consistent increases in AGR in either species with eCO2, as one might expect with a +500 ppm treatment.
Treatment Effects on Newly Emerged and Overwintered Leaves
We found that the effects of WEW and eCO2 on leaf gas exchange and chemistry varied by species during periods of rapid changes in leaves of these species, both after emergence and after recovery from winter dormancy. In C. calyculata, we observed no response to WEW in RD25, AST, AGR, LMA, or Narea (Tables 1, 2) in newly emerged leaves. On the other hand, in newly emerged leaves of R. groendlandicum, we saw an increase in AST with increasing WEW (Figure 2B). We also observed a decrease in RD25 in this species with WEW, until the highest WEW treatments were reached (Figure 1B). To some degree, this decrease may represent thermal acclimation of respiration, widely observed across tree species (Way and Oren, 2010), but this could not explain the increase at the highest level of WEW. However, as this is a period of leaf growth and expansion, our results are also likely impacted by phenological shifts.
At the SPRUCE site, both manual observations of flowering dates of these two species (Heiderman et al., 2018) and automated “phenocam” data of shrub layer greenness in the experimental plots (Richardson et al., 2018) are available. Manual observations outside of the chambers documented that R. groenlandicum began flowering only on 1 June 2016, while C. calyculata began flowering 6 May 2016. Automated phenological observations within the SPRUCE chambers detected canopy development in the shrub layer approximately 18 days earlier in the warmest WEW treatments compared to the control (Richardson et al., 2018). Thus, the patterns in gas exchange we observe in R. groenlandicum during our June measurements may represent accelerated leaf ontogeny under WEW, while leaves in C. calyculata may have reached a similar developmental stage across WEW treatments by this time. This role of phenology in the springtime response is further supported by the lack of WEW effects on basal rates of respiration and photosynthesis in mature leaves of R. groenlandicum measured in early September (Figures 1D, 2D).
As in newly emerged leaves, responses of overwintered leaves to treatments varied by species, with AST declining with WEW temperature in C. calyculata, but not R. groenlandicum (Figures 2E,F). On the other hand, RD25 declined with WEW in R. groenlandicum, but not C. calyculata (Figures 1E,F). Measurements of AGR (Figures 3E,F) indicate a large enhancement of photosynthesis under eCO2 across temperatures in overwintered leaves of both species, while those of AST do not indicate a decrease with eCO2 (Figures 2E,F). This contrasts with measurements made during the preceding September, indicating that apparent acclimation to eCO2 may be seasonally variable. As the current year's cohort of leaves are beginning to develop during this period, it may be that there is less of a source-sink imbalance for photosynthates at this time of year. Differences between species and treatments in the physiology of overwintered leaves may also reflect differential damage from winter conditions. It has long been noted that the depth of snowpack and timing of snow melt can impact the extent of winter damage to foliage of such ericaceous shrubs (Gates, 1912). As with newly emerged leaves, phenological shifts in response to treatments may impact observed physiological rates, such as through timing of the loss of freezing tolerance (Richardson et al., 2018) or senescence of overwintered leaves.
Implications for Modeling Ecosystem Response to Changing Environments
For SPRUCE, models calibrated to pretreatment gas exchange parameters predicted declines of ~50–95% in net primary productivity (NPP) of these two species in a +9°C WEW scenario under ambient CO2, but only 0–15% under eCO2 (Jensen et al., 2019). At current temperatures, the NPP of the shrub layer was predicted to increase 40–100% under eCO2. However, these modeling efforts did not consider acclimation to eCO2 or WEW. Both experimental and modeling studies have shown that such acclimation can buffer responses of both photosynthesis and respiration determined from short-term variation in temperature and [CO2] (Dewar et al., 1999; Smith and Dukes, 2013; Reich et al., 2016; Smith, 2017; Dusenge et al., 2019; Kumarathunge et al., 2019; Vico et al., 2019).
Ultimately, ecosystem level observations of carbon stocks and flows, such as biomass and annual NPP, must constrain models that use physiological processes to predict ecosystem response. Previous observational and experimental studies indicate that warmer and drier environments may cause a shift in northern plant communities toward a greater abundance and biomass of ericaceous shrubs. A large mesocosm study using intact monoliths from a North American bog found that heating with infrared lamps favored shrub growth over that of graminoids and decreases in the water table led to increased shrub growth and decreased bryophyte productivity (Weltzin et al., 2000). Similarly, mesocosm studies in northern Europe have found increases in ericaceous shrub cover in boreal communities that are transplanted southward (Breeuwer et al., 2010) and that are exposed to intermittent drops in water levels (Breeuwer et al., 2009). Over a 12 year period of local warming, shrub cover was observed to increase in a tussock tundra community with greater increases observed in open-top chambers used to passively warm the plant community within them (Molau, 2010). In a study of ombrotrophic peatland soils across an altitude range that corresponded to a ~5°C increase in mean soil temperatures and decreasing soil moisture from high to low sites, it was concluded that increases in ericaceous shrub cover could be part of a positive feedback between shifts in leaf litter chemistry, nutrient cycling, and microbial community composition (Bragazza et al., 2013).
Given the increase in the duration of canopy greenness of this layer under WEW (Richardson et al., 2018) combined with our observations of higher photosynthesis in the early growing season for R. groenlandicum (Figures 2B, 3B), we may expect warming to increase shrub productivity by extension of the growing season. Our results are in general agreement with observations of increased shrub leaf area under WEW at this site, but with no large effect of eCO2 (McPartland et al., 2019). However, instantaneous measurements such as those presented here do not capture the full carbon economy of the leaf. To fully understand the integrated response of the plant community to the treatments, measurements of leaf gas-exchange must be combined with other information, such as community composition and leaf area (e.g., Weltzin et al., 2000; McPartland et al., 2019), phenology (e.g., Richardson et al., 2018), profiles of nutrient availability and rooting density (e.g. Iversen et al., 2018), Sphagnum productivity (e.g., Walker et al., 2017), and integrated understory gas exchange (e.g., Hanson et al., 2016).
Importantly, our findings of WEW effects in newly emerged and overwintered leaves connect two previous findings from this site: shifts in phenology of canopy greenness in these species (Richardson et al., 2018) and seasonal variation in parameters describing photosynthesis and respiration (Jensen et al., 2019), which are critical to modeling annual productivity. Also important to such efforts are our observations that C. calyculata leaves grown in eCO2 may have a decreased basal rate of net photosynthesis and that eCO2 treatments have not consistently increased photosynthesis, despite more than a doubling of CO2. Additionally, we see no clear indication of a decrease in net photosynthesis with WEW in mature leaves. We would note that the information-theory approach to analysis used here would allow predictions of treatment impacts not just from a single set of equations fit to our observations, but an ensemble of explanatory models with relevant weights (Tables 1, 2). Future research on the role of leaf structure, nutrients and photosynthate transport and utilization is needed to understand whole-plant responses to these treatments and thus predict ecosystem response to novel environments. Through the combined efforts of intensive measurement campaigns and integrative modeling efforts (e.g., Jiang et al., 2018; Jensen et al., 2019), it may be possible to capture the responses of individual species to this novel long-term field manipulation and build better predictions of ecosystem response to global change in this critical ecotone between the boreal and temperate regions.
Data Availability
The data will be available at the website: https://mnspruce.ornl.gov/public-data-download with the doi: 10.25581/spruce.061/1493603.
Author Contributions
EW collected data, performed statistical analyses, and drafted the paper. JW and DM collected data and developed leaf chemical/structural analyses. All authors contributed to experimental design, interpretation of results, and writing of the paper.
Disclaimer
This manuscript has been co-authored by UT-Battelle, LLC under Contract No. DE-AC05-00OR22725 with the US Department of Energy. The United States Government retains and the publisher, by accepting the article for publication, acknowledges that the United States Government retains a non-exclusive, paid-up, irrevocable, world-wide license to publish or reproduce the published form of this manuscript, or allow others to do so, for United States Government purposes. The Department of Energy (DOE) will provide public access to these results of federally sponsored research in accordance with the DOE Public Access Plan (http://energy.gov/downloads/doe-public-access-plan).
This manuscript has been peer reviewed and approved for publication consistent with USGS Fundamental Science Practices (https://pubs.usgs.gov/circ/1367/).
Conflict of Interest Statement
The authors declare that the research was conducted in the absence of any commercial or financial relationships that could be construed as a potential conflict of interest.
Acknowledgments
We greatly appreciate field and laboratory support by Joanne Childs, Deanne Brice, and Robert Nettles. This material is based upon work supported by the U.S. Department of Energy, Office of Science, Office of Biological and Environmental Research. ORNL is managed by UT-Battelle, LLC, for the DOE under contract DE-AC05-00OR22725. Any use of trade, firm, or product names is for descriptive purposes only and does not imply endorsement by the U.S. Government.
References
Ainsworth, E. A., and Long, S. P. (2005). What have we learned from 15 years of free-air CO2 enrichment (FACE)? A meta-analytic review of the responses of photosynthesis, canopy properties and plant production to rising CO2. New Phytol. 165, 351–372. doi: 10.1111/j.1469-8137.2004.01224.x
Atkin, O. K., Bloomfield, K. J., Reich, P. B., Tjoelker, M. G., Asner, G. P., Bonal, D., et al. (2015). Global variability in leaf respiration in relation to climate, plant functional types and leaf traits. New Phytol. 206, 614–636. doi: 10.1111/nph.13253
Barton, K. (2018). MuMIn: Multi-Model Inference. Available online at: https://CRAN.R-project.org/package=MuMIn (accessed April 08, 2019).
Boelter, D. H., and Verry, E. S. (1977). Peatland and water in the northern Lake States. USDA Forest Service, North Central Forest Experiment Station.
Bragazza, L., Parisod, J., Buttler, A., and Bardgett, R. D. (2013). Biogeochemical plant–soil microbe feedback in response to climate warming in peatlands. Nat. Clim. Change 3:273. doi: 10.1038/nclimate1781
Breeuwer, A., Heijmans, M. M., Robroek, B. J., and Berendse, F. (2010). Field simulation of global change: transplanting northern bog mesocosms southward. Ecosystems 13, 712–726. doi: 10.1007/s10021-010-9349-y
Breeuwer, A., Robroek, B. J., Limpens, J., Heijmans, M. M., Schouten, M. G., and Berendse, F. (2009). Decreased summer water table depth affects peatland vegetation. Basic Appl. Ecol. 10, 330–339. doi: 10.1016/j.baae.2008.05.005
Bridgham, S. D., Pastor, J., Dewey, B., Weltzin, J. F., and Updegraff, K. (2008). Rapid carbon response of peatlands to climate change. Ecology 89, 3041–3048. doi: 10.1890/08-0279.1
Bubier, J. L., Smith, R., Juutinen, S., Moore, T. R., Minocha, R., Long, S., et al. (2011). Effects of nutrient addition on leaf chemistry, morphology, and photosynthetic capacity of three bog shrubs. Oecologia 167, 355–368. doi: 10.1007/s00442-011-1998-9
Cairney, J. W., and Meharg, A. A. (2003). Ericoid mycorrhiza: a partnership that exploits harsh edaphic conditions. Eur. J. Soil Sci. 54, 735–740. doi: 10.1046/j.1351-0754.2003.0555.x
Cottingham, K. L., Lennon, J. T., and Brown, B. L. (2005). Knowing when to draw the line: designing more informative ecological experiments. Front. Ecol. Environ. 3, 145–152. doi: 10.1890/1540-9295(2005)003[0145:KWTDTL]2.0.CO;2
Dewar, R. C., Medlyn, B. E., and Mcmurtrie, R. E. (1999). Acclimation of the respiration/photosynthesis ratio to temperature: insights from a model. Glob. Change Biol. 5, 615–622. doi: 10.1046/j.1365-2486.1999.00253.x
Dusenge, M. E., Duarte, A. G., and Way, D. A. (2019). Plant carbon metabolism and climate change: elevated CO2 and temperature impacts on photosynthesis, photorespiration and respiration. New Phytol. 221, 32–49. doi: 10.1111/nph.15283
Furze, M. E., Jensen, A. M., Warren, J. M., and Richardson, A. D. (2018). Seasonal patterns of nonstructural carbohydrate reserves in four woody boreal species1. J. Torrey Bot. Soc. 145, 332–340. doi: 10.3159/TORREY-D-18-00007.1
Gates, F. C. (1912). The relation of snow cover to winter killing in Chamaedaphne calyculata. Torreya 12, 257–262.
Gorham, E. (1991). Northern peatlands: role in the carbon cycle and probable responses to climatic warming. Ecol. Appl. 1, 182–195. doi: 10.2307/1941811
Griffiths, N. A., Hanson, P. J., Ricciuto, D. M., Iversen, C. M., Jensen, A. M., Malhotra, A., et al. (2017). Temporal and spatial variation in peatland carbon cycling and implications for interpreting responses of an ecosystem-scale warming experiment. Soil Sci. Soc. Am. J. 81, 1668–1688. doi: 10.2136/sssaj2016.12.0422
Grigal, D. F., Bates, P. C., and Kolka, R. K. (2011). “Ecosystem carbon storage and flux in upland/peatland watersheds in northern Minnesota,” in Peatland Biogeochemistry and Watershed Hydrology at the Marcell Experimental Forest, eds R. K. Kolka, S. D. Sebestyen, E. S. Verry, and K. N. Brooks (Boca Raton, FL: CRC Press, 243–296.
Hanson, P. J., Gill, A. L., Xu, X., Phillips, J. R., Weston, D. J., Kolka, R. K., et al. (2016). Intermediate-scale community-level flux of CO2 and CH4 in a Minnesota peatland: putting the SPRUCE project in a global context. Biogeochemistry 129, 255–272. doi: 10.1007/s10533-016-0230-8
Hanson, P. J., Riggs, J. S., Nettles, I. V. W. R., Phillips, J. R., Krassovski, M. B., et al. (2017). Attaining whole-ecosystem warming using air and deep-soil heating methods with an elevated CO2 atmosphere. Biogeosciences 14, 861–883. doi: 10.5194/bg-14-861-2017
Hébert, F., and Thiffault, N. (2011). The biology of canadian weeds. 146. Rhododendron groenlandicum (Oeder) Kron and Judd. Can. J. Plant Sci. 91, 725–738. doi: 10.4141/cjps2010-012
Heiderman, R. R., Nettles, W. R., Ontl, T. A., Latimer, J. M., Richardson, A. D., and Hanson, P. J. (2018). SPRUCE Manual Phenology Observations and Photographs Beginning in 2010. Oak Ridge, TN: Oak Ridge National Lab. (ORNL).
Hileman, D. R., and Lieto, L. F. (1981). Mortality and area reduction in leaves of the bog shrub Chamaedaphne calyculata (Ericaceae) caused by the leaf miner Coptodisca kalmiella (Lepidoptera: Heliozelidae). Am. Midl. Nat. 106, 180–188. doi: 10.2307/2425147
Iversen, C. M., Childs, J., Norby, R. J., Ontl, T. A., Kolka, R. K., Brice, D. J., et al. (2018). Fine-root growth in a forested bog is seasonally dynamic, but shallowly distributed in nutrient-poor peat. Plant Soil 424, 123–143. doi: 10.1007/s11104-017-3231-z
Jensen, A. M., Warren, J. M., King, A. W., Ricciuto, D. M., Hanson, P. J., and Wullschleger, S. D. (2019). Simulated projections of boreal forest peatland ecosystem productivity are sensitive to observed seasonality in leaf physiology. Tree Physiol. 39, 556–572. doi: 10.1093/treephys/tpy140
Jiang, J., Huang, Y., Ma, S., Stacy, M., Shi, Z., Ricciuto, D. M., et al. (2018). Forecasting responses of a northern peatland carbon cycle to elevated CO2 and a gradient of experimental warming. J. Geophys. Res. Biogeosci. 123, 1057–1071. doi: 10.1002/2017JG004040
Krassovski, M. B., Riggs, J. S., Hook, L. A., Nettles, W. R., Hanson, P. J., and Boden, T. A. (2015). A comprehensive data acquisition and management system for an ecosystem-scale peatland warming and elevated CO2 experiment. Geosci. Instrum. Methods Data Syst. 4, 203–213. doi: 10.5194/gi-4-203-2015
Kumarathunge, D. P., Medlyn, B. E., Drake, J. E., Tjoelker, M. G., Aspinwall, M. J., Battaglia, M., et al. (2019). Acclimation and adaptation components of the temperature dependence of plant photosynthesis at the global scale. New Phytol. 222, 768–784. doi: 10.1111/nph.15668
Lafleur, P. M., Roulet, N. T., Bubier, J. L., Frolking, S., and Moore, T. R. (2003). Interannual variability in the peatland-atmosphere carbon dioxide exchange at an ombrotrophic bog. Glob. Biogeochem. Cycles 17:1036. doi: 10.1029/2002GB001983
Li, W., Hartmann, H., Adams, H. D., Zhang, H., Jin, C., Zhao, C., et al. (2018). The sweet side of global change–dynamic responses of non-structural carbohydrates to drought, elevated CO2 and nitrogen fertilization in tree species. Tree Physiol. 38, 1706–1723. doi: 10.1093/treephys/tpy059
McDowell, N. G. (2011). Mechanisms linking drought, hydraulics, carbon metabolism, and vegetation mortality. Plant Physiol. 155, 1051–1059. doi: 10.1104/pp.110.170704
McNab, W. H., and Avers, P. E. (1994). Ecological Subregions of the United States, Part One: Sections. Rep WO-WSA-5. Washington, DC: U.S. Department of Agriculture, Forest Service.
McPartland, M. Y., Kane, E. S., Falkowski, M. J., Kolka, R., Turetsky, M. R., Palik, B., et al. (2019). The response of boreal peatland community composition and NDVI to hydrologic change, warming, and elevated carbon dioxide. Glob. Change Biol. 25, 93–107. doi: 10.1111/gcb.14465
Molau, U. (2010). Long-term impacts of observed and induced climate change on tussock tundra near its southern limit in northern Sweden. Plant Ecol. Divers. 3, 29–34. doi: 10.1080/17550874.2010.487548
Nichols, D. S. (1998). Temperature of upland and peatland soils in a north central Minnesota forest. Can. J. Soil Sci. 78, 493–509. doi: 10.4141/S96-030
Niinemets, Ü. (2016). Does the touch of cold make evergreen leaves tougher? Tree Physiol. 36, 267–272. doi: 10.1093/treephys/tpw007
Niinemets, Ü., and Sack, L. (2006). “Structural determinants of leaf light-harvesting capacity and photosynthetic potentials,” in Progress in Botany, eds K. Esser, U. Lüttge, W. Beyschlag, and J. Murata (Berlin: Springer), 385–419.
Parsekian, A. D., Slater, L., Ntarlagiannis, D., Nolan, J., Sebesteyen, S. D., Kolka, R. K., et al. (2012). Uncertainty in peat volume and soil carbon estimated using ground-penetrating radar and probing. Soil Sci. Soc. Am. J. 76, 1911–1918. doi: 10.2136/sssaj2012.0040
Phillips, J. R., Brice, D. J., Hanson, P. J., Childs, J., Iversen, C. M., Norby, R. J., et al. (2017). SPRUCE Pretreatment Plant Tissue Analyses, 2009 Through 2013. Oak Ridge National Laboratory, TES SFA, US Department of Energy.
Potvin, L. R., Kane, E. S., Chimner, R. A., Kolka, R. K., and Lilleskov, E. A. (2015). Effects of water table position and plant functional group on plant community, aboveground production, and peat properties in a peatland mesocosm experiment (PEATcosm). Plant Soil 387, 277–294. doi: 10.1007/s11104-014-2301-8
R Core Team (2018). R: A Language and Environment for Statistical Computing. Vienna: R Foundation for Statistical Computing. Available online at: https://www.R-project.org/
Reich, P. B., Sendall, K. M., Stefanski, A., Wei, X., Rich, R. L., and Montgomery, R. A. (2016). Boreal and temperate trees show strong acclimation of respiration to warming. Nature 531, 633–636. doi: 10.1038/nature17142
Richardson, A. D., Hufkens, K., Milliman, T., Aubrecht, D. M., Furze, M. E., Seyednasrollah, B., et al. (2018). Ecosystem warming extends vegetation activity but heightens vulnerability to cold temperatures. Nature 560, 368–371. doi: 10.1038/s41586-018-0399-1
Schlesinger, W. H., and Bernhardt, E. S. (2013). Biogeochemistry: An Analysis of Global Change. San Diego, CA: Academic press.
Sebestyen, S. D., Dorrance, C., Olson, D. M., Verry, E. S., Kolka, R. K., Elling, A. E., et al. (2011). “Long-term monitoring sites and trends at the Marcell Experimental Forest,” in Peatland Biogeochemistry and Watershed Hydrology at the Marcell Experimental Forest, eds K. Randall, D. Stephen, S. Elon, and N. Kenneth (Boca Raton, FL: CRC Press, 15–72.
Sebestyen, S. D., and Griffiths, N. A. (2016). SPRUCE Enclosure Corral and Sump System: Description, Operation, and Calibration. Oak Ridge, TN: Climate Change Science Institute, Oak Ridge National Laboratory, U.S. Department of Energy.
Small, E. (1972). Photosynthetic rates in relation to nitrogen recycling as an adaptation to nutrient deficiency in peat bog plants. Can. J. Bot. 50, 2227–2233. doi: 10.1139/b72-289
Smith, N. G. (2017). “Plant respiration responses to elevated CO2: an overview from cellular processes to global impacts,” in Plant Respiration: Metabolic Fluxes and Carbon Balance, eds G. Tcherkez and J. Ghashghaie (Cham: Springer International Publishing, 69–87.
Smith, N. G., and Dukes, J. S. (2013). Plant respiration and photosynthesis in global-scale models: incorporating acclimation to temperature and CO2. Glob. Change Biol. 19, 45–63. doi: 10.1111/j.1365-2486.2012.02797.x
Vico, G., Way, D. A., Hurry, V., and Manzoni, S. (2019). Can leaf net photosynthesis acclimate to rising and more variable temperatures? Plant Cell Environ. 42, 1913–1928. doi: 10.1111/pce.13525
Walker, A. P., Carter, K. R., Gu, L., Hanson, P. J., Malhotra, A., Norby, R. J., et al. (2017). Biophysical drivers of seasonal variability in Sphagnum gross primary production in a northern temperate bog. J. Geophys. Res. Biogeosci. 122, 1078–1097. doi: 10.1002/2016JG003711
Wang, M., and Moore, T. R. (2014). Carbon, nitrogen, phosphorus, and potassium stoichiometry in an ombrotrophic peatland reflects plant functional type. Ecosystems 17, 673–684. doi: 10.1007/s10021-014-9752-x
Ward, E. J., Warren, J. M., McLennan, D. A., and Wullschleger, S. D. (2019). SPRUCE Photosynthesis and Respiration of Rhododendron groenlandicum and Chamaedaphne calyculata in SPRUCE Experimental Plots, 2016. Oak Ridge National Laboratory, TES SFA, US Department of Energy.
Way, D. A., Oren, R., and Kroner, Y. (2015). The space-time continuum: the effects of elevated CO2 and temperature on trees and the importance of scaling. Plant Cell Environ. 38, 991–1007. doi: 10.1111/pce.12527
Way, D. A., and Oren, R. A. (2010). Differential responses to changes in growth temperature between trees from different functional groups and biomes: a review and synthesis of data. Tree Physiol. 30, 669–688. doi: 10.1093/treephys/tpq015
Way, D. A., and Yamori, W. (2014). Thermal acclimation of photosynthesis: on the importance of adjusting our definitions and accounting for thermal acclimation of respiration. Photosynth. Res. 119, 89–100. doi: 10.1007/s11120-013-9873-7
Weltzin, J. F., Pastor, J., Harth, C., Bridgham, S. D., Updegraff, K., and Chapin, C. T. (2000). Response of bog and fen plant communities to warming and water-table manipulations. Ecology 81, 3464–3478. doi: 10.1890/0012-9658(2000)081[3464:ROBAFP]2.0.CO;2
Keywords: Chamaedaphne calyculata, ericaceous shrubs, elevated CO2, gas exchange, non-structural carbohydrates, Rhododendron groenlandicum, whole ecosystem warming
Citation: Ward EJ, Warren JM, McLennan DA, Dusenge ME, Way DA, Wullschleger SD and Hanson PJ (2019) Photosynthetic and Respiratory Responses of Two Bog Shrub Species to Whole Ecosystem Warming and Elevated CO2 at the Boreal-Temperate Ecotone. Front. For. Glob. Change 2:54. doi: 10.3389/ffgc.2019.00054
Received: 18 March 2019; Accepted: 27 August 2019;
Published: 12 September 2019.
Edited by:
Nick Smith, Texas Tech University, United StatesReviewed by:
Mary A. Heskel, Macalester College, United StatesDaijun Liu, University of Birmingham, United Kingdom
Copyright © 2019 Ward, Warren, McLennan, Dusenge, Way, Wullschleger and Hanson. This is an open-access article distributed under the terms of the Creative Commons Attribution License (CC BY). The use, distribution or reproduction in other forums is permitted, provided the original author(s) and the copyright owner(s) are credited and that the original publication in this journal is cited, in accordance with accepted academic practice. No use, distribution or reproduction is permitted which does not comply with these terms.
*Correspondence: Eric J. Ward, eward@usgs.gov