 Chaoyi Yin
 Yangkun Cao
 Peishuo Sun
 Hengyuan Zhang1
 Zhi Li
 Ying Xu
 Huiyan Sun
- 1School of Artificial Intelligence, Jilin University, Changchun, China
- 2Department of Medical Oncology, the First Hospital of China Medical University, Shenyang, China
- 3Computational Systems Biology Lab, Department of Biochemistry and Molecular Biology and Institute of Bioinformatics, University of Georgia, Athens, GA, United States
Accurate molecular subtypes prediction of cancer patients is significant for personalized cancer diagnosis and treatments. Large amount of multi-omics data and the advancement of data-driven methods are expected to facilitate molecular subtyping of cancer. Most existing machine learning–based methods usually classify samples according to single omics data, fail to integrate multi-omics data to learn comprehensive representations of the samples, and ignore that information transfer and aggregation among samples can better represent them and ultimately help in classification. We propose a novel framework named multi-omics graph convolutional network (M-GCN) for molecular subtyping based on robust graph convolutional networks integrating multi-omics data. We first apply the Hilbert–Schmidt independence criterion least absolute shrinkage and selection operator (HSIC Lasso) to select the molecular subtype-related transcriptomic features and then construct a sample–sample similarity graph with low noise by using these features. Next, we take the selected gene expression, single nucleotide variants (SNV), and copy number variation (CNV) data as input and learn the multi-view representations of samples. On this basis, a robust variant of graph convolutional network (GCN) model is finally developed to obtain samples’ new representations by aggregating their subgraphs. Experimental results of breast and stomach cancer demonstrate that the classification performance of M-GCN is superior to other existing methods. Moreover, the identified subtype-specific biomarkers are highly consistent with current clinical understanding and promising to assist accurate diagnosis and targeted drug development.
Introduction
Cancer is a complex and highly individualized disease with diverse subtypes, and molecular heterogeneity exists among different subtypes of the same cancer type (González-García et al., 2002; Shipitsin et al., 2007). As cancer patients of distinct molecular subtypes usually respond differently to same treatment, so accurate subtype classification can not only assist precision diagnosis but also facilitate effective targeted treatment (Toss and Cristofanilli, 2015; Lee Y.-M. et al., 2020).
High-throughput sequencing technologies generate a large amount of multi-omics data (Subramanian et al., 2020), which promotes the proposal of many computational methods to identify the molecular subtypes of cancer. Some methods focus on similarity network fusion (SNF) to cluster cancer subtypes. Wang et al. (2014) used SNF to combine similarity networks obtained from mRNA expression, DNA methylation, and microRNA expression data into one network. Chen et al. (2021) proposed a similarity fusion method to fuse the high-order proximity of different omics data and preserve cluster information of multiple graphs. Xu et al. (2019) developed a method named high-order path elucidated similarity (HOPES), which integrated the similarity of different data by high-order connected paths. These methods apply unsupervised spectral clustering to identify cancer subtypes without using the additional information of sample labels. With the accumulation of labeled data, some supervised machine learning methods are utilized to learn non-linear associations of samples’ features and subtype labels (Shieh et al., 2004; Wu et al., 2017). Guan et al. (2012) applied splitting random forest to discover a highly predictive gene set for sample classification. Gao et al. (2019) utilized transcriptomic data and leveraged feedforward neural networks to build molecular subtyping classifiers. Chen et al. (2020) proposed a DeepType framework, which performed joint supervised classification, unsupervised clustering, and dimensionality reduction to learn cancer-relevant data representation with the cluster structure. These methods treat each sample as an independent individual and do not take full advantage of the similarity and mutual representation ability between samples.
With the strong representation ability of graph-structured data, graph neural networks (GNNs) have achieved great success and are gradually used in a node classification task. It provides one way to obtain new representations of nodes by combining the connectivity and features of its local neighborhood. Recently, some GNN-based methods have been proposed to predict molecular subtyping of cancer. Rhee et al. developed a GCN-based model to explore the gene–gene association and information passing for cancer subtyping (Rhee et al., 2017). Lee et al. developed a GCN model with attention mechanisms to learn pathway-level representations of cancer samples for their subtype classification (Lee et al., 2020a). Although GNN are powerful, they are reportedly vulnerable when the skeleton of the graph and nodes’ feature are mixed with noise (Dai et al., 2018; Jin et al., 2020; Zhang and Zitnik, 2020), so a robust GNN model is necessary for accurately and stably predicting cancer subtypes.
It is well known that abnormal behaviors of cancer cells are the result of a series of gene mutations, gene copy number variation, and gene transcription level changes in key regulatory pathways (Greenman et al., 2007; Bradner et al., 2017; Kuijjer et al., 2018; Memon et al., 2021). A single type of omics data can only capture part of the biological complexity, whereas integrating multiple types of omics data can provide a more holistic view to better understand the interrelationships of the involved biomolecules and their functions and demonstrably improve the prediction accuracy of patients’ clinical outcome (Huang et al., 2019; Singh et al., 2019). To learn integrative representations of different omics data, Li et al. developed a graph autoencoder model by utilizing the prior knowledge graph and integrating mRNA expression and CNV data (Li et al., 2021). Lin et al. used multi-omics data and applied deep neural networks to improve the classification accuracy of breast cancer sample (Lin et al., 2020).
In this study, we propose a novel and general framework M-GCN (Figure 1) for molecular subtyping of cancer. It integrates RNA-seq, SNV, and CNV data and learns the node representation based on a robust GCN model. In order to reduce dimension and eliminate noise of transcriptomic data, we first apply HSIC Lasso to select the molecular subtype-related transcriptomic features, which are further used for constructing sample–sample similarity graph, and utilize statistics analysis to find genes with high mutational rates and significant copy number changes. The clean data and purified graph structures are prerequisite for building a robust GNN model. Then we use different non-linear transformations to learn multi-view representations of these three types of data. Furthermore, M-GCN strengthens connections between the new generated features and the graph and assigns weight to edges by layer-wise graph memory based on GNNGUARD (Zhang and Zitnik, 2020). GNNGUARD is originally developed to purify the graph structure and nodes’ features to eliminate the effect of possible noise edge message passing of GCN. Next, a robust GCN model is developed to get samples’ new representations by aggregating their subgraphs for predicting their subtype category. When applying M-GCN to study molecular subtyping of breast cancer and stomach cancer, the experiment results show that the subtype classification performance of M-GCN outperforms other state-of-the-art methods. In addition, we further identify a few specific biomarkers for each molecular subtype, which can potentially contribute to disease diagnosis.
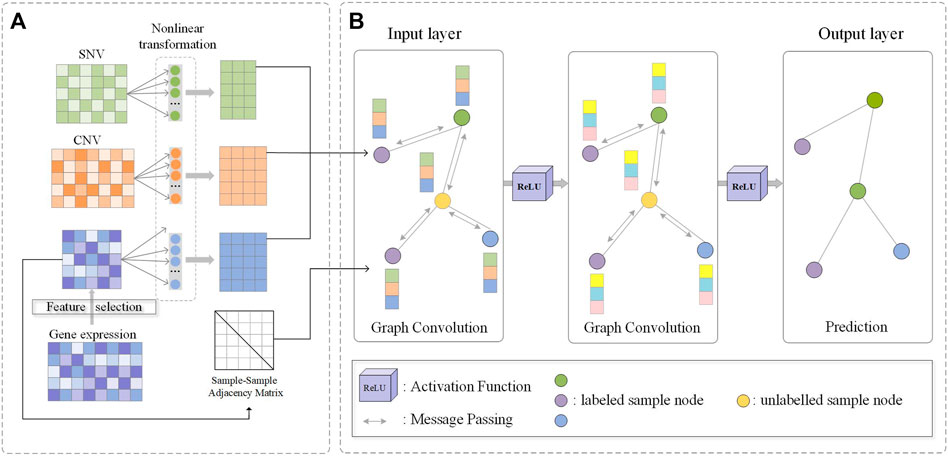
FIGURE 1. Flowchart of M-GCN. (A) Filtered SNV and CNV features and molecular subtype-related transcriptomic features selected by HSIC Lasso are used as the input. Three type-specific non-linear transformation layers are used. The sample–sample similarity graph is constructed by molecular subtype-related transcriptomic features. (B) Output of non-linear transformations and sample–sample similarity graph are used as the input of GCN; convolution process is used for message passing and aggregation among samples; output of the final GCN layer is the prediction of samples’ subtype category.
Materials and Methods
Data Collection and Preprocessing
We collect gene expression, SNV and CNV data, and clinical information of breast cancer (BRCA) and stomach adenocarcinoma (STAD) patients from The Cancer Genome Atlas (TCGA) database (Weinstein et al., 2013). As shown in Table 1, there are
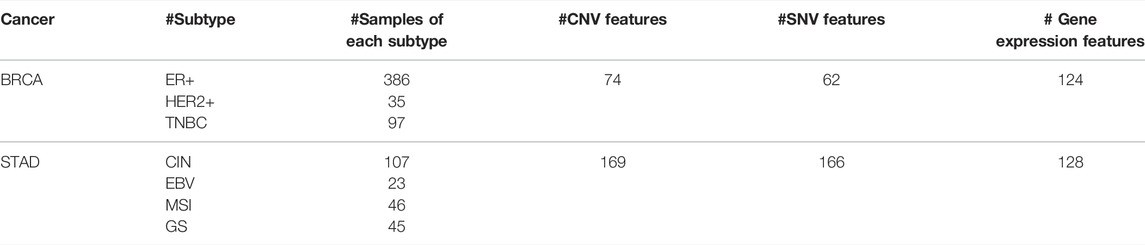
TABLE 1. Dataset attributes.
Genes whose expression values are lower than 10 and 3 are considered as not expressed in BRCA and STAD and then deleted, respectively. As RNA-seq data of these two cancer types are obtained from different platforms in TCGA, we set different cutoffs according to their data distributions. Then, fragments per kilobase of exon per million fragments mapped (FPKM) values of gene expression are normalized with log2-transformation. In each cancer type, a gene’s mutation frequency is defined as the number of samples with this mutation divided by the total number of samples. Genes with mutation frequency greater than
Feature Selection
To obtain molecular subtype-related transcriptome features with low noise for constructing a purified sample–sample similarity graph and effective message passing, we apply a supervised non-linear feature selection method HSIC Lasso (Yamada et al., 2014), which captures non-linear dependency of molecular subtyping labels and genes’ expression level.
Let
where
Sample—Sample Similarity Graph Construction
Since samples with similar features are more likely to fall into the same category, we first construct a sample–sample graph based on similarity of each samples pair. From the perspective of the whole biological system, compared with SNV and CNV, gene expression is the most fundamental level at which the genotype gives rise to the phenotype. So we only use transcriptomic data and apply spearman’s correlation to calculate the similarity of each two samples. We select sample pairs whose correlation coefficient (
where
In the generated undirected graph
GCN Model Integrating Multi-Omics Data for Sample Classification
Some noises could be introduced as there could be some mismatch between the graph and the new concatenate features. According to similarity between the new features, we introduce the idea of a robust variant into the GCN model to mitigate the impact of noises. Specifically, we apply GNNGUARD, which originally is a defense method against adversarial attacks. It improves robustness of GCN models by detecting fake edges of graph structure and removes or reduces their weights in message passing of GCN. GNNGUARD is implemented by neighbor importance estimation and layer-wise graph memory. We use GNNGUARD here to strengthen connections between the new features and the graph by assigning weight to edges. In addition, our framework can be more robust using dirty data with noises.
Multi-Omics Data Features Transformation
To improve samples’ feature representations, we adopt different non-linear transformations to separately project gene expression features, SNV features, and CNV features into their feature space, and then concatenate them together. The projected latent feature matrix
where
Neighbor Importance Estimation
To quantify the relevance between node
where
where
where
Layer-Wise Graph Memory
Neighbor importance estimation and edge pruning change the structure of graph. Because the weighted graph changes in each layer, for a stable training to keep partial memory of the weighted graph structure from the
where
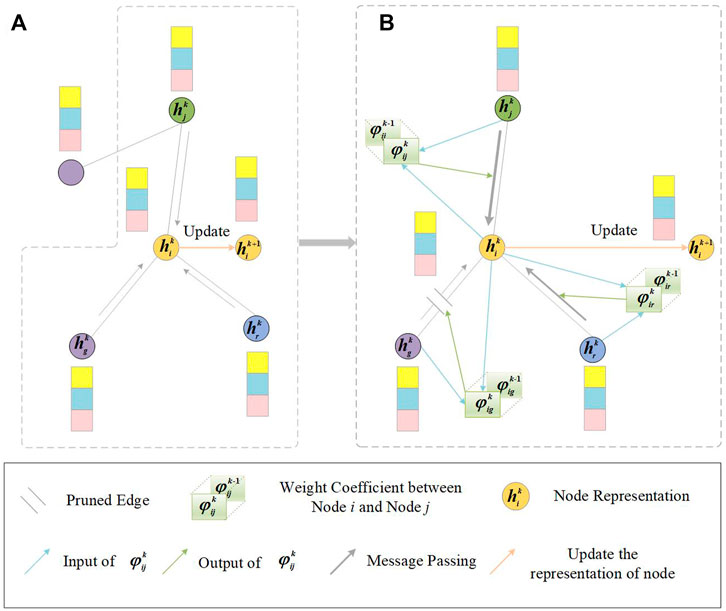
FIGURE 2. Illustration of GNNGUARD. An example of one node (orange node) is chosen to demonstrate the process of layer-wise graph memory. (A) Message passing in i’s local neighborhood in the k-th layer of GCN. (B) Thickness of the gray arrow represents the weight in the message passing of GCN. The weight between node
Node Aggregation with Multi-View Representations Based on GCN
To learn comprehensive representations of sample nodes and multi-omics data, a multilayered graph convolutional network (Kipf and Welling, 2016) based on the message passing is defined as follows:
where
where
Loss and Optimization
Cross-entropy is used as the loss function of our model:
where
New Sample Prediction
When predicting which molecular subtype a new sample is, we first add it into dataset and the sample–sample similarity graph according to Eq. 2. The new data is
Experiment settings
We implement M-GCN using the deep learning framework of PyTorch and train
Evaluation Metrics
We perform
where true positive (
Identification of Specific Genes of Each Molecular Subtype and Functional Enrichment Analysis
Since selected transcriptomic features have the potential to classify samples, we further identify the specific genes of each molecular subtype. We first take z-score normalization on the expression matrix of selected genes in order to make the genes’ specificity comparable between samples. Then, in every subtype, we calculate the mean value of each gene and sort the genes in descending order. Finally, we select top 10 genes of each subtype as specific markers excluding the genes that are present in at least two subtypes.
In order to understand biological function of each certain gene set, we perform biological process (BP) and Kyoto Encyclopedia of Genes and Genomes (KEGG) pathways enrichment analysis on top 40 subtype-specific genes. The R package “clusterProfiler” is used.
Results
Subtype Classification Performance of M-GCN on BRCA and STAD
To demonstrate the performance of our method, we compare the performance of M-GCN with six commonly used or advanced methods on STAD and BRCA molecular subtyping including traditional machine learning–based methods, neural network–based method, and a GCN-based method:
K-nearest neighbor classifier (KNN), random forest (RF), support vector machine classifier (SVM), and Gaussian naive Bayes (GNB) are traditional machine learning methods and we utilize gene expression, SNV, and CNV data as features.
DeepCC is a neural network-based method which utilizes transcriptomic data and leverages feedforward neural networks to classify molecular subtypes.
Li’s method is a GCN-based molecular subtyping method which integrates CNV data and gene expression data.
For BRCA, our framework M-GCN achieves best performance (Figure 3). M-GCN achieves the highest averaged
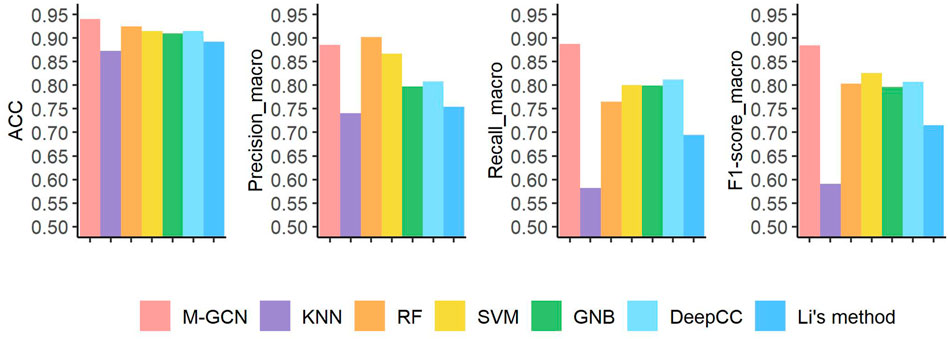
FIGURE 3. Prediction performance under four evaluation metrics of seven methods in the BRCA dataset. Pink bar represents the final performance of M-GCN; purple bar, orange bar, yellow bar, and green bar refer to the performance of KNN, RF, SVM, and GNB, respectively. Light blue bar is for the performance of DeepCC, and dark blue bar is for the performance of Li’s method.
Furthermore, we analyze the detailed results of subtype classification. As shown in Table 2, M-GCN achieves the best performance in diagnosis of ER+ subtype patients, where
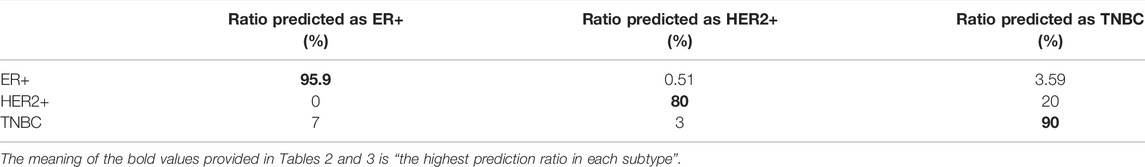
TABLE 2. Classification results of M-GCN on each subtype of BRCA.
For the subtype classification task with more classes and smaller sample size, our method still performs best on STAD than other methods in all metrics (Figure 4). The performance of neural network–based method DeepCC ranks second, which ignores the sample–sample graph structure information. These traditional machine learning–based methods have better scores in four metrics by utilizing multi-omics data. Compared with the results in BRCA, Li’s method has the largest decline of performance in STAD. According to the detailed classification results of each subtype by M-GCN under
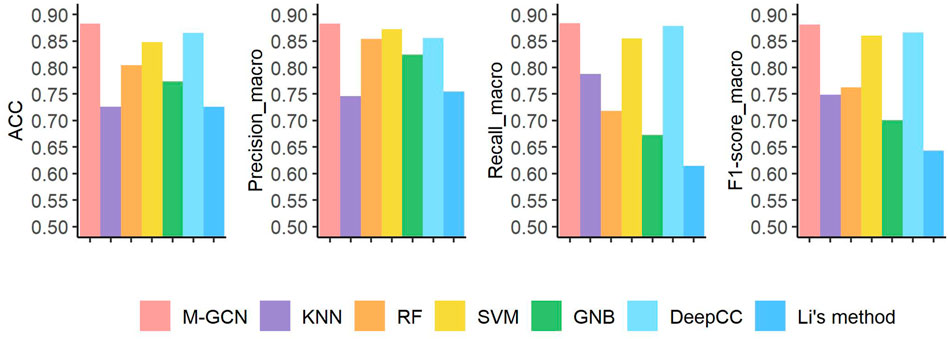
FIGURE 4. Prediction performance under four evaluation metrics of seven methods in the STAD dataset. Pink bar represents the final performance of M-GCN; purple bar, orange bar, yellow bar, and green bar refer to the performance of KNN, RF, SVM, and GNB, respectively. Light blue bar is for the performance of DeepCC, and dark blue bar is for the performance of Li’s method.
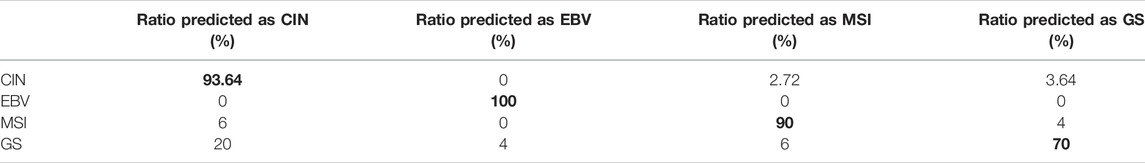
TABLE 3. Classification results of M-GCN on each subtype of STAD.
Our framework M-GCN achieves best performance in BRCA and STAD molecular subtypes. The number of samples in BRCA is greater than that in STAD, and all of these methods in BRCA have good accuracy. The machine learning–based methods such as RF, SVM, and GNB have a significant difference between BRCA and STAD tasks. In addition, these methods in traditional machine learning–based methods are shallow and cannot learn the deep and complex representations of sample nodes. The performance of the neural network–based method DeepCC is higher than most of these machine learning–based methods, which shows the deep and non-linear representation are important. Li’s method may suitable for the task with more samples. M-GCN still has the better scores in evaluation metrics than the multiple omic-based methods by utilizing the cleaned structure information and message passing of sample nodes.
Contribution of Each Element to Molecular Subtype Classification in STAD
After assessing the performance compared with other methods, we conduct three ablation experiments to evaluate the contributions of feature selection step, SNV data, and CNV data in STAD, respectively (Figure 5). The basic idea of ablation experiment is to learn the framework by removing parts of it and studying its performance. In the first ablation experiment, without feature selection, we use all the gene expression features to construct sample–sample similarity graph and take them as the transcriptomic feature for training the GCN-based molecular subtyping model. Under this setting, the prediction performance decreases by
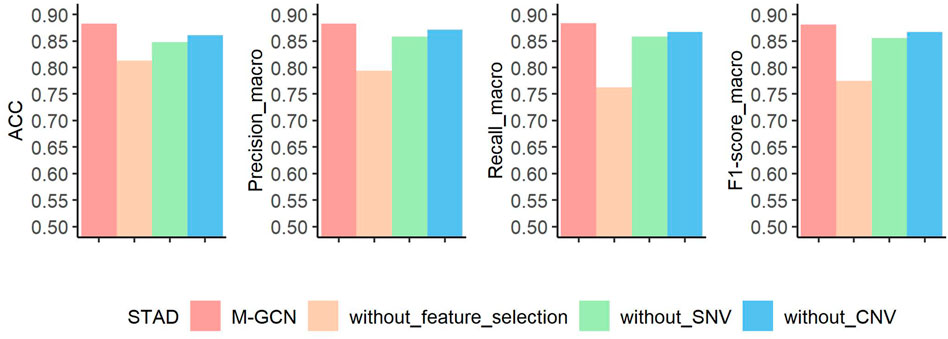
FIGURE 5. Results of ablation experiment of M-GCN in STAD. Pink bar represents the final performance of M-GCN, orange bar represents the performance of M-GCN without feature selection, green bar is for the performance of M-GCN without SNV features, and blue bar is for the performance of M-GCN without CNV features.
Overall, the results of ablation experiments in STAD demonstrate that feature selection, SNV data, and CNV data are essential. Especially, feature selection makes a more significant contribution. One possible reason for this is that selected subtype-related features can help learn good representations of sample and reduce noise of the sample–sample graph.
Contribution of Each Element to Molecular Subtype Classification in BRCA
Similarly, to explore contributions of feature selection, SNV, and CNV data for molecular subtyping of BRCA, we also perform ablation experiments. The results of three ablation experiments are shown in Figure 6. Without the feature selection, the prediction performance decreases by
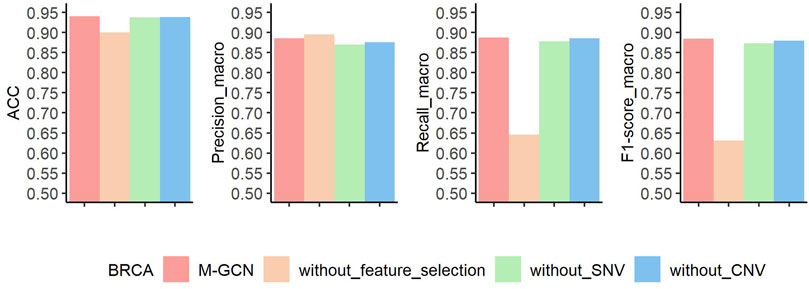
FIGURE 6. Results of ablation experiment of M-GCN in BRCA. Pink bar represents the final performance of M-GCN, orange bar represents the performance of M-GCN without feature selection, green bar is for the performance of M-GCN without SNV features, and blue bar is for the performance of M-GCN without CNV features.
Biomarkers of Each Subtype of BRCA and Their Functions
On the basis of selected transcriptomic features that could accurately classify the breast cancer samples into various molecular subtypes, we further obtained the subtype-specific genes.
We identify ten genes with highest specificity score of each subtype, the gene lists are shown in Table 4. These identified biomarkers can significantly distinguish samples of different subtypes with the normalized gene expression by z-score transformation (Figure 7). Among these genes, two thirds of them have been extensively studied. For example, Robinson et al. suggested that activating mutations in ESR1 were a key mechanism in acquired endocrine resistance in breast cancer therapy (Robinson et al., 2013). In addition, the specific biomarkers of ER+ subtype, ESR1 (Robinson et al., 2013; Spoerke et al., 2016), AGR3 (Garczyk et al., 2015), GATA3 (Ciocca et al., 2009), PCSK6 (Venables et al., 2008), BCAS1 (Fenne et al., 2013), PMAIP1 (Putnik et al., 2012), GPR77 (Zhu et al., 2021), and SCGB2A2 (Guan et al., 2003) have been demonstrated to be associated with breast cancer development or prognosis. For HER2+ subtype, Prat et al. have found that HER2+ patients are highly sensitive to ERBB2-targeted therapy (Prat et al., 2020). In addition, existing studies have reported that ERBB2 (Lucci et al., 2010; Alcalá-Corona et al., 2018; Prat et al., 2020), STARD3 (Sahlberg et al., 2013; Vassilev et al., 2015; Alcalá-Corona et al., 2018), GRB7 (Lucci et al., 2010; Natrajan et al., 2010; Sahlberg et al., 2013; Alcalá-Corona et al., 2018; Tang et al., 2019), C17orf37 (Natrajan et al., 2010), PGAP3 (Alcalá-Corona et al., 2018), PSMD3 (Sahlberg et al., 2013), and DUSP10 (Lucci et al., 2010) played an important role in the development and progression of breast cancer. For the TNBC subtype, although understanding of the identified subtype-specific genes is less than other two types, the roles of DGCR5 (Jiang et al., 2020), RAD51L1 (Stevens et al., 2011), and TTLL4 (Arnold et al., 2020) in breast cancer are well studied.
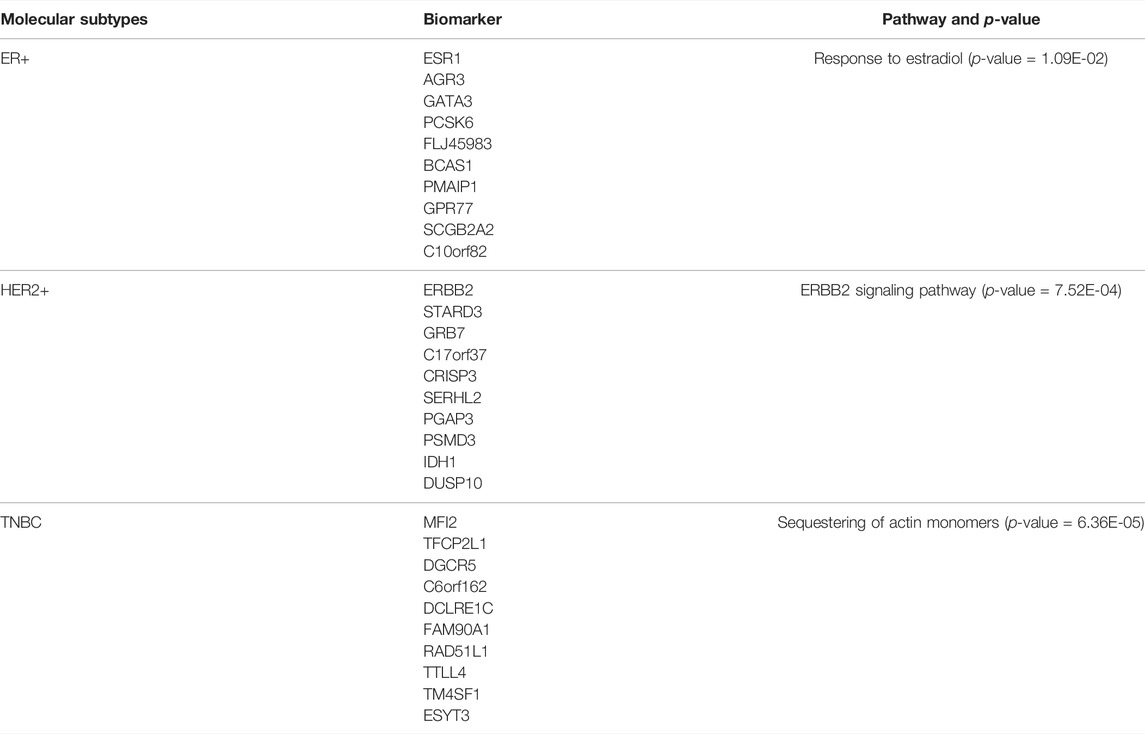
TABLE 4. Specific biomarkers of each BRCA subtype and their enrichment pathways. The listed biomarkers rank in descending order from high to low specific score.
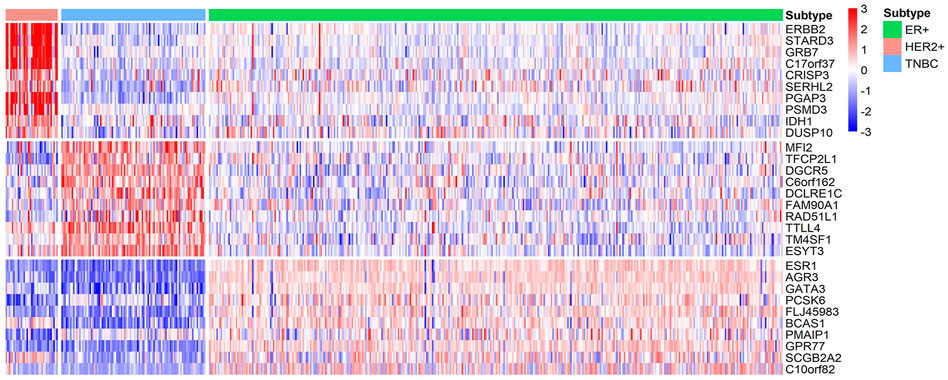
FIGURE 7. Heatmap of the z-score normalized gene expression of the molecular subtype-specific biomarker genes in BRCA. Green bar, pink bar, and blue bar at the top represent ER+, HER2+, and TNBC subtype, respectively.
Moreover, specific genes of ER+, HER2+, and TNBC are significantly enriched in biological processes of response to estradiol, ERBB2 signaling pathway, and sequestering of actin monomers, respectively. Some of the findings are also highly consistent with current understandings. Daniel et al. have found that estrogen were important drivers of breast cancer proliferation and PR-B expression increased breast cancer cell growth in response to estradiol (Daniel et al., 2015). Shah et al. reported that HER2+ subtype of breast cancer is associated with gene amplification and/or protein overexpression of ERBB2, which leads to aggressive tumor growth and poor clinical outcome (Arora et al., 2008; Shah and Osipo, 2016). Other enriched pathways of subtype-specific genes of BRCA are listed in Supplementary Table S1.
Biomarkers of Each Subtype of STAD and Their Functions
Compared with BRCA, the current understanding of subtype markers and biological mechanisms of STAD is much less and our analysis is expected to provide more insight. From the gene expression heatmap across all the samples, it can be concluded that biomarkers of STAD perform well in distinguishing EBV, GS, and MSI (Figure 8). Through functional enrichment analysis, we find genes in CIN are usually enriched in regulation of cellular response to insulin stimulus, response to radiation, and telomere maintenance. Telomere maintenance in cancer cells is often accompanied by activated telomerase to protect genetically damaged DNA from normal cell senescence or apoptosis (Basu et al., 2013). Moreover, we also identify the specific gene CCNE1, which was reported as one of potential targets in the CIN subtype (Wang et al., 2019). For the EBV subtype, we infer their specific genes mainly involve in cilium organization and Herpes simplex virus 1 infection. It is well known that EBV is a gamma-herpes virus, and EBV subtyping accounts for nearly 10% of gastric carcinomas (Shinozaki-Ushiku et al., 2015). Identified specific genes of MSI are related to regulation of microtubule cytoskeleton organization and positive regulation of I-kappaB kinase/NF-kappaB signaling. Gullo et al. analyzed 55 differentially expressed genes in microsatellite unstable cases and found these genes associated with microtubule cytoskeleton organization (Gullo et al., 2018). Identified specific genes of GS are enriched in the biological process of fatty acid oxidation, protein targeting to peroxisome, and AMPK signaling pathway. He et al. discovered that mesenchymal stem cells promoted stemness and chemoresistance in stomach cancer cells through fatty acid oxidation (He et al., 2019). Detailed pathways related with molecular subtyping of STAD are listed in Table 5 and Supplementary Table S2. As the identified biomarkers by our method for breast cancer are greatly consistent with the current clinical consensus, we infer that the predicted biomarkers for STAD are also promising to provide guidance for researchers on the further studies of stomach cancer.
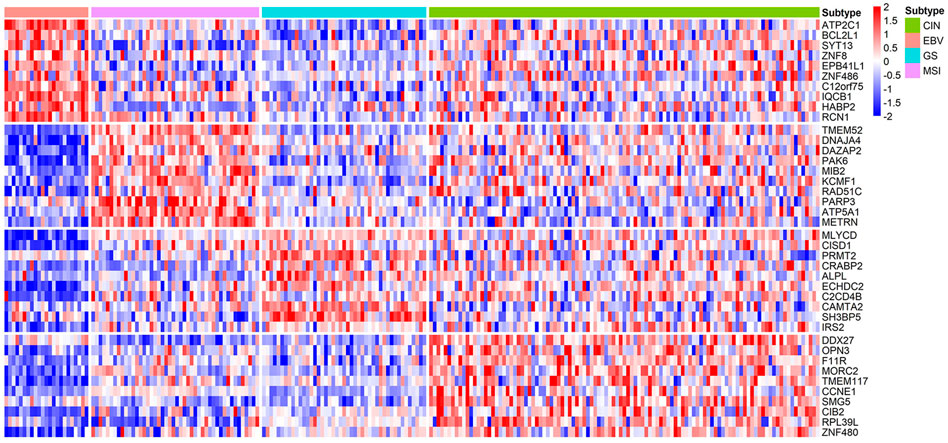
FIGURE 8. Heatmap of the z-score normalized gene expression of the molecular subtype-specific biomarker genes in STAD. Green bar, pink bar, blue bar, and purple bar at the top represent CIN, EBV, GS, and MSI subtype, respectively.
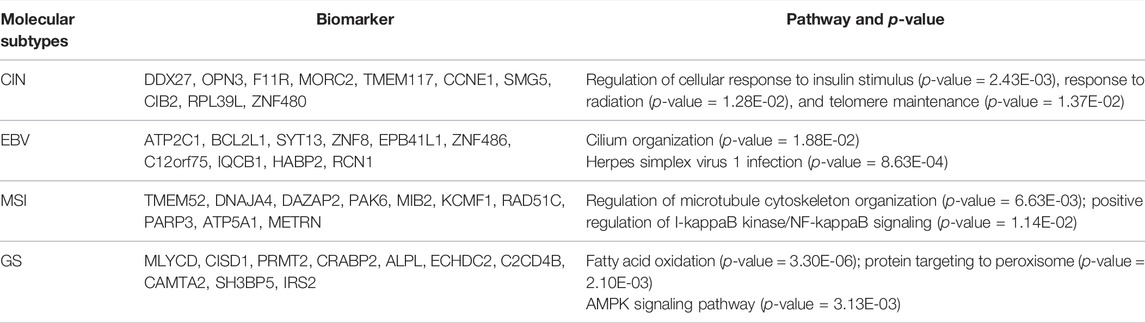
TABLE 5. Specific biomarkers of each STAD subtype and their enrichment pathways. The listed biomarkers rank in descending order from high to low specific score.
Discussion
The generation of large amounts of multi-omics data and development of deep learning methods offer a more effective mean to study the personalized diagnosis and treatment options of complex diseases, such as cancer (Ades et al., 2017; Krzyszczyk et al., 2018). In this study, we propose a new framework M-GCN for molecular subtyping of cancer, which is empowered by integrated multi-omics data and a robust graph convolutional network. In two case studies, that are molecular subtyping of breast and stomach cancer, M-GCN achieves best classification performance under almost all the metrics when compared with six advanced methods. As we all known, although GCN is a powerful end-to-end model, it usually ignores the noise of data and graph which makes GCN unstable. M-GCN first learns subtype-related features to denoise data and construct a relatively pure sample–sample similarity graph. HSIC Lasso, which is recognized as an effective feature selection method, is used in our study. Furthermore, M-GCN assigns higher weights to similar nodes and utilizes layer-wise graph memory to limit the network to improve the robustness of the model based on GNNGUARD. To learn multi-view representations of multi-omics data, M-GCN then re-maps denoised three types of data into their feature spaces. Furthermore, to fuse multi-view representations of multi-omics data, M-GCN utilizes information transfer among samples in the same class and over different classes, respectively. In addition these three types of data, in the future, other omics data will be added to our framework.
Ablation experiments demonstrate that subtype-dependent feature selection contributes most to the improvement of classification performance of cancer molecular subtypes. Furthermore, we verify the stability of the feature selection process to ensure that obtained features are reliable. When shuffling the samples and using 90% of them to perform feature selection, we find the intersection of features picked out by the 10 rounds of feature selection processes are very large for both BRCA and STAD. This is extremely beneficial to train a stable GCN-based model.
On the basis of subtype-related features, we further identify a few subtype-specific features which can potentially be used for diagnostic biomarkers. In our study, ESR1, ERBB2, and MFI2 are predicted as the subtype-specific biomarkers because they have the highest specificity scores for ER+, HER2+, and TNBC samples, respectively. It is worth noting that ESR1 and ERBB2 are well accepted markers for ER+ and HER2+ breast subtype, indicating our prediction is highly consistent with current understanding. Although MFI2 has not been demonstrated as biomarkers of TNBC subtype by wet lab and clinical experiments, its encoding protein shares sequence similarity and iron-binding properties with members of the transferrin superfamily. Public studies have demonstrated these iron-binding properties serve iron uptake and promote cell proliferation, and high expression of these proteins are associated with the decreased overall survival of patients in many cancer types (Torti and Torti, 2013; Sun et al., 2018). As we know, TNBC patients show the poorest prognosis with a low survival time compared with other types of breast cancer. Moreover, DGCR5, having the third highest score under our prediction, reportedly incudes tumorigenesis of triple-negative breast cancer by affecting the Wnt/β-catenin signaling pathway. Overall, our study can accurately identify the subtype-specific biomarkers which are helpful to personalized diagnosis. So far, for many cancer types, there are still not effect means to predict their molecular subtyping. Our method is expected to be an important tool for effectively predicting molecular typing with very few genes. Moreover, the proposed framework can be used for other tasks, such as prediction of cancer staging and grading.
Conclusion
Large amount of multi-omics data generated by rapid development of high-throughput technologies has enabled data-driven methods to apply in molecular subtyping of cancer. We proposed a robust GCN-based framework M-GCN for molecular subtyping of cancer by integrating gene expression, SNV, and CNV data. In addition to comprehensive information of individual samples, M-GCN fully considers message aggregation among samples for subtype classification. Compared with other six advanced computational methods, M-GCN achieves the best classification performance for molecular subtyping of breast and stomach cancer. Through ablation experiments, we demonstrate subtype-related transcriptomics features obtained by HSIC Lasso method highly contribute to sample classification, which is probably because the selected features eliminate data noise and facilitate the construction of purified graph. On the basis of the graph structure constructed by HSIC Lasso, M-GCN further strengthens connections between new features and the graph by assigning weights. By assigning higher weights, M-GCN aims to successfully pass message in GCN. Furthermore, the identified molecular subtype-specific marker of breast cancer is highly consistent with clinical cognition, so the predicted biomarkers of stomach cancer are promising to be used for molecular typing diagnosis of patients, filling in the current gap.
Data Availability Statement
The original contributions presented in the study are included in the article/Supplementary Material, further inquiries can be directed to the corresponding authors.
Author Contributions
CY and YC: data processing, methodology, experiments, program, discussion, and writing—review and editing. PS: data processing, gene selection, and figures. HZ: baseline implementation. ZL and YX: guidance on biological knowledge and writing—review. HS: resources, methodology, experiments, program, discussion, writing—review and editing, and funding acquisition. All authors have read and agreed to the published version of the manuscript.
Funding
This study was supported by the National Natural Science Foundation of China (61902144).
Conflict of Interest
The authors declare that the research was conducted in the absence of any commercial or financial relationships that could be construed as a potential conflict of interest.
Publisher’s Note
All claims expressed in this article are solely those of the authors and do not necessarily represent those of their affiliated organizations, or those of the publisher, the editors, and the reviewers. Any product that may be evaluated in this article, or claim that may be made by its manufacturer, is not guaranteed or endorsed by the publisher.
Acknowledgments
The key data of this research was downloaded from The Cancer Genome Atlas (TCGA). We thank Yujie Gu of Jilin University for his help in method design.
Supplementary Material
The Supplementary Material for this article can be found online at: https://www.frontiersin.org/articles/10.3389/fgene.2022.884028/full#supplementary-material
References
Ades, F., Tryfonidis, K., and Zardavas, D. (2017). The Past and Future of Breast Cancer Treatment-From the Papyrus to Individualised Treatment Approaches. ecancer 11, 746. doi:10.3332/ecancer.2017.746
Alcalá-Corona, S. A., Espinal-Enríquez, J., de Anda-Jáuregui, G., and Hernández-Lemus, E. (2018). The Hierarchical Modular Structure of HER2+ Breast Cancer Network. Front. Physiol. 9, 1423. doi:10.3389/fphys.2018.01423
Arnold, J., Schattschneider, J., Blechner, C., Krisp, C., Schlüter, H., Schweizer, M., et al. (2020). Tubulin Tyrosine Ligase like 4 (TTLL4) Overexpression in Breast Cancer Cells Is Associated with Brain Metastasis and Alters Exosome Biogenesis. J. Exp. Clin. Cancer Res. 39 (1), 1–15. doi:10.1186/s13046-020-01712-w
Arora, P., Cuevas, B. D., Russo, A., Johnson, G. L., and Trejo, J. (2008). Persistent Transactivation of EGFR and ErbB2/HER2 by Protease-Activated Receptor-1 Promotes Breast Carcinoma Cell Invasion. Oncogene 27 (32), 4434–4445. doi:10.1038/onc.2008.84
Bass, A. J., Thorsson, V., Shmulevich, I., Reynolds, S. M., Miller, M., Bernard, B., et al. (2014). Comprehensive Molecular Characterization of Gastric Adenocarcinoma. Nature 513 (7517), 202–209. doi:10.1038/nature13480
Basu, N., Skinner, H. G., Litzelman, K., Vanderboom, R., Baichoo, E., and Boardman, L. A. (2013). Telomeres and Telomere Dynamics: Relevance to Cancers of the GI Tract. Expert Rev. Gastroenterol. Hepatol. 7 (8), 733–748. doi:10.1586/17474124.2013.848790
Bradner, J. E., Hnisz, D., and Young, R. A. (2017). Transcriptional Addiction in Cancer. Cell 168 (4), 629–643. doi:10.1016/j.cell.2016.12.013
Chen, J., Rong, W., Tao, G., and Cai, H. (2021). Similarity Fusion via Exploiting High Order Proximity for Cancer Subtyping. IEEE/ACM Trans. Comput. Biol. Bioinformatics, 1. doi:10.1109/tcbb.2021.3139597
Chen, R., Yang, L., Goodison, S., and Sun, Y. (2020). Deep-learning Approach to Identifying Cancer Subtypes Using High-Dimensional Genomic Data. Bioinformatics 36 (5), 1476–1483. doi:10.1093/bioinformatics/btz769
Ciocca, V., Daskalakis, C., Ciocca, R. M., Ruiz-Orrico, A., and Palazzo, J. P. (2009). The Significance of GATA3 Expression in Breast Cancer: a 10-year Follow-Up Study. Hum. Pathol. 40 (4), 489–495. doi:10.1016/j.humpath.2008.09.010
Dai, H., Li, H., Tian, T., Huang, X., Wang, L., Zhu, J., et al. (2018). “Adversarial Attack on Graph Structured Data,” in Proceedings of the 35th International Conference on Machine Learning. Editors D. Jennifer, and K. Andreas. (Stockholmsmässan, Stockholm, Sweden: PMLR).
Daniel, A. R., Gaviglio, A. L., Knutson, T. P., Ostrander, J. H., D'Assoro, A. B., Ravindranathan, P., et al. (2015). Progesterone Receptor-B Enhances Estrogen Responsiveness of Breast Cancer Cells via Scaffolding PELP1- and Estrogen Receptor-Containing Transcription Complexes. Oncogene 34 (4), 506–515. doi:10.1038/onc.2013.579
Fenne, I. S., Helland, T., Flågeng, M. H., Dankel, S. N., Mellgren, G., and Sagen, J. V. (2013). Downregulation of Steroid Receptor Coactivator-2 Modulates Estrogen-Responsive Genes and Stimulates Proliferation of Mcf-7 Breast Cancer Cells. PloS one 8 (7), e70096. doi:10.1371/journal.pone.0070096
Gao, F., Wang, W., Tan, M., Zhu, L., Zhang, Y., Fessler, E., et al. (2019). DeepCC: a Novel Deep Learning-Based Framework for Cancer Molecular Subtype Classification. Oncogenesis 8 (9), 1–12. doi:10.1038/s41389-019-0157-8
Garczyk, S., von Stillfried, S., Antonopoulos, W., Hartmann, A., Schrauder, M. G., Fasching, P. A., et al. (2015). AGR3 in Breast Cancer: Prognostic Impact and Suitable Serum-Based Biomarker for Early Cancer Detection. PloS one 10 (4), e0122106. doi:10.1371/journal.pone.0122106
González-García, I., Solé, R. V., and Costa, J. (2002). Metapopulation Dynamics and Spatial Heterogeneity in Cancer. Proc. Natl. Acad. Sci. U.S.A. 99 (20), 13085–13089. doi:10.1073/pnas.202139299
Greenman, C., Stephens, P., Smith, R., Dalgliesh, G. L., Hunter, C., Bignell, G., et al. (2007). Patterns of Somatic Mutation in Human Cancer Genomes. Nature 446 (7132), 153–158. doi:10.1038/nature05610
Guan, X.-f., Hamedani, M. K., Adeyinka, A., Walker, C., Kemp, A., Murphy, L. C., et al. (2003). Relationship between Mammaglobin Expression and Estrogen Receptor Status in Breast Tumors. Endo 21 (3), 245–250. doi:10.1385/ENDO:21:3:245
Guan, X., Chance, M. R., and Barnholtz-Sloan, J. S. (2012). Splitting Random forest (SRF) for Determining Compact Sets of Genes that Distinguish between Cancer Subtypes. J. Clin. Bioinformatics 2 (1), 13–12. doi:10.1186/2043-9113-2-13
Gullo, I., Carvalho, J., Martins, D., Lemos, D., Monteiro, A., Ferreira, M., et al. (2018). The Transcriptomic Landscape of Gastric Cancer: Insights into Epstein-Barr Virus Infected and Microsatellite Unstable Tumors. Ijms 19 (7), 2079. doi:10.3390/ijms19072079
He, W., Liang, B., Wang, C., Li, S., Zhao, Y., Huang, Q., et al. (2019). MSC-regulated lncRNA MACC1-AS1 Promotes Stemness and Chemoresistance through Fatty Acid Oxidation in Gastric Cancer. Oncogene 38 (23), 4637–4654. doi:10.1038/s41388-019-0747-0
Huang, Z., Zhan, X., Xiang, S., Johnson, T. S., Helm, B., Yu, C. Y., et al. (2019). SALMON: Survival Analysis Learning with Multi-Omics Neural Networks on Breast Cancer. Front. Genet. 10, 166. doi:10.3389/fgene.2019.00166
Jiang, D., Wang, C., and He, J. (2020). Long Non-coding RNA DGCR5 Incudes Tumorigenesis of Triple-Negative Breast Cancer by Affecting Wnt/β-Catenin Signaling Pathway. J. BUON 25 (2), 702–708.
Jin, W., Li, Y., Xu, H., Wang, Y., Ji, S., Aggarwal, C., et al. (2020). Adversarial Attacks and Defenses on Graphs: A Review, A Tool and Empirical Studies. Available at: https://ui.adsabs.harvard.edu/abs/2020arXiv200300653J (Accessed March 01, 2020).
Kingma, D. P., and Ba, J. (2014). “Adam: A Method for Stochastic Optimization,” in International Conference on Learning Representations, San Diego, United States, 1–15.
Kipf, T. N., and Welling, M. (2016). Semi-Supervised Classification with Graph Convolutional Networks. Available at: https://ui.adsabs.harvard.edu/abs/2016arXiv160902907K (Accessed September 01, 2016).
Krzyszczyk, P., Acevedo, A., Davidoff, E. J., Timmins, L. M., Marrero-Berrios, I., Patel, M., et al. (2018). The Growing Role of Precision and Personalized Medicine for Cancer Treatment. Technology 06 (03n04), 79–100. doi:10.1142/S2339547818300020
Kuijjer, M. L., Paulson, J. N., Salzman, P., Ding, W., and Quackenbush, J. (2018). Cancer Subtype Identification Using Somatic Mutation Data. Br. J. Cancer 118 (11), 1492–1501. doi:10.1038/s41416-018-0109-7
Lee, S., Lim, S., Lee, T., Sung, I., and Kim, S. (2020a). Cancer Subtype Classification and Modeling by Pathway Attention and Propagation. Bioinformatics 36 (12), 3818–3824. doi:10.1093/bioinformatics/btaa203
Lee, Y.-M., Oh, M. H., Go, J.-H., Han, K., and Choi, S.-Y. (2020b). Molecular Subtypes of Triple-Negative Breast Cancer: Understanding of Subtype Categories and Clinical Implication. Genes Genom 42, 1381–1387. doi:10.1007/s13258-020-01014-7
Li, B., Wang, T., and Nabavi, S. (2021). “Cancer Molecular Subtype Classification by Graph Convolutional Networks on Multi-Omics Data,” in Proceedings of the 12th ACM Conference on Bioinformatics, Computational Biology, and Health Informatics, Gainesville, FL, August 2021. doi:10.1145/3459930.3469542
Lin, Y., Zhang, W., Cao, H., Li, G., and Du, W. (2020). Classifying Breast Cancer Subtypes Using Deep Neural Networks Based on Multi-Omics Data. Genes 11 (8), 888. doi:10.3390/genes11080888
Lucci, M. A., Orlandi, R., Triulzi, T., Tagliabue, E., Balsari, A., and Villa-Moruzzi, E. (2010). Expression Profile of Tyrosine Phosphatases in HER2 Breast Cancer Cells and Tumors. Cell Oncol 32 (5-6), 361–372. doi:10.3233/CLO-2010-0520
Memon, D., Gill, M. B., Papachristou, E. K., Ochoa, D., D’Santos, C. S., Miller, M. L., et al. (2021). Copy Number Aberrations Drive Kinase Rewiring, Leading to Genetic Vulnerabilities in Cancer. Cel Rep. 35 (7), 109155. doi:10.1016/j.celrep.2021.109155
Natrajan, R., Weigelt, B., Mackay, A., Geyer, F. C., Grigoriadis, A., Tan, D. S. P., et al. (2010). An Integrative Genomic and Transcriptomic Analysis Reveals Molecular Pathways and Networks Regulated by Copy Number Aberrations in Basal-like, HER2 and Luminal Cancers. Breast Cancer Res. Treat. 121 (3), 575–589. doi:10.1007/s10549-009-0501-3
Prat, A., Pascual, T., De Angelis, C., Gutierrez, C., Llombart-Cussac, A., Wang, T., et al. (2020). HER2-enriched Subtype and ERBB2 Expression in HER2-Positive Breast Cancer Treated with Dual HER2 Blockade. JNCI: J. Natl. Cancer Inst. 112 (1), 46–54. doi:10.1093/jnci/djz042
Putnik, M., Zhao, C., Gustafsson, J.-Å., and Dahlman-Wright, K. (2012). Global Identification of Genes Regulated by Estrogen Signaling and Demethylation in MCF-7 Breast Cancer Cells. Biochem. biophysical Res. Commun. 426 (1), 26–32. doi:10.1016/j.bbrc.2012.08.007
Rhee, S., Seo, S., and Kim, S. (2017). Hybrid Approach of Relation Network and Localized Graph Convolutional Filtering for Breast Cancer Subtype Classification. Available at: https://ui.adsabs.harvard.edu/abs/2017arXiv171105859R (Accessed November 01, 2017).
Robinson, D. R., Wu, Y.-M., Vats, P., Su, F., Lonigro, R. J., Cao, X., et al. (2013). Activating ESR1 Mutations in Hormone-Resistant Metastatic Breast Cancer. Nat. Genet. 45 (12), 1446–1451. doi:10.1038/ng.28210.1038/ng.2823
Sahlberg, K. K., Hongisto, V., Edgren, H., Mäkelä, R., Hellström, K., Due, E. U., et al. (2013). The HER2 Amplicon Includes Several Genes Required for the Growth and Survival of HER2 Positive Breast Cancer Cells. Mol. Oncol. 7 (3), 392–401. doi:10.1016/j.molonc.2012.10.012
Shah, D., and Osipo, C. (2016). Cancer Stem Cells and HER2 Positive Breast Cancer: The story So Far. Genes Dis. 3 (2), 114–123. doi:10.1016/j.gendis.2016.02.002
Shieh, G. S., Bai, C.-H., and Lee, C. (2004). Identify Breast Cancer Subtypes by Gene Expression Profiles. J. Data Sci. 2 (2), 165–175.
Shinozaki-Ushiku, A., Kunita, A., and Fukayama, M. (2015). Update on Epstein-Barr Virus and Gastric Cancer (Review). Int. J. Oncol. 46 (4), 1421–1434. doi:10.3892/ijo.2015.2856
Shipitsin, M., Campbell, L. L., Argani, P., Weremowicz, S., Bloushtain-Qimron, N., Yao, J., et al. (2007). Molecular Definition of Breast Tumor Heterogeneity. Cancer cell 11 (3), 259–273. doi:10.1016/j.ccr.2007.01.013
Singh, A., Shannon, C. P., Gautier, B., Rohart, F., Vacher, M., Tebbutt, S. J., et al. (2019). DIABLO: an Integrative Approach for Identifying Key Molecular Drivers from Multi-Omics Assays. Bioinformatics 35 (17), 3055–3062. doi:10.1093/bioinformatics/bty1054
Spoerke, J. M., Gendreau, S., Walter, K., Qiu, J., Wilson, T. R., Savage, H., et al. (2016). Heterogeneity and Clinical Significance of ESR1 Mutations in ER-Positive Metastatic Breast Cancer Patients Receiving Fulvestrant. Nat. Commun. 7 (1), 1–10. doi:10.1038/ncomms11579
Stevens, K. N., Vachon, C. M., Lee, A. M., Slager, S., Lesnick, T., Olswold, C., et al. (2011). Common Breast Cancer Susceptibility Loci Are Associated with Triple-Negative Breast Cancer. Cancer Res. 71 (19), 6240–6249. doi:10.1158/0008-5472.CAN-11-1266
Subramanian, I., Verma, S., Kumar, S., Jere, A., and Anamika, K. (2020). Multi-omics Data Integration, Interpretation, and its Application. Bioinform Biol. Insights 14, 117793221989905. doi:10.1177/1177932219899051
Sun, H., Zhang, C., Cao, S., Sheng, T., Dong, N., and Xu, Y. (2018). Fenton Reactions Drive Nucleotide and ATP Syntheses in Cancer. J. Mol. Cel. Biol. 10 (5), 448–459. doi:10.1093/jmcb/mjy039
Tang, Y., Yang, S., Wang, M., Liu, D., Liu, Y., Zhang, Y., et al. (2019). Epigenetically Altered miR-193a-3p P-romotes HER2 P-ositive B-reast C-ancer A-ggressiveness by T-argeting GRB7. Int. J. Mol. Med. 43 (6), 2352–2360. doi:10.3892/ijmm.2019.4167
Torti, S. V., and Torti, F. M. (2013). Iron and Cancer: More Ore to Be Mined. Nat. Rev. Cancer 13 (5), 342–355. doi:10.1038/nrc3495
Toss, A., and Cristofanilli, M. (2015). Molecular Characterization and Targeted Therapeutic Approaches in Breast Cancer. Breast Cancer Res. 17 (1), 1–11. doi:10.1186/s13058-015-0560-9
Vassilev, B., Sihto, H., Li, S., Hölttä-Vuori, M., Ilola, J., Lundin, J., et al. (2015). Elevated Levels of StAR-Related Lipid Transfer Protein 3 Alter Cholesterol Balance and Adhesiveness of Breast Cancer Cells. Am. J. Pathol. 185 (4), 987–1000. doi:10.1016/j.ajpath.2014.12.018
Venables, J. P., Klinck, R., Bramard, A., Inkel, L., Dufresne-Martin, G., Koh, C., et al. (2008). Identification of Alternative Splicing Markers for Breast Cancer. Cancer Res. 68 (22), 9525–9531. doi:10.1158/0008-5472.CAN-08-1769
Vuong, D., Simpson, P. T., Green, B., Cummings, M. C., and Lakhani, S. R. (2014). Molecular Classification of Breast Cancer. Virchows Arch. 465 (1), 1–14. doi:10.1007/s00428-014-1593-7
Wang, B., Mezlini, A. M., Demir, F., Fiume, M., Tu, Z., Brudno, M., et al. (2014). Similarity Network Fusion for Aggregating Data Types on a Genomic Scale. Nat. Methods 11 (3), 333–337. doi:10.1038/nmeth.2810
Wang, Q., Liu, G., and Hu, C. (2019). Molecular Classification of Gastric Adenocarcinoma. Gastroenterol. Res. 12 (6), 275–282. doi:10.14740/gr1187
Weinstein, J. N., Creighton, C. J., Collisson, E. A., Mills, G. B., Shaw, K. R. M., Ozenberger, B. A., et al. (2013). The Cancer Genome Atlas Pan-Cancer Analysis Project. Nat. Genet. 45 (10), 1113–1120. doi:10.1038/ng.2764
Wu, T., Wang, Y., Jiang, R., Lu, X., and Tian, J. (2017). A Pathways-Based Prediction Model for Classifying Breast Cancer Subtypes. Oncotarget 8 (35), 58809–58822. doi:10.18632/oncotarget.18544
Xu, A., Chen, J., Peng, H., Han, G., and Cai, H. (2019). Simultaneous Interrogation of Cancer Omics to Identify Subtypes with Significant Clinical Differences. Front. Genet. 10, 236. doi:10.3389/fgene.2019.00236
Yamada, M., Jitkrittum, W., Sigal, L., Xing, E. P., and Sugiyama, M. (2014). High-dimensional Feature Selection by Feature-wise Kernelized Lasso. Neural Comput. 26 (1), 185–207. doi:10.1162/NECO_a_00537
Zhang, X., and Zitnik, M. (2020). Gnnguard: Defending Graph Neural Networks against Adversarial Attacks. Adv. Neural Inf. Process. Syst. 33, 9263–9275.
Keywords: molecular subtyping of cancer, multi-omics data, feature selection, graph convolutional networks, subtype-specific biomarkers
Citation: Yin C, Cao Y, Sun P, Zhang H, Li Z, Xu Y and Sun H (2022) Molecular Subtyping of Cancer Based on Robust Graph Neural Network and Multi-Omics Data Integration. Front. Genet. 13:884028. doi: 10.3389/fgene.2022.884028
Received: 25 February 2022; Accepted: 31 March 2022;
Published: 13 May 2022.
Edited by:
Jianpeng Sheng, Nanyang Technological University, SingaporeReviewed by:
Jiazhou Chen, South China University of Technology, ChinaMassimo La Rosa, National Research Council (CNR), Italy
Copyright © 2022 Yin, Cao, Sun, Zhang, Li, Xu and Sun. This is an open-access article distributed under the terms of the Creative Commons Attribution License (CC BY). The use, distribution or reproduction in other forums is permitted, provided the original author(s) and the copyright owner(s) are credited and that the original publication in this journal is cited, in accordance with accepted academic practice. No use, distribution or reproduction is permitted which does not comply with these terms.
*Correspondence: Zhi Li, zli@cmu.edu.cn; Huiyan Sun, huiyansun@jlu.edu.cn
†These authors have contributed equally to this work and share first authorship