 Aram Safrastyan1,2
 Damian Wollny1,2,3*
- 1RNA Bioinformatics and High Throughput Analysis, Friedrich Schiller University Jena, Jena, Germany
- 2Leibniz Institute on Aging-Fritz Lipmann Institute (FLI), Jena, Germany
- 3Max Planck Institute for Evolutionary Anthropology, Leipzig, Germany
Liquid biopsy, the analysis of body fluids, represents a promising approach for disease diagnosis and prognosis with minimal intervention. Sequencing cell-free RNA derived from liquid biopsies has been very promising for the diagnosis of several diseases. Cancer research, in particular, has emerged as a prominent candidate since early diagnosis has been shown to be a critical determinant of disease prognosis. Although high-throughput analysis of liquid biopsies has uncovered many differentially expressed genes in the context of cancer, the functional connection between these genes is not investigated in depth. An important approach to remedy this issue is the construction of gene networks which describes the correlation patterns between different genes, thereby allowing to infer their functional organization. In this study, we aimed at characterizing extracellular transcriptome gene networks of hepatocellular carcinoma patients compared to healthy controls. Our analysis revealed a number of genes previously associated with hepatocellular carcinoma and uncovered their association network in the blood. Our study thus demonstrates the feasibility of performing gene co-expression network analysis from cell-free RNA data and its utility in studying hepatocellular carcinoma. Furthermore, we augmented cell-free RNA network analysis with single-cell RNA sequencing data which enables the contextualization of the identified network modules with cell-type specific transcriptomes from the liver.
Introduction
Hepatocellular carcinoma (HCC) is the most common form of primary liver cancer accounting for almost 700,000 deaths worldwide annually, making it one of the leading causes of cancer-related deaths worldwide (Patel et al., 2015; Black and Mehta, 2018). Treatment of HCC represents a challenge due to late diagnosis of the disease (Patel et al., 2015) further increasing the need to improve diagnostic methods. As direct tissue sampling from the liver is hard to conduct, less invasive procedures are needed. Liquid biopsy represents a promising alternative to invasive tissue biopsies in particular for cancer diagnosis as it enables the study of cell-free (cf) nucleic acids in the blood, which includes cfDNA and various cfRNAs (e.g., protein-coding, lncRNA, microRNA, etc.). Since the sources of the extracellular transcriptome are not only blood cells, liquid biopsies represent a way to gain insights into gene expression changes in solid tissues without the need for surgical intervention (Vorperian et al., 2022). In fact, a number of HCC liquid biopsy studies have already been conducted indicating the potential of this approach for HCC diagnostics (Qu et al., 2019; Labgaa et al., 2021; Zhu et al., 2021; Yang et al., 2022).
An underexplored way of analyzing the rich data obtained from sequencing liquid biopsy-derived cfRNA liquid biopsy is weighted gene co-expression network analysis (WGCNA). WGCNA tries to find genes that have correlated expressions and aims to build sets of such genes which are named modules. This correlation indicates that linked genes are likely part of a shared regulatory mechanism in the cell. In comparison to the frequently used differential gene expression analysis the approach offers additional insights by incorporating information about the relationship between genes detected in a given sample. The study of genes present in a module can also generate hypotheses about the function of a previously undescribed gene via the concept of “guilt by association”. Finally, modules can be correlated with phenotype traits and by further studying the module with a high correlation with a trait of interest gain a better understanding of the molecular underpinnings of the trait itself.
To date, many studies have focused on WGCNA analysis of bulk or single-cell RNA (scRNA) sequencing data from tissue samples. However, WGCNA is only beginning to be applied to cfRNA data. Hence, we performed WGCNA analysis on cfRNA data derived from the blood of HCC patients. We have found cfRNA-derived network modules which strongly correlate with the disease trait. Pathway analysis was performed to gain further insights into the biological functions that are associated with the discovered modules. We further validate the robustness of our findings in an independent cfRNA dataset from HCC patients. Lastly, we leveraged single-cell RNA sequencing data to gain insights into potential cellular sources of cfRNA network modules.
Materials and methods
Data preprocessing of cell-free RNA datasets
The liquid biopsy datasets were generated by Zhu et al. (2021), Li et al. (2018) and were obtained from NCBI Gene Expression Omnibus (GEO) under accession numbers GSE142987 and GSE100207 respectively (Table 1). The dataset GSE142987 contained RNA sequencing data of plasma cell-free total RNA (cfRNA) from 30 healthy donors and 35 hepatocellular carcinoma patients (Table 1). The detailed steps of sample collection, processing and data analysis are described in the corresponding paper (Zhu et al., 2021). The final count matrix which served as input for further analysis containing raw reads of all transcripts not mapping to the rRNA database was deposited in GEO. After acquiring the count matrix, the data was prepared for further analysis in WGCNA. To that end, the read count matrix and the accompanying metadata file were used to construct a DESeqDataSet object with the function “DESeqDataSetFromMatrix” from R (version 4.1.1) (R Core Team, 2021) package DESeq2 (version 1.34.0) (Love et al., 2014). Genes with fewer than five normalized reads in 10% of the samples were filtered out. The data was variance stabilized (as recommended in WGCNA FAQ) and exported with the function “getVarianceStabilizedData” from the package DESeq2. The final dataset consisted of 9,200 genes and 65 samples.

TABLE 1. Overview of the RNA sequencing datasets used in the current study.
The second cfRNA dataset generated by Li et al. (2018) contained RNA sequencing data of blood exosomal total RNA (exoRNA) from 21 hepatocellular cancer patients (Table 1). The detailed steps of sample collection and processing are detailed in the corresponding paper. The raw sequencing files (.fastq.gz) were deposited in GEO and were downloaded using the tool “fasterq-dump” from the NCBI SRA-Toolkit (version 2.11.0) (SRA Toolkit Development Team, 2022). Next, the sample files were mapped to the human reference genome (build GRCh38) with STAR package (version 2.7.8a) (Dobin et al., 2013) using the default parameters. The read count matrix was generated by utilizing the function “featurecounts” from the Subread package (version 2.0.1) (Liao et al., 2014) with the parameters −p and −s 1. Next, the data was imported into DESeq2, filtered as already described and exported after variance stabilization. The final dataset contained 11,485 genes and 21 samples.
Data preprocessing of the single-cell RNA dataset
The single-cell RNA (scRNA) sequencing of liver tissue biopsies was carried out by MacParland et al. (2018) and deposited in GEO under the accession number GSE115469 (Table 1) and contained quality filtered cell-type annotated single-cell sequencing data containing 8,444 cells obtained from five healthy human liver donors. The dataset was used as input for the R (version 4.1.2) package Seurat (version 4.1.0) (Hao et al., 2021). Subtypes of hepatocyte, T cell, liver sinusoidal endothelial cell (LSEC) and macrophage were aggregated for each cell type respectively in order to capture the most complete transcriptomic landscape of each cell type. Next, the data was normalized and scaled using the Seurat functions “NormalizeData” and “ScaleData” respectively. UMAP dimensional reduction was run with the Seurat function “RunUMAP” using the 5,000 most variable genes. Afterwards, the data was prepared for analysis with WGCNA. As WGCNA was originally developed for the analysis of bulk RNA sequencing data, the scRNA sequencing data was transformed for single-cell WGCNA analysis as previously described (Morabito et al., 2021). Aggregation was carried out on a per cell type basis using the “construct_metacells” function from the R package scWGCNA (version 0.0.0.9000) (Morabito et al., 2021). Hepatic stellate cells were excluded from this step and further downstream analysis due to very low number of cells. The k parameter of the “construct_metacells” function was set according to the number of cells that each cell type contained: eight in the case of fewer than 300 cells and 20 otherwise. Thus, on average less than 10% of cells were shared between paired metacell constructs.
In the end, the transformed data consisted of 20,007 genes and 5,266 cells corresponding to 10 cell types: LSECs (355), NK-like cells (291), cholangiocytes (101), erythroid cells (71), hepatocytes (2,230), macrophages (704), mature B cells (105), plasma cells (296), portal endothelial cells (178) and T cells (935). The final data was normalized, scaled and used for UMAP dimensionality reduction as already described. Final plots were generated using the function “DimPlot” from the package Seurat and the R package ggplot2 (version 3.3.6) (Hadley, 2016).
Gene co-expression network construction
Variance stabilized cfRNA dataset (Zhu et al.) was used as input for WGCNA (version 1.69) (Langfelder and Horvath, 2008). Outlier samples were detected by using the base R stats package function “hclust” with method = “average” and WGCNA function “cutTreestatic” with parameters cutHeight = 100 and minSize = 2. This resulted in the removal of six samples (three healthy and three cancer). Ensembl gene IDs were converted to HGNC (HUGO Gene Nomenclature Committee) symbols using the function “getBM” from R package biomaRt (version 2.50.0) (Durinck et al., 2005). A final matrix of 59 samples and 9,038 genes was used for network construction. Here, to pick a suitable power for WGCNA analysis the function “pickSoftThreshold” was used from the package WGCNA with parameter networkType = “unsigned”. Based on the derived plots generated by R package ggplot2 (Supplementary Figure S1A) and the recommendations from the WGCNA manual a power of six was chosen here where it achieved both scale-free topology and a suitable number of mean connectivity. The construction of modules was comprised of the following steps:
• Building an adjacency matrix using the function “adjacency” from the package WGCNA with parameters power = 6 and type = “unsigned”,
• Building a Topological Overlap Matrix (TOM) using the function “TOMsimilairty” from the package WGCNA with parameter TomType = “unsigned”,
• Performing hierarchical clustering using the function “hclust” from the R base package stats with parameter method = “average”,
• Identification of modules using the function “cutreeDynamic” from the package dynamicTreeCut (version 1.63-1) (Langfelder et al., 2008) with parameter minClusterSize = 30 and deepSplit = 2,
• Numeric labels were converted into colors using the function labels2colors from the package WGCNA and similar modules were merged using the function “mergeCloseModules” from the package WGCNA with parameter cutHeight = 0.2.
For the exoRNA dataset (Li et al.) no outlier samples were detected. The same steps were conducted as already described with the exception of the parameter: power = 8 (Supplementary Figure S1B). Plots describing the number of genes in cfRNA and exoRNA modules were generated using the R package ggplot2.
Gene connectivity per module, defined as the sum of the adjacency to other genes of the same module, was calculated using the WGCNA (version 1.71) function “softConnectivity” with the parameter power set to six for cfRNA and eight for exoRNA datasets. Top 50 most connected genes per module are displayed in Supplementary Material S1 (cfRNA) and Supplementary Material S2 (exoRNA).
Module-trait associations
To calculate the module associations with sample traits, first cfRNA module eigengenes were computed with the function “moduleEigengenes” from the package WGCNA. Then Pearson correlation values were computed between module eigengenes and sample traits (“age,” “disease_state,” and “gender”) with the WGCNA function “cor.” In the case of “disease_state” trait, healthy samples were denoted as “0” and cancer samples as “1”. For the trait “gender” male samples were denoted as “0”, while female samples as “1”. Student asymptotic p-values were calculated with the function “corPvalueStudent” from the package WGCNA and corrected for multiple testing using the base R function “p.adjust” with method = “fdr” (Benjamini and Hochberg, 1995). Finally, a heatmap was constructed using the R package ggplot2. Top hub genes were detected by using the WGCNA function “chooseTopHubInEachModule” with parameters power = 6 and type = “unsigned”.
In the exoRNA dataset as all the samples originated from HCC patients, module-trait association was not performed. In the cfRNA dataset, the grey module which contains unassigned genes was removed from further analysis with the WGCNA function “removeGreyME”.
Module membership vs. gene-trait significance analysis
To generate scatterplots of cfRNA module membership and gene-trait significance correlation, module membership which describes the closeness of genes to individual modules, was calculated by conducting a Pearson correlation of gene expression values with module eigengenes with WGCNA function “cor”. Gene-trait significance was calculated by conducting a Pearson correlation between gene expression values and the trait “disease_state” with the function “cor” from the package WGCNA. Scatterplots were generated with the R package ggplot2.
Module preservation analysis
To calculate the preservation statistics of cfRNA modules (reference data) in the exoRNA dataset (test data) the function “modulePreservation” from the package WGCNA was employed. The function by random permutation of module assignments in the test data calculates a composite Zsum statistic which itself is composed of Zconnectivity and Zdensity statistics, denoting the preservation of interconnectedness of module nodes and preservation of module connectivity patterns. A detailed description of the method is available in the corresponding paper (Langfelder et al., 2011). The function was used with the parameters nPermutations = 100, randomSeed = 1, quickcor = 0, maxModuleSize = 5,000, and maxGoldModuleSize = 5,000 where the value 5,000 was chosen based on the largest module of the reference data. The same steps were taken to calculate module preservation statistics of exoRNA modules in cfRNA dataset with maxModuleSize = 5,500 and maxGoldModuleSize = 5,500. The grey (unassigned genes) and gold (random sample of network genes) modules were left out of the visualization. The results were visualized with the R package ggplot2. For better visualization, values were pseudo-log transformed.
For module preservation analysis of cfRNA modules in cell-type specific scRNA datasets, the WGCNA function “modulePreservation” was employed as already described with maxModuleSize and maxGoldModuleSize set to 5,000. The analysis was conducted with 5,000 most variable genes of each cell-type specific dataset which were computed as already described. The grey and gold modules were left out of the visualization since they are not informative as described above. Same steps were taken to calculate the preservation of exoRNA modules in cell-type specific scRNA datasets with the parameters maxModuleSize = 5,500 and maxGoldModuleSize = 5,500. Results were visualized using R package ggplot2.
Module visualization
In order to visualize the identified modules, the function “exportNetworkToCytoscape” from package WGCNA was used with parameter threshold = 0.1 to export the modules consisting of 30 genes with the highest intramodular connectivity and filter out genes with adjacency threshold smaller than 0.1. Next, the exported modules were visualized with the software Cytoscape (version 3.9.1) (Shannon et al., 2003). In Cytoscape the degree of opacity of connections between genes (nodes) was set according to the weights of the connections (edges) as calculated by WGCNA. The top hub genes of each module, which were generated as already described, were also highlighted.
Functional pathway enrichment analysis
Finally, the genes of cfRNA and exoRNA modules (cf-blue, cf-turquoise, cf-purple, cf-yellow, exo-brown) were used for Reactome (a manually curated database of functional pathways (Gillespie et al., 2022)) pathway enrichment analysis with the R (version 4.1.2) package ReactomePA (version 1.38.0) (Yu and He, 2016). For compatibility with the ReactomePA package, gene symbols were converted to Entrez gene IDs with the function “select” from the R package AnnotationDbi (version 1.54.1) (Pagès et al.). The enrichment analysis was carried out by using the ReactomePA function “enrichPathway” with parameters readable = “T” and pvalueCutoff = 0.05.
Pathway enrichment analysis of the same cfRNA and exoRNA modules was also carried out with the KEGG (Kyoto Encyclopedia of Genes and Genomes (Kanehisa et al., 2021)) and WikiPathways (Martens et al., 2021) databases using the functions “enrichKEGG” and “enrichWP” of R package clusterProfiler (version 4.2.2) (Wu et al., 2021) respectively. The results were visualized with the R package ggplot2.
For all cfRNA and exoRNA modules pathway enrichment analysis was carried out using the “Biological Process” ontology of GO (Gene Ontology) database (Gene Ontology Consortium, 2021) with the function “enrichGO” from the R package clusterProfiler where the parameter “ont” was set to “BP.” Up to five most significant results are displayed in Supplementary Material S3 and Supplementary Material S4 for cfRNA and exoRNA modules respectively.
Results
Construction and visualization of weighted gene co-expression network analysis modules from hepatocellular carcinoma cfRNA
We performed WGCNA analysis, in order to probe the gene co-expression network of extracellular transcriptomes from the blood of healthy control donors as well as HCC patients. The analysis resulted in the identification of eight modules describing gene networks (Supplementary Figure S2A). The resulting modules varied greatly in size, containing between 158 (cf-purple module) and 4,620 (cf-turquoise module) genes (Supplementary Figure S2A).
In order to test which of the derived modules correlates with patient traits, we performed a module-trait association analysis of cfRNA modules (Figure 1A). While using the age, gender and disease state (cancer vs. healthy) as traits, we found that half of the detected modules show a strong and significant positive correlation with the disease state while two modules show a significant negative correlation (Figure 1A). Next, we further examined the two modules which displayed the highest (positive and negative) correlation with the disease state of the patient in detail. When we examined the relationship between how strongly a gene is connected to a module (module membership) and its strength of correlation with the disease state (Figures 1B,C), we saw a very high correlation for both, the cf-blue as well as the cf-turquoise module. This indicates that for example in the case of the cf-turquoise module, genes with a high module membership are also very strongly associated with HCC in the blood of patients.
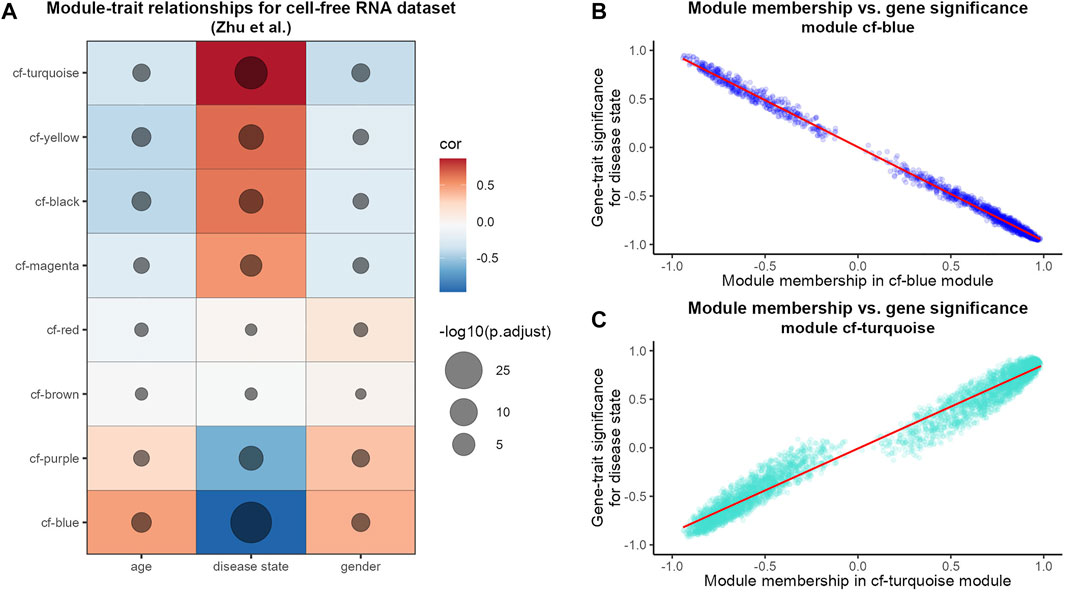
FIGURE 1. WGCNA analysis of HCC cfRNA sequencing data. (A) Pearson correlation results of module eigengenes and sample traits. The color scale reflects the strength of the correlation and the size of the point is proportional to the −log10 transformed corrected p-values. Modules are sorted based on correlation strength with the trait “disease state.” Scatterplot of cfRNA modules cf-blue (B) and cf-turquoise (C) gene module membership and gene significance for the trait “disease state.” Gene module membership refers to Pearson correlation of gene expression values and module eigengene; gene significance for the trait “disease state” refers to Pearson correlation of gene expression values and sample trait “disease state”. The red line refers to linear regression fit.
Next, we investigated which biological pathways the cf-blue and cf-turquoise modules are associated with. The cf-blue module was enriched for pathways involved in gene translation (Figures 2A,C, Supplementary Figures S3A,B). In contrast the cf-turquoise module displays, besides enrichment for RHO GTPase activity, pathways related to immune cell activation such as neutrophil degranulation or platelet activation (Figures 2B,D, Supplementary Figures S3C,D).
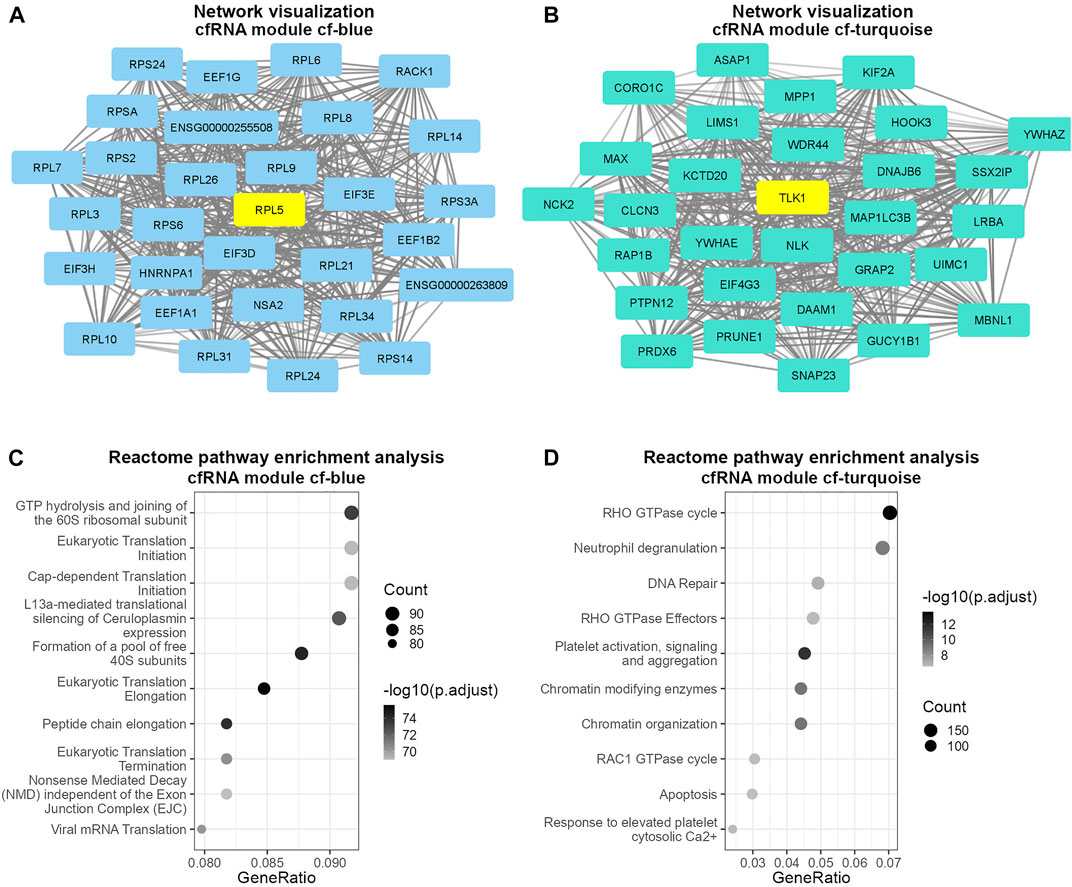
FIGURE 2. Visualization and pathway enrichment analysis of cfRNA modules cf-blue and cf-turquoise. Visualization of 30 most connected genes in modules cf-blue (A) and cf-turquoise (B); degree of the opacity of connections is proportional to the weight of the connections; top hub gene of each module is colored in yellow. Dot plot of pathway enrichment analysis results of cfRNA modules cf-blue (C) and cf-turquoise (D); point size denotes the number of genes in each pathway; the color scale is proportional to the −log10 transformed adjusted p-value; GeneRatio describes the proportion of genes found in each pathway relative to the total number of input genes found in the database.
Strong module preservation across datasets
Next, we wanted to test whether and to what degree the modules identified in the cfRNA dataset (reference network) were reproducible in another liquid biopsy (test network). Hence, we performed a module preservation analysis of the cfRNA modules in an independent dataset (Li et al., 2018). In this dataset, RNA from blood exosomes derived from HCC patients was isolated and sequenced (hereafter referred to as exoRNA). Interestingly, the results of cfRNA module preservation analysis in the exoRNA dataset showed strong evidence of overall preservation (Zsum > 10) of almost all (7/8) tested modules (Figure 3A). Only the cf-yellow cfRNA module had weak to moderate overall preservation (Zsum > 2). As Zsum is a composite statistic, we also visualized its main components—Zdensity (density preservation) and Zconnectivity (connectivity preservation) (Figure 3B). Zdensity describes the interconnectedness of the module nodes in the test network while Zconnectivity denotes the similarity of the connectivity patterns of module nodes in the test network compared with the reference network. The cf-turquoise module from the cfRNA dataset showed strong evidence of density (Zdensity > 10) and connectivity (Zconnectivity > 10) preservation, while most other modules revealed stronger evidence of preservation of the connectivity compared to the density of the modules (Figure 3B). We also tested the module preservation of the exoRNA modules (Supplementary Figure S2B) in the cfRNA dataset by performing the reverse analysis (Supplementary Figure S4). We again observed strong overall preservation (Zsum > 10) of most (4/6) exoRNA modules in the cfRNA dataset, indicating high reproducibility of gene network modules obtained from liquid biopsies of HCC patients (Supplementary Figure S3).
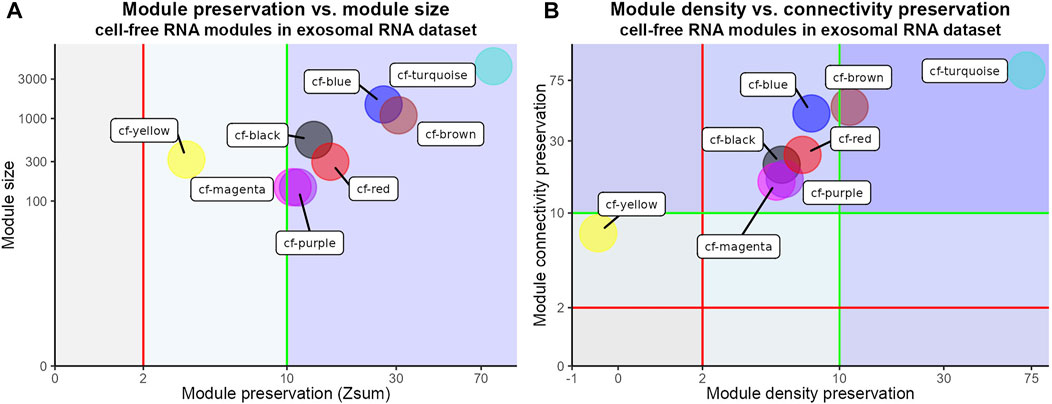
FIGURE 3. Module preservation analysis of cfRNA modules in exoRNA dataset. (A) Scatter plot of overall preservation statistic (Zsum) of cfRNA modules in exoRNA dataset and cfRNA module sizes. Red and green vertical lines represent weak to moderate (Zsum > 2) and strong (Zsum > 10) evidence of module preservation respectively. Axes have been pseudo-log transformed. (B) Scatter plot of density (Zdensity) and connectivity (Zconnectivity) preservation of cfRNA modules in exoRNA dataset. Red and green vertical lines represent weak to moderate (Zdensity > 2) and strong (Zdensity > 10) evidence of module density preservation. Axes have been pseudo-log transformed. Red and green horizontal lines represent weak to moderate (Zconnectivity > 2) and strong (Zconnectivity > 10) evidence of module connectivity preservation.
cfRNA module preservation across transcriptomes of liver cell types
The composition of cfRNA in the blood represents a pool of RNAs derived from several tissues and cell types (Vorperian et al., 2022). Hence, changes in cfRNA between healthy and HCC patients could reflect transcriptomic changes in several cell types. In order to gain insights into the cellular sources of modules from cfRNA which distinguish between healthy and diseased patients, we aimed at leveraging single-cell sequencing data to test to which extent cfRNA modules are preserved in different cell types of the liver. We chose a dataset containing single-cell sequencing data derived from healthy livers in order to detect cell-type specific transcriptomic changes as a consequence of the disease (Supplementary Figure S6A) (MacParland et al., 2018). Filtering out cell types with an insufficient number of cells (Materials and Methods) resulted in the retention of 10 cell types which were robustly detected in the dataset (Figure 4A). In order to test associations of cfRNA modules, particularly modules displaying strong differentiating ability between healthy and HCC samples, with transcriptomic profiles of cell types found in the human liver, we performed module preservation analysis using modules identified in the previous analysis.
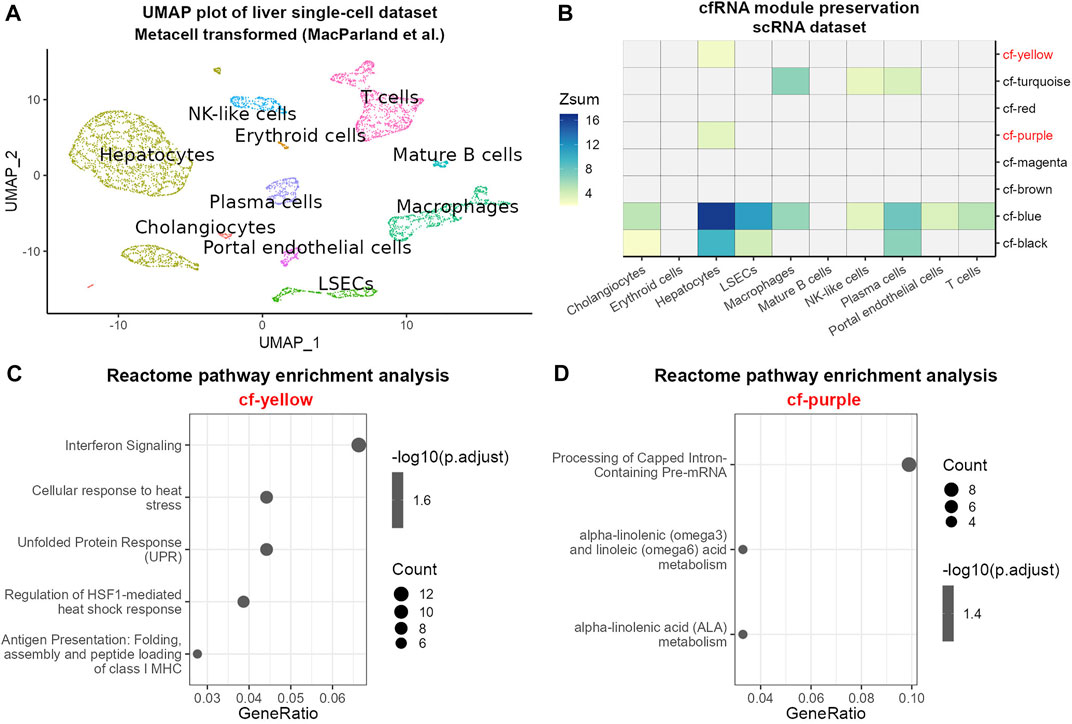
FIGURE 4. Module preservation analysis of cfRNA modules in scRNA data. (A) UMAP plot of scRNA metacells after aggregation of similar cells colored by cell type. (B) Heatmap of cfRNA module preservation in cell-type specific transcriptomes; the color scale indicates the value of Zsum preservation statistic. Pathway enrichment analysis of modules cf-yellow (C) and cf-purple (D). Point size denotes the number of genes in each pathway; the color scale is proportional to the −log10 transformed adjusted p-value; GeneRatio describes the proportion of genes found in each pathway relative to the total number of input genes found in the database.
The results of module preservation analysis (Figure 4B) showed strong overall preservation of the modules cf-blue, cf-turquoise and cf-black in several cell types. Interestingly, the module cf-blue, which showed high disease association, was highly preserved in hepatocytes and LSECs. We also noticed that the modules cf-purple and cf-yellow showed preservation exclusively in hepatocytes and hence were analyzed further by pathway enrichment analysis (Figures 4C,D, Supplementary Figure S5). We found an enrichment of pathways related to fatty acid metabolism and mRNA processing in module cf-purple and pathways related to unfolded protein and heat shock response, antigen presentation and interferon signaling in module cf-yellow, indicating cellular stress likely related to pathological alterations of the cells (Figures 4C,D).
In order to validate the module preservation in liver cell types, we conducted the same analysis using exoRNA dataset (Supplementary Figure S6B). Similar to the previously analyzed dataset, we found an exoRNA module displaying high preservation in particular in hepatocytes and LSECs which is also enriched for RNA translation related pathways (Supplementary Figures S6C–E). Thus, the combination of WGCNA with single cell sequencing data was able to detect strong liver-derived signals in the form of network modules with high differentiating ability between healthy and HCC patients and link these to certain cell types found in the liver.
Discussion
Early diagnostics of HCC is crucial for the management of its progression and liquid biopsy is a promising tool for HCC diagnostics. In order to better characterize HCC liquid biopsy data, we conducted a weighted gene co-expression network analysis (WGCNA). We were able to find modules and genes of interest which could play a role in HCC liquid biopsy diagnostics. In addition, we found that the results of our study were reproducible in a second HCC liquid biopsy data—further indicating the potential of liquid biopsy for robust diagnostics. Furthermore, we augmented our study with HCC liver single-cell RNA sequencing data which augments traditional WGCNA analysis by linking gene network modules to cell-type specific transcriptomes.
Most cfRNA WGCNA modules showed a strong and significant correlation with the disease state of samples, implying that liquid biopsy modules can be quite informative about the health of the donor and the patient. Some modules also displayed weaker and less significant correlations with age and gender, in particular there was an inverse correlation between age and disease state, gender and disease state. This can be explained by the characteristics of the donors and patients that were sampled in the original study (Zhu et al., 2021) wherein the healthy controls had a higher mean age than HCC patients. Similarly, we found that there were more male participants in the HCC group compared to the healthy control group. When we analyzed the most interconnected and highly correlated members of the modules which highly correlated with disease state, we found numerous genes with known association with HCC, including IMPDH2 (He et al., 2018), COL24A1 (Yan et al., 2020), RACK1 (Cao et al., 2019), SNRPD2 (Liu et al., 2022) and the hub genes RPL5 and TLK1 (Segura-Bayona et al., 2020; Ye et al., 2022). A more comprehensive list of such genes can be found in Supplementary Table S1.
Beyond providing lists of genes, WGCNA’s ability to uncover relationships between detected genes is crucial for construction of networks and pathways facilitating insights into biological functions. Pathway enrichment analysis of the modules that correlated most with the disease trait (cf-blue and cf-turquoise modules) revealed enrichment of pathways generally involved with HCC progression. This is exemplified by the enrichment of L13a mediated silencing of ceruloplasmin expression in the cf-blue module. Ceruloplasmin is a protein that is important for iron homeostasis and is mainly secreted into the blood by the liver (Shang et al., 2020). Furthermore, it has been reported to have a protective role in HCC (Shang et al., 2020). It is thus noteworthy that although cfRNA in general mostly contains blood cell derived RNA (Larson et al., 2021), WGCNA analysis is able to detect signals derived from the liver. Module cf-blue was enriched for pathways related to RNA translation which is known to be dysregulated in HCC (Drozdov et al., 2012; Zou et al., 2019). Another noteworthy pathway enriched in the cf-blue module was “Viral mRNA translation” which may point towards hepatitis-B virus (HBV) or hepatitis-C virus (HCV) infection in HCC patients.
The cf-turquoise module was most prominently enriched for pathways involving Rho family GTPases as well as neutrophil degranulation. Rho family GTPases regulate various cellular functions (Xue et al., 2006) and play an important role in HCC carcinogenesis and metastasis (Wang et al., 2013), particularly GTPase RAC1 (Xue et al., 2006; Yang et al., 2010; Wu et al., 2011; Wang et al., 2013; Bayo et al., 2021). Neutrophil degranulation describes a process in which neutrophils release granules that promote inflammation and immune response (Othman et al., 2021). Neutrophils and their immune activation through degranulation and release of neutrophil extracellular traps (NETs) in the context of HCC is currently an area of intense investigation since neutrophils present a potential therapeutic target in HCC (Tang et al., 2021; Geh et al., 2022). Our data indicate that neutrophils might not only present a promising therapeutic target but also be an important component for cfRNA diagnostics through liquid biopsies.
As there is a high degree of both technical and biological variability between blood liquid biopsy samples, reproducibility of results remains an important consideration (Yeri et al., 2017; Murillo et al., 2019; Geeurickx and Hendrix, 2020; Tong et al., 2020). To that end, we performed module preservation analysis to test if the modules identified in the cfRNA dataset of Zhu et al. can also be identified in the exoRNA dataset of Li et al. The results showed evidence of preservation for all cfRNA modules, most showing strong evidence of module preservation. A similar analysis of exoRNA modules in cfRNA dataset again revealed evidence of module preservation for all exoRNA modules indicating the robustness of WGCNA based cfRNA analysis. However, it is important to note that the number of available cfRNA datasets for HCC is still small at this point. Thus, it will be crucial to extend this analysis towards more datasets in the future.
To gain more insight into the results obtained from the WGCNA analysis, we leveraged the advantages of single-cell RNA sequencing data such as the ability to decipher cell type specific transcriptomes. We conducted a preservation analysis of cfRNA modules in a scRNA sequencing dataset. Our results indicate the highest preservation of cfRNA and exoRNA modules in hepatocytes which can be explained by the high prevalence of hepatocytes in the liver (Bogdanos et al., 2013). Two cfRNA modules also showed preservation only in hepatocytes and one of the modules was enriched for pathways participating in fatty acid metabolism-a well described characteristic of hepatocytes (Alhazzaa et al., 2013; Alves-Bezerra and Cohen, 2017). While the other module was enriched for pathways indicating cellular stress and perhaps pointing towards viral infection, in particular with the hepatitis-B virus (Seo et al., 2018; Li et al., 2019; Baudi et al., 2021)—a known contributor to the development of hepatocellular carcinoma (Maucort-Boulch et al., 2018). Lipid metabolism and particularly fatty acid metabolism dysregulation is a well described characteristic of different cancers, including HCC (Fernández et al., 2020; Hu et al., 2020). Specifically, changes to lipid metabolism pathways involved in fatty acid desaturation or generation of phosphatidylcholine are associated with proliferating hepatocytes in HCC (Hall et al., 2021). Finally, considering that cf-yellow and cf-purple modules showed strong positive and negative correlation with HCC respectively (Figure 1A) it is possible that WGCNA was able to capture bidirectional gene expression changes associated with HCC.
Interestingly we also detected a noticeable preservation signal in liver sinusoidal endothelial cells (LSECs) in both cfRNA and exoRNA modules. In both cases the modules with high LSEC preservation were enriched for pathways relating to RNA translation which was previously described as characteristic of LSECs (MacParland et al., 2018). LSECs play a significant role in HCC progression (Wilkinson et al., 2020; Yang and Zhang, 2021), produce extracellular vesicles (Azparren-Angulo et al., 2021), are very permeable and in direct contact with the bloodstream due to their endothelial nature (Shetty et al., 2018). Hence, while hepatocytes are understandably the main focus of study in HCC, LSECs and the extracellular vesicles they produce can represent a promising cell type for further investigation as their transcriptomic changes in HCC development might hold important diagnostic insights which could be leveraged by liquid biopsy.
A crucial advantage of combining WGCNA with scRNA sequencing is the ability to query liquid biopsy samples without the need to rely on few disease markers which can be lowly expressed and hence not detected in cfRNA. With the growing accuracy and depth of various gene pathway databases, the modules identified by WGCNA will become more informative and specific, thus increasing the future potential of the method for diagnostics. In general, relying on signatures and pathways related to biological functions as identified through WGCNA modules likely leads to more reliable diagnostics compared to marker genes which might be sporadically detected.
In the future, we envision utilization of already widely available scRNA datasets of healthy and malignant tissues facilitating the diagnosis of liquid biopsy samples. Modules can be detected in liquid biopsy samples and later linked to cellular origins through preservation analysis which can then motivate further directed medical examination. Still, much work needs to be done, in order to improve cfRNA detection for diagnostics. In particular, the amount of cancer-derived cfRNA in the blood of patients might represent a potential bottleneck, in particular for solid tumors. Here, technical improvements for higher sensitivity of RNA detection e.g. from the field of scRNA sequencing will likely benefit the cfRNA sequencing field. Moreover, it should be noted that among all solid tissues, liver is one of the most significant cfRNA contributing tissues, suggesting that cfRNA diagnostics might be of particular interest for detection of liver-related diseases (Larson et al., 2021).
In conclusion, in this study we showed cfRNA network analysis provides an additional layer of information which can be obtained through liquid biopsy. The combination of cfRNA and scRNA analysis will further open new avenues of research and our results show the great potential of scRNA sequencing data for both cfRNA and network studies.
Data availability statement
Publicly available datasets were analyzed in this study. This data can be found here: GSE142987, GSE100207, and GSE115469.
The computational code used in this study is available at GitHub: https://github.com/aramsafrast/cfwgcna_hcc
Author contributions
AS and DW conceptualized the study. AS performed all data analyses. AS and DW wrote the manuscript.
Acknowledgments
We thank all members of the Wollny lab for insightful comments and discussions.
Conflict of interest
The authors declare that the research was conducted in the absence of any commercial or financial relationships that could be construed as a potential conflict of interest.
Publisher’s note
All claims expressed in this article are solely those of the authors and do not necessarily represent those of their affiliated organizations, or those of the publisher, the editors and the reviewers. Any product that may be evaluated in this article, or claim that may be made by its manufacturer, is not guaranteed or endorsed by the publisher.
Supplementary material
The Supplementary Material for this article can be found online at: https://www.frontiersin.org/articles/10.3389/fgene.2022.921195/full#supplementary-material
Supplementary Material S1 | Top 50 most connected genes in each cfRNA module ordered by connectivity.
Supplementary Material S2 | Top 50 most connected genes in each exoRNA module ordered by connectivity.
Supplementary Material S3 | Top five most significant GO Biological Process terms per cfRNA module ordered by adjusted p value. For the modules cf-black and cf-magenta fewer than five GO terms passed the significance threshold (p < 0.05).
Supplementary Material S4 | Top five most significant GO Biological Process terms per exoRNA module ordered by adjusted p value. For the modules exo-yellow and exo-red fewer than five GO terms or no GO term passed the significance threshold (p < 0.05).
References
Alhazzaa, R., Sinclair, A. J., and Turchini, G. M. (2013). Bioconversion of α-linolenic acid into n-3 long-chain polyunsaturated fatty acid in hepatocytes and ad hoc cell culture optimisation. PLOS ONE 8, e73719. doi:10.1371/journal.pone.0073719
Alves-Bezerra, M., and Cohen, D. E. (2017). Triglyceride metabolism in the liver. Compr. Physiol. 8, 1–8. doi:10.1002/cphy.c170012
Andrade, V. A., Guerra, M. T., Jardim, C. A., Melo, F. M., Silva, W. A., Ortega, M. J., et al. (2011). Nucleoplasmic calcium regulates cell proliferation through legumain. J. Hepatol. 55, 626–635. doi:10.1016/j.jhep.2010.12.022
Azparren-Angulo, M., Royo, F., Gonzalez, E., Liebana, M., Brotons, B., Berganza, J., et al. (2021). Extracellular vesicles in hepatology: Physiological role, involvement in pathogenesis, and therapeutic opportunities. Pharmacol. Ther. 218, 107683. doi:10.1016/j.pharmthera.2020.107683
Baudi, I., Isogawa, M., Moalli, F., Onishi, M., Kawashima, K., Ishida, Y., et al. (2021). Interferon signaling suppresses the unfolded protein response and induces cell death in hepatocytes accumulating Hepatitis B surface antigen. PLoS Pathog. 17, e1009228. doi:10.1371/journal.ppat.1009228
Bayo, J., Fiore, E. J., Dominguez, L. M., Cantero, M. J., Ciarlantini, M. S., Malvicini, M., et al. (2021). Bioinformatic analysis of RHO family of GTPases identifies RAC1 pharmacological inhibition as a new therapeutic strategy for hepatocellular carcinoma. Gut 70, 1362–1374. doi:10.1136/gutjnl-2020-321454
Benjamini, Y., and Hochberg, Y. (1995). Controlling the false discovery rate: A practical and powerful approach to multiple testing. J. R. Stat. Soc. Ser. B 57, 289–300. doi:10.1111/j.2517-6161.1995.tb02031.x
Bi, N., Sun, Y., Lei, S., Zeng, Z., Zhang, Y., Sun, C., et al. (2020). Identification of 40S ribosomal protein S8 as a novel biomarker for alcohol-associated hepatocellular carcinoma using weighted gene co-expression network analysis. Oncol. Rep. 44, 611–627. doi:10.3892/or.2020.7634
Bibbò, F., Sorice, C., Ferrucci, V., and Zollo, M. (2021). Functional Genomics of PRUNE1 in neurodevelopmental disorders (NDDs) tied to Medulloblastoma (MB) and other Tumors. Front. Oncol. 11, 758146. doi:10.3389/fonc.2021.758146
Bidkhori, G., Benfeitas, R., Klevstig, M., Zhang, C., Nielsen, J., Uhlen, M., et al. (2018). Metabolic network-based stratification of hepatocellular carcinoma reveals three distinct tumor subtypes. Proc. Natl. Acad. Sci. U. S. A. 115, E11874–E11883. doi:10.1073/pnas.1807305115
Black, A. P., and Mehta, A. S. (2018). The search for biomarkers of hepatocellular carcinoma and the impact on patient outcome. Curr. Opin. Pharmacol. 41, 74–78. doi:10.1016/j.coph.2018.04.002
Bogdanos, D. P., Gao, B., and Gershwin, M. E. (2013). Liver immunology. Compr. Physiol. 3, 567–598. doi:10.1002/cphy.c120011
Cao, J., Zhao, M., Liu, J., Zhang, X., Pei, Y., Wang, J., et al. (2019). RACK1 promotes self-renewal and chemoresistance of cancer stem cells in human hepatocellular carcinoma through stabilizing nanog. Theranostics 9, 811–828. doi:10.7150/thno.29271
Chen, H.-W., Qiao, H.-Y., Li, H.-C., Li, Z.-F., Zhang, H.-J., Pei, L., et al. (2015). Prognostic significance of Nemo-like kinase expression in patients with hepatocellular carcinoma. Tumour Biol. 36, 8447–8453. doi:10.1007/s13277-015-3609-6
Dobin, A., Davis, C. A., Schlesinger, F., Drenkow, J., Zaleski, C., Jha, S., et al. (2013). Star: Ultrafast universal RNA-seq aligner. Bioinformatics 29, 15–21. doi:10.1093/bioinformatics/bts635
Dolezal, J. M., Dash, A. P., and Prochownik, E. V. (2018). Diagnostic and prognostic implications of ribosomal protein transcript expression patterns in human cancers. BMC Cancer 18, 275. doi:10.1186/s12885-018-4178-z
Drozdov, I., Bornschein, J., Wex, T., Valeyev, N. V., Tsoka, S., Malfertheiner, P., et al. (2012). Functional and topological properties in hepatocellular carcinoma transcriptome. PLOS ONE 7, e35510. doi:10.1371/journal.pone.0035510
Durinck, S., Moreau, Y., Kasprzyk, A., Davis, S., De Moor, B., Brazma, A., et al. (2005). BioMart and bioconductor: a powerful link between biological databases and microarray data analysis. Bioinformatics 21, 3439–3440. doi:10.1093/bioinformatics/bti525
Fa, B., Luo, C., Tang, Z., Yan, Y., Zhang, Y., Yu, Z., et al. (2019). Pathway-based biomarker identification with crosstalk analysis for robust prognosis prediction in hepatocellular carcinoma. eBioMedicine 44, 250–260. doi:10.1016/j.ebiom.2019.05.010
Fernández, L. P., Gómez de Cedrón, M., and Ramírez de Molina, A. (2020). Alterations of lipid metabolism in cancer: Implications in prognosis and treatment. Front. Oncol. 10, 577420. doi:10.3389/fonc.2020.577420
Fu, J., Luo, B., Guo, W.-W., Zhang, Q.-M., Shi, L., Hu, Q.-P., et al. (2015). Down-regulation of cancer/testis antigen OY-TES-1 attenuates malignant behaviors of hepatocellular carcinoma cells in vitro. Int. J. Clin. Exp. Pathol. 8, 7786–7797.
Gao, X., Zhao, C., Zhang, N., Cui, X., Ren, Y., Su, C., et al. (2021). Genetic expression and mutational profile analysis in different pathologic stages of hepatocellular carcinoma patients. BMC Cancer 21, 786. doi:10.1186/s12885-021-08442-y
Geeurickx, E., and Hendrix, A. (2020). Targets, pitfalls and reference materials for liquid biopsy tests in cancer diagnostics. Mol. Asp. Med. 72, 100828. doi:10.1016/j.mam.2019.10.005
Geh, D., Leslie, J., Rumney, R., Reeves, H. L., Bird, T. G., Mann, D. A., et al. (2022). Neutrophils as potential therapeutic targets in hepatocellular carcinoma. Nat. Rev. Gastroenterol. Hepatol. 19, 257–273. doi:10.1038/s41575-021-00568-5
Gene Ontology Consortium (2021). The gene ontology resource: Enriching a GOld mine. Nucleic Acids Res. 49 (D1), D325–D334. doi:10.1093/nar/gkaa1113
Gillespie, M., Jassal, B., Stephan, R., Milacic, M., Rothfels, K., Senff-Ribeiro, A., et al. (2022). The reactome pathway knowledgebase 2022. Nucleic Acids Res. 50, D687–D692. doi:10.1093/nar/gkab1028
Gu, Y., Li, J., Guo, D., Chen, B., Liu, P., Xiao, Y., et al. (2020). Identification of 13 Key genes correlated with progression and prognosis in hepatocellular carcinoma by weighted gene Co-expression network analysis. Front. Genet. 11, 153. doi:10.3389/fgene.2020.00153
Hadley, W. (2016). ggplot2: Elegant graphics for data analysis. New York: Springer-Verlag. Available at: https://ggplot2.tidyverse.org.
Hall, Z., Chiarugi, D., Charidemou, E., Leslie, J., Scott, E., Pellegrinet, L., et al. (2021). Lipid remodeling in hepatocyte proliferation and hepatocellular carcinoma. Hepatology 73 (3), 1028–1044. doi:10.1002/hep.31391
Hao, Y., Hao, S., Andersen-Nissen, E., Mauck, W. M., Zheng, S., Butler, A., et al. (2021). Integrated analysis of multimodal single-cell data. Cell 184, 3573–3587. e29. doi:10.1016/j.cell.2021.04.048
Hassan, Md. K., Kumar, D., Naik, M., and Dixit, M. (2018). The expression profile and prognostic significance of eukaryotic translation elongation factors in different cancers. PLoS ONE 13, e0191377. doi:10.1371/journal.pone.0191377
He, Y., Zheng, Z., Xu, Y., Weng, H., Gao, Y., Qin, K., et al. (2018). Over-expression of IMPDH2 is associated with tumor progression and poor prognosis in hepatocellular carcinoma. Am. J. Cancer Res. 8, 1604–1614.
Hu, B., Lin, J. Z., Yang, X. B., and Sang, X. T. (2020). Aberrant lipid metabolism in hepatocellular carcinoma cells as well as immune microenvironment: A review. Cell Prolif. 53 (3), e12772. doi:10.1111/cpr.12772
Hu, J., and Gao, D. Z. (2012). Distinction immune genes of hepatitis-induced heptatocellular carcinoma. Bioinformatics 28, 3191–3194. doi:10.1093/bioinformatics/bts624
Huang, L., Jian, Z., Gao, Y., Zhou, P., Zhang, G., Jiang, B., et al. (2019). RPN2 promotes metastasis of hepatocellular carcinoma cell and inhibits autophagy via STAT3 and NF-κB pathways. Aging 11, 6674–6690. doi:10.18632/aging.102167
Kanehisa, M., Furumichi, M., Sato, Y., Ishiguro-Watanabe, M., and Tanabe, M. (2021). Kegg: integrating viruses and cellular organisms. Nucleic Acids Res. 49, D545–D551. doi:10.1093/nar/gkaa970
Kong, F., Kong, D., Yang, X., Yuan, D., Zhang, N., Hua, X., et al. (2020). Integrative analysis of highly mutated genes in Hepatitis B virus-related hepatic carcinoma. Cancer Med. 9, 2462–2479. doi:10.1002/cam4.2903
Kong, Q., Liang, C., Jin, Y., Pan, Y., Tong, D., Kong, Q., et al. (2019). The lncRNA MIR4435-2HG is upregulated in hepatocellular carcinoma and promotes cancer cell proliferation by upregulating miRNA-487a. Cell. Mol. Biol. Lett. 24, 26. doi:10.1186/s11658-019-0148-y
Labgaa, I., von Felden, J., Craig, A. J., Martins-Filho, S. N., Villacorta-Martin, C., Demartines, N., et al. (2021). Experimental models of liquid biopsy in hepatocellular carcinoma reveal clone-dependent release of circulating tumor DNA. Hepatol. Commun. 5, 1095–1105. doi:10.1002/hep4.1692
Langfelder, P., and Horvath, S. (2008). Wgcna: an R package for weighted correlation network analysis. BMC Bioinforma. 9, 559. doi:10.1186/1471-2105-9-559
Langfelder, P., Luo, R., Oldham, M. C., and Horvath, S. (2011). Is my network module preserved and reproducible? PLOS Comput. Biol. 7, e1001057. doi:10.1371/journal.pcbi.1001057
Langfelder, P., Zhang, B., and Horvath, S. (2008). Defining clusters from a hierarchical cluster tree: the dynamic tree cut package for R. Bioinformatics 24, 719–720. doi:10.1093/bioinformatics/btm563
Larson, M. H., Pan, W., Kim, H. J., Mauntz, R. E., Stuart, S. M., Pimentel, M., et al. (2021). A comprehensive characterization of the cell-free transcriptome reveals tissue- and subtype-specific biomarkers for cancer detection. Nat. Commun. 12, 2357. doi:10.1038/s41467-021-22444-1
Li, J.-J., and Xie, D. (2015). RACK1, a versatile hub in cancer. Oncogene 34, 1890–1898. doi:10.1038/onc.2014.127
Li, P., Lin, Y., Zhang, Y., Zhu, Z., and Huo, K. (2013). SSX2IP promotes metastasis and chemotherapeutic resistance of hepatocellular carcinoma. J. Transl. Med. 11, 52. doi:10.1186/1479-5876-11-52
Li, S., Li, Y., Chen, B., Zhao, J., Yu, S., Tang, Y., et al. (2018). exoRBase: a database of circRNA, lncRNA and mRNA in human blood exosomes. Nucleic Acids Res. 46, D106–D112. doi:10.1093/nar/gkx891
Li, Y., Xia, Y., Cheng, X., Kleiner, D. E., Hewitt, S. M., Sproch, J., et al. (2019). Hepatitis B surface antigen activates unfolded protein response in forming ground glass hepatocytes of chronic hepatitis B. Viruses 11, 386. doi:10.3390/v11040386
Liao, Y., Smyth, G. K., and Shi, W. (2014). featureCounts: an efficient general purpose program for assigning sequence reads to genomic features. Bioinformatics 30, 923–930. doi:10.1093/bioinformatics/btt656
Liu, C., Zhou, X., Long, Q., Zeng, H., Sun, Q., Chen, Y., et al. (2021a). Small extracellular vesicles containing miR-30a-3p attenuate the migration and invasion of hepatocellular carcinoma by targeting SNAP23 gene. Oncogene 40, 233–245. doi:10.1038/s41388-020-01521-7
Liu, J., Gu, L., Zhang, D., and Li, W. (2022). Determining the prognostic value of spliceosome-related genes in hepatocellular carcinoma patients. Front. Mol. Biosci. 9, 759792. doi:10.3389/fmolb.2022.759792
Liu, T.-A., Jan, Y.-J., Ko, B.-S., Liang, S.-M., Chen, S.-C., Wang, J., et al. (2013). 14-3-3ε overexpression contributes to epithelial-mesenchymal transition of hepatocellular carcinoma. PLOS ONE 8, e57968. doi:10.1371/journal.pone.0057968
Liu, W., Xu, C., Meng, Q., and Kang, P. (2021b). The clinical value of kinesin superfamily protein 2A in hepatocellular carcinoma. Clin. Res. Hepatol. Gastroenterol. 45, 101527. doi:10.1016/j.clinre.2020.08.005
Liu, Y., Zhu, X., Zhu, J., Liao, S., Tang, Q., Liu, K., et al. (2007). Identification of differential expression of genes in hepatocellular carcinoma by suppression subtractive hybridization combined cDNA microarray. Oncol. Rep. 18, 943–951. doi:10.3892/or.18.4.943
Love, M. I., Huber, W., and Anders, S. (2014). Moderated estimation of fold change and dispersion for RNA-seq data with DESeq2. Genome Biol. 15, 550. doi:10.1186/s13059-014-0550-8
Luo, B., Yun, X., Li, J., Fan, R., Guo, W., Liu, C., et al. (2020). Cancer-testis antigen OY-TES-1 expression and immunogenicity in hepatocellular carcinoma. Curr. Med. Sci. 40, 719–728. doi:10.1007/s11596-020-2241-x
Luo, R.-Z., Cai, P.-Q., Li, M., Fu, J., Zhang, Z.-Y., Chen, J.-W., et al. (2014). Decreased expression of PTPN12 correlates with tumor recurrence and poor survival of patients with hepatocellular carcinoma. PLOS ONE 9, e85592. doi:10.1371/journal.pone.0085592
MacParland, S. A., Liu, J. C., Ma, X.-Z., Innes, B. T., Bartczak, A. M., Gage, B. K., et al. (2018). Single cell RNA sequencing of human liver reveals distinct intrahepatic macrophage populations. Nat. Commun. 9, 4383. doi:10.1038/s41467-018-06318-7
Martens, M., Ammar, A., Riutta, A., Waagmeester, A., Slenter, D. N., Hanspers, K., et al. (2021). WikiPathways: Connecting communities. Nucleic Acids Res. 49, D613–D621. doi:10.1093/nar/gkaa1024
Maucort-Boulch, D., de Martel, C., Franceschi, S., and Plummer, M. (2018). Fraction and incidence of liver cancer attributable to Hepatitis B and C viruses worldwide. Int. J. Cancer 142, 2471–2477. doi:10.1002/ijc.31280
Morabito, S., Miyoshi, E., Michael, N., Shahin, S., Martini, A. C., Head, E., et al. (2021). Single-nucleus chromatin accessibility and transcriptomic characterization of Alzheimer’s disease. Nat. Genet. 53, 1143–1155. doi:10.1038/s41588-021-00894-z
Murillo, O. D., Thistlethwaite, W., Rozowsky, J., Subramanian, S. L., Lucero, R., Shah, N., et al. (2019). ExRNA atlas analysis reveals distinct extracellular RNA cargo types and their carriers present across human biofluids. Cell 177, 463–477. e15. doi:10.1016/j.cell.2019.02.018
Othman, A., Sekheri, M., and Filep, J. G. (2021). Roles of neutrophil granule proteins in orchestrating inflammation and immunity. FEBS J. doi:10.1111/febs.15803
Pagès, H., Carlson, M., Falcon, S., and Li, N. (2020). AnnotationDbi: Manipulation of SQLite-based annotations in bioconductor. R package. Available at: https://bioconductor.org/packages/AnnotationDbi.
Patel, N., Yopp, A. C., and Singal, A. G. (2015). Diagnostic delays are common among patients with hepatocellular carcinoma. J. Natl. Compr. Canc. Netw. 13, 543–549. doi:10.6004/jnccn.2015.0074
Qu, C., Wang, Y., Wang, P., Chen, K., Wang, M., Zeng, H., et al. (2019). Detection of early-stage hepatocellular carcinoma in asymptomatic HBsAg-seropositive individuals by liquid biopsy. Proc. Natl. Acad. Sci. U. S. A. 116, 6308–6312. doi:10.1073/pnas.1819799116
R Core Team (2021). R: A language and environment for statistical computing. Vienna, Austria: R Foundation for Statistical Computing. Available at: https://www.R-project.org/.
Segura-Bayona, S., Villamor-Payà, M., Attolini, C. S.-O., Koenig, L. M., Sanchiz-Calvo, M., Boulton, S. J., et al. (2020). Tousled-like kinases suppress innate immune signaling triggered by alternative lengthening of telomeres. Cell Rep. 32, 107983. doi:10.1016/j.celrep.2020.107983
Seo, H. W., Seo, J. P., and Jung, G. (2018). Heat shock protein 70 and heat shock protein 90 synergistically increase Hepatitis B viral capsid assembly. Biochem. Biophys. Res. Commun. 503, 2892–2898. doi:10.1016/j.bbrc.2018.08.065
Shang, Y., Luo, M., Yao, F., Wang, S., Yuan, Z., Yang, Y., et al. (2020). Ceruloplasmin suppresses ferroptosis by regulating iron homeostasis in hepatocellular carcinoma cells. Cell. Signal. 72, 109633. doi:10.1016/j.cellsig.2020.109633
Shannon, P., Markiel, A., Ozier, O., Baliga, N. S., Wang, J. T., Ramage, D., et al. (2003). Cytoscape: A software environment for integrated models of biomolecular interaction networks. Genome Res. 13, 2498–2504. doi:10.1101/gr.1239303
Shetty, S., Lalor, P. F., and Adams, D. H. (2018). Liver sinusoidal endothelial cells — gatekeepers of hepatic immunity. Nat. Rev. Gastroenterol. Hepatol. 15, 555–567. doi:10.1038/s41575-018-0020-y
SRA Toolkit Development Team (2022). NCBI SRA-Toolkit. Available at: https://trace.ncbi.nlm.nih.gov/Traces/sra/sra.cgi?view=software.
Tang, J., Yan, Z., Feng, Q., Yu, L., and Wang, H. (2021). The roles of neutrophils in the pathogenesis of liver diseases. Front. Immunol. 12. doi:10.3389/fimmu.2021.625472
Tang, Z., Peng, H., Chen, J., Liu, Y., Yan, S., Yu, G., et al. (2018). Rap1b enhances the invasion and migration of hepatocellular carcinoma cells by up-regulating Twist 1. Exp. Cell Res. 367, 56–64. doi:10.1016/j.yexcr.2018.03.019
Tong, F., Andress, A., Tang, G., Liu, P., and Wang, X. (2020). Comprehensive profiling of extracellular RNA in HPV-induced cancers using an improved pipeline for small RNA-seq analysis. Sci. Rep. 10, 19450. doi:10.1038/s41598-020-76623-z
Tu, J., Chen, J., He, M., Tong, H., Liu, H., Zhou, B., et al. (2019). Bioinformatics analysis of molecular genetic targets and key pathways for hepatocellular carcinoma. Onco. Targets. Ther. 12, 5153–5162. doi:10.2147/OTT.S198802
Vorperian, S. K., Moufarrej, M. N., and Quake, S. R. (2022). Cell types of origin of the cell-free transcriptome. Nat. Biotechnol. 40, 855–861. doi:10.1038/s41587-021-01188-9
Wang, J., Pu, J., Zhang, Y., Yao, T., Luo, Z., Li, W., et al. (2020). Exosome-transmitted long non-coding RNA SENP3-EIF4A1 suppresses the progression of hepatocellular carcinoma. Aging 12, 11550–11567. doi:10.18632/aging.103302
Wang, R., Kang, B., Hu, R., Huang, Y., Qin, Z., Du, J., et al. (2018). ClC-3 chloride channel protein induces G1 arrest in hepatocellular carcinoma Hep3B cells. Oncol. Rep. 40, 472–478. doi:10.3892/or.2018.6416
Wang, Z.-G., Jia, M.-K., Cao, H., Bian, P., and Fang, X.-D. (2013). Knockdown of Coronin-1C disrupts Rac1 activation and impairs tumorigenic potential in hepatocellular carcinoma cells. Oncol. Rep. 29, 1066–1072. doi:10.3892/or.2012.2216
Wang, Z., Zheng, H., Gao, W., Han, J., Cao, J., Yang, Y., et al. (2016). eIF5B increases ASAP1 expression to promote HCC proliferation and invasion. Oncotarget 7, 62327–62339. doi:10.18632/oncotarget.11469
Wilkinson, A. L., Qurashi, M., and Shetty, S. (2020). The role of sinusoidal endothelial cells in the Axis of inflammation and cancer within the liver. Front. Physiol. 11, 990. doi:10.3389/fphys.2020.00990
Wu, L., Cai, C., Wang, X., Liu, M., Li, X., Tang, H., et al. (2011). MicroRNA-142-3p, a new regulator of RAC1, suppresses the migration and invasion of hepatocellular carcinoma cells. FEBS Lett. 585, 1322–1330. doi:10.1016/j.febslet.2011.03.067
Wu, X., Chen, Y., Kong, W., and Zhao, Z. (2020). Amyloid precursor protein regulates 5-fluorouracil resistance in human hepatocellular carcinoma cells by inhibiting the mitochondrial apoptotic pathway. J. Zhejiang Univ. Sci. B 21, 234–245. doi:10.1631/jzus.B1900413
Wu, T., Hu, E., Xu, S., Chen, M., Guo, P., and Dai, Z. (2021). ClusterProfiler 4.0: A universal enrichment tool for interpreting omics data. Innovation 2, 100141. doi:10.1016/j.xinn.2021.100141
Xing, T., Yan, T., and Zhou, Q. (2018). Identification of key candidate genes and pathways in hepatocellular carcinoma by integrated bioinformatical analysis. Exp. Ther. Med. 15, 4932–4942. doi:10.3892/etm.2018.6075
Xu, C., Li, Y.-M., Sun, B., Zhong, F.-J., and Yang, L.-Y. (2021). GNA14’s interaction with RACK1 inhibits hepatocellular carcinoma progression through reducing MAPK/JNK and PI3K/AKT signaling pathway. Carcinogenesis 42, 1357–1369. doi:10.1093/carcin/bgab098
Xu, X., Lu, D., Zhuang, R., Wei, X., Xie, H., Wang, C., et al. (2016). The phospholipase A2 activity of peroxiredoxin 6 promotes cancer cell death induced by tumor necrosis factor alpha in hepatocellular carcinoma. Mol. Carcinog. 55, 1299–1308. doi:10.1002/mc.22371
Xue, Y., Bi, F., Zhang, X., Zhang, S., Pan, Y., Liu, N., et al. (2006). Role of Rac1 and Cdc42 in hypoxia induced p53 and von Hippel-Lindau suppression and HIF1alpha activation. Int. J. Cancer 118, 2965–2972. doi:10.1002/ijc.21763
Yan, L., Xu, F., and Dai, C. (2020). Overexpression of COL24A1 in hepatocellular carcinoma predicts poor prognosis: A study based on multiple databases, clinical samples and cell lines. Onco. Targets. Ther. 13, 2819–2832. doi:10.2147/OTT.S247133
Yang, J.-C., Hu, J.-J., Li, Y.-X., Luo, W., Liu, J.-Z., Ye, D.-W., et al. (2022). Clinical applications of liquid biopsy in hepatocellular carcinoma. Front. Oncol. 12, 781820. doi:10.3389/fonc.2022.781820
Yang, M., and Zhang, C. (2021). The role of liver sinusoidal endothelial cells in cancer liver metastasis. Am. J. Cancer Res. 11, 1845–1860.
Yang, W., Lv, S., Liu, X., Liu, H., Yang, W., Hu, F., et al. (2010). Up-regulation of Tiam1 and Rac1 correlates with poor prognosis in hepatocellular carcinoma. Jpn. J. Clin. Oncol. 40, 1053–1059. doi:10.1093/jjco/hyq086
Ye, Q., Yang, X., Zheng, S., Mao, X., Shao, Y., Xuan, Z., et al. (2022). Low expression of moonlight gene ALAD is correlated with poor prognosis in hepatocellular carcinoma. Gene 825, 146437. doi:10.1016/j.gene.2022.146437
Yeri, A., Courtright, A., Reiman, R., Carlson, E., Beecroft, T., Janss, A., et al. (2017). Total extracellular small RNA profiles from plasma, saliva, and urine of healthy subjects. Sci. Rep. 7, 44061. doi:10.1038/srep44061
Yu, G., and He, Q.-Y. (2016). ReactomePA: an R/bioconductor package for reactome pathway analysis and visualization. Mol. Biosyst. 12, 477–479. doi:10.1039/C5MB00663E
Zhang, Y., Zhang, J., Chen, X., and Yang, Z. (2021). Polymeric immunoglobulin receptor (PIGR) exerts oncogenic functions via activating ribosome pathway in hepatocellular carcinoma. Int. J. Med. Sci. 18, 364–371. doi:10.7150/ijms.49790
Zhao, J.-F., Zhao, Q., Hu, H., Liao, J.-Z., Lin, J.-S., Xia, C., et al. (2018). The ASH1-miR-375-YWHAZ signaling Axis regulates tumor properties in hepatocellular carcinoma. Mol. Ther. Nucleic Acids 11, 538–553. doi:10.1016/j.omtn.2018.04.007
Zhou, C., Weng, J., Liu, C., Zhou, Q., Chen, W., Hsu, J. L., et al. (2020). High RPS3A expression correlates with low tumor immune cell infiltration and unfavorable prognosis in hepatocellular carcinoma patients. Am. J. Cancer Res. 10, 2768–2784.
Zhou, Z.-J., Dai, Z., Zhou, S.-L., Fu, X.-T., Zhao, Y.-M., Shi, Y.-H., et al. (2013). Overexpression of HnRNP A1 promotes tumor invasion through regulating CD44v6 and indicates poor prognosis for hepatocellular carcinoma. Int. J. Cancer 132, 1080–1089. doi:10.1002/ijc.27742
Zhu, Q., Qiao, G.-L., Zeng, X.-C., Li, Y., Yan, J.-J., Duan, R., et al. (2016). Elevated expression of eukaryotic translation initiation factor 3H is associated with proliferation, invasion and tumorigenicity in human hepatocellular carcinoma. Oncotarget 7, 49888–49901. doi:10.18632/oncotarget.10222
Zhu, Y., Wang, S., Xi, X., Zhang, M., Liu, X., Tang, W., et al. (2021). Integrative analysis of long extracellular RNAs reveals a detection panel of noncoding RNAs for liver cancer. Theranostics 11, 181–193. doi:10.7150/thno.48206
Zou, Q., Xiao, Z., Huang, R., Wang, X., Wang, X., Zhao, H., et al. (2019). Survey of the translation shifts in hepatocellular carcinoma with ribosome profiling. Theranostics 9, 4141–4155. doi:10.7150/thno.35033
Keywords: hepatocellular carcinoma, liquid biopsy, WGCNA, cell-free RNA, single cell sequencing
Citation: Safrastyan A and Wollny D (2022) Network analysis of hepatocellular carcinoma liquid biopsies augmented by single-cell sequencing data. Front. Genet. 13:921195. doi: 10.3389/fgene.2022.921195
Received: 15 April 2022; Accepted: 30 June 2022;
Published: 25 August 2022.
Edited by:
Xiaokang Lun, Harvard University, United StatesReviewed by:
Yun Yan, University of Texas MD Anderson Cancer Center, United StatesTianyuan Lu, McGill University, Canada
Copyright © 2022 Safrastyan and Wollny. This is an open-access article distributed under the terms of the Creative Commons Attribution License (CC BY). The use, distribution or reproduction in other forums is permitted, provided the original author(s) and the copyright owner(s) are credited and that the original publication in this journal is cited, in accordance with accepted academic practice. No use, distribution or reproduction is permitted which does not comply with these terms.
*Correspondence: Damian Wollny, damian.wollny@uni-jena.de