 Shinsheng Yuan
 Yen-Chou Chen1†
 Grace S. Shieh
- 1Institute of Statistical Science, Academia Sinica, Taipei, Taiwan
- 2Bioinformatics Program, Taiwan International Graduate Program, Academia Sinica, Taipei, Taiwan
- 3College of Medicine, Graduate Institute of Toxicology, National Taiwan University, Taipei, Taiwan
- 4Genome and Systems Biology Degree Program, Academia Sinica and National Taiwan University, Taipei, Taiwan
- 5Data Science Degree Program, Academia Sinica and National Taiwan University, Taipei, Taiwan
Targeted therapies and chemotherapies are prevalent in cancer treatment. Identification of predictive markers to stratify cancer patients who will respond to these therapies remains challenging because patient drug response data are limited. As large amounts of drug response data have been generated by cell lines, methods to efficiently translate cell-line-trained predictors to human tumors will be useful in clinical practice. Here, we propose versatile feature selection procedures that can be combined with any classifier. For demonstration, we combined the feature selection procedures with a (linear) logit model and a (non-linear) K-nearest neighbor and trained these on cell lines to result in LogitDA and KNNDA, respectively. We show that LogitDA/KNNDA significantly outperforms existing methods, e.g., a logistic model and a deep learning method trained by thousands of genes, in prediction AUC (0.70–1.00 for seven of the ten drugs tested) and is interpretable. This may be due to the fact that sample sizes are often limited in the area of drug response prediction. We further derive a novel adjustment on the prediction cutoff for LogitDA to yield a prediction accuracy of 0.70–0.93 for seven drugs, including erlotinib and cetuximab, whose pathways relevant to anti-cancer therapies are also uncovered. These results indicate that our methods can efficiently translate cell-line-trained predictors into tumors.
Introduction
Targeted therapies and chemotherapies are prevalent in cancer treatments. About 7% (11.1%) of US patients with advanced or metastatic cancer benefited from genome-targeted (genome-informed) therapy in 2021 (Haslam et al., 2021), with 13.6% (27.3%) estimated eligibility. Thus, identification of the characteristics of cancer patients who will respond to chemotherapies or targeted therapies using their molecular profiles is important for precision medicine. Given that patient drug response data relative to cell lines are limited, obtaining this information is challenging. However, large-scale drug sensitivity screens of cell lines have identified clinically meaningful gene–drug interactions (Barretina et al., 2012; Garnett et al., 2012; Basu et al., 2013; Seashore-Ludlow et al., 2015). In particular, the Cancer Cell Line Encyclopedia (CCLE) database consists of the transcriptomic profiles, chromosomal copy number, and mutational profiles of 947 human cancer cell lines screened with 24 targeted therapies. Moreover, Iorio et al. published valuable results and the Genomics of Drug Sensitivity in Cancer (GDSC) dataset (Iorio et al., 2016), consisting of the multi-omics profiles and drug sensitivity scores (IC50) of 1,001 cancer cell lines screened with 265 anti-cancer compounds, which may be used to train predictors to improve drug response prediction in patients. Geeleher et al. (2014) adopted this approach and showed that the trained ridge regression models using whole-genome gene expression and the response of ∼700 cell lines in the Cancer Genome Project (Garnett et al., 2012) resulted in equally good or better predictions of human tumors than gene signatures derived directly from three clinical datasets.
Recently, a deep neural network-based method known as multi-omics late integration (MOLI) was proposed (Sharifi-Noghabi et al., 2019). This method was used to predict drug response by first embedding each multi-omics data type separately and then concatenating all embeddings into one representation, which was optimized via a cost function. The performance of MOLI was validated on patient-derived xenograft (PDX)/human tumor datasets of five chemotherapies and two targeted therapies. Moreover, data from cell lines screened with drugs targeting the same pathway, pan-drug data, were also integrated into MOLI to significantly improve its performance on targeted therapies.
Gene expression data are the most effective of the four omic data types for pan-cancer drug response prediction (Iorio et al., 2016). Thus, we used gene expression data in this study. Furthermore, when transferring the trained predictors from cell lines (the source domain) to human tumors or PDXs (the target domain), it is assumed that the features (genes in this study), which are used to train the predictors, behave similarly in these domains. However, cell lines and human tumors/PDXs are known to be different in the following respects (Gillet et al., 2013): there is no tumor micro-environment and vasculature in cell lines and no immune system in cell lines/PDXs. Nevertheless, strong positive correlations for mutational and transcriptomic profiles were found between cell lines and tumors (Barretina et al., 2012). Thus, it is reasonable to assume that there is a subset of genes that behave similarly between cancer cell lines and primary tumors (the two domains). PRECISE, a domain adaptation-based method, was developed to capture information shared among the preclinical models and human tumors (Mourragui et al., 2019). The resulting domain-invariant predictors were shown to reliably recover known associations between biomarkers and the corresponding drugs in human tumors. PRECISE assumes that the conditional distributions for drug response are the same in both domains (
To alleviate this shortcoming, we adopted supervised domain adaptation (DA) (Koniusz et al., 2017; Motiian et al., 2017). Although DA uses information of all labels in a test set, it has been shown to outperform numerous baselines on real-world datasets in active learning, e.g., the MNIST and USPS datasets containing images of digits from 0 to 9 analyzed by Motiian et al. (2017) and the office dataset, which is a benchmark for visual domain adaptation (Motiian et al., 2017). This study is the first application of DA to the area of drug response prediction. Here, we propose feature selection procedures combined with a regular logistic ridge regression model (called LogitDA) or with a non-linear classifier K-nearest neighbor (called KNNDA), which have the following desirable properties: 1) our assumption is weaker than that of the existing methods, and if the given training and test datasets satisfy the assumption, the proposed predictors achieve a high area under the receiver operating characteristic curve (AUC; Results), even when the training dataset is relatively small; 2) we devise an adjustment of the prediction probability cutoff for LogitDA, which leads to high prediction accuracy no matter whether datasets meet the assumption or not; and 3) the proposed method can be combined with any linear or non-linear classifier to be trained, thus being versatile.
We used the labels of the test sets only in the feature selection procedures. Specifically, we selected genes (
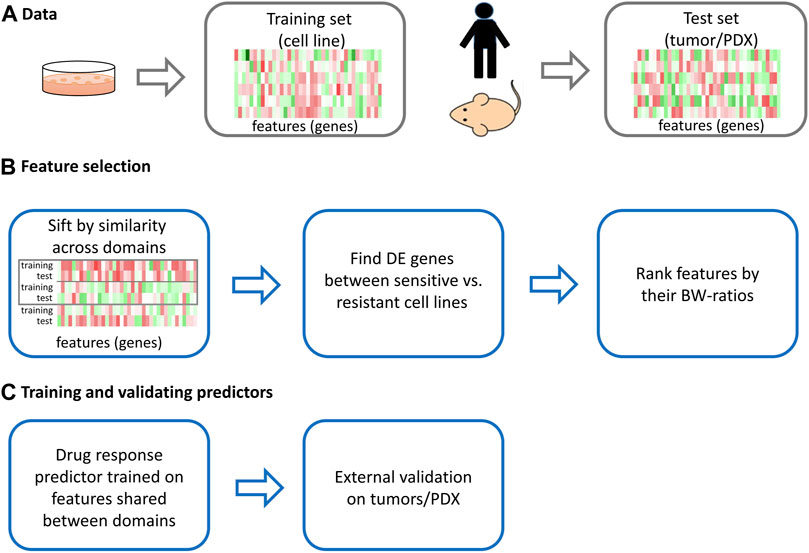
FIGURE 1. The scheme of the proposed approach.
Notably, LogitDA and KNNDA turned out to be very powerful for drug response prediction. For example, LogitDA (KNNDA), trained by the top-ranked 50 (220) selected genes of the 370 cell lines screened with erlotinib, resulted in a prediction AUC of 0.94 (0.90) for NSCLC tumors. The high prediction power of LogitDA (KNNDA) for targeted therapies suggests that these predictors may help physicians stratify patients with NSCLC who will respond to erlotinib and spare those who do not from adverse effects, illustrating that these predictors have clinical implications. Finally, we uncovered the pathways of the top-fitted genes of LogitDA/KNNDA for erlotinib and cetuximab, which include pathways relevant to anti-cancer therapies and several metabolic pathways. These results indicate that our methods can efficiently translate cell-line-trained predictors into human tumors.
Methods
Datasets
The gene expression data and drug response of 1,001 cell lines screened with 265 drugs in the GDSC dataset (Iorio et al., 2016) were used as training sets, and ten sets of gene expression data and the response of PDX/patients treated with chemotherapies and targeted therapies were used for testing. The test sets consisted of three clinical trial datasets for docetaxel, erlotinib, and sorafenib (Geeleher et al., 2014), four sets from PDX Encyclopedia datasets (Gao et al., 2015), and three sets of TCGA patients (Weinstein et al., 2013; Ding et al., 2016). The sources for both training and testing datasets are detailed in Data Availability Statement. All datasets are publicly available.
Gene expression profiles of cell lines, which were RMA-normalized, log-transformed, and aggregated to the level of genes, were downloaded from the GDSC database. The gene expression profiles of the first three test datasets were preprocessed by Geeleher et al. (2014), and those of the remaining seven test sets (from MOLI) were converted to TPM and log-transformed by Sharifi-Noghabi et al. (2019).
Pre-processing of gene expression data
The GED of cell lines from the GDSC dataset was first standardized by the mean and standard error (s.e.) of each gene. Next, the GED of each cell line was normalized by the house-keeping gene GAPDH across cell lines and homogenized with the GED of test sets by the ComBat() function from the sva library in R (Geeleher et al., 2014). The details of each dataset, such as the drug name, the number of samples, and the number of genes in the training and test sets, are provided in Table 1. Similar to existing methods (Geeleher et al., 2014; Sharifi-Noghabi et al., 2019), we included only genes present in both training and test sets for the subsequent analysis; the four columns from the right-hand side of Table 1 show the number of overlapping genes.
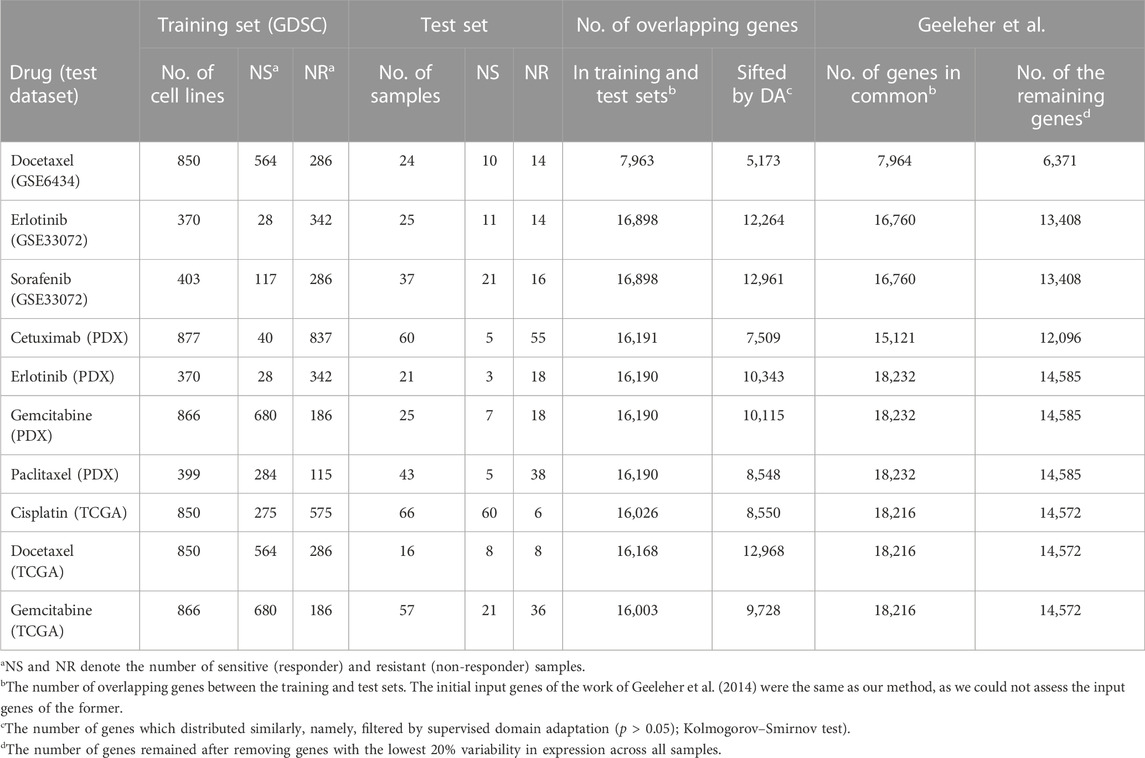
TABLE 1. Information about the training and test datasets of the studied drugs.
Feature selection procedures
For a given drug d, let
The proposed feature selection consisted of three procedures: 1) supervised DA (Mourragui et al., 2019), 2) differential expression between sensitive and resistant cells, and 3) the ratio of “between-group to within-group sums of squares” (the BW ratio) (Dudoit et al., 2002), where the two groups refer to sensitive cell lines and resistant cell lines for each drug. As cell lines (the training sets) are different from patients and mouse models in the test sets, we applied DA to sift genes whose conditional distributions given the label Y across domains were not significantly different. The intuition for feature selection procedures 2) and 3) is stated in Supplementary methods. In a pilot study, we also studied Logit (KNN) trained by genes and sifted by unsupervised DA in combination with the latter two proposed feature selection procedures. However, the predictors employing unsupervised DA performed in a manner considerably inferior to those employing supervised DA, given that the remaining procedures were kept the same. Thus, we used supervised DA in this study.
Specifically, for each drug and gene X, the Kolmogorov–Smirnov (KS) test for equality of the conditional distribution of selected genes X given the label Y in the source and target domains,
Given the features
Proposition 1. assumed that the features
where
Training models using GDSC datasets
For fixed top-ranked p genes, where p ranged from 50 with step size 10 to 200 (denoted by 50 (10)200), 200 (20)400, and 400 (100)1,000) genes of the cell lines, we trained the hyperparameter λ (the penalty constant of logit regression) and p using 5-fold CV with ten repeats. We used grid-search to tune the hyper-parameter as follows. First, let
For the classifier KNN, we used the distance measure 1 − rho, where rho is Spearman’s rho between any two cell lines with selected p genes because the default Euclidean distance did not work well for the GED of any two cell lines in our pilot study. For each drug and fixed top-ranked p gene, where p = 50 (10)200, 200 (20) 400, and 400 (100)1,000 genes of the cell lines, we first trained the hyperparameter K of KNN, via 5-fold CV with ten repeats and using the GED and drug response of cell lines, and computed the AUC in the cross-validation experiments. The hyperparameter K was determined by the experiment with the highest averaged CV score. We then fitted all data into this KNN classifier with each top-ranked p gene. Of all the top-p-ranked KNN classifiers trained, the one with the highest averaged CV score determined the value of p, which was one trained KNNDA predictor. We repeated the aforementioned procedures ten times to yield the mean and s.e. of the prediction AUC of KNNDA.
Adjustment of the probability cutoff
The following lemma and Proposition 2 established the theoretical foundation for adjusting the prediction probability cutoff when the drug response rates between cell lines and tumors differ.
Lemma. When
The proof is given in Supplementary information.
Proposition 2. assumed that the predictors
External validation of the trained classifiers
Finally, we applied the trained predictors LogitDA with α = 0.7 and KNNDA with α = 0.7 to the ten external test sets. To compare with the results of the baseline ridge regression (Geeleher et al., 2014) and MOLI complete (Sharifi-Noghabi et al., 2019), we repeated the experiments ten times for estimating the s.e. of the predictors for each drug.
Results
Experimental design
In this study, we aimed to investigate the following questions: Do logistic ridge regression and KNN with adequately selected features outperform a deep learning-based predictor, MOLI complete (Sharifi-Noghabi et al., 2019), in terms of prediction AUC on external test sets (PDX and patient data)? Do the proposed predictors, LogitDA and KNNDA, work well for targeted therapies and/or chemotherapies? Information about the training and test datasets of the ten studied drugs is provided in Table 1.
After the features (namely, genes in this study) were selected by the proposed procedures (see Methods for details), we trained logistic ridge regression (KNN) with 5-fold CV using the GED of the prioritized features of GDSC cell lines screened with seven drugs, which included docetaxel, erlotinib, sorafenib, cetuximab, gemcitabine, paclitaxel, and cisplatin, in a total of ten sets. These drugs were chosen because we planned to compare LogitDA and KNNDA to the baseline logistic ridge regression (Geeleher et al., 2014) and MOLI complete (Sharifi-Noghabi et al., 2019).
Training our predictors LogitDA and KNNDA
As the training set (GDSC cell lines) is quite different from the test sets (PDX and patient data) (Sharifi-Noghabi et al., 2019), the cutoff for domain adaptation should be strict. Nevertheless, this threshold should allow sufficient features to pass so that a classifier can be adequately trained; see Methods for details. Therefore, we trained LogitDA with features (
Supplementary Table S1 shows that the CV scores of LogitDA_0.6 were equivalent to those of LogitDA_0.7 for the ten drugs. However, to satisfy the DA condition required by Proposition 1, namely, the marginal conditional distribution of selected genes X given the label Y in both domains is equal, the value of α should be large, so we chose LogitDA_0.7. Proposition 1 shows that features that satisfy the conditions will be domain-invariant. That is, if the features perform well in the source domain, they will also perform well in the target domain.
Moreover, we observed that each averaged CV score of LogitDA_0.7 was higher than that of LogitDA_0.8 and LogitDA_0.9, except that they had the same CV score for cetuximab (PDX). Thus, among the LogitDA predictors, we suggest using LogitDA_0.7 for the prediction of the drug response of patients/PDX and denote it by LogitDA, henceforth, for simplicity; for details, we refer to Table 2.
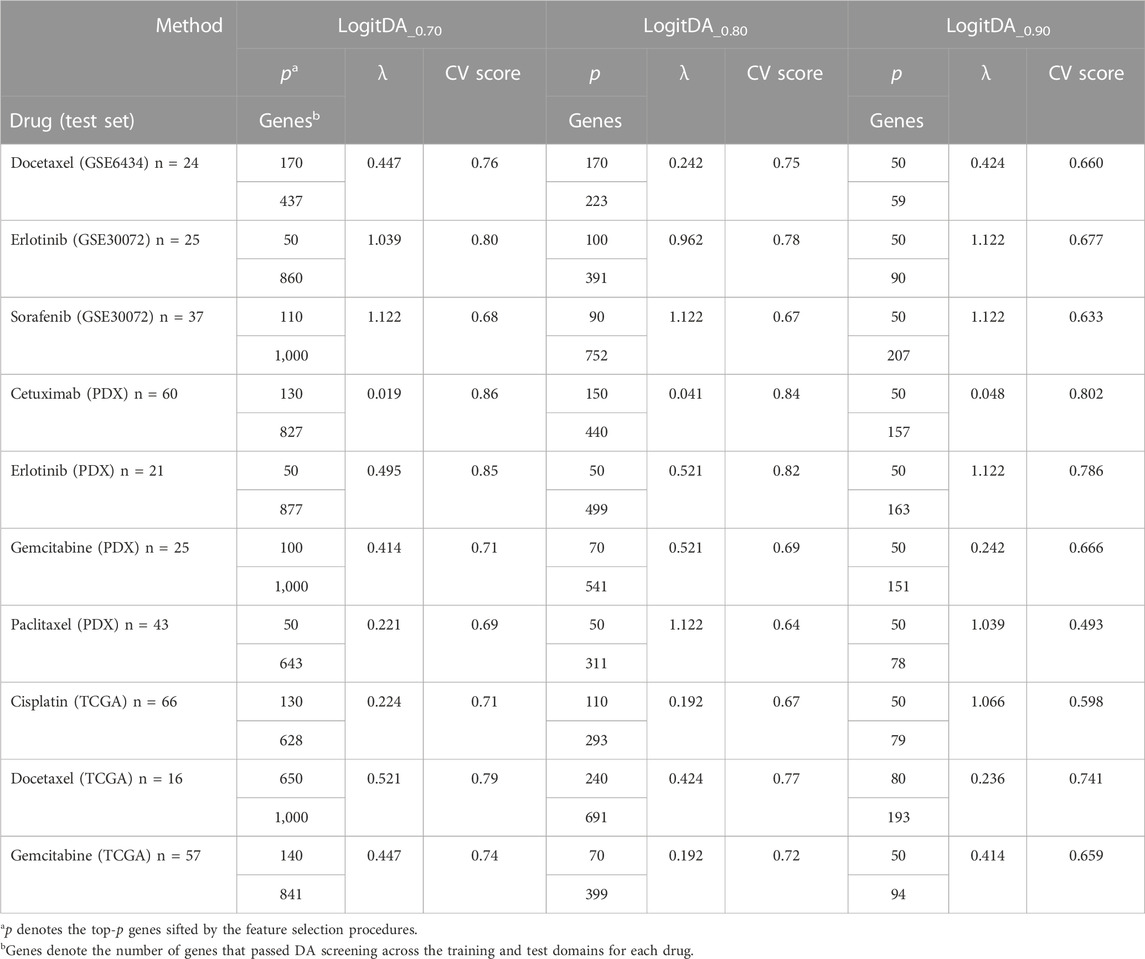
TABLE 2. Cross-validation result of LogitDA_α with various cutoffs of the KS test.
Taking the training result of LigitDA into account, we trained the non-linear KNNDA with α = 0.7, 0.8, and 0.9 for the KS test and summarized the 5-fold CV result in Table 3. KNNDA_0.7 performed better than KNNDA_0.8, as the former had higher (lower) averaged CV scores for five (two) drugs than the latter; the differences ranged from 1% to 4%. Moreover, KNND_0.8 outperformed KNNDA_0.9 in terms of higher averaged CV scores for nine of the ten drugs. Thus, we suggest using KNNDA_0.7 among these non-linear predictors for the test sets. For simplicity, we denote KNNDA_0.7 by KNNDA henceforth.
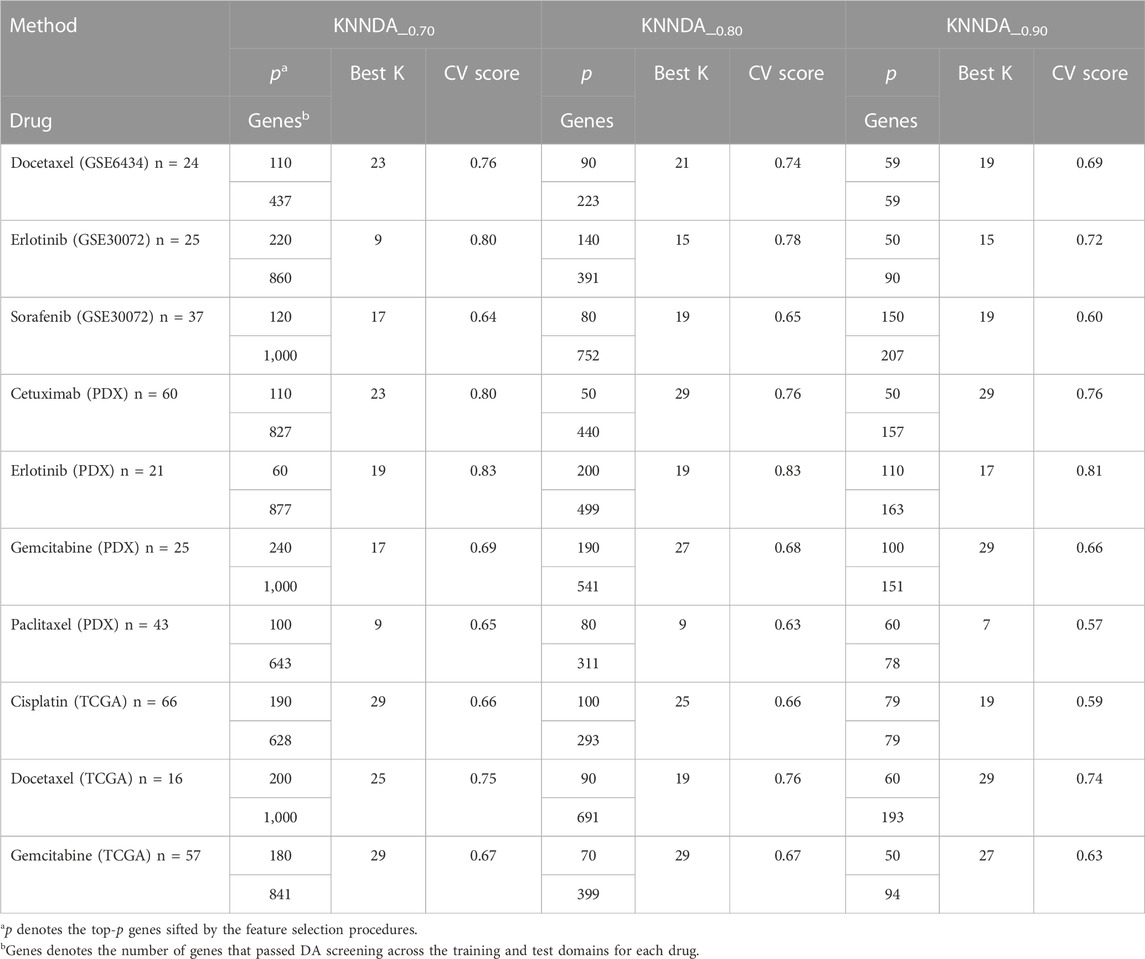
TABLE 3. CV result of KNNDA_α with various cutoffs of the KS test.
LogitDA and KNNDA predict well for the ten drugs
Next, Table 4 and Figure 2 report the prediction AUC of LogitDA and KNNDA for the ten test sets. The predictor LogitDA achieved a prediction AUC >0.8 for five drugs and predicted AUCs of 0.71 and 0.70 for docetaxel and sorafenib, respectively. In particular, LogitDA using the top-ranked 50, 130, 50, 100, and 650 genes resulted in prediction AUCs of 0.94, 0.93, 1.00, 0.83, and 0.81 for erlotinib, cetuximab (PDX), erlotinib (PDX), gemcitabine (PDX), and docetaxel (TCGA), respectively. This result shows that LogitDA may be useful for precision oncology, especially for the targeted therapies erlotinib and cetuximab.
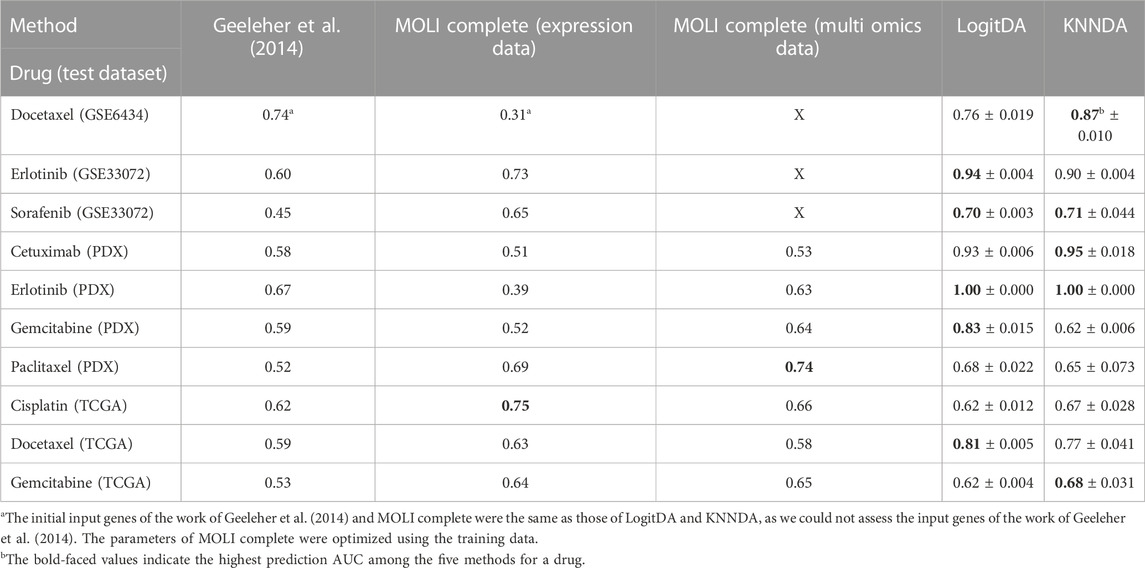
TABLE 4. Performance of LogitDA and KNNDA compared to the other methods in terms of prediction AUC across four targeted therapies and six chemotherapies.
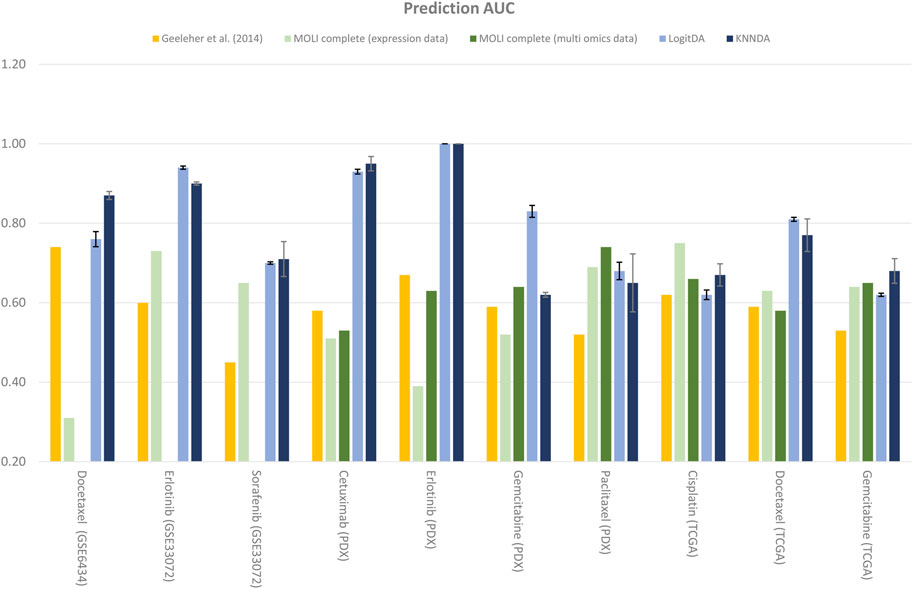
FIGURE 2. Performance of LogitDA and KNNDA compared to other methods in terms of the prediction AUC for the ten drugs.
Of the ten drugs, the predictor KNNDA achieved a prediction AUC >0.8 for four drugs. Specifically, KNNDA using the top-ranked 110, 220, 110, and 60 genes resulted in prediction AUCs of 0.87, 0.90, 0.95, and 1.00 for docetaxel, erlotinib, cetuximab (PDX), and erlotinib (PDX), respectively. This result shows that KNNDA may also be useful for precision oncology.
We further compared LogitDA to KNNDA. Of the ten drugs, LogitDA had a significantly higher (21% higher) (11% lower) prediction AUC compared to KNNDA for gemcitabine (PDX) (docetaxel) and performed equivalent to KNNDA for the remaining eight drugs. Thus, these predictors performed equivalently; we refer to Table 4 for details.
Our predictors outperform the deep learning-based MOLI
As shown in Table 4 and Figure 2, the predictors LogitDA and KNNDA performed significantly better (16%–35% and 13%–37% higher prediction AUC) than the baseline logistic ridge regression model (Geeleher et al., 2014) for nine and ten out of the ten drugs, respectively.
Next, we compared LogitDA and KNNDA to the deep neural network (DNN)-based method MOLI (Sharifi-Noghabi et al., 2019), which outperformed DNNs with early integration, with 5-fold CV and 10 repeats. Of the ten drugs in Table 4, LogitDA and KNNDA outperformed MOLI complete (expression data) for seven and eight drugs, respectively. In particular, LogitDA and KNNDA had 31%–61% and 44%–61% higher prediction AUCs compared to MOLI complete for docetaxel, cetuximab (PDX), erlotinib (PDX), and gemcitabine (PDX). Furthermore, LogitDA and KNNDA also had significantly higher (18%–21% and 14%–17%) prediction AUCs compared to MOLI complete for erlotinib and docetaxel (TCGA). LogitDA and KNNDA only performed significantly worse than MOLI complete (13% and 8% lower prediction AUC) for cisplatin (TCGA).
The prediction AUC of LogitDA for both cisplatin and gemcitabine (TCGA) was only 62%, which may be because the ratio of sensitive (responders) versus resistant (non-responders) samples is reversed from the training to the test sets (from about 1:2 to 10:1 for cisplatin); in other words, our assumption that the ratio of sensitive to resistant samples in both domains is equal was not met.
EGFR expression has been used as a biomarker to treat colorectal cancer (CRC) patients with wild-type KRAS in the US (patients with metastatic CRC and HNSCC in the EU). However, EGFR expression does not predict a response to cetuximab (Messersmith and Ahnen, 2008). The high prediction AUC of LogitDA for cetuximab (PDX) suggests that the fitted 130 genes may be promising for selecting KRAS wild-type patients with CRC for cetuximab, provided more test sets are validated.
Furthermore, we compared LogitDA (KNNDA) to MOLI complete (multi-omics data). LogitDA (KNNDA) has a significantly higher prediction AUC 19%–40% (19%–42%) in the test set of cetuximab (PDX), erlotinib (PDX), gemcitabine (PDX, LogitDA only), and docetaxel (TCGA) and performed equivalent (<6% differences of test AUC) to MOLI complete (multi-omics data) for the remaining drugs, except that KNNDA had 9% less test AUC for paclitaxel; please refer to Table 4 for details.
For targeted therapies such as erlotinib and cetuximab, Sharifi-Noghabi and colleagues further trained MOLI on multi-omics data of five drugs targeting the EGFR pathway (MOLI complete (pan-drug)), which consisted of >3,000 samples. It is interesting that LogitDA (KNNDA) (using merely hundreds of samples) outperformed MOLI (pan-drug) for erlotinib (PDX) and cetuximab (PDX) with 28% and 13% (28% and 15%) higher prediction AUCs, respectively.
In addition to the high prediction AUC for the aforementioned drugs, our approach also has the advantages of being interpretable and using much fewer (50–650) genes that are interpretable in comparison with the baseline logistic ridge regression and MOLI, which used more than 12,000 genes, except for docetaxel, for which ∼6,370 were used, as shown in Table 1. The use of much fewer genes (features) and hyperparameters may prevent LogitDA and KNNDA from overfitting problems.
Prediction accuracy of LogitDA for the ten drugs
For some of the ten drugs whose odds ratios of the source and target domains
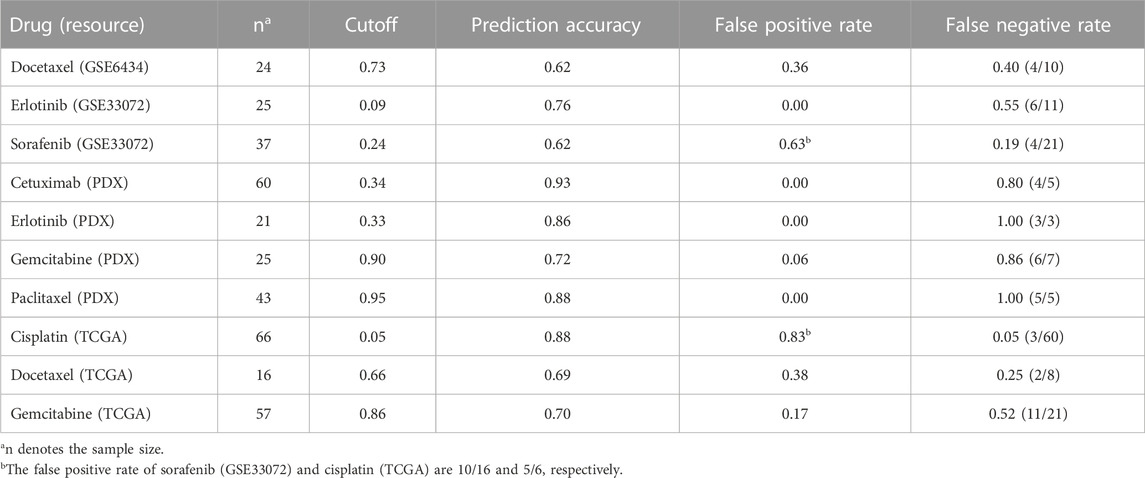
TABLE 5. Prediction accuracy of LogitDA with the adjusted cutoffs of the ten drugs.
Ablation study
In a pilot study, we found that DA considerably improved the prediction AUC of logistic ridge regression (KNN) combined with feature selection using DE genes and BW ratio. Thus, it was of interest to evaluate the contribution of DA. We trained logistic ridge regression and KNN with the features selected by the two aforementioned feature selections (denoted as LogitDA-DA and KNNDA-DA, respectively) for the ten drugs. Supplementary Table S3 shows that LogitDA-DA (KNNDA-DA) used a few hundred genes to achieve equivalent test AUCs as the baseline logit model trained by more than 5,100–13,400 features for the ten drugs (Figure 2). Table 6 shows that DA increases the averaged prediction AUC of LogitDA (KNNDA) from 0.55 to 0.79 (0.57–0.78) over LogitDA-DA (KNNDA-DA), where the averaged prediction AUC was averaged over the ten drugs; the improvements are quite significant.
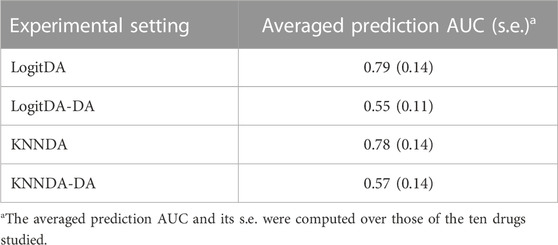
TABLE 6. Ablation study of the proposed predictors with DA versus without DA.
Pathways relevant to erlotinib and cetuximab discovered
As LogitDA and KNNDA perform well in the prediction AUC for erlotinib and cetuximab (PDX), it is of interest to find the pathways in which the fitted genes of these predictors are involved. Thus, we first submitted the top-ranked 220 genes of LogitDA and KNNDA for erlotinib into the database Ingenuity Pathway Analysis (IPA; http://www.ingenuity.com) and uncovered the relevant pathways in Supplementary Table S4. Interestingly, several important metabolic pathways were discovered, e.g., Purine Nucleotides de novo Biosynthesis (Ali et al., 2020; Taha-Mehlitz et al., 2021) and Histidine Degradation VI (Tominaga et al., 2019; Han et al., 2020). Furthermore, pathways for epigenetic regulation (Yu et al., 2018; Du et al., 2019) and DNA repair (nucleotide excision repair enhanced pathway) (Dong et al., 2019; Wang T. et al., 2021; Sato et al., 2021) were also uncovered. The aforementioned pathways play essential roles in tumor malignancy and response to anti-cancer therapies.
The overlap of the aforementioned fitted genes and the uncovered pathways (in the molecules column of Supplementary Table S5) has been reported to contribute to tumor progression (cell proliferation, survival, invasion, and metastasis) and drug resistance. Specifically, LIG1 is an attractive target for personalization of ovarian cancer therapy (Ali et al., 2021), and decreased eEF2 phosphorylation, mediated by increased PP2A activity, contributes to resistance to HER2 inhibition (McDermott et al., 2014). ADSL has been suggested as a predictive biomarker of response to 6-mercaptopurine (under the brand name Purinethol) in a pre-clinical setting (Taha-Mehlitz et al., 2021).
Moreover, MTA3 downregulates SOX2OT, and the MTA3/SOX2-OT/SOX2 axis has been reported as a potential cancer stratification marker in human esophageal squamous cell carcinomas (Du et al., 2019). Finally, CAD, a key enzyme of de novo pyrimidine biosynthesis essential for cell proliferation, has been found to directly interact with the second generation of EGFR-TKI Afatinib, which also targets EGFR in the same pathway as erlotinib (Tu et al., 2021).
Similarly, we submitted the top-ranked 130 genes of LogitDA for cetuximab (PDX) and uncovered DNA repair, metabolic processes, and lysosome-associated pathways; the details of the pathways are listed in Supplementary Table S5. The overlap of the fitted genes and the uncovered pathways includes CDK7, IGF-1R, and others. In particular, CDK7 is a key regulator of transcription and cell-cycle control, and its deregulation in cancer has been linked to a worse prognosis (Jagomast et al., 2022). Inhibition of CDK7/12 promotes resistance emergence in response to targeted therapy in lung cancer cells (Rusan et al., 2018; Terai et al., 2018). Moreover, cetuximab therapeutically blocks EGFR, and this might concurrently induce the activation of IGF-1R, which could activate EGFR-downstream Akt signaling, thus mediating cetuximab resistance in gastric cancer cells (Li et al., 2015).
Discussion
Our feature selection approach can be used in combination with any classifier or regression model, not restricted to the logistic ridge regression and KNN demonstrated here, to predict the response of cancer patients using gene expression data. In particular, the ablation study shows that DA increases the prediction power by ∼24% (21%) from LogitDA-DA (KNNDA-DA). Following standard practice, we have chosen the K value of KNNDA that yielded the largest average AUC from 5-fold CV. To see the impact of the selection of K, we computed the test AUC of KNNDA with various values of K in Supplementary Table S6 (p. 17, Supplementary File). The result shows that excluding the smallest value of K (3), within the neighborhood of the optimized K (say, K
LogitDA (KNNDA) performed very well on prediction for five (four) out of the ten targeted therapies and chemotherapies (AUC >0.81), i.e., erlotinib (two sets), cetuximab, gemcitabine, and docetaxel. Thus, these predictors may efficiently uncover novel biomarkers and pathways, although large test sets are warranted. In addition to the high prediction AUC for the aforementioned drugs, our approach also has the advantage of using much fewer (50–650) genes than the baseline logistic ridge regression and MOLI, which used more than 5,100 or 12,000 genes.
Notably, using the novel adjusted cutoff of prediction probability, LogitDA achieved a prediction accuracy of 0.70 or higher for seven of the ten drugs. In particular, the prediction accuracy of LogitDA increases to 0.76 from 0.56 (using the default cutoff of 0.5), using the adjusted cutoff of 0.09, as Proposition 2 suggests. Moreover, its prediction accuracy increased to 0.80 if we focused on 20 EGFR and KRAS wild-type patients with NSCLC, whereas there is no currently effective predictive marker of drug response for these patients. Thus, LogitDA may be useful for stratifying such NSCLC patients for erlotinib in clinical practice. Although the test AUCs for chemotherapies such as paclitaxel and cisplatin were only 0.68 and 0.62, respectively, their prediction accuracy achieved 0.88 and 0.88 for paclitaxel (PDX) and cisplatin (66 patients in TCGA), using the adjusted cutoffs for the prediction probability.
As LogitDA and KNNDA performed well in prediction responses to erlotinib and cetuximab, we used the fitted genes of the predictors to uncover several important metabolic pathways for these drugs, in addition to DNA repair pathways. The aforementioned pathways play essential roles in tumor malignancy and response to anti-cancer therapies.
It is interesting to point out that LogitDA performed particularly well for certain targeted therapies. LogitDA used 370 cell lines for training and achieved test AUCs of 0.94 and 1.00 for erlotinib (clinical trial and PDX). In contrast, deep learning-based methods, e.g., MOLI aggregated related samples (of drugs targeting the same EGFR pathway) to a larger training set (>3,000 cell lines) and used multi omics data to train the classifier, increased the test AUC from 0.63 to 0.72 for erlotinib (PDX). These differences may be because our approach prioritizes important features, limiting the number of parameters in the logistic ridge regression to at most 1,000 genes to fit. Nevertheless, MOLI (gene expression) performed very well in the prediction of chemotherapies, e.g., with a prediction AUC of 0.75 for cisplatin (TCGA), which outperformed LogitDA (using 130 genes) and KNNDA (using 190 genes).
This study employed GED, which has been shown to be the most predictive data type among omics data (Iorio et al., 2016), to predict the drug response of cancer patients; integrating GED and other omics data types to predict the drug response is a natural extension. We postulate that chemotherapies usually target broad biological mechanisms, so predictors for these therapies may require more genes to train to predict well. This suggests a future research direction in which biological domain knowledge (Ma et al., 2021) is incorporated to integrate samples screened with several therapeutics targeting the same tumorigenesis mechanism to improve the performance of our approach. This research direction is similar to a recent development in which adversarial inductive transfer learning (Pan and Yang, 2010) is applied to drug response prediction (AITL, Sharifi-Noghabi et al., 2020). AITL applied adversarial domain adaptation and multi-task learning to tackle discrepancies in the input and output spaces of drug response prediction. Moreover, combining the proposed feature selection method with deep learning-based methods may prove powerful for drug response, as the former has been shown to improve the prediction power of linear and nonlinear predictors for drug response. Finally, applying the concept of few-shot learning (Ma et al., 2021), namely, applying DA to only partial test samples and keeping the remaining procedures the same, may reveal the minimum number of test labels required for adequate performance of our predictors.
Data availability statement
Publicly available datasets were analyzed in this study. These data can be found at: http://geeleherlab.org/cgpPrediction; https://zenodo.org/record/4036592; PDX Encyclopedia datasets; TCGA; and Broad GDAC Firehose.
Author contributions
GSS designed and supervised the study. SY proved the propositions. Y-CC modified the codes and implemented all codes. C-HT wrote an earlier version of the codes. H-WC analyzed the pathways. SY and GSS interpreted the results and wrote the manuscript. All authors contributed to the article and approved the submitted version.
Funding
This research was supported by Academia Sinica, Taiwan (Tukey Grant to GSS and SY, Mathematics in Biology, AS-104-TP-A07, AS-SUMMIT) and the National Science and Technology Council, Taiwan, Republic of China (NSTC 109-2118-M-001-001-MY2 and 111-2118-M-001-009-MY2 to GSS and NSTC 106-2314-B-001-005 to SY).
Acknowledgments
The authors thank Jan-Gowth Chang for the discussions and U-Hou Lok, Ce-Bo Yang, and Brian Kim for computational assistance.
Conflict of interest
The authors declare that the research was conducted in the absence of any commercial or financial relationships that could be construed as a potential conflict of interest.
Publisher’s note
All claims expressed in this article are solely those of the authors and do not necessarily represent those of their affiliated organizations, or those of the publisher, the editors, and the reviewers. Any product that may be evaluated in this article, or claim that may be made by its manufacturer, is not guaranteed or endorsed by the publisher.
Supplementary material
The Supplementary Material for this article can be found online at: https://www.frontiersin.org/articles/10.3389/fgene.2023.1217414/full#supplementary-material
References
Ali, E. S., Sahu, U., Villa, E., O’Hara, B. P., Gao, P., Beaudet, C., et al. (2020). ERK2 phosphorylates PFAS to mediate posttranslational control of de novo purine synthesis. Mol. Cell. 78 (6), 1178–1191.e6. doi:10.1016/j.molcel.2020.05.001
Ali, R., Alabdullah, M., Algethami, M., Alblihy, A., Miligy, I., Shoqafi, A., et al. (2021). Ligase 1 is a predictor of platinum resistance and its blockade is synthetically lethal in XRCC1 deficient epithelial ovarian cancers. Theranostics 11 (17), 8350–8361. doi:10.7150/thno.51456
Barretina, J., Caponigro, G., Stransky, N., Venkatesan, K., Margolin, A. A., Kim, S., et al. (2012). The Cancer Cell Line Encyclopedia enables predictive modelling of anticancer drug sensitivity. Nature 483 (7391), 603–607. doi:10.1038/nature11003
Basu, A., Bodycombe, N. E., Cheah, J. H., Price, E. V., Liu, K., Schaefer, G. I., et al. (2013). An interactive resource to identify cancer genetic and lineage dependencies targeted by small molecules. Cell. 154 (5), 1151–1161. doi:10.1016/j.cell.2013.08.003
Ding, Z., Zu, S., and Gu, J. (2016). Evaluating the molecule-based prediction of clinical drug responses in cancer. Bioinformatics 32 (19), 2891–2895. doi:10.1093/bioinformatics/btw344
Dong, S., Li, W., Wang, L., Hu, J., Song, Y., Zhang, B., et al. (2019). Histone-related genes are hypermethylated in lung cancer and hypermethylated HIST1H4F could serve as a pan-cancer biomarker. Cancer Res. 79 (24), 6101–6112. doi:10.1158/0008-5472.CAN-19-1019
Du, L., Wang, L., Gan, J., Yao, Z., Lin, W., Li, J., et al. (2019). MTA3 represses cancer stemness by targeting the SOX2OT/SOX2 Axis. Iscience 22, 353–368. doi:10.1016/j.isci.2019.11.009
Dudoit, S., Fridlyand, J., and Speed, T. P. (2002). Comparison of discrimination methods for the classification of tumors using gene expression data. J. Am. Stat. Assoc. 97 (457), 77–87. doi:10.1198/016214502753479248
Gao, H., Korn, J. M., Ferretti, S., Monahan, J. E., Wang, Y., Singh, M., et al. (2015). High-throughput screening using patient-derived tumor xenografts to predict clinical trial drug response. Nat. Med. 21 (11), 1318–1325. doi:10.1038/nm.3954
Garnett, M. J., Edelman, E. J., Heidorn, S. J., Greenman, C. D., Dastur, A., Lau, K. W., et al. (2012). Systematic identification of genomic markers of drug sensitivity in cancer cells. Nature 483 (7391), 570–575. doi:10.1038/nature11005
Geeleher, P., Cox, N. J., and Huang, R. S. (2014). Clinical drug response can be predicted using baseline gene expression levels and in vitrodrug sensitivity in cell lines. Genome Biol. 15 (3), R47–R12. doi:10.1186/gb-2014-15-3-r47
Gillet, J.-P., Varma, S., and Gottesman, M. M. (2013). The clinical relevance of cancer cell lines. J. Natl. Cancer Inst. 105 (7), 452–458. doi:10.1093/jnci/djt007
Han, M., Wang, S., Yang, N., Wang, X., Zhao, W., Saed, H. S., et al. (2020). Therapeutic implications of altered cholesterol homeostasis mediated by loss of CYP46A1 in human glioblastoma. EMBO Mol. Med. 12 (1), e10924. doi:10.15252/emmm.201910924
Haslam, A., Kim, M., and Prasad, V. (2021). Updated estimates of eligibility for and response to genome-targeted oncology drugs among US cancer patients, 2006-2020. Ann. Oncol. 32 (7), 926–932. doi:10.1016/j.annonc.2021.04.003
Iorio, F., Knijnenburg, T. A., Vis, D. J., Bignell, G. R., Menden, M. P., Schubert, M., et al. (2016). A landscape of pharmacogenomic interactions in cancer. Cell. 166 (3), 740–754. doi:10.1016/j.cell.2016.06.017
Jagomast, T., Idel, C., Klapper, L., Kuppler, P., Offermann, A., Dreyer, E., et al. (2022). CDK7 predicts worse outcome in head and neck squamous-cell cancer. Cancers 14 (3), 492. doi:10.3390/cancers14030492
Koniusz, P., Tas, Y., and Porikli, F. (2017). “Domain adaptation by mixture of alignments of second-or higher-order scatter tensors,” in Proceedings of the IEEE conference on computer vision and pattern recognition, Honolulu, HI, USA, July 2017 (IEEE), 4478–4487.
Li, X., Xu, L., Li, H., Zhao, L., Luo, Y., Zhu, Z., et al. (2015). Cetuximab-induced insulin-like growth factor receptor I activation mediates cetuximab resistance in gastric cancer cells. Mol. Med. Rep. 11 (6), 4547–4554. doi:10.3892/mmr.2015.3245
Ma, J., Fong, S. H., Luo, Y., Bakkenist, C. J., Shen, J. P., Mourragui, S., et al. (2021). Few-shot learning creates predictive models of drug response that translate from high-throughput screens to individual patients. Nat. Cancer 2 (2), 233–244. doi:10.1038/s43018-020-00169-2
McDermott, M. S., Browne, B. C., Conlon, N. T., O’Brien, N. A., Slamon, D. J., Henry, M., et al. (2014). PP2A inhibition overcomes acquired resistance to HER2 targeted therapy. Mol. cancer 13 (1), 157. doi:10.1186/1476-4598-13-157
Messersmith, W. A., and Ahnen, D. J. (2008).Targeting EGFR in colorectal cancer. N. Engl. J. Med. 359 (17), 1834–1836.
Motiian, S., Piccirilli, M., Adjeroh, D. A., and Doretto, G. (2017). “Unified deep supervised domain adaptation and generalization,” in Proceedings of the IEEE international conference on computer vision (IEEE), 5715–5725.
Mourragui, S., Loog, M., Van De Wiel, M. A., Reinders, M. J., and Wessels, L. F. (2019). Precise: A domain adaptation approach to transfer predictors of drug response from pre-clinical models to tumors. Bioinformatics 35 (14), i510–i519. doi:10.1093/bioinformatics/btz372
Pan, S. J., and Yang, Q. (2010). A survey on transfer learning. IEEE Trans. Knowl. Data Eng. 22, 1345–1359. doi:10.1109/tkde.2009.191
Peres da Silva, R., Suphavilai, C., and Nagarajan, N. (2021). Tugda: Task uncertainty guided domain adaptation for robust generalization of cancer drug response prediction from in vitro to in vivo settings. Bioinformatics 37 (1), i76–i83. doi:10.1093/bioinformatics/btab299
Rusan, M., Li, K., Li, Y., Christensen, C. L., Abraham, B. J., Kwiatkowski, N., et al. (2018). Suppression of adaptive responses to targeted cancer therapy by transcriptional repression. Cancer Discov. 8 (1), 59–73. doi:10.1158/2159-8290.CD-17-0461
Sato, M., Liebau, A. W., Liu, Z., Liu, L., Rabadan, R., and Gautier, J. (2021). The UVSSA complex alleviates MYC-driven transcription stress. J. Cell. Biol. 220 (2), e201807163. doi:10.1083/jcb.201807163
Seashore-Ludlow, B., Rees, M. G., Cheah, J. H., Cokol, M., Price, E. V., Coletti, M. E., et al. (2015). Harnessing connectivity in a large-scale small-molecule sensitivity dataset. Cancer Discov. 5 (11), 1210–1223. doi:10.1158/2159-8290.CD-15-0235
Sharifi-Noghabi, H., Zolotareva, O., Collins, C. C., and Ester, M. (2019). Moli: Multi-omics late integration with deep neural networks for drug response prediction. Bioinformatics 35 (14), i501–i509. doi:10.1093/bioinformatics/btz318
Sharifi-Noghabi, H., Peng, S., Zolotareva, O., Collins, C. C., and Ester, M. (2020). Aitl: Adversarial Inductive Transfer Learning with input and output space adaptation for pharmacogenomics. Bioinformatics 36 (1), i380–i388. doi:10.1093/bioinformatics/btaa442
Taha-Mehlitz, S., Bianco, G., Coto-Llerena, M., Kancherla, V., Bantug, G. R., Gallon, J., et al. (2021). Adenylosuccinate lyase is oncogenic in colorectal cancer by causing mitochondrial dysfunction and independent activation of NRF2 and mTOR-MYC-axis. Theranostics 11 (9), 4011–4029. doi:10.7150/thno.50051
Terai, H., Kitajima, S., Potter, D. S., Matsui, Y., Quiceno, L. G., Chen, T., et al. (2018). ER stress signaling promotes the survival of cancer "persister cells" tolerant to EGFR tyrosine kinase inhibitors. Cancer Res. 78 (4), 1044–1057. doi:10.1158/0008-5472.CAN-17-1904
Tominaga, K., Minato, H., Murayama, T., Sasahara, A., Nishimura, T., Kiyokawa, E., et al. (2019). Semaphorin signaling via MICAL3 induces symmetric cell division to expand breast cancer stem-like cells. Proc. Natl. Acad. Sci. 116 (2), 625–630. doi:10.1073/pnas.1806851116
Tu, H.-F., Ko, C.-J., Lee, C.-T., Lee, C.-F., Lan, S.-W., Lin, H.-H., et al. (2021). Afatinib exerts immunomodulatory effects by targeting the pyrimidine biosynthesis enzyme CAD. Cancer Res. 81 (12), 3270–3282. doi:10.1158/0008-5472.CAN-20-3436
Wang, M., Herbst, R. S., and Boshoff, C. (2021). Toward personalized treatment approaches for non-small-cell lung cancer. Nat. Med. 27 (8), 1345–1356. doi:10.1038/s41591-021-01450-2
Wang, T., Chen, X., Jing, F., Li, Z., Tan, H., Luo, Y., et al. (2021). Identifying the hub genes in non-small cell lung cancer by integrated bioinformatics methods and analyzing the prognostic values. Pathology-Research Pract. 228, 153654. doi:10.1016/j.prp.2021.153654
Weinstein, J. N., Collisson, E. A., Mills, G. B., Shaw, K. R., Ozenberger, B. A., Ellrott, K., et al. (2013). The cancer genome atlas pan-cancer analysis project. Nat. Genet. 45 (10), 1113–1120. doi:10.1038/ng.2764
Keywords: cancer, domain adaptation, drug response, feature selection, machine learning, prediction
Citation: Yuan S, Chen Y-C, Tsai C-H, Chen H-W and Shieh GS (2023) Feature selection translates drug response predictors from cell lines to patients. Front. Genet. 14:1217414. doi: 10.3389/fgene.2023.1217414
Received: 05 May 2023; Accepted: 26 June 2023;
Published: 14 July 2023.
Edited by:
Li Zhang, University of California, San Francisco, United StatesReviewed by:
Tian Tian, Children’s Hospital of Philadelphia, United StatesPhi Le, University of California, San Francisco, United States
Copyright © 2023 Yuan, Chen, Tsai, Chen and Shieh. This is an open-access article distributed under the terms of the Creative Commons Attribution License (CC BY). The use, distribution or reproduction in other forums is permitted, provided the original author(s) and the copyright owner(s) are credited and that the original publication in this journal is cited, in accordance with accepted academic practice. No use, distribution or reproduction is permitted which does not comply with these terms.
*Correspondence: Grace S. Shieh, gshieh@stat.sinica.edu.tw
†These authors have contributed equally to this work