 Ruud H. J. Verstegen1,2,3
 Pei M. Aui4,5
 Eliza Watson4,5
 Samuel De Jong4Sophinus J. W. Bartol1
 Julian J. Bosco5,6
 Paul U. Cameron5,6
 Robert G. Stirling5,6
 Esther de Vries7,8
 Jacques J. M. van Dongen9
 Menno C. van Zelm1,4,5,6*
- 1Department of Immunology, Erasmus MC, University Medical Centre, Rotterdam, Netherlands
- 2Division of Rheumatology, Department of Paediatrics, The Hospital for Sick Children, Toronto, ON, Canada
- 3Division of Clinical Pharmacology and Toxicology, Department of Paediatrics, The Hospital for Sick Children, Toronto, ON, Canada
- 4Department of Immunology and Pathology, Monash University, Melbourne, VIC, Australia
- 5The Jeffrey Modell Diagnostic and Research Centre for Primary Immunodeficiencies, Melbourne, VIC, Australia
- 6Department of Allergy, Immunology and Respiratory Medicine, The Alfred Hospital, Melbourne, VIC, Australia
- 7Tranzo, Scientific Center for Care and Welfare, Tilburg University, Tilburg, Netherlands
- 8Laboratory for Medical Microbiology and Immunology, Elisabeth-TweeSteden Hospital, Tilburg, Netherlands
- 9Department of Immunohematology and Blood Transfusion, Leiden University Medical Centre, Leiden, Netherlands
Quantification of T-cell receptor excision circles (TRECs) has impacted on human T-cell research, but interpretations on T-cell replication have been limited due to the lack of a genomic coding joint. We here overcome this limitation with multiplex TRG rearrangement quantification (detecting ~0.98 alleles per TCRαβ+ T cell) and the HSB-2 cell line with a retrovirally introduced TREC construct. We uncovered <5 cell divisions in naive and >10 cell divisions in effector memory T-cell subsets. Furthermore, we show that TREC dilution with age in healthy adults results mainly from increased T cell replication history. This proliferation was significantly increased in patients with predominantly antibody deficiency. Finally, Guthrie cards of neonates with Down syndrome have fewer T and B cells than controls, with similar T-cell and slightly higher B-cell replication. Thus, combined analysis of TRG coding joints and TREC signal joints can be utilized to quantify in vivo T-cell replication, and has direct applications for research into aging, immunodeficiency, and newborn screening.
Introduction
Adaptive immunity is a critical component of the vertebrate immune system and is represented cellularly by B- and T-lymphocytes. Their crucial roles are illustrated in patients with inborn errors of immunity (IEI) (1). For example, patients with severe combined immunodeficiency (SCID) primarily lack mature T cells resulting in a lethal immunodeficiency if untreated (2). Predominantly antibody deficiency (PAD) is more common (3), and infectious complications in these patients can be managed with immunoglobulin replacement and prophylactic antibiotics. Still, about 68% of patients develop non-infectious complications, including autoimmunity and malignancies, which lead to high morbidity and early mortality (4–6). Hence, there is a need for early diagnosis of both severe and milder forms of IEI, as well as reliable markers that could predict future complications.
Similar to all blood cells, B and T lymphocytes are continuously produced throughout life. Progenitor B and T cells in bone marrow and thymus, respectively, generate unique antigen receptors through genomic rearrangements of their immunoglobulin (Ig) and T-cell receptor loci. In this process, coding joints are formed on chromosomes, and signal joints on circular excision products that are stably present in the cell, but are not replicated during cell divisions (7). Newly-formed T cells carry T-cell receptor excision circles (TRECs), whereas in memory T-cell populations these are extremely diluted following cell divisions. As such, TRECS are markers for thymic output (8). Indeed, PCR-based quantitative detection of TRECs has been applied to examine the effects of novel antiviral therapies on the thymic output in patients with HIV infection (8, 9), and following stem cell transplantation (10). Furthermore, TREC detection is currently utilized in many countries world-wide for newborn screening of SCID (11, 12).
More recently, we have introduced the use of Ig kappa deleting recombination excision circles (KRECs) of intronRSS-Kde rearrangements to examine B-cell replication (13). Analogous to TRECs, KREC quantification has been incorporated in several newborn screening protocols to detect absence of B cells for identification of X-linked agammaglobulinemia (XLA) and B-cell negative SCID cases (14, 15). The intronRSS-Kde coding joints remain stably present in the genome of mature B cells (16, 17). As a result, the ratio of these genomic coding joints to KREC signal joints is a direct measure for the average number of cell divisions a population of B cells has undergone (13). This accurate quantification has enabled delineation of T-cell dependent and – independent B-cell responses (18), as well as abnormal proliferation of B-cell subsets in common variable immunodeficiency (CVID; a form of PAD) (19) and Down syndrome (20).
In contrast to intronRSS-Kde coding joints, nearly all δREC-ψJα coding joints are removed from the genome in thymocytes during subsequent Vα-Jα gene rearrangements (21, 22). As a result, these cannot be used as a reliable marker for T-cell input, which complicates the use of TRECs to accurately determine T-cell replication history (23). We here present the means to overcome these limitations through the use of a multiplex PCR assay, which detects Vγ-Jγ gene rearrangement coding joints that are stably present in TCRαβ expressing T cells. Together with a newly generated TREC-containing cell line, these can be used to accurately quantify T-cell replication history. We describe accurate replication histories of naive and memory T cell subsets, enhanced T-cell replication with aging and abnormal T-cell replication in PAD patients. Finally, Vγ-Jγ and intronRSS-Kde coding joints can be reliably quantified from Guthrie cards and might form the basis of a second-tier test for absence of TRECs and/or KRECs in neonatal screening for IEI.
Materials and Methods
Research Subjects and Ethics
All studies were conducted in accordance with the declaration of Helsinki. Blood samples from adult patients with XLA or genetically-undefined PAD, as well as healthy adults were obtained after written informed consent was provided. Buffy coats were obtained from anonymous donors from the Australian Red Cross. These studies were approved by the human ethics committees of The Alfred Hospital (109/15) and Monash University (MEC# CF15/771 and 2016-0289).
Stored Guthrie cards of 107 Dutch anonymous controls and 84 children with Down syndrome, prepared ~3–5 days after birth, were collected after obtaining parental consent (24). All Guthrie cards had been stored at room temperature for 3–9 years. This study was approved by the Medical Ethical Committee “METOPP” employed by the Jeroen Bosch Hospital, the Netherlands.
Generation of Control Cell Lines for the TREC-Assay
A human TREC signal joint was PCR amplified in two parts from genomic DNA of thymocytes to introduce a BamHI restriction site 63 bp downstream of the signal joint, and subsequently cloned into the retroviral LZRS-IRES-lyt2 vector (Figure 1A). The LZRS-TREC construct was transfected into the Phoenix amphotropic packaging cell line using Fugene-6 (Roche Molecular Biochemicals, Branchbury, NY). Stable high-titer producer clones were selected with puromycin (1 μg/ml). The U698-DB01 pre-B-cell line (13, 25) and the HSB-2 immature T cell line (26) were cultured for several days in RPMI 1640 medium containing 10% FCS and antibiotics before transduction using Retronectin-coated Petri dishes (Takara, Shiga, Japan) and recombinant retrovirus containing supernatant for 2 days, with daily replenishing of retroviral supernatant. Cells expressing mouse CD8 (from the lyt2 insert) were single-cell sorted using a FACSAriaI cell sorter (BD Biosciences). Individual clones were selected for dim mCD8 expression suggesting a single genomic integration, and subsequently subjected to real-time quantitative PCR to confirm the single-copy integration (see below).
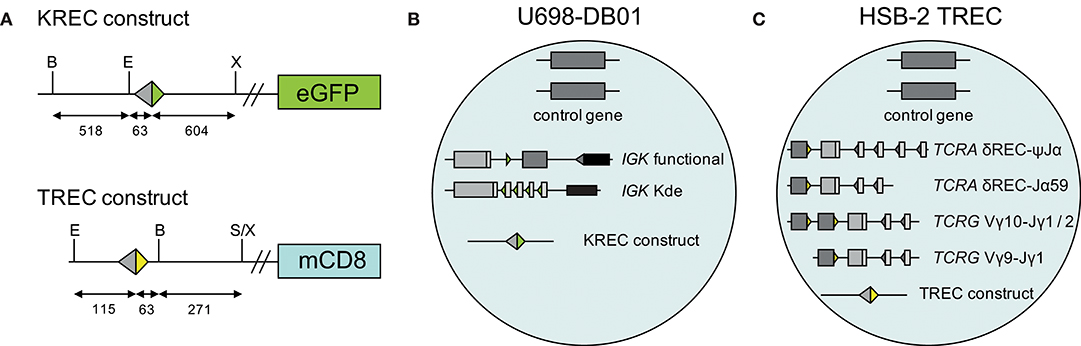
Figure 1. Generation of TREC signal joint containing cell lines. (A) Schematic overview of KREC and TREC constructs. Colored triangles depict RSS, fragment sizes (in bp) are depicted below the constructs, restriction sites: B, BamHI; E, EcoRI; S, SalI; X, XhoI. (B) Genetic composition of U698-DB01 and (C) HSB-2 TREC cell lines.
Isolation of T-Cell Subsets From Human Blood
Post-Ficoll mononuclear cells from blood bank donors were stored in 10% DMSO in liquid nitrogen prior to use. Using magnetic bead-based positive selection, CD4+ T cells were separated from thawed samples, followed by positive selection for CD8+ T cells (Dynabeads; Thermo Fisher). Both T-cell fractions were stained with fluorochrome-conjugated antibodies (Table S1) prior to sort-purification of four CD4+ and four CD8+ T-cell subsets on a FACSAriaI (BD Biosciences).
DNA Extraction From Full Blood, Cell Lines, T-Cell Subsets, and Guthrie Cards
Genomic DNA was isolated from 200 μl whole blood of adult controls and antibody-deficient patients using a whole blood DNA extraction kit (Sigma-Aldrich) and eluted in 200 μl MilliQ. A genomic DNA Miniprep kit (Sigma-Aldrich) was used to isolate DNA from cultured cell lines and sort-purified T-cell subsets. DNA from 3 millimeter punches of Guthrie cards was isolated using the Sigma Genelute DNA Kit, according to the manufacturer's instructions and eluted in 100 μl MilliQ.
Real-Time Quantitative PCR (RQ-PCR)
Independent RQ-PCR reactions were performed in duplicate for the albumin, TREC, KREC, intronRSS-Kde, ψJα_germline, and TRG assays. All experiments with whole blood and T-cell subset DNA were performed in a total mixture of 15 μl containing TaqMan GE Mastermix (Thermo Fisher Scientific), 540 nM of each primer (180 nM in case of multiplex mixtures), 60 nM of each 6-FAM/ZEN/Iowa Black labeled probes (Integrated DNA Technologies) and were run on the QuantStudio 6 Flex (Thermo Fisher Scientific). Five microliter of DNA eluate from Guthrie cards were run in RQ-PCR mixtures of 25 μl containing TaqMan Universal MasterMix (Applied Biosystems, Foster City, CA), 900 nM of each primer (300 nM in case of multiplex mixtures), 100 nM of each FAM-TAMRA labeled probe, 0.4 ng BSA, and were run on the StepOnePlus system (Life Technologies). The primers and probes are listed in Table S2. Total DNA input per reaction was generally between 30 and 200 ng and only samples with duplicates differing <1 CT were included in the calculations.
Calculations
The difference in CT values between albumin and either the intronRSS-Kde and TRG coding joints or the intronRSS-Kde and δREC-ψJα signal joints were used to calculate the frequencies of cells carrying these rearrangements in unpurified leukocytes. To correct for any technical variation (efficiency) of the independent PCR reactions, the assays were run in parallel on the U698-DB01 and HSB-2 TREC cell lines. As the U698-DB01 cell line contains one intronRSS-Kde coding joint and one signal joint per genome (Figure 1B), and the HSB-2 cell line contains one δREC-ψJα signal joint per genome (Figure 1C), the frequency of cells in a sample containing these was calculated as follows:
Because the HSB-2 TREC cell line contains two TRG coding joints per genome (Figure 1C), the outcome of the equation above was multiplied by 2 to obtain the frequency of T cells rather than the frequency of rearranged TRG alleles per haplotype.
Absolute copy numbers were calculated with the assumption that the DNA content in human cells is 6.6 pg/cell (27, 28). We did not correct for the additional chromosome 21 in patients with Down syndrome (relative weight contribution <2%).
The difference in CT values between the intronRSS-Kde coding and signal joints, and the TRG coding and TREC signal joints are directly related to the replication history of B cells and T cells, respectively. Taking into account the technical variation, the replication histories were calculated as follows:
and
As indicated, the formula to calculate T-cell replication corrects for the presence of 2 TRG alleles per genome vs. only 1 TREC allele per genome.
Statistics
Statistical analyses were performed using the Mann-Whitney test for comparing unpaired samples and the Spearman R test for correlation analysis as indicated in the figure legends (GraphPad Prism 8.2.0 for Mac). Correlations were compared using Fisher r to z test. A p < 0.05 was considered statistically significant.
Results
Development of a Multiplex TRG Assay to Quantify T Cells in Blood
In contrast to the intronRSS-Kde rearrangement in B cells, the δREC-ψJα rearrangement in T cells is not an end-stage rearrangement, since the coding joint is removed from the genome during subsequent Vα-Jα gene rearrangements (Figure 2A) (23). Consequently, it is not possible to use the δREC-ψJα rearrangement for T-cell quantification or to calculate T-cell proliferation in combination with TRECs. To overcome this limitation, we designed a multiplex RQ-PCR assay to amplify TRG gene rearrangements. This locus was chosen because it is rearranged in nearly all T-cell progenitors, it is both a one-step and an end-stage rearrangement (not deleted from the genome), and carries limited numbers of V and J genes (Figure 2B) (29, 30). In the design, detection of the Jγ1.2 gene was omitted as this is specifically used in TCRγδ-expressing T cells, which hardly undergo δREC-ψJα rearrangements (30).
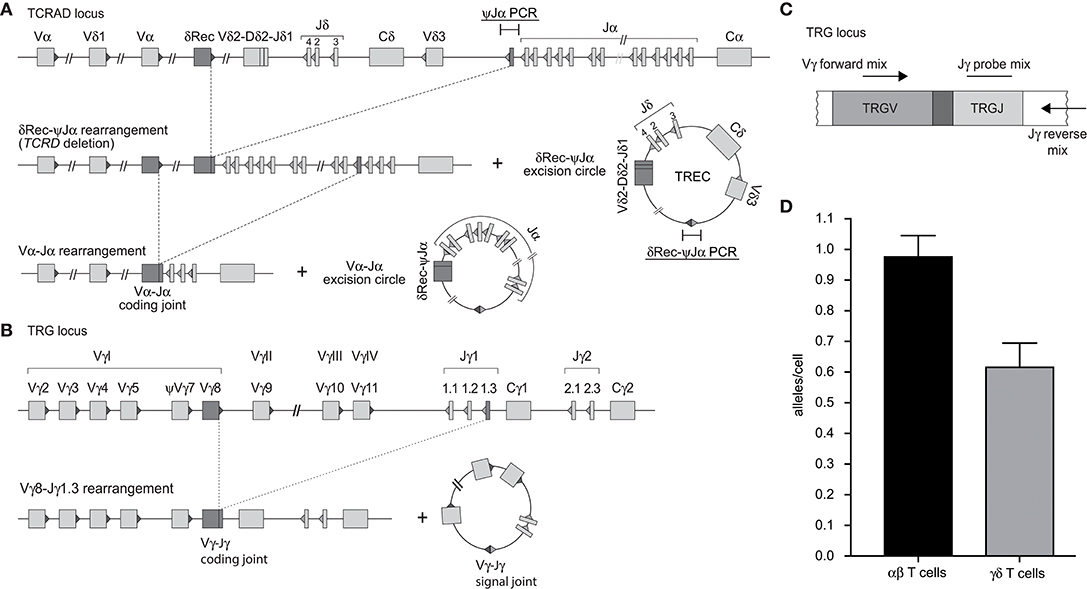
Figure 2. Development of a multiplex TRG PCR to quantify Vγ-Jγ coding joints as a marker for T cells. (A) Sequential rearrangements in the TCRAD locus. Following V(D)J recombination of TCRD, the whole locus is then deleted in the αβ+ T-cell lineage, predominantly by δREC–ψJα rearrangements. The rearrangements give rise to a δREC–ψJα signal joint on an excision circle (TREC) and a δREC–ψJα coding joint in the genome. The coding joint is deleted from the genome by TCRA (Vα-Jα) rearrangements and is then located on an excision circle as well (22, 23). (B) Rearrangements of TRG locus resulting in formation of Vγ-Jγ coding joint. (C) Schematic overview of the multiplex TGR PCR assay, which contains 4 Vγ forward primers, 2 Jγ reverse primers and 2 Jγ probes (See Table S2). (D) Mean number of rearranged TRG alleles per cell detected by multiplex TRG RQ-PCR assay in purified TCRαβ+ and TCRγδ+ T cells. The reduced detection in TCRγδ+ T cells is the result of our deliberate decision to omit detection of the frequently utilized Jγ1.2 gene in TCRγδ+ T cells.
Individual primer combinations were tested for similar efficiencies using genomic DNA from multiple T-cell lines that had rearranged distinct Vγ and Jγ genes (Table S3) (31). The final combination was tested on DNA from purified TCRαβ+ and TCRγδ+ T cells (Figures 2C,D). In line with previous observations (30), the ψJα gene was deleted in nearly all TCRαβ+ T cells, whereas it was still abundant in TCRγδ+ T cells. The new TRG assay detected 0.98 TRG gene rearrangements per TCRαβ+ T cell, whereas only 0.55 in TCRγδ+ T cells. Importantly, the TRG counts correlated significantly with absolute T-cell counts, and the intronRSS-Kde coding joints with absolute B-cell counts (Spearman r = 0.3473, p = 0.0070, and Spearman r = 0.4172, p = 0.0010, respectively; Figure S1).
Cell Line Controls for TREC Analysis
In our previous studies, we introduced an intronRSS–Kde signal joint construct into the genome of the U698-M cell line using retroviral transduction (Figure 1B) (13). As this cell line already contained one intronRSS–Kde coding joint and two albumin gene copies per genome, it could be used as technical control for the ratio of coding joints and signal joints to study B-cell proliferation, as well as the quantification of B cells in a mixture population. To enable similar technical correction for studies using TRECs, we inserted a ψJα-δREC signal joint construct in the HSB-2 cell line that contains a ψJα-δREC coding joint as well as two Vγ-Jγ coding joints that were amplified by the TRG assay (Figures 1C, 2).
T-Cell Replication in Healthy Controls
Having established the TRG assay and HSB-2 TREC control cell line, these were utilized to examine the replication histories of naive and memory/effector CD4+ and CD8+ T-cell subsets obtained from healthy controls (Figure 3A). Within CD4+ T cells, the CD31+ recent thymic emigrants (RTE) had undergone a median of 4.7 cell divisions and naive cells showed 6.5 cell divisions (Figure 3B). The antigen-experienced central memory (Tcm) and TemRO T cells, had increased levels, up to 10.8 and 9.5 cell divisions, respectively.
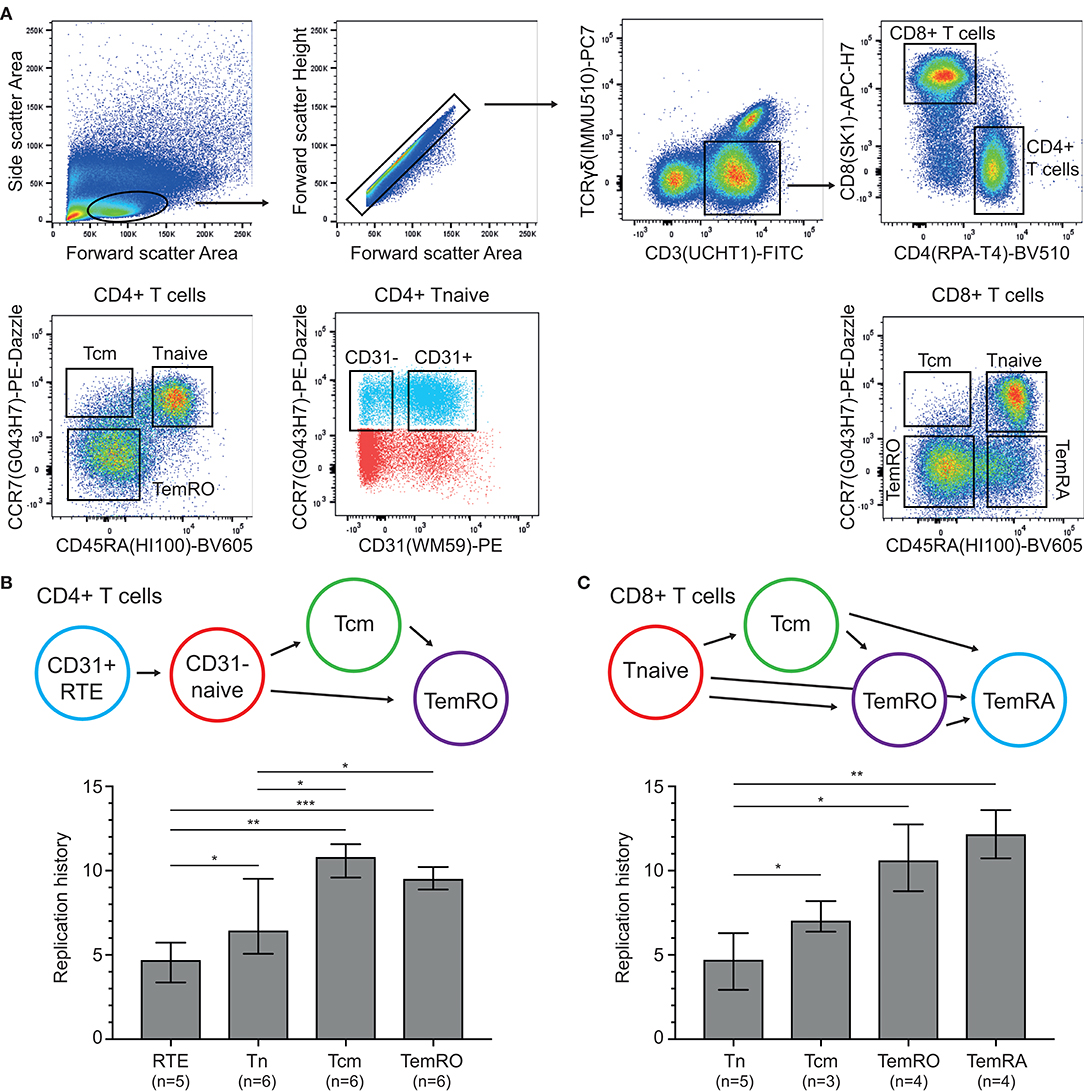
Figure 3. Replication histories of T-cell subsets in healthy controls. (A) Flow cytometric representation of T-cell differentiation stages. T-cell subsets were sort-purified based on the indicated gating strategy. (B,C) Schematic representation of CD4+ and CD8+ T-cell maturation and replication histories of the purified subsets. RTE, recent thymic emigrants; Tcm, central memory T cell; Tnaive, naive T cell; TemRO and TemRA, terminally differentiated effector memory T cell. The Mann-Whitney U test was used for statistical analysis: *p < 0.05; **p < 0.01; ***p < 0.001.
Naive CD8+ T cells showed a similar replication history as CD31+CD4+ naive T cells with 4.7 cell divisions (Figure 3C). These levels were significantly higher in Tcm cells with 7.1 cell divisions, and even more in the CCR7- TemRO and TemRA subsets with 10.6 and 12.2 cell divisions, respectively. Thus, in line with B-cell biology (13), the replication history of antigen-experienced T cells is significantly higher than in naive T-cell subsets.
Contributions of Proliferation to Age-Associated Decline in TRECs
We examined TREC, TRG as well as the intronRSS-Kde and KREC assays in a cohort of 59 healthy controls (median age 31 years, range 20–63; Figure 4). Similar to Zubakov et al. (32), we found a significant decline in TRECs with age (r = −0.3552, p = 0.0058). The TRG copy numbers of controls increase with age (r = 0.2621, p = 0.0449), resulting in a significant increase of cell divisions with age (r = 0.5574, p < 0.0001).
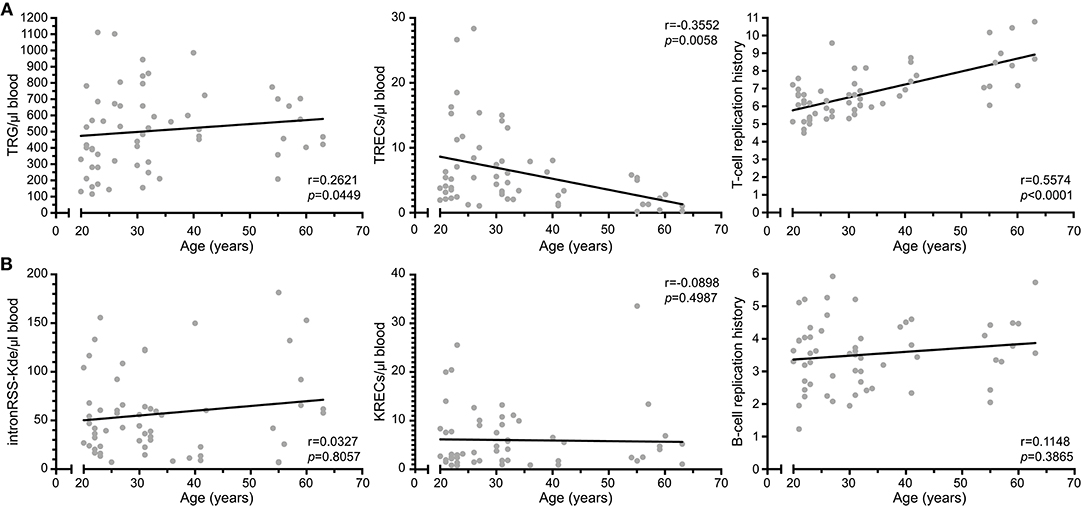
Figure 4. T-cell replication history increases with age. (A) Correlation plots of TRG, TRECs and T-cell replication histories as determined from whole blood vs. age of the donor. (B) Correlation plots of intronRSS-Kde, KREC and B-cell replication history. Data were obtained from 59 healthy controls. Spearman r was used for statistical analysis.
The copy numbers of intronRSS-Kde, KRECs and B-cell replication history were not significantly correlated with age (Figure 4B). Thus, B-cell homeostasis changes minimally with aging, whereas the decline in TRECs with aging for the most part is the result of an increased T-cell replication history.
Assessment of T-Cell Replication in Predominantly Antibody Deficiency
Quantification of TRECs and KRECs has been utilized before to subclassify patients with an antibody deficiency syndrome (33). As no coding joint assays were performed, it remains unclear what the contribution was of proliferation to the findings of abnormally low TRECs and KRECs. Therefore, we here applied our assays to 9 patients with genetically confirmed XLA and 42 patients with PAD (Table 1), who were subdivided in two phenotypical categories: infections-only (n = 14) and non-infectious complications (n = 28) (5, 6).
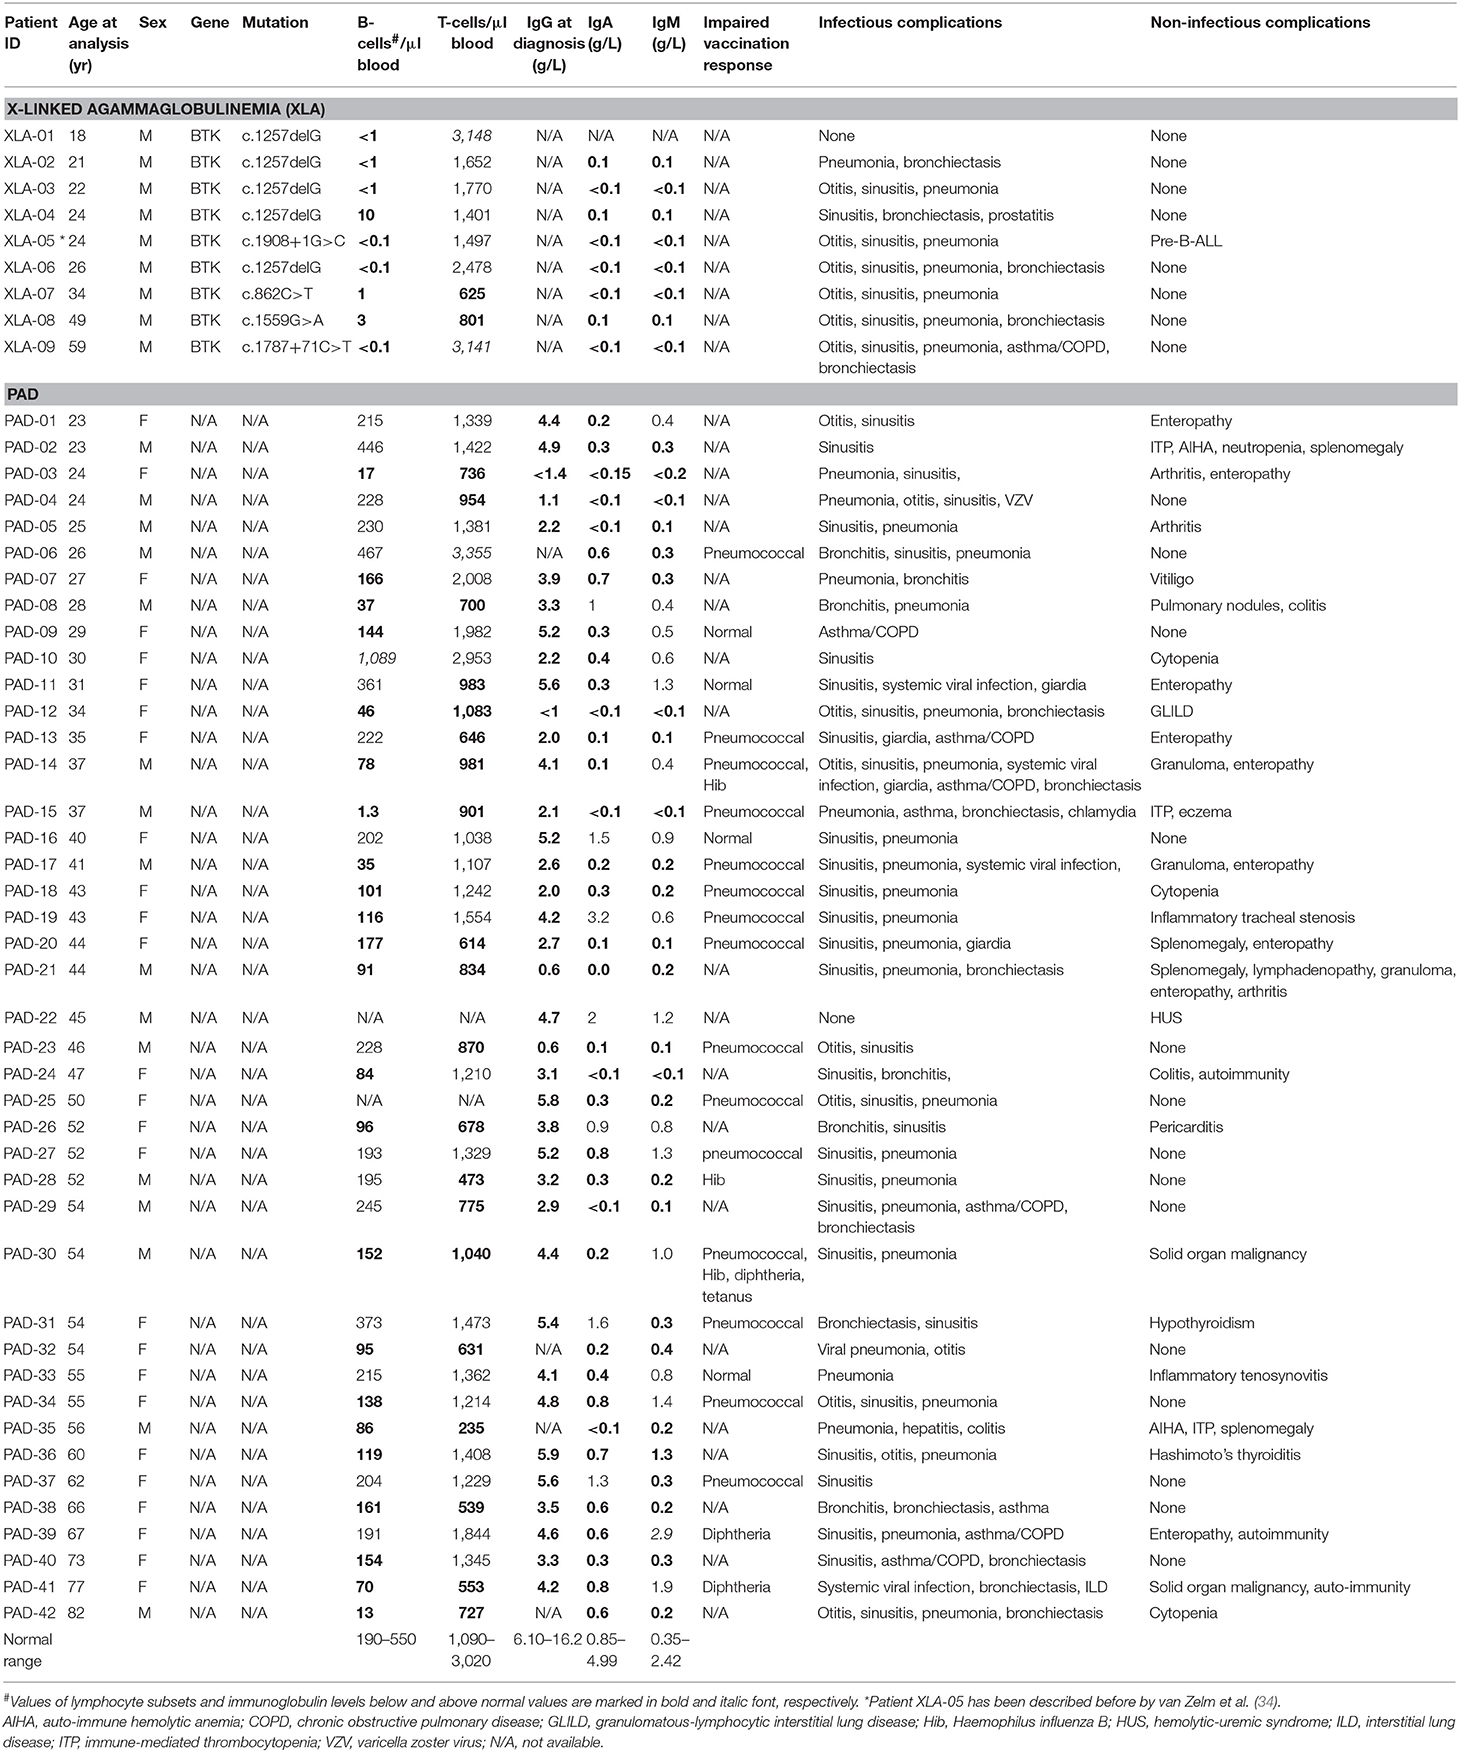
Table 1. Immunological and clinical characteristics of adults with inborn errors of immunity.
IntronRSS-Kde and KREC copy numbers in patients with XLA were low or undetectable. The B-cell replication history could therefore only be calculated in 3 patients, which was decreased in one patient (0.3 cell divisions) and normal in the remaining two patients (2.8 and 3.1 cell divisions; Figure 5A). Of note, the absolute B-cell counts in these three patients were <1, <1, and 3 per microliter blood. Patients with PAD had normal copy numbers of intronRSS-Kde and lower numbers of KRECs (p = 0.0085). Also, their B-cell replication history was higher than in controls (median 4.063 vs. 3.550, p = 0.0268). Subsequently, we focused on patients with non-infectious complications and found lower KREC copy numbers as compared to patients with the infections-only phenotype (p = 0.0453). Compared to aging in healthy controls, patients with PAD show similar age-related correlations to T- and B-cell replication (Figure S2).
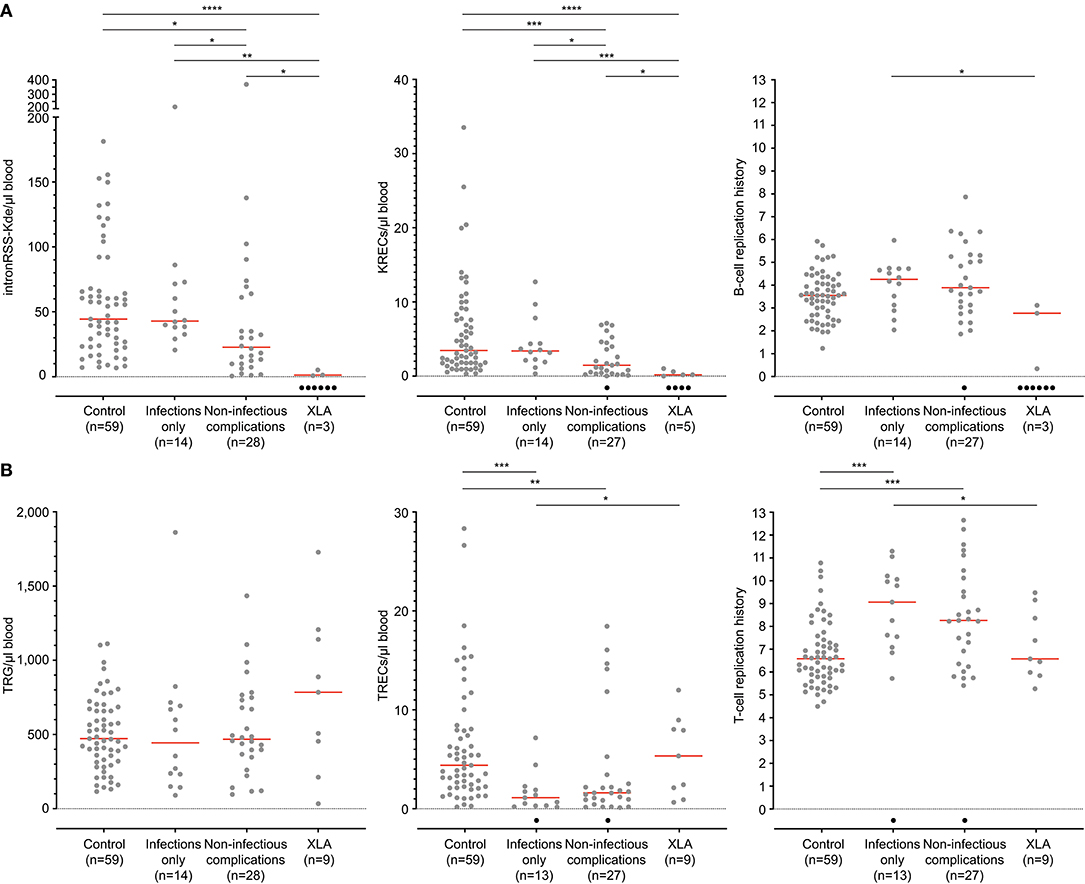
Figure 5. B-cell and T-cell replication histories in PAD patients. (A) intronRSS-Kde, KRECs and B-cell replication histories, and (B) TRG, TRECs and T-cell replication history for healthy controls and patients with XLA (n = 9) and PAD (CVID and hypogammaglobinemia) with infections only (n = 14) and non-infectious complications (n = 28) as determined from whole blood. Obtained values are shown in gray and undetectable values are shown in black; numbers indicated represent detectable values, and only they were included for statistical analysis with the Mann-Whitney U-test: *p < 0.05; **p < 0.01; ***p < 0.001; ****p < 0.0001.
The studies of the T-cell compartment in patients with XLA showed normal TRG and TREC copy numbers, as well normal replication history (Figure 5B). For patients with PAD, normal TRG copy numbers, but decreased TREC counts and increased T-cell replication history were found as compared to controls (both p < 0.0001). There were no differences between patients with and without non-infectious complications.
B- and T-Cell Replication in Dried Blood Spots of Children With Down Syndrome
Newborn screening for T-cell and B-cell lymphopenia is highly sensitive but has a poor specificity (35). Unfortunately, it is currently not possible to determine which patients should be referred urgently and for which patients a repeat screening test should be requested. Quantification of intronRSS-Kde and TRG copy numbers and calculation of the B- and T-cell replication history could potentially be part of second-tier testing in newborns with abnormal screening results to facilitate a risk assessment. In a previous study we showed that newborns with Down syndrome have lower numbers of KRECs and TRECs than healthy controls (24), which we replicated here (Figures 6A,B). Since DNA recovery from stored Guthrie cards is less predictable, we corrected our results for DNA input by including a control PCR targeting the albumin gene.
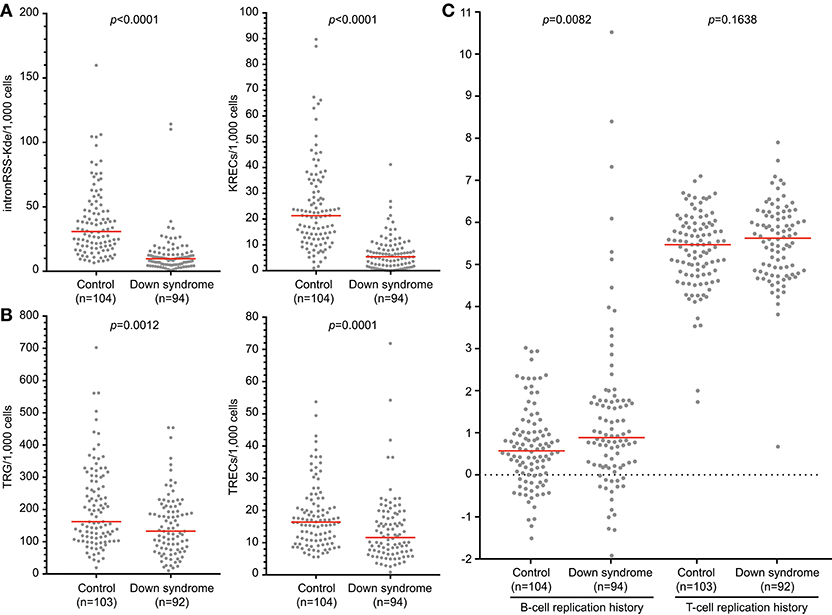
Figure 6. B-cell and T-cell replication histories in neonates with Down syndrome. IntronRSS-Kde and KREC (A), and TRG and TREC (B) in healthy neonates and children with Down syndrome, corrected for DNA input as determined from Guthrie cards. (C) B- and T-cell replication histories for healthy neonates and children with Down syndrome. The Mann-Whitney U-test was used for statistical analysis.
Children with Down syndrome have reduced intronRSS-Kde and TRG copy numbers compared to healthy newborns, which is consistent with previous studies showing decreased absolute B- and T-cell counts (Figures 6A,B) (36, 37). Subsequently, we calculated the replication histories. In healthy newborns, B cells have undergone a limited number of cell divisions (median 0.57) and T cells show ~5 cell divisions, which is consistent with results from naive B- and T-cell subsets (Figure 6C) (13). In comparison, newborns with Down syndrome showed a slightly increased number of cell divisions in their B-cell compartment than controls (0.885 vs. 0.57, p = 0.0082, Figure 6C). This could be the result of compensatory proliferation as a result of decreased bone marrow output or increased apoptosis (20, 38). The number of cell divisions for T cells were similar between children with Down syndrome and controls.
In addition to calculation of replication histories, the intron-RSS and TRG assays could be applied as a follow-up test in newborn screening settings to confirm or refute a positive finding with the KREC and TREC assays, respectively. We calculated the sensitivity and specificity of the intronRSS-Kde and TRG assays in our cohort of children with Down syndrome, assuming the KREC and TREC assays as the Gold standard and that values below the 5th percentile of controls were abnormal. Based on abnormal KREC results (“positive test results”), the sensitivity and specificity of the intronRSS-Kde assay were 75 and 80%, and for TRG to confirm an abnormal TREC result these were 45 and 97%. If used as a second tier test, the intron-RSS-Kde assay would confirm the abnormal KREC in 75% of cases, and the TRG assay would do so in 97% of abnormal TREC cases.
Discussion
Here we demonstrate the development and application of a novel multiplex TRG RQ-PCR assay and our TREC containing T-cell line with biallelic TRG rearrangements enable the quantitative analysis of T-cell replication in normal immunobiology as well as immunodeficiency. By using this approach, we showed that naive T-cell subsets of healthy controls have undergone a limited number of cell divisions (<5) in contrast to antigen experienced effector T cells (>10). Furthermore, we showed that patients with PAD have an abnormal increase in both B- and T-cell replication history. By applying these assays on dried blood spot samples of healthy newborns, we showed that the intronRSS-Kde and TRG coding joint assays showed similar reductions in number as the TREC and KREC signal joint assays. Hence, the coding joint assays could have a role in second-tier testing after screening has identified abnormally decreased TREC and/or KREC levels.
We present a new approach for ex vivo quantification of in vivo T-cell replication histories. A variety of DNA labeling and intracellular lysine residues techniques have been used to study T-cell replication (39–41). Most previously reported approaches are limited to in vitro studies of human T-cell replication, whereas our RQ-PCR assay can be utilized to quantify the in vivo replication history. On the other hand, in vivo turnover of human T cells can be addressed by deuterium incorporation (42, 43). This has provided new insights into production and longevity of T cells. Ideally, in vivo deuterium labeling will be combined with ex vivo T-cell replication history analysis to obtain a full picture of T-cell production, longevity and replication in humans.
The TRG assay quantifies coding joints of Vγ-Jγ gene rearrangements and is therefore suitable as a means to quantify T-cell input. As δREC-ψJα coding joints are removed from the genome of developing T cells by Vα-Jα gene rearrangements, these cannot be utilized as a genomic marker (23). Previous studies have used other means to overcome this limitation of the “missing coding joint”. The most notable are those in which T cells or subsets have been FACS purified and a general genomic marker was chosen for TREC quantification (e.g., albumin, TRAC or CD3G) (9, 44, 45). Limitations for such an approach are the fact that each cell will contain 2 copies of these genomic markers, whereas δREC-ψJα gene rearrangements are found in less than half of TRA/D loci (30), with the remainder of the TRD loci being deleted by rearrangements involving other genetic elements (22). Moreover, sort-purification of T cells can restrict large-scale analysis of samples as it is labor intensive, costly and requires high cell numbers to yield sufficient material for RQ-PCR. The TRG assay being T-cell specific and detecting just under 1 allele/cell in αβT cells, i.e., very similar to the frequency of δREC-ψJα gene rearrangements. Finally, the combined use with our control cell line enables technical correction for PCR efficiencies, which is needed to accurately determine cell divisions.
As δREC-ψJα gene rearrangements are initiated relatively late during thymocyte development, TREC measurement includes the combined replication history of double positive and single positive CD4 thymocytes, as well as homeostatic proliferation in the periphery, but most likely not that of double negative thymocytes prior to TCRβ selection (30, 44, 45). With the TRG-TREC approach, we quantified the replication history of naive Th cells to be ~5 cell divisions for the CD31+ subset and ~6 for the CD31- subset. This is in line with the ~6 cell divisions for naive CD4+ T cells from young adults previously reported (44). In addition, it confirms earlier observations that the CD31+ subset is more enriched for TRECs and is likely enriched for RTEs (46, 47).
The replication histories of naive CD8+ and CD4+ T cells were very similar. In contrast, CD8+ Tcm had a much lower average replication history than CD4+ Tcm. Hence, despite their phenotypic similarity, this indicates that different processes underlie their generation, i.e., with distinct levels of proliferation. Alternatively, the CD8+ Tcm subset could be a mixture of memory cells with more naive T cells that have not undergone antigen-induced proliferation.
With normal aging, the total T-cell compartment remains stable in size while naive subsets decrease and effector populations increase (48, 49). This is reflected by stable TRG copy numbers throughout life and decreasing TRECs with higher age (32). As a result, the overall T-cell replication history increases with age.
In our study, we have focused on immunodeficiencies that are characterized by impaired antibody formation. Patients with XLA have strongly decreased or undetectable intronRSS-Kde copy numbers as well as KRECs. We calculated normal B-cell replication histories for 2 out of 3 patients, which is in line with previous findings (50). Normal T-cell replication history was found in patients with XLA. This is consistent with the fact that the BTK protein is normally not expressed in T cells of healthy controls, and T-cell biology does not appear to be affected (51).
Patients with PAD are heterogeneous with regards to their clinical presentations as well as immunologic investigations. These conditions are classically thought to be primarily caused by defective B-cell function. Nonetheless, a significant portion of patients are found to have T-cell abnormalities, especially showing decreased naive T-cell subsets (6, 52, 53). A study from Kamae et al. showed that patients with CVID who have decreased TRECs and KRECs are more likely to develop disease related complications (i.e., infections, autoimmune diseases and malignancies), warranting to consider a diagnosis of combined immunodeficiency (CID) (33). Here, we have shown alterations in the T-cell compartment of patients with PAD that confirm that not only B-cell immunity is affected. Currently, our methods do not allow for classification of patients with PAD in order to identify an underlying (genetic) cause or help to assess the risk for developing non-infectious complications. However, studying the replication history in sorted T-cell subsets might give more insight in the pathways that are affected in patients with PAD and allow for new classification strategies that will assist in clinical management of these patients. As the T-cell abnormalities were not found in XLA patients, it is suggestive that in at least a subset of PAD patients T-cell replication is affected intrinsically, or as a result of additional inflammatory effects not present in XLA patients.
We also demonstrated the potential to quantify the replication history of T-cell subsets. In future studies, this could provide new insights into Th-cell function. For example, Th17 cells which have an important role in the etiology of a variety of inflammatory conditions, including rheumatoid arthritis and inflammatory bowel disease (54, 55). Furthermore, the effects of immunosuppressive treatment could be studied to determine whether normal states can be achieved and serve as a disease monitoring feature. It should be noted that the calculation of T-cell replication will be limited in several disease settings. In cases of severe T-cell lymphopenia, the TREC and/or TRG potentially will not generate a signal, similar to what we observed for the KREC and intronRSS-Kde assays in our patients with XLA. Furthermore, in extreme T-cell lymphoproliferations, TRECs might be extremely diluted and unable to be detected with the TREC assay. This will be especially true in case of monoclonal proliferations, but potentially also in extreme polyclonal proliferations, in parallel to the dilution of KRECs in persistent polyclonal B-cell lymphocytosis (PPBL) (56).
Although newborn screening for T-cell and B-cell lymphopenia is highly effective, at least 80% of newborns with a positive test (reduced TRECs and/or KRECs) turn out to be “false positives” and do not have SCID or XLA. Currently, all abnormal results require drawing of a second blood sample for immunophenotyping. Ideally, a large number of false positives are identified using a second-tier DNA-based test. For example, 22q11 microdeletion syndromes and Down syndrome can be identified in a reliable manner via dried blood spot samples (24, 57). We were able to establish that our intronRSS-Kde and TRG assays generate reliable results on dried blood spot samples. These assays could be applied to samples from children with abnormal TREC and/or KREC screening results, prior to alarming their parents to request a second sample for additional testing.
We here described the development of a novel combined TRG coding joint RQ-PCR and δREC ψJα signal joint RQ-PCR assay with a TREC control cell line, which together allow reliable quantification of in vivo T-cell replication history. Our approach has led to new insights in normal T-cell biology, aging and immunodeficiency. Moreover, the high specificity of the TRG and intronRSS-Kde assays to confirm an abnormal TREC and KREC finding in neonates with Down syndrome shows a promise for application of these assays as second tier test in newborn screening. Still, extensive evaluation on large cohorts of neonates with genetically-confirmed SCID or XLA will be required to evaluate if application of these assays could reduce the number of cases in which a second blood sample for verification of abnormal results is required.
Data Availability
The datasets generated for this study are available on request to the corresponding author.
Author Contributions
MvZ and JvD conceptualized the study and designed experiments. RV, PA, EW, SD, and SB performed experiments. RV and MvZ analyzed and interpreted all data and wrote the manuscript. JB, PC, RS, and EdV established the patient sample collection protocols and included patients into the study. All authors commented on manuscript drafts and approved the final version.
Funding
This work was supported by The Jeffrey Modell Foundation, and an NHMRC Senior Research Fellowship to MvZ (GNT1117687).
Conflict of Interest Statement
The authors declare that the research was conducted in the absence of any commercial or financial relationships that could be construed as a potential conflict of interest.
Acknowledgments
We would like to thank the parents and patients for their contribution to this study, as well as Drs. L. A. Bok, P. H. Th. van Zwieten, W. E. A. Bolz, F. Dikken, W. Rijnvos, E. van Leer, and A. M. van Wermeskerken for pediatric consultancy, Ms. I. Pico-Knijnenburg for technical support, Ms. E Orlowski-Oliver from AMREPFlow for cell sorting, and the Dutch National Institute for Public Health and the Environment (RIVM) for supplying stored Guthrie cards.
Supplementary Material
The Supplementary Material for this article can be found online at: https://www.frontiersin.org/articles/10.3389/fimmu.2019.02084/full#supplementary-material
References
1. Picard C, Bobby Gaspar H, Al-Herz W, Bousfiha A, Casanova JL, Chatila T, et al. International Union of Immunological Societies: 2017 primary immunodeficiency diseases committee report on inborn errors of immunity. J Clin Immunol. (2018) 38:96–128. doi: 10.1007/s10875-017-0464-9
2. Cirillo E, Giardino G, Gallo V, D'Assante R, Grasso F, Romano R, et al. Severe combined immunodeficiency–an update. Ann N Y Acad Sci. (2015) 1356:90–106. doi: 10.1111/nyas.12849
3. Modell V, Orange JS, Quinn J, Modell F. Global report on primary immunodeficiencies: 2018 update from the Jeffrey Modell Centers Network on disease classification, regional trends, treatment modalities, and physician reported outcomes. Immunol Res. (2018) 66:367–80. doi: 10.1007/s12026-018-8996-5
4. Chapel H, Lucas M, Lee M, Bjorkander J, Webster D, Grimbacher B, et al. Common variable immunodeficiency disorders: division into distinct clinical phenotypes. Blood. (2008) 112:277–86. doi: 10.1182/blood-2007-11-124545
5. Slade CA, Bosco JJ, Binh Giang T, Kruse E, Stirling RG, Cameron PU, et al. Delayed diagnosis and complications of predominantly antibody deficiencies in a cohort of Australian adults. Front Immunol. (2018) 9:694. doi: 10.3389/fimmu.2018.00694
6. Resnick ES, Moshier EL, Godbold JH, Cunningham-Rundles C. Morbidity and mortality in common variable immune deficiency over 4 decades. Blood. (2012) 119:1650–7. doi: 10.1182/blood-2011-09-377945
7. Yamagishi H, Kunisada T, Tsuda T. Small circular DNA complexes in eucaryotic cells. Plasmid. (1982) 8:299–306. doi: 10.1016/0147-619X(82)90067-1
8. Douek DC, McFarland RD, Keiser PH, Gage EA, Massey JM, Haynes BF, et al. Changes in thymic function with age and during the treatment of HIV infection. Nature. (1998) 396:690–5. doi: 10.1038/25374
9. Hazenberg MD, Otto SA, Cohen Stuart JW, Verschuren MC, Borleffs JC, Boucher CA, et al. Increased cell division but not thymic dysfunction rapidly affects the T-cell receptor excision circle content of the naive T cell population in HIV-1 infection. Nat Med. (2000) 6:1036–42. doi: 10.1038/79549
10. Douek DC, Vescio RA, Betts MR, Brenchley JM, Hill BJ, Zhang L, et al. Assessment of thymic output in adults after haematopoietic stem-cell transplantation and prediction of T-cell reconstitution. Lancet. (2000) 355:1875–81. doi: 10.1016/S0140-6736(00)02293-5
11. Chan K, Puck JM. Development of population-based newborn screening for severe combined immunodeficiency. J Allergy Clin Immunol. (2005) 115:391–8. doi: 10.1016/j.jaci.2004.10.012
12. Routes J, Verbsky J. Newborn screening for severe combined immunodeficiency. Curr Allergy Asthma Rep. (2018) 18:34. doi: 10.1007/s11882-018-0783-9
13. van Zelm MC, Szczepanski T, van der Burg M, van Dongen JJ. Replication history of B lymphocytes reveals homeostatic proliferation and extensive antigen-induced B cell expansion. J Exp Med. (2007) 204:645–55. doi: 10.1084/jem.20060964
14. Borte S, von Dobeln U, Fasth A, Wang N, Janzi M, Winiarski J, et al. Neonatal screening for severe primary immunodeficiency diseases using high-throughput triplex real-time PCR. Blood. (2012) 119:2552–5. doi: 10.1182/blood-2011-08-371021
15. King JR, Hammarstrom L. Newborn screening for primary immunodeficiency diseases: history, current and future practice. J Clin Immunol. (2018) 38:56–66. doi: 10.1007/s10875-017-0455-x
16. Siminovitch KA, Bakhshi A, Goldman P, Korsmeyer SJ. A uniform deleting element mediates the loss of kappa genes in human B cells. Nature. (1985) 316:260–2. doi: 10.1038/316260a0
17. Inlay M, Alt FW, Baltimore D, Xu Y. Essential roles of the kappa light chain intronic enhancer and 3' enhancer in kappa rearrangement and demethylation. Nat Immunol. (2002) 3:463–8. doi: 10.1038/ni790
18. Berkowska MA, Driessen GJ, Bikos V, Grosserichter-Wagener C, Stamatopoulos K, Cerutti A, et al. Human memory B cells originate from three distinct germinal center-dependent and -independent maturation pathways. Blood. (2011) 118:2150–8. doi: 10.1182/blood-2011-04-345579
19. Driessen GJ, van Zelm MC, van Hagen PM, Hartwig NG, Trip M, Warris A, et al. B-cell replication history and somatic hypermutation status identify distinct pathophysiologic backgrounds in common variable immunodeficiency. Blood. (2011) 118:6814–23. doi: 10.1182/blood-2011-06-361881
20. Verstegen RHJ, Driessen GJ, Bartol SJW, van Noesel CJM, Boon L, van der Burg M, et al. Defective B-cell memory in patients with Down syndrome. J Allergy Clin Immunol. (2014) 134:1346–53.e9. doi: 10.1016/j.jaci.2014.07.015
21. van Dongen JJ, Wolvers-Tettero IL. Analysis of immunoglobulin and T cell receptor genes. Part II: Possibilities and limitations in the diagnosis and management of lymphoproliferative diseases and related disorders. Clin Chim Acta. (1991) 198:93–174. doi: 10.1016/0009-8981(91)90247-A
22. Verschuren MC, Wolvers-Tettero IL, Breit TM, Noordzij J, van Wering ER, van Dongen JJ. Preferential rearrangements of the T cell receptor-delta-deleting elements in human T cells. J Immunol. (1997) 158:1208–16.
23. Hazenberg MD, Verschuren MC, Hamann D, Miedema F, van Dongen JJ. T cell receptor excision circles as markers for recent thymic emigrants: basic aspects, technical approach, and guidelines for interpretation. J Mol Med. (2001) 79:631–40. doi: 10.1007/s001090100271
24. Verstegen RH, Borte S, Bok LA, van Zwieten PH, von Dobeln U, Hammarstrom L, et al. Impact of Down syndrome on the performance of neonatal screening assays for severe primary immunodeficiency diseases. J Allergy Clin Immunol. (2014) 133:1208–11. doi: 10.1016/j.jaci.2013.10.010
25. Nilsson K, Sundstrom C. Establishment and characteristics of two unique cell lines from patients with lymphosarcoma. Int J Cancer. (1974) 13:808–23. doi: 10.1002/ijc.2910130609
26. Adams RA, Flowers A, Davis BJ. Direct implantation and serial transplantation of human acute lymphoblastic leukemia in hamsters, SB-2. Cancer Res. (1968) 28:1121–5.
27. Morton NE. Parameters of the human genome. Proc Natl Acad Sci USA. (1991) 88:7474–6. doi: 10.1073/pnas.88.17.7474
28. Serth J, Kuczyk MA, Paeslack U, Lichtinghagen R, Jonas U. Quantitation of DNA extracted after micropreparation of cells from frozen and formalin-fixed tissue sections. Am J Pathol. (2000) 156:1189–96. doi: 10.1016/S0002-9440(10)64989-9
29. van Dongen JJ, Langerak AW, Bruggemann M, Evans PA, Hummel M, Lavender FL, et al. Design and standardization of PCR primers and protocols for detection of clonal immunoglobulin and T-cell receptor gene recombinations in suspect lymphoproliferations: report of the BIOMED-2 Concerted Action BMH4-CT98-3936. Leukemia. (2003) 17:2257–317. doi: 10.1038/sj.leu.2403202
30. Dik WA, Pike-Overzet K, Weerkamp F, de Ridder D, de Haas EF, Baert MR, et al. New insights on human T cell development by quantitative T cell receptor gene rearrangement studies and gene expression profiling. J Exp Med. (2005) 201:1715–23. doi: 10.1084/jem.20042524
31. Sandberg Y, Verhaaf B, van Gastel-Mol EJ, Wolvers-Tettero IL, de Vos J, Macleod RA, et al. Human T-cell lines with well-defined T-cell receptor gene rearrangements as controls for the BIOMED-2 multiplex polymerase chain reaction tubes. Leukemia. (2007) 21:230–7. doi: 10.1038/sj.leu.2404486
32. Zubakov D, Liu F, van Zelm MC, Vermeulen J, Oostra BA, van Duijn CM, et al. Estimating human age from T-cell DNA rearrangements. Curr Biol. (2010) 20:R970–1. doi: 10.1016/j.cub.2010.10.022
33. Kamae C, Nakagawa N, Sato H, Honma K, Mitsuiki N, Ohara O, et al. Common variable immunodeficiency classification by quantifying T-cell receptor and immunoglobulin kappa-deleting recombination excision circles. J Allergy Clin Immunol. (2013) 131:1437–40.e1435. doi: 10.1016/j.jaci.2012.10.059
34. van Zelm MC, Pumar M, Shuttleworth P, Aui PM, Smart JM, Grigg A, et al. Functional antibody responses following allogeneic stem cell transplantation for TP53 mutant pre-B-ALL in a patient with X-linked agammaglobulinemia. Front Immunol. (2019) 10:895. doi: 10.3389/fimmu.2019.00895
35. Kwan A, Abraham RS, Currier R, Brower A, Andruszewski K, Abbott JK, et al. Newborn screening for severe combined immunodeficiency in 11 screening programs in the United States. JAMA. (2014) 312:729–38. doi: 10.1001/jama.2014.9132
36. Kusters MA, Gemen EF, Verstegen RH, Wever PC, DE Vries E. Both normal memory counts and decreased naive cells favor intrinsic defect over early senescence of Down syndrome T lymphocytes. Pediatr Res. (2010) 67:557–62. doi: 10.1203/PDR.0b013e3181d4eca3
37. Verstegen RH, Kusters MA, Gemen EF, DE Vries E. Down syndrome B-lymphocyte subpopulations, intrinsic defect or decreased T-lymphocyte help. Pediatr Res. (2010) 67:563–9. doi: 10.1203/PDR.0b013e3181d4ecc1
38. Gemen EF, Verstegen RH, Leuvenink J, de Vries E. Increased circulating apoptotic lymphocytes in children with Down syndrome. Pediatr Blood Cancer. (2012) 59:1310–2. doi: 10.1002/pbc.24246
39. Hellerstein MK. Measurement of T-cell kinetics: recent methodologic advances. Immunol Today. (1999) 20:438–41. doi: 10.1016/S0167-5699(99)01529-7
40. Sun X, Zhang C, Jin H, Sun G, Tian Y, Shi W, et al. Flow cytometric analysis of T lymphocyte proliferation in vivo by EdU incorporation. Int Immunopharmacol. (2016) 41:56–65. doi: 10.1016/j.intimp.2016.10.019
41. Quah BJ, Parish CR. The use of carboxyfluorescein diacetate succinimidyl ester (CFSE) to monitor lymphocyte proliferation. J Visual Exp. (2010) 44:2259. doi: 10.3791/2259
42. Baliu-Pique M, Verheij MW, Drylewicz J, Ravesloot L, de Boer RJ, Koets A, et al. Short lifespans of memory T-cells in bone marrow, blood, and lymph nodes suggest that T-cell memory is maintained by continuous self-renewal of recirculating cells. Front Immunol. (2018) 9:2054. doi: 10.3389/fimmu.2018.02054
43. Borghans JAM, Tesselaar K, de Boer RJ. Current best estimates for the average lifespans of mouse and human leukocytes: reviewing two decades of deuterium-labeling experiments. Immunol Rev. (2018) 285:233–48. doi: 10.1111/imr.12693
44. van der Weerd K, Dik WA, Schrijver B, Bogers AJ, Maat AP, van Nederveen FH, et al. Combined TCRG and TCRA TREC analysis reveals increased peripheral T-lymphocyte but constant intra-thymic proliferative history upon ageing. Mol Immunol. (2013) 53:302–12. doi: 10.1016/j.molimm.2012.08.019
45. Dion ML, Poulin JF, Bordi R, Sylvestre M, Corsini R, Kettaf N, et al. HIV infection rapidly induces and maintains a substantial suppression of thymocyte proliferation. Immunity. (2004) 21:757–68. doi: 10.1016/j.immuni.2004.10.013
46. Kimmig S, Przybylski GK, Schmidt CA, Laurisch K, Mowes B, Radbruch A, et al. Two subsets of naive T helper cells with distinct T cell receptor excision circle content in human adult peripheral blood. J Exp Med. (2002) 195:789–94. doi: 10.1084/jem.20011756
47. Haines CJ, Giffon TD, Lu LS, Lu X, Tessier-Lavigne M, Ross DT, et al. Human CD4+ T cell recent thymic emigrants are identified by protein tyrosine kinase 7 and have reduced immune function. J Exp Med. (2009) 206:275–85. doi: 10.1084/jem.20080996
48. Miller RA. The aging immune system: primer and prospectus. Science. (1996) 273:70–4. doi: 10.1126/science.273.5271.70
49. Sprent J, Tough DF. Lymphocyte life-span and memory. Science. (1994) 265:1395–400. doi: 10.1126/science.8073282
50. Nonoyama S, Tsukada S, Yamadori T, Miyawaki T, Jin YZ, Watanabe C, et al. Functional analysis of peripheral blood B cells in patients with X-linked agammaglobulinemia. J Immunol. (1998) 161:3925–9.
51. Smith CI, Baskin B, Humire-Greiff P, Zhou JN, Olsson PG, Maniar HS, et al. Expression of Bruton's agammaglobulinemia tyrosine kinase gene, BTK, is selectively down-regulated in T lymphocytes and plasma cells. J Immunol. (1994) 152:557–65.
52. Moratto D, Gulino AV, Fontana S, Mori L, Pirovano S, Soresina A, et al. Combined decrease of defined B and T cell subsets in a group of common variable immunodeficiency patients. Clin Immunol. (2006) 121:203–14. doi: 10.1016/j.clim.2006.07.003
53. Bateman EA, Ayers L, Sadler R, Lucas M, Roberts C, Woods A, et al. T cell phenotypes in patients with common variable immunodeficiency disorders: associations with clinical phenotypes in comparison with other groups with recurrent infections. Clin Exp Immunol. (2012) 170:202–11. doi: 10.1111/j.1365-2249.2012.04643.x
54. Abraham C, Dulai PS, Vermeire S, Sandborn WJ. Lessons learned from trials targeting cytokine pathways in patients with inflammatory bowel diseases. Gastroenterology. (2017) 152:374–88.e374. doi: 10.1053/j.gastro.2016.10.018
55. Lubberts E. The IL-23-IL-17 axis in inflammatory arthritis. Nat Rev Rheumatol. (2015) 11:415–29. doi: 10.1038/nrrheum.2015.53
56. Berkowska MA, Grosserichter-Wagener C, Adriaansen HJ, de Ridder D, Mirani-Oostdijk KP, Agteresch HJ, et al. Persistent polyclonal B-cell lymphocytosis: extensively proliferated CD27+IgM+IgD+ memory B cells with a distinctive immunophenotype. Leukemia. (2014) 28:1560–4. doi: 10.1038/leu.2014.77
Keywords: T-cell replication, TREC, TRG, primary immunodeficiency, newborn screening, aging
Citation: Verstegen RHJ, Aui PM, Watson E, De Jong S, Bartol SJW, Bosco JJ, Cameron PU, Stirling RG, de Vries E, van Dongen JJM and van Zelm MC (2019) Quantification of T-Cell and B-Cell Replication History in Aging, Immunodeficiency, and Newborn Screening. Front. Immunol. 10:2084. doi: 10.3389/fimmu.2019.02084
Received: 14 June 2019; Accepted: 19 August 2019;
Published: 29 August 2019.
Edited by:
Antonio Condino-Neto, University of São Paulo, BrazilReviewed by:
Shigeaki Nonoyama, National Defense Medical College, JapanRoshini Sarah Abraham, Nationwide Children's Hospital, United States
Copyright © 2019 Verstegen, Aui, Watson, De Jong, Bartol, Bosco, Cameron, Stirling, de Vries, van Dongen and van Zelm. This is an open-access article distributed under the terms of the Creative Commons Attribution License (CC BY). The use, distribution or reproduction in other forums is permitted, provided the original author(s) and the copyright owner(s) are credited and that the original publication in this journal is cited, in accordance with accepted academic practice. No use, distribution or reproduction is permitted which does not comply with these terms.
*Correspondence: Menno C. van Zelm, menno.vanzelm@monash.edu