 Petra Zimmermann1,2
 Nicole Ritz3,4*
 Kirsten P. Perrett2,4,5
 Nicole L. Messina2,4Fiona R. M. van der Klis6
 Nigel Curtis2,4,5
- 1Faculty of Science and Medicine, University of Fribourg, Fribourg, Switzerland
- 2Murdoch Children’s Research Institute, Parkville, VIC, Australia
- 3University of Basel, Basel, Switzerland
- 4The University of Melbourne, Parkville, VIC, Australia
- 5Royal Children’s Hospital Melbourne, Parkville, VIC, Australia
- 6National Institute for Public Health and the Environment, Bilthoven, Netherlands
Introduction: The humoral response to vaccinations varies widely between individuals. There is no data available on the correlation between responses to different vaccines. In this study, we investigated the correlation of antibody responses between routine vaccine antigens in infants.
Methods: One and seven months after the 6-month vaccinations and one month after the 12-month vaccinations, antibody concentrations to diphtheria, tetanus, pertussis, polio (serotypes 1-3), Haemophilus influenzae type b (Hib), pneumococcus (13 serotypes), meningococcus C, measles, mumps and rubella were measured using fluorescent bead-based multiplex immune-assays. For the correlation of antibody responses, Spearman’s rank correlation coefficients (ρ) with 95% confidence intervals (CI) were calculated between responses to each vaccine antigen.
Results: The correlation between concentrations of antibodies to the vaccinations ending at 6 months of age was higher one month compared to seven months after vaccination. The strongest correlations at both time points were observed between antibody responses to different polio serotypes, certain pneumococcal serotypes and between responses to diphtheria and pneumococcal (conjugated to a diphtheria toxoid) vaccine antigens. Correlation between responses to tetanus, Hib, pertussis, polio and other vaccine antigens were weak. The correlation between antibody responses to the 12-month vaccine antigens was weaker than to the 6-month vaccine antigens and there was a negative correlation between responses to measles, mumps, rubella vaccine and non-live vaccine antigens (meningococcus C, tetanus and Hib). There was only weak correlation between antibody responses to vaccines of the same type (e.g. conjugated polysaccharide or toxoid vaccines).
Conclusion: Correlation between antibody responses to similar antigens in the same vaccine (such as different serotypes of a bacteria or virus), as well as responses to antigens conjugated to similar carrier proteins, are strong. In contrast, correlation between responses to other vaccines are weak. Measuring antibody responses to one or a few vaccine antigens therefore does not offer a reliable surrogate marker of responses to unrelated vaccines.
Introduction
There are many different methods to quantify the immune response to vaccines, including measuring innate, humoral, cellular and cytokine responses. However, the most frequently used is the measurement of antibody concentrations. There is a wide variation between individuals in antibody responses induced by the same vaccine, and numerous intrinsic (including age, sex and genetics), external (including geographic location, family size and toxins) and behavioural (including nutrition, exercise, smoking and alcohol consumption) factors influence vaccine responses (1). The magnitude of response is also influenced by the type of vaccine. For example, live attenuated vaccines induce strong antibody responses, similar to infection with a wild-type pathogen, leading to induction of memory cells and often life-long protection. In contrast, inactivated, subunit or toxoid vaccines induce lower responses, requiring booster doses. The response to different subunit vaccines also varies: polysaccharide-protein conjugated vaccines have superior immunogenicity (including the induction of long-term protection) compared with polysaccharide vaccines which only induce short-lived T cell-independent antibody responses (2).
Currently, it is unknown whether there is a correlation between antibody responses to different vaccines. It is also unknown whether there is any consistency within individuals in the magnitude of antibody responses to all vaccines or to vaccines of a certain type (e.g. subunit, live or attenuated vaccines). In clinical practice, e.g. when investigating for primary immunodeficiency, measuring antibody responses to diphtheria, tetanus and pneumococcal vaccine antigens is common practice (3). When the vaccination status of an individual is unknown, the antibody response to tetanus is often used as a surrogate marker (4). However, there is no data available to show that the antibody response to one vaccine correlates with responses to other vaccines.
In this study, we investigated the correlation of antibody responses between routine vaccine antigens in infants.
Methods
Participants and Antibody Measurement
Participants were a subset of infants from a randomized controlled trial (The Melbourne Infant Study: BCG for Allergy and Infection Reduction (MIS BAIR)), which investigated whether Bacillus Calmette-Guérin vaccine (BCG) immunization given in the first 10 days of life protects against childhood infection, allergy and asthma. All infants were vaccinated according to the Australian National Immunisation Program: at birth: intramuscular hepatitis B (HepB) vaccine (H-B-Vax II Paediatric® (bioCSL)); at 6 weeks, 4 months and 6 months of age: intramuscular combined diphtheria-tetanus-acellular pertussis (DTPa), HepB, polio (IPV), and Haemophilus influenzae type b (Hib) vaccine (Infanrix® hexa (GlaxoSmithKline)), intramuscular 13-valent conjugate pneumococcal vaccine (conjugated to CRM197, a diphtheria toxoid) (PCV13) (Prevenar13® (Wyeth)), and oral rotavirus vaccine (RotaTeq® (Merck)); at 12 months of age: subcutaneous measles-mumps-rubella (MMR) vaccine (Priorix® (GlaxoSmithKline, Abbotsford, Victoria)) or M-M-R® II (Seqirus, Parkville, Victoria)) and intramuscular combined meningococcal C (MenC) and Hib vaccine (conjugated to tetanus toxoid) (Menitorix® (GlaxoSmithKline)). Vaccine records were obtained from individual immunization records and/or the Australian Immunisation Register.
From the subset of participants whose parent/guardian provided consent, blood samples were obtained in sodium-heparin tubes (S-monovette® (Sarstedt)) during study visits at 7 and 13 months of age (one month after the administration of routine scheduled immunizations). Plasma was stored at -80°C until analysis. Only participants who had blood taken 28 ± 14 days after their 6-month and 12-month routine vaccines, respectively, were included in the final analysis. Additionally, persistence of antibodies was measured 7 months after the 6-month vaccines. For this, only participants who had their blood taken between 210 ± 14 days after their 6-month vaccinations were included, and, for the responses to tetanus and Hib only, participants who had not yet received their 12-month vaccinations, as Menitorix (Hib-MenC) given at 12 months of age includes a tetanus toxoid as carrier protein.
Blood samples were analyzed at the National Institute for Health and Environment, in Bilthoven, the Netherlands. Immunoglobulin (Ig) G antibodies against 26 vaccine antigens (diphtheria, tetanus, pertussis (pertussis toxin (PT), filamentous haemagglutinin (FHA), pertactin (PRN)), polio (types 1, 2, 3), Hib, pneumococcal ((Pn) serotypes 1, 3, 4, 5, 6A, 6B, 7F, 9V, 14, 18C, 19A, 19F, 23F), MenC, measles, mumps and rubella) were measured using fluorescent bead-based multiplex immune-assays (Luminex xMAP technology) (5–10). In all assays, an international or in-house reference, controls and blanks were included on each plate. All analyses were performed with a Bio-Plex 200 in combination with Bio-Plex manager software (Bio-Rad Laboratories, Hercules, CA).
Statistical Analysis
The geometric mean concentration (GMC) for each vaccine antibody (immunoglobulin G) was calculated at one and seven months after vaccination. To investigate the correlation between antibody responses to different vaccines within the study cohort, pairwise Spearman’s rank correlation coefficients (ρ) with 95% confidence intervals (CI) were calculated between responses to each vaccine antigen. Correlations were categorized as follows: ‘very weak’ ρ = 0.00 - 0.19, ‘weak’ ρ = 0.20 - 0.39, ‘moderate’ ρ = 0.40 - 0.59, ‘strong’ ρ = 0.60 - 0.79 and ‘very strong’ ρ = 0.80 - 1.00.
Heatmaps were created to visualize the relationship between antibody responses to different vaccine antigens amongst all infants. Each individual’s response to a vaccine antigen was scaled by subtracting the mean of all responses to that vaccine antigen and dividing by the standard deviation [(individual vaccine response – mean vaccine response)/standard deviation]. A 5% significance level was used. All statistical analyses were done using R version 3.4.3.
Ethics
Informed consent was obtained from participants’ parents or guardians. The study was approved by the Royal Children’s Hospital Human Research Ethics Committee (HREC, authorization (38124A).
Results
In total, 91 participants had antibody responses to their 6-month vaccinations measured one month after vaccination and 141 participants seven months after vaccination (for Hib and tetanus, only the 34 participants who had not yet received the MenC-Hib vaccination were included at the second time point). Additionally, 148 participants had antibody responses to their 12-month vaccinations measured one month after vaccination. Thirty-three participants were included at both time points. The background characteristics of the participants are summarized in Table 1.
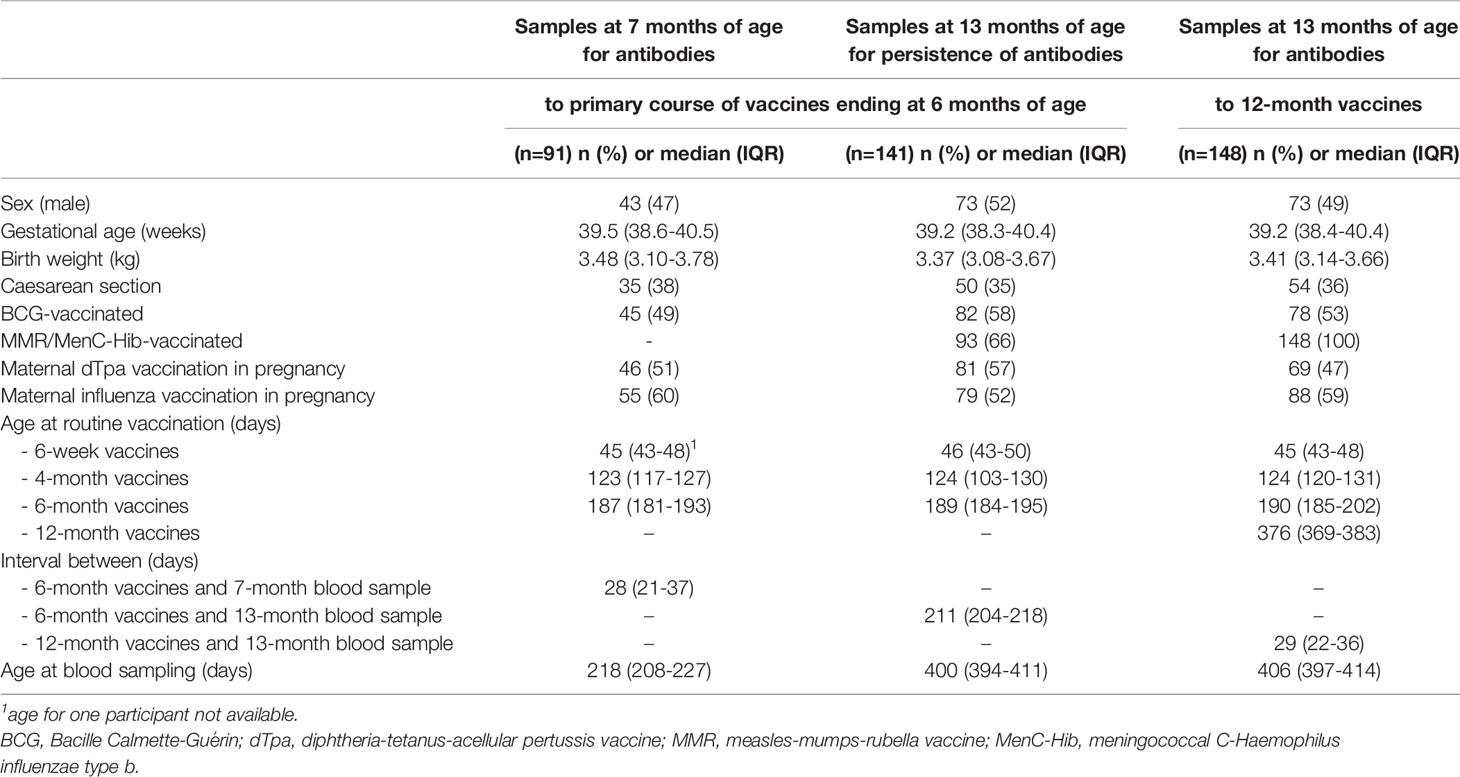
Table 1 Characteristics of study participants.
Antibody responses in individuals one and seven months after 6-month vaccinations are shown in Figures 1 and 2. Antibody responses in individuals one month after the 12-month vaccinations are shown in Figure 3. Low responders are depicted at the top of the heatmap and high responders at the bottom.
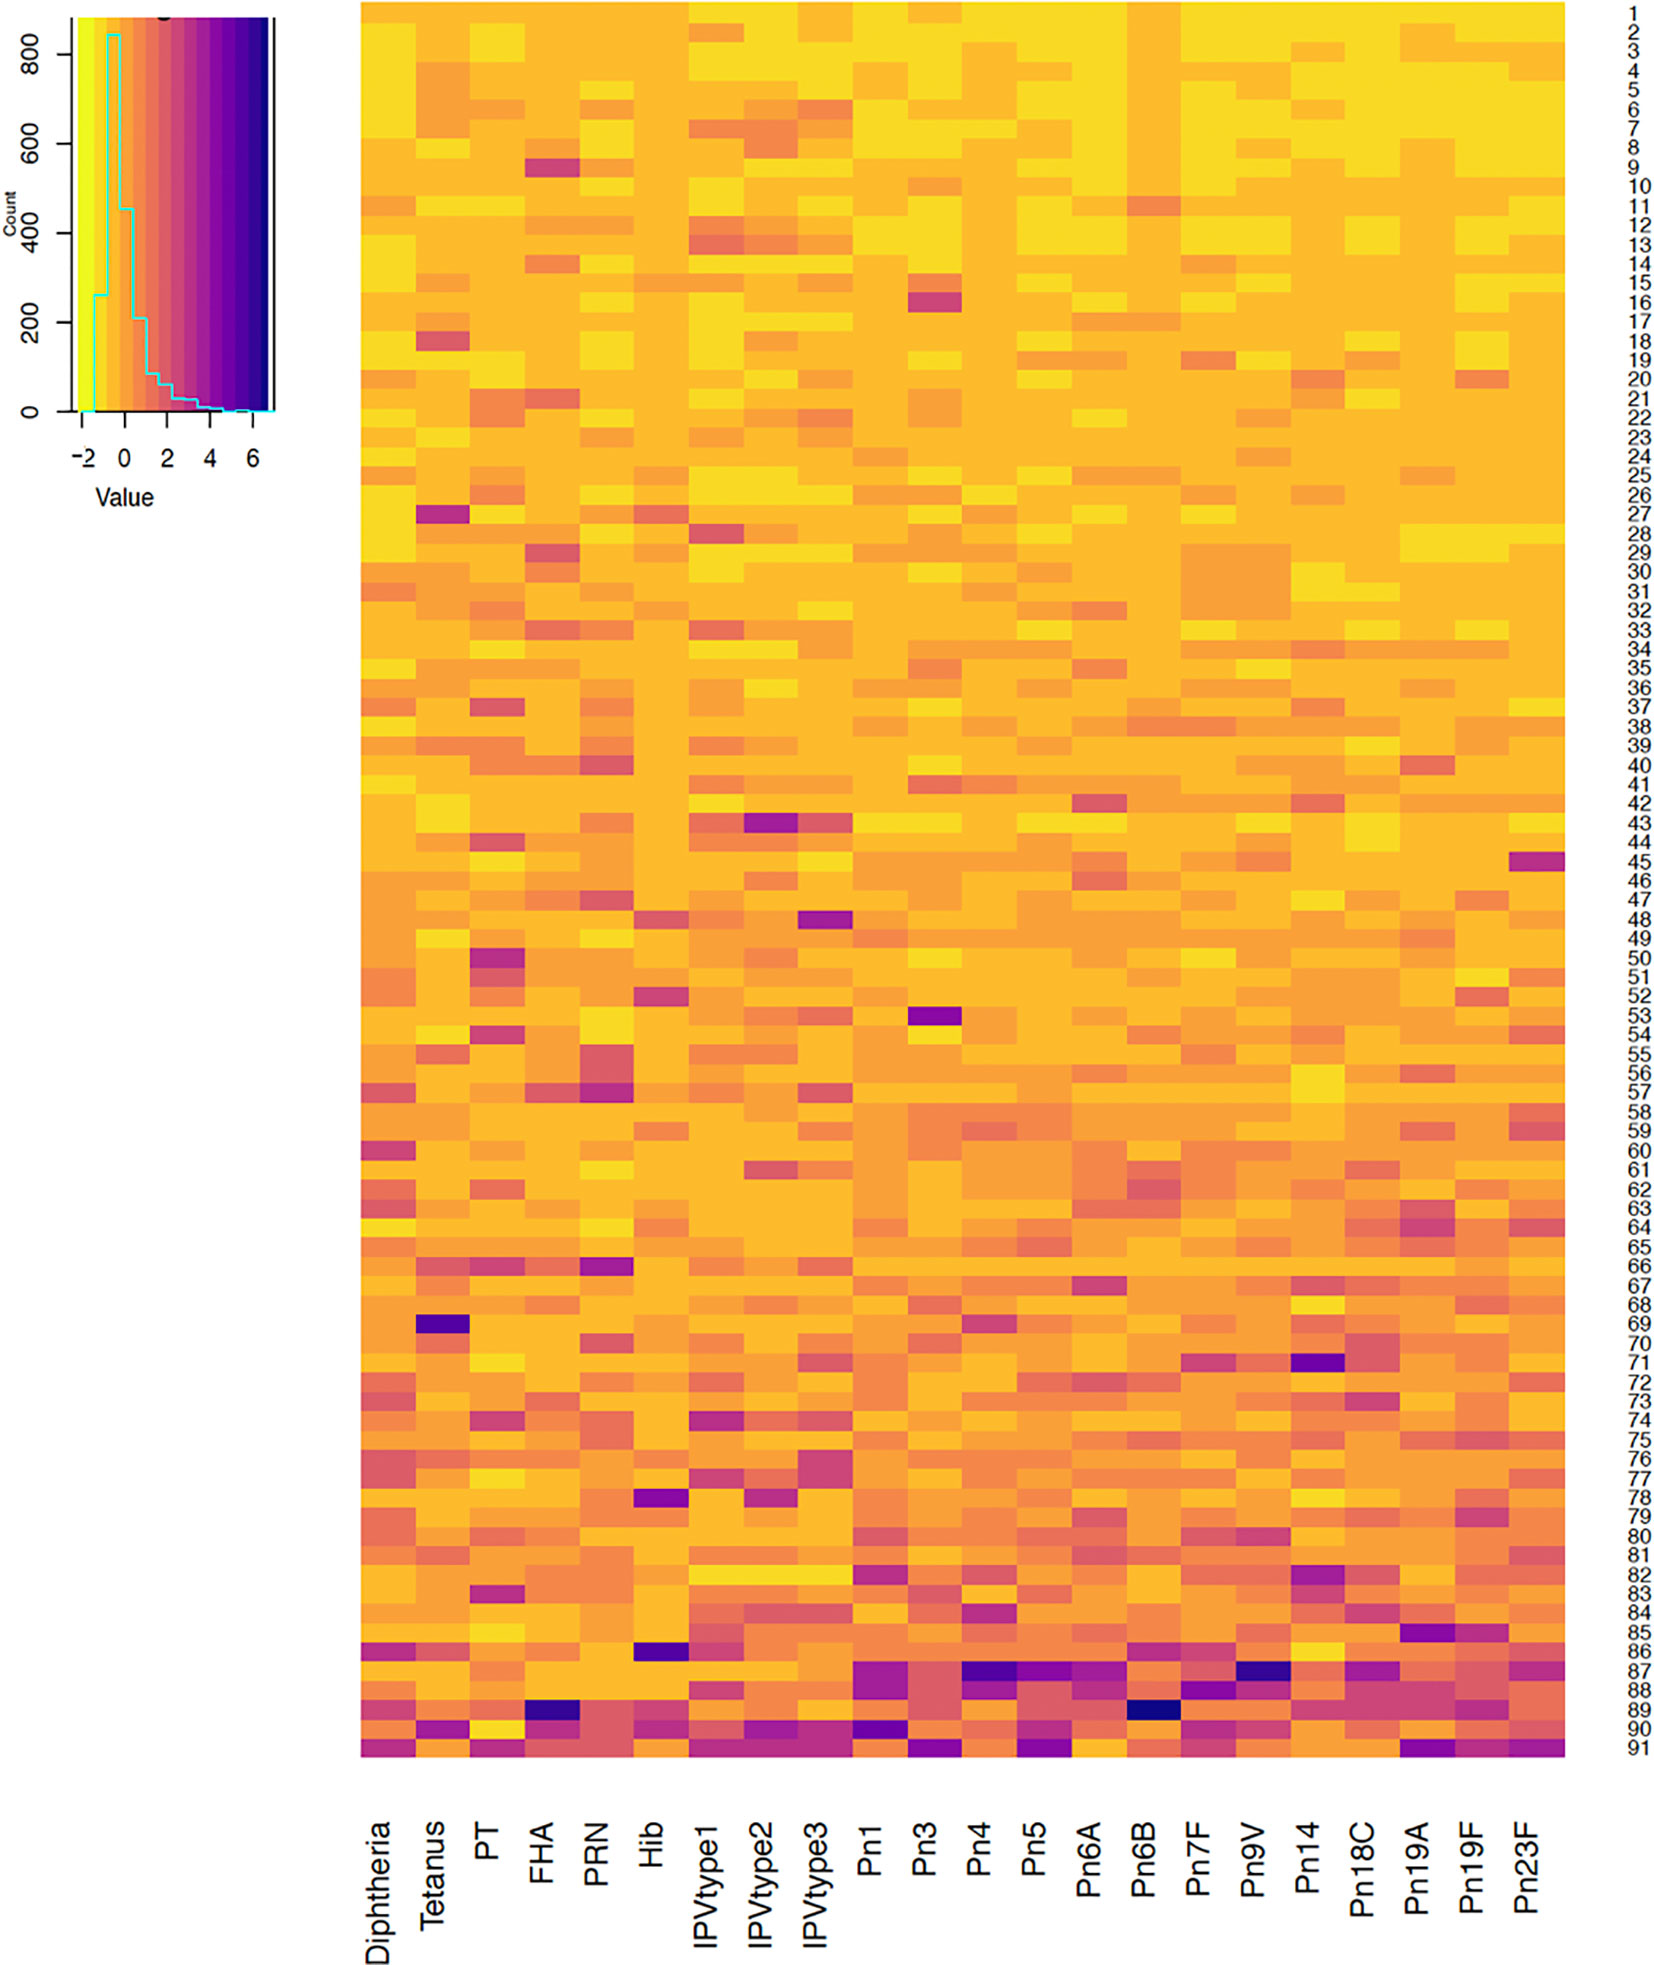
Figure 1 Antibody responses to vaccine antigens measured one month after the 6-month vaccinations (at 7 months of age) in 91 participants. Each row depicts one participant with the colour in each column representing the ‘scaled’ vaccine antibody response [(individual vaccine response - mean vaccine response)/standard deviation] in that individual. PT, pertussis toxin; FHA, filamentous haemagglutinin; PRN, pertactin; Hib, Haemophilus influenzae type b; IPV, polio; Pn, pneumococcal serotypes.
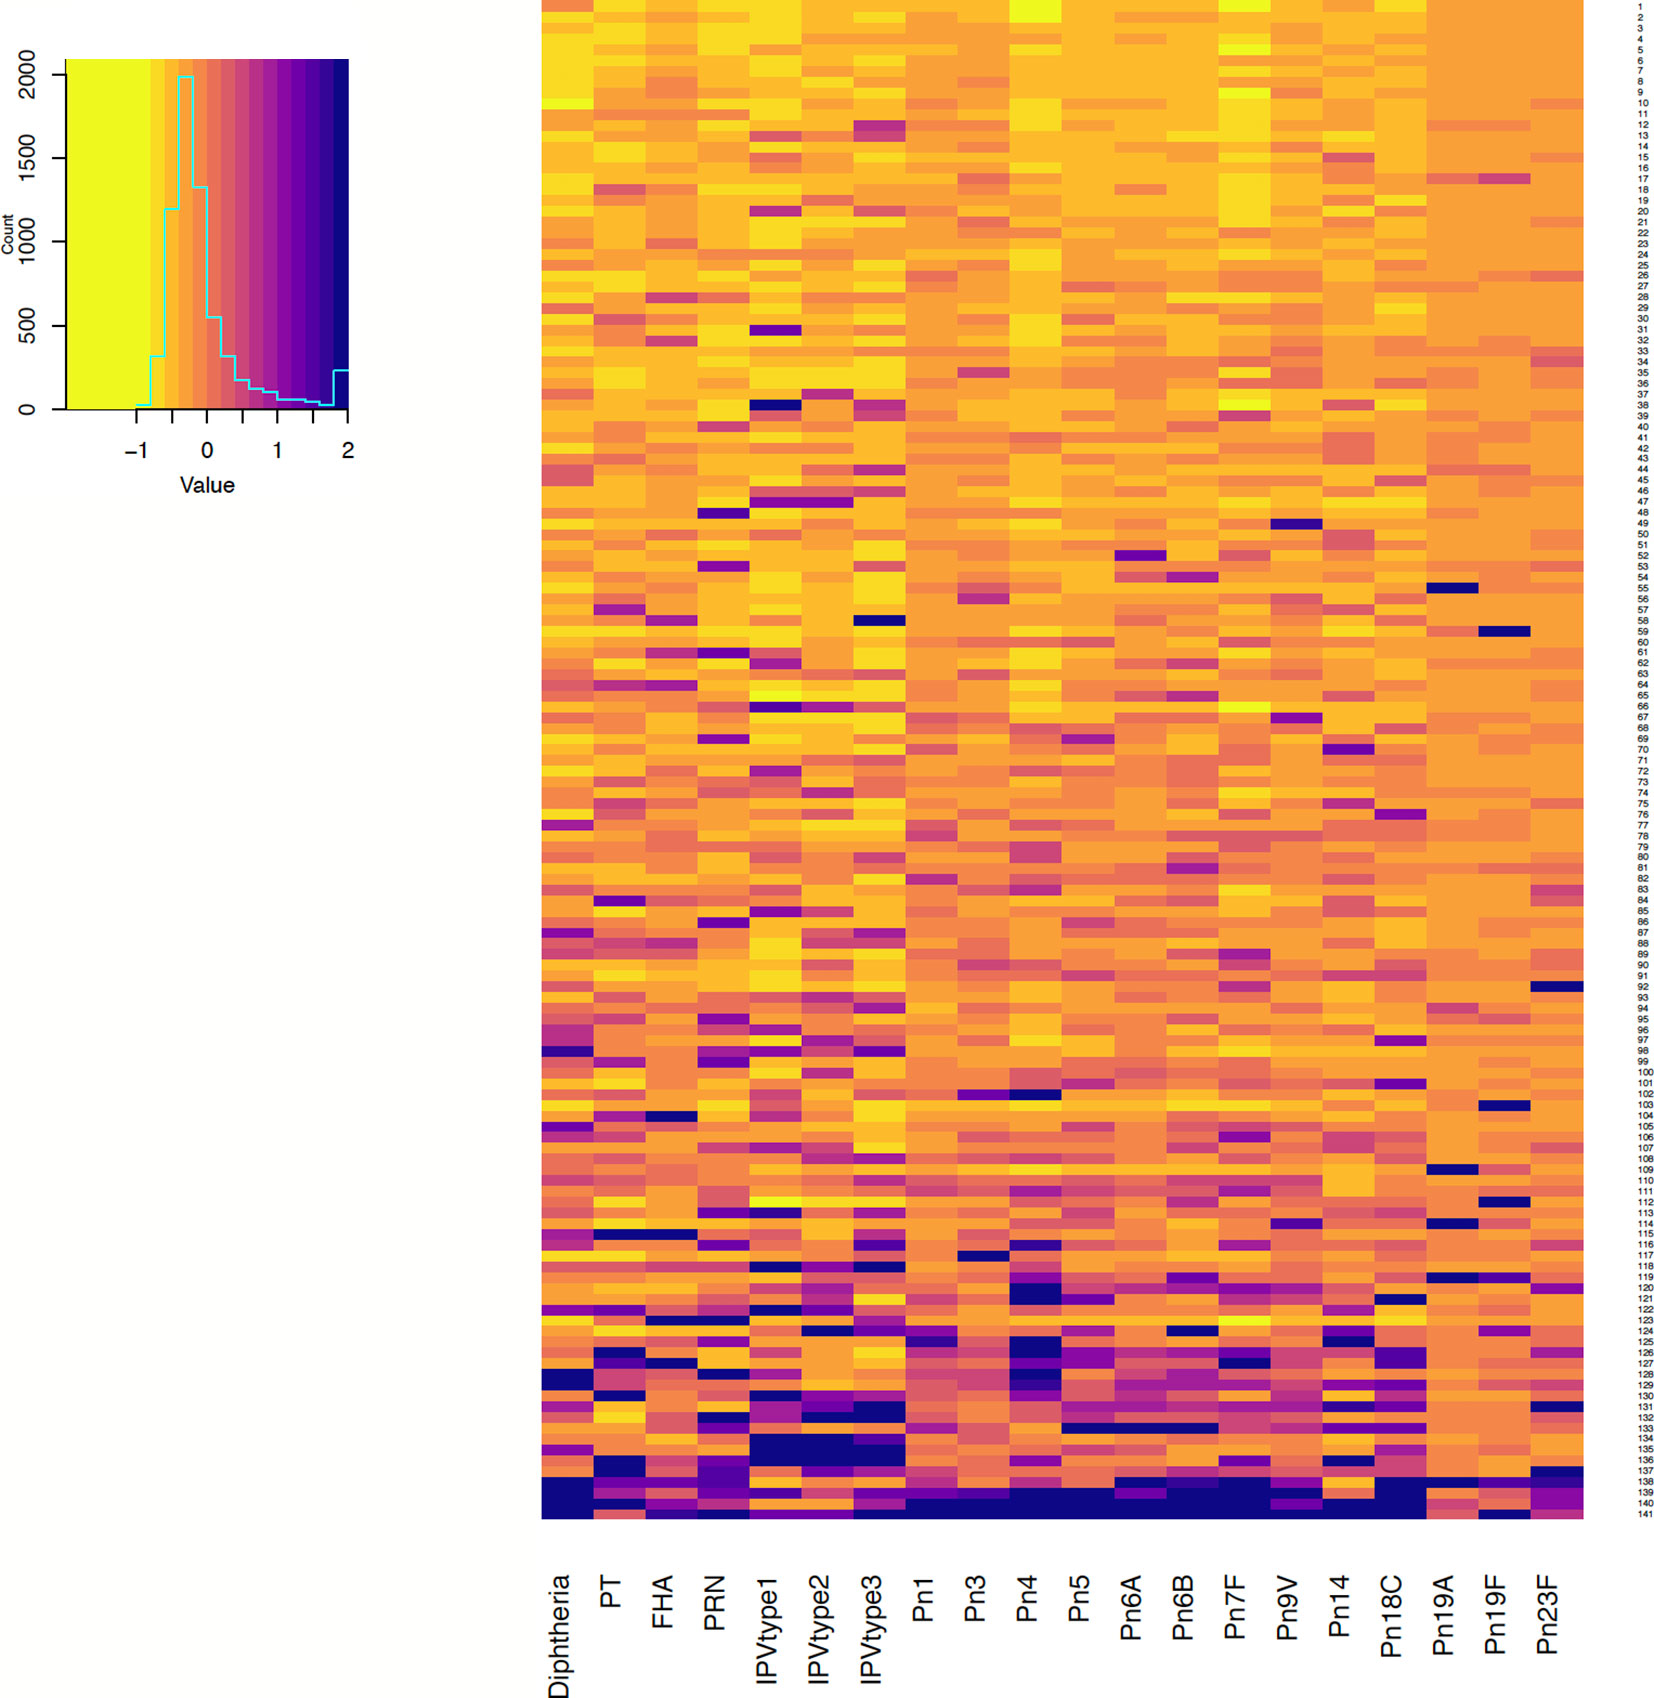
Figure 2 Antibody responses to vaccine antigens measured 7 months after 6-month vaccinations (at 13 months of age, for persistence of responses) in 141 participants. Each row depicts one participant with the colour in each column representing the ‘scaled’ [(individual vaccine response - mean vaccine response)/standard deviation] vaccine antibody response in that individual. PT, pertussis toxin; FHA, filamentous haemagglutinin; PRN, pertactin; IPV, polio; Pn, pneumococcal serotypes.
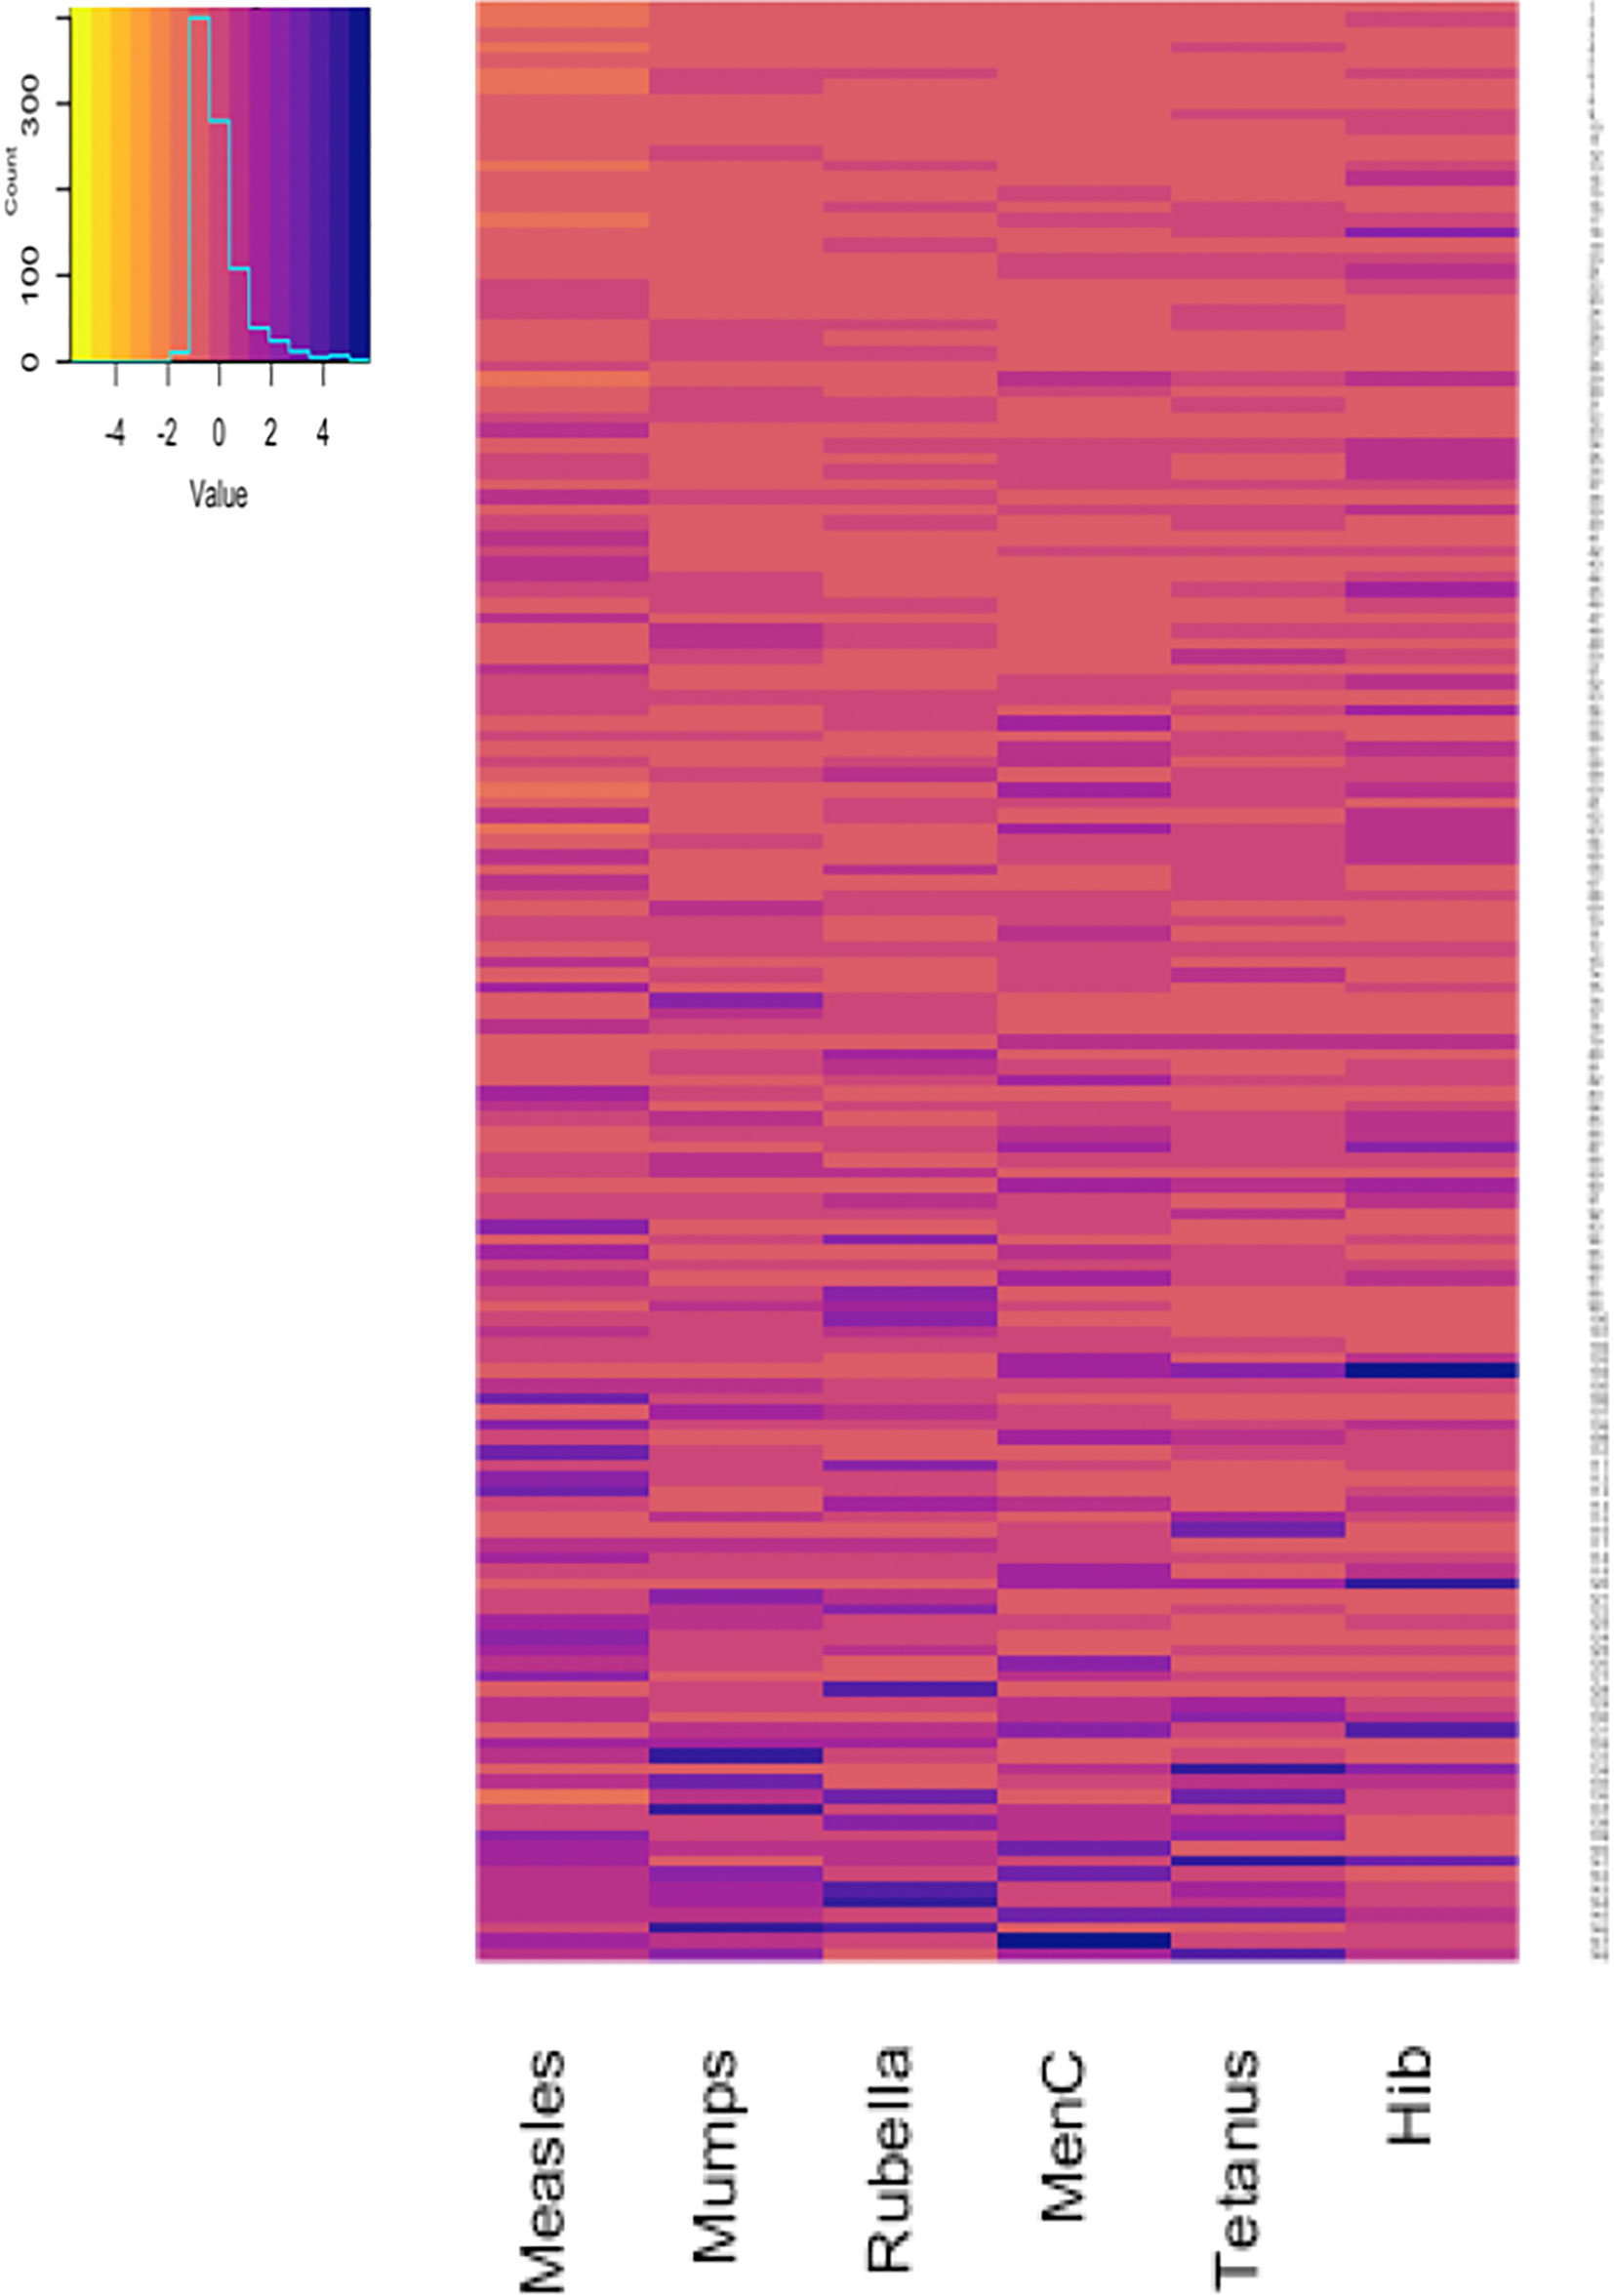
Figure 3 Antibody responses to 12-month vaccinations measured one month after vaccination in 148 participants. Each row depicts one participant with the colour in each column representing the ‘scaled’ [(individual vaccine response - mean vaccine response)/standard deviation] vaccine antibody response in that individual. MenC, Meningococcus C; Hib, Haemophilus influenzae type b.
Correlation of Antibody Responses One Month After the 6-Month Vaccinations
Results of pairwise comparisons of antibody responses to the 22 vaccine antigens included in the 6-month vaccinations measured one month after vaccination are shown in Figure 4 and Supplementary Table 1. One month after the 6-month vaccinations, ρ varied between 0.03 (between FHA and Pn14) and 0.86 (between Pn1 and Pn5). The strongest correlations were observed between antibody responses to different polio serotypes (strong) and different pneumococcal serotypes (moderate to very strong), with the exception of serotypes 3 and 14 (weak to strong). For the correlation between responses to different pneumococcal serotypes, the strongest correlations were observed for serotypes 1 (ρ = 0.52 - 0.86), 18C (ρ = 0.60 - 0.80) and 23F (ρ = 0.49 - 0.79). For antibody responses to pertussis, there was a moderate correlation between FHA and PRN (ρ = 0.51), and between FHA and PT (ρ = 0.52), but only a weak correlation between responses to PT and PRN (ρ = 0.25).
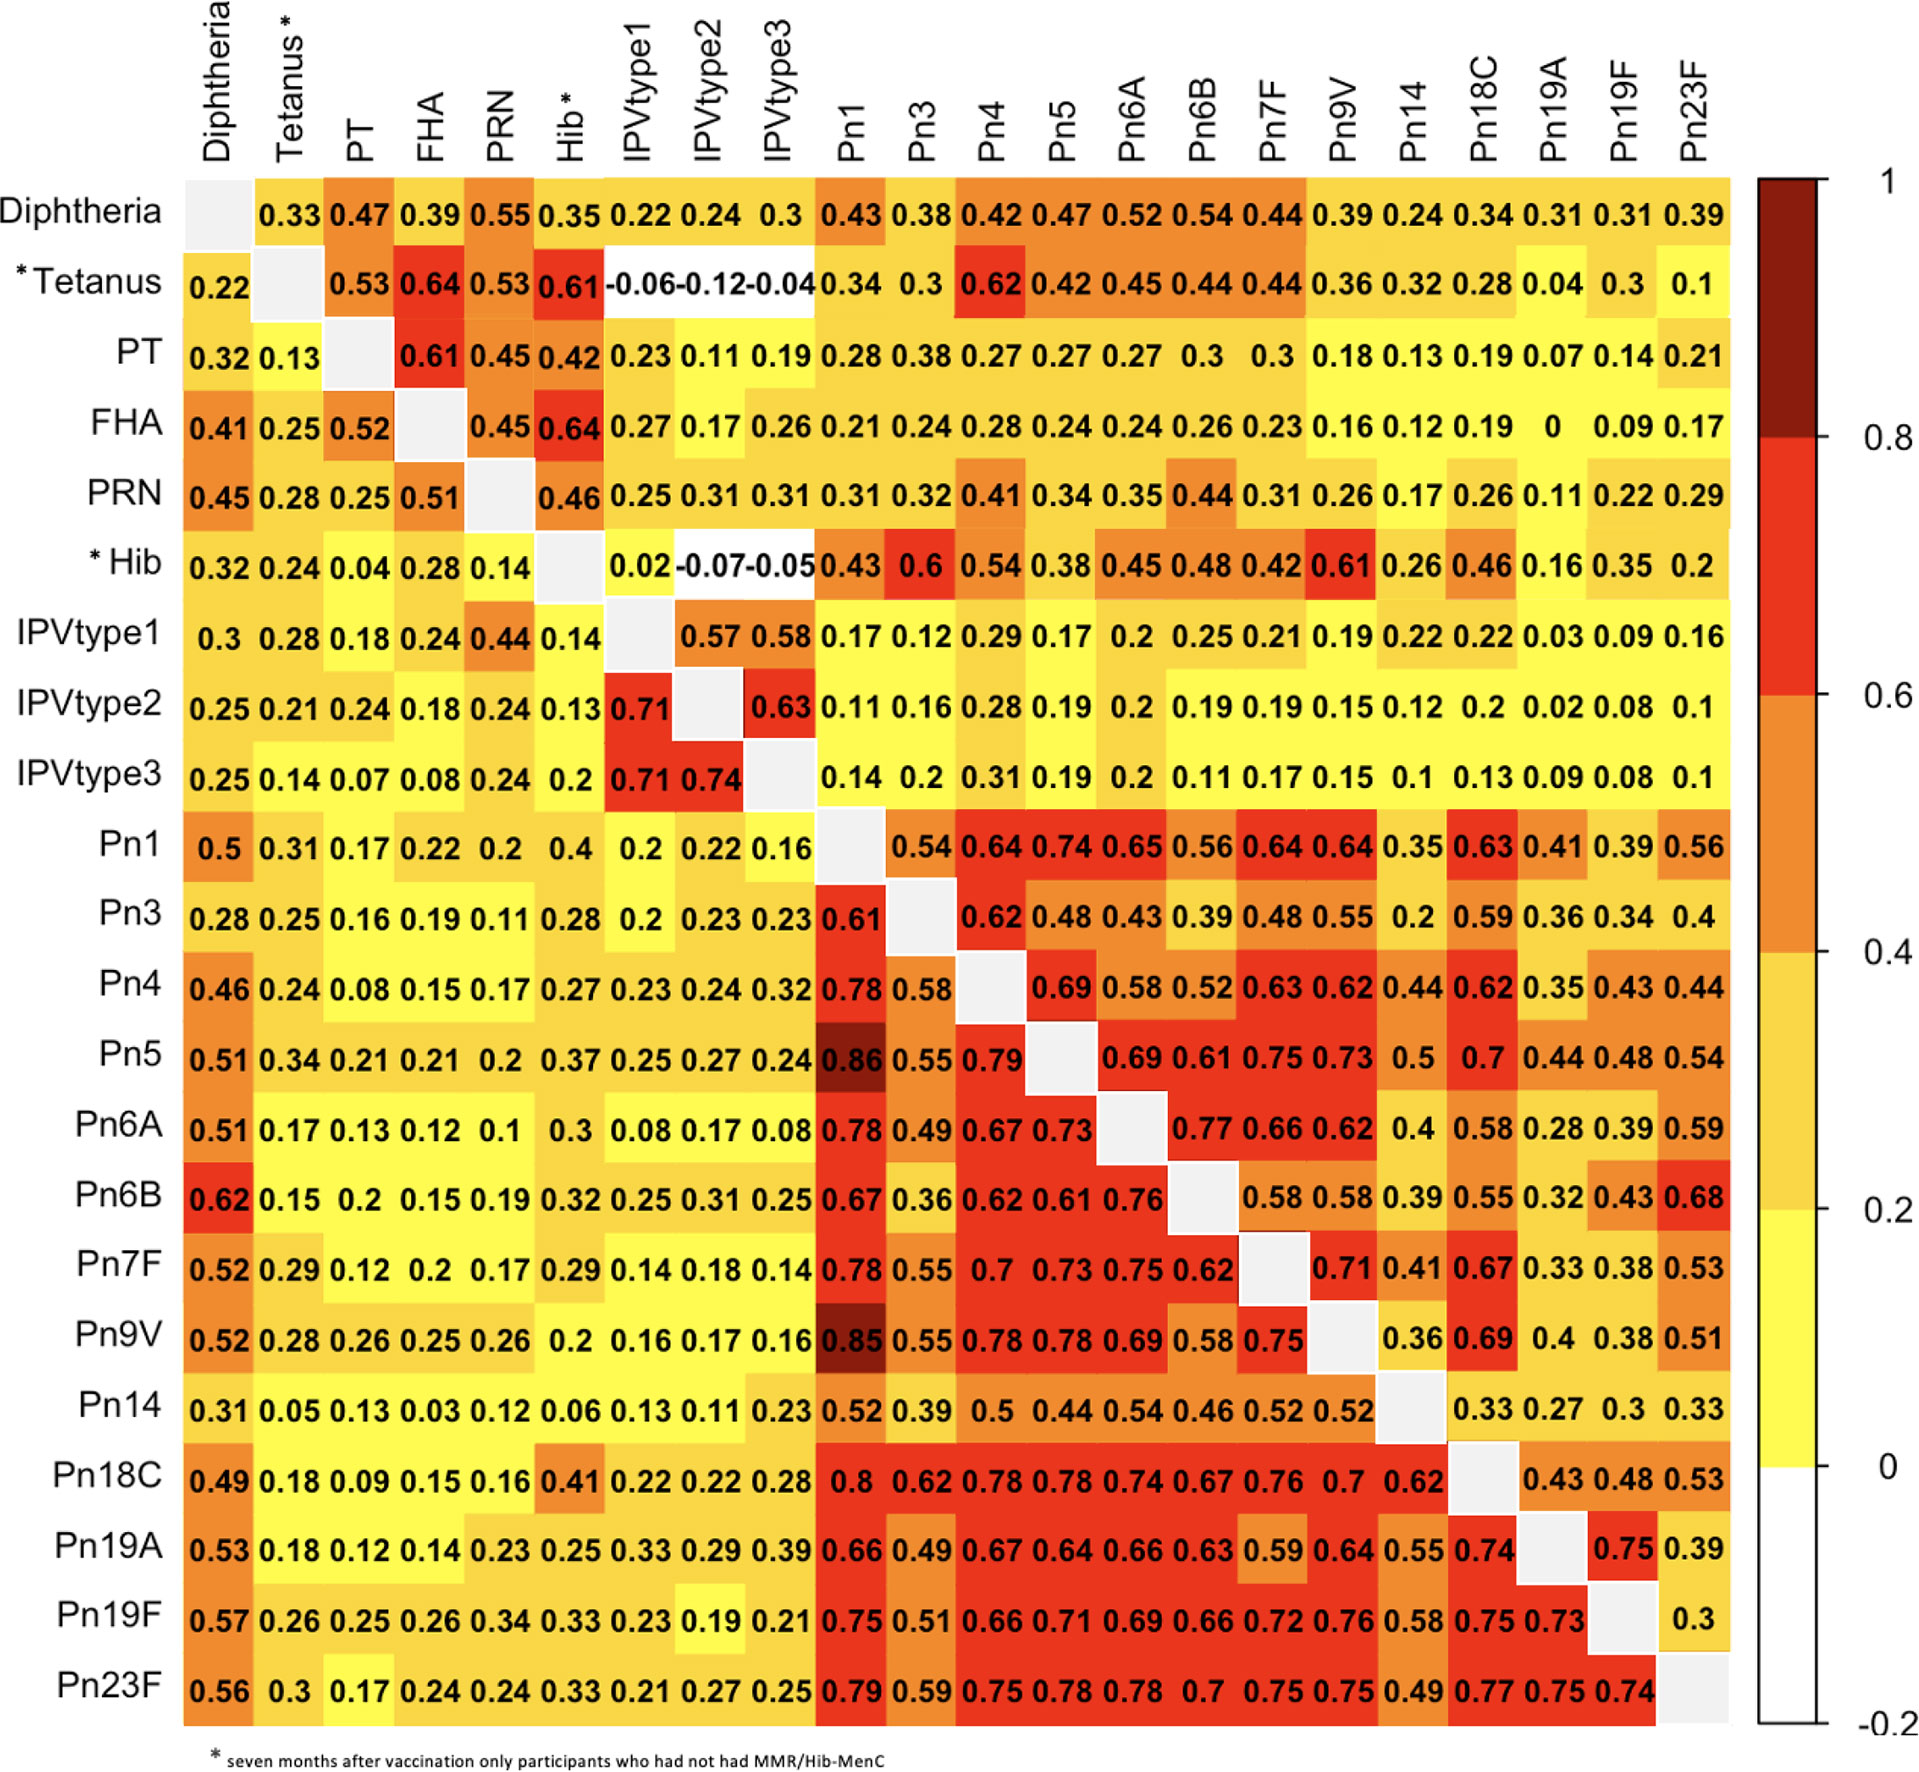
Figure 4 Correlation (expressed as Spearman correlation coefficients) for pairwise comparisons of antibody responses to the 6-month vaccinations measured at one (lower left) and seven (upper right) months after vaccination. PT, pertussis toxin; FHA, filamentous haemagglutinin; PRN, pertactin; Hib, Haemophilus influenzae type b; IPV, polio; Pn, pneumococcal serotypes.
Antibody responses to diphtheria had moderate to strong correlations with pneumococcal serotypes, except pneumococcal serotypes 3 and 14 (weak). Additionally, antibody responses to diphtheria had moderate correlations with responses to FHA and PRN (ρ = 0.41 - 0.45), while the correlations between responses to other vaccine antigens were weak. Antibody responses to tetanus, Hib and polio serotypes 1-3 had very weak to weak correlations with responses to all the other vaccine antigens.
Correlation of Antibody Responses Seven Months After the 6-Month Vaccinations
Results of pairwise comparisons between antibody responses to the 22 vaccine antigens in the 6-month vaccinations measured seven months after vaccination are shown in Figure 4 and Supplementary Table 1. Seven months after the 6-month vaccinations, correlations between antibody responses were weaker than one month after the vaccinations, except for correlations between FHA and PT, tetanus and FHA, tetanus and Hib, and Hib and FHA for which correlations were stronger at seven months compared with one month after vaccination (0.61 vs 0.52, 0.64 vs 0.41, 0.61 vs 9.24, 0.64 vs 0.28) (Figure 1 and Supplementary Table 1). The stronger correlations between tetanus and Hib and those to certain other antigens might be explained by the lower number of participants for these antigens (only participants who had not had MMR/Hib-MenC were included). Overall, 7 months after vaccination, ρ varied between -0.19 (between tetanus and polio serotype 2) and 0.77 (between Pn6A and Pn6B). The strongest correlations were observed between antibody responses to different pneumococcal serotypes (mostly moderate to strong with the exception of responses to serotypes 14, 19A and 19F and other serotypes, for which correlations were weak to moderate (except for the strong correlation between responses to 19A and 19F)). Moderate to strong correlations were also observed between responses to different polio serotypes and between different pertussis antigens.
Correlations between antibody responses to pneumococcal serotypes and diphtheria were weak to moderate. Antibody responses to tetanus correlated strongly with responses to FHA and Hib, but only weakly to moderately with responses to all the other antigens. The correlation between responses to tetanus and polio serotypes 1-3 were weakly negative, as was the correlation between responses to polio serotypes 2-3 and Hib. All other correlations between responses to polio and other vaccine antigens were very weak to weak.
Correlation of Antibody Responses One Month After the 12-Month Vaccinations
Results of pairwise comparisons of antibody responses to the 6 vaccine antigens measured one month after the 12-month vaccination are shown in Figure 5 and Supplementary Table 2.
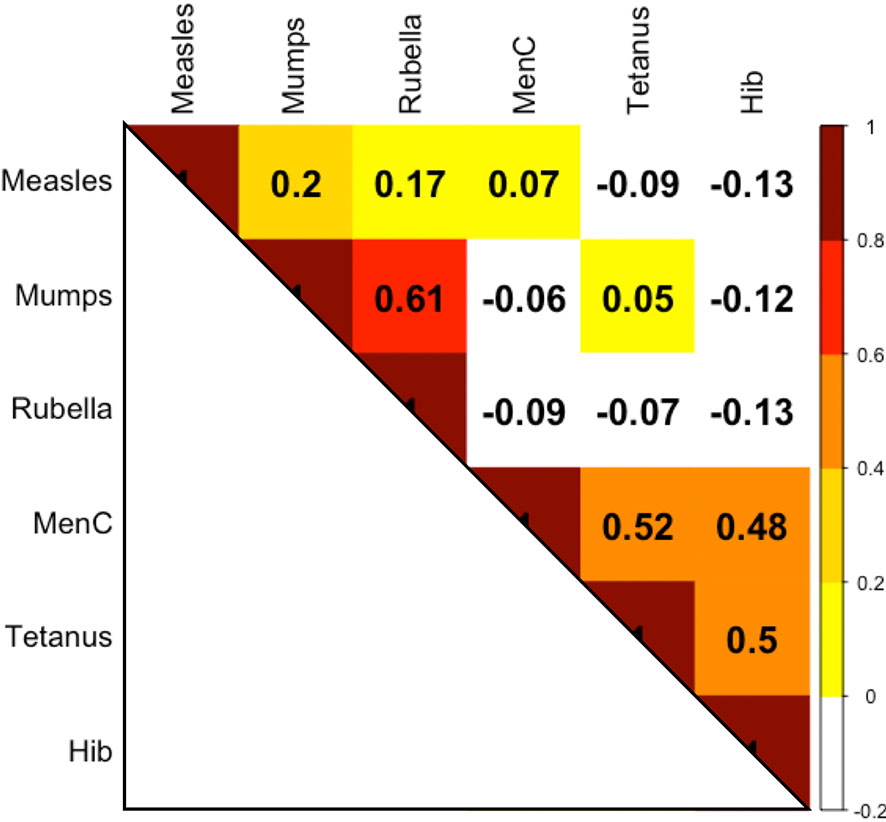
Figure 5 Correlation (expressed as Spearman correlation coefficients) for pairwise comparisons of antibody responses to the 12-month vaccinations at 13 months of age MenC, Meningococcus C; Hib, Haemophilus influenzae type b.
Overall, correlations between antibody responses to the 12-month vaccinations were weaker than those between responses to the 6-month vaccinations (Figure 2 and Supplementary Data Table 2). There was a high correlation between antibody responses to mumps and rubella (ρ = 0.61) and moderate correlations between responses to tetanus and MenC (ρ = 0.52), between tetanus and Hib (ρ = 0.5), and between MenC and Hib (ρ = 0.48). Almost all of the correlations between the live-vaccines measles, mumps, rubella and non-live vaccines (MenC, tetanus, Hib) were weakly negative.
Discussion
In this study, we observed a wide variation in antibody responses to vaccines and that overall, correlations between responses to different vaccines are weak. Strong correlations were found only between similar antigens (e.g. pneumococcal or polio serotypes) or between antigens that were conjugated to a protein carrier of the same or similar antigen. For example, in the conjugate pneumococcal vaccine, pneumococcal antigens are conjugated to CRM197, which is a diphtheria toxoid. This likely explains the moderate correlations between antibody responses to pneumococcal serotypes and diphtheria toxoid after the 6-month vaccinations. Similarly, for the combined Hib and MenC vaccine, both antigens are conjugated to a tetanus toxoid, which likely explains the moderate correlation between antibody responses to tetanus and Hib, and between tetanus and MenC observed after the 12-month vaccinations. However, after the 6-month vaccinations, there was only a weak correlation between the response to tetanus and Hib despite the latter being conjugated to tetanus toxoid. In contrast, this correlation was strong seven months after vaccination. We cannot explain this difference between immediate immune response and persistence of antibodies.
Despite being administered in the same vaccine, there were only weak correlations between antibody responses to tetanus, pertussis, polio and Hib antigens. Interestingly, we found negative correlations between responses to the live-vaccines measles, mumps and rubella, and non-live vaccines (MenC, tetanus, Hib). The finding is not easily explained as several studies have shown that simultaneous or delayed administration of MMR does not influence antibody concentrations to non-live vaccines (11–14).
Although infants were vaccinated simultaneously with two vaccines at each time point (which excludes confounding factors such as such as age, nutritional status, microbiota, time of day of administration etc.), correlations might be explained by the influence of factors such as adjuvants in the vaccines, vaccination site, needle size etc. Nevertheless, the vaccines in the study were given exactly as in clinical practice. Therefore, our findings are relevant to patient care. As the correlation between responses to different pneumococcal serotypes is strong, it may not be necessary to measure multiple responses to all serotypes. Serotypes which could potentially be used as a surrogate marker for response to pneumococcal vaccination are 18C, 1 and 23F. Responses to serotypes 14 and 3 should not be used as a surrogate, as responses to these antigens have the weakest correlations with responses to other serotypes. These findings are consistent with a recent study that reported correlations between 0.43 and 0.67 for responses to PCV13 (15). This study also observed the lowest correlations for antibody responses against pneumococcal serotype 14 and other serotypes (15).
Antibody responses to pneumococcal antigens may also be used to predict responses to diphtheria vaccination, especially when measured one month after vaccination, but not for responses to other vaccine antigens as other correlations were weak. Similarly, our finding of a strong correlation between antibody responses to different polio serotypes one month after vaccination means measuring responses to one serotype can be used to predict responses to other polio serotypes.
In contrast, antibody responses to pertussis, tetanus, polio and Hib were only weakly correlated with other vaccines responses, and therefore should not be used as surrogates for vaccine immunity. Notably, our results indicate that responses to non-live vaccines do not predict responses to live-vaccines.
As routine vaccinations include the administration of many different vaccine types, including toxoid, conjugated polysaccharide, inactivated and live vaccines, it is difficult to evaluate any consistency in the magnitude of antibody responses to vaccines of a certain type. Correlation between antibody responses to toxoid vaccines (diphtheria and tetanus) were weak at both one and seven months after vaccinations. Correlation between antibody responses to polysaccharide vaccines (Hib and pneumococcus) were mostly very weak to weak (with a few exceptions). Correlation between antibody responses to inactivated vaccine (polio) and purified proteins (pertussis) could not be compared with other vaccines of the same type. Furthermore, except the strong correlation that was found between responses to mumps and rubella, correlations between live vaccines were weak.
The findings of this study are relevant to clinical practice. As measuring antibody responses to one antigen cannot be used to predict responses to other antigens, this needs to be considered when using vaccine responses to investigate for primary immunodeficiency.
The strengths of this study include the broad range of measured antibody responses and the novel approach to comparing responses between different vaccine antigens. The limitations include the fact that only antibody concentration and not function was measured, that not all responses were measured exactly four weeks after vaccination, that responses to HepB vaccination were not measured (as this antigen is not included in the multiplex assay and there was insufficient sample volume for standard assays), and that the number of participants who were included at both time points was too small to allow longitudinal analysis.
In summary, the correlation between responses to similar antigens in the same vaccine (such as different serotypes of a bacteria or virus), as well as responses to antigens conjugated to similar carrier proteins is strong. In contrast, the correlation between responses to other vaccines is weak. Measuring antibody responses to one or a few vaccine antigens therefore does not offer a reliable surrogate marker of responses to unrelated vaccines.
Data Availability Statement
The raw data supporting the conclusions of this article will be made available by the authors, without undue reservation.
Ethics Statement
The studies involving human participants were reviewed and approved by Royal Children’s Hospital Human Research Ethics Committee [HREC, authorization (38124A)]. Written informed consent to participate in this study was provided by the participants’ legal guardian/next of kin.
Author Contributions
PZ, NR, KP, and NC were responsible for designing the study. NM was responsible for selecting the samples. FK was responsible for analyzing the samples. PZ performed the statistical analysis, which was supervised by NR, KP, and NC. PZ drafted the initial manuscript. All authors contributed to the article and approved the submitted version.
Funding
This work was supported by the Australian National Health and Medical Research Council (NHMRC) (grants GNT1051228 and GNT1099680). KP is supported by a Melbourne Children’s Clinician-Scientist Fellowship.
Conflict of Interest
The authors declare that the research was conducted in the absence of any commercial or financial relationships that could be construed as a potential conflict of interest.
Supplementary Material
The Supplementary Material for this article can be found online at: https://www.frontiersin.org/articles/10.3389/fimmu.2021.646677/full#supplementary-material
Supplementary Table 1 | Correlation (Spearman correlation coefficients with 95% confidence intervals and p-values) for pairwise comparisons of antibody responses to the 6-month vaccinations measured one (lower left) and seven (upper right) months after vaccination. *seven months after vaccination only participants who had not had MMR/Hib-MenC.
Supplementary Table 2 | Correlation (expressed as Spearman correlation coefficients with 95% confidence interval and p-values) for pairwise comparisons of antibody responses to the12-month vaccinations measured one month after vaccination.
References
1. Zimmermann P, Curtis N. Factors That Influence the Immune Response to Vaccination. Clin Microbiol Rev (2019) 32(2):e0084-18. doi: 10.1128/CMR.00084-18
2. Clutterbuck EA, Lazarus R, Yu LM, Bowman J, Bateman EA, Diggle L, et al. Pneumococcal conjugate and plain polysaccharide vaccines have divergent effects on antigen-specific B cells. J Infect Dis (2012) 205(9):1408–16. doi: 10.1093/infdis/jis212
3. Orange JS, Ballow M, Stiehm ER, Ballas ZK, Chinen J, De La Morena M, et al. Use and interpretation of diagnostic vaccination in primary immunodeficiency: a working group report of the Basic and Clinical Immunology Interest Section of the American Academy of Allergy, Asthma & Immunology. J Allergy Clin Immunol (2012) 130(3 Suppl):S1–24. doi: 10.1016/j.jaci.2012.07.002
4. Borrow R, Balmer P, Roper M. The immunological basis for immunisations. Module 3: Tetanus update 2006. WHO Press (2006).
5. van Gageldonk PG, van Schaijk FG, van der Klis FR, Berbers GA. Development and validation of a multiplex immunoassay for the simultaneous determination of serum antibodies to Bordetella pertussis, diphtheria and tetanus. J Immunol Methods (2008) 335(1-2):79–89. doi: 10.1016/j.jim.2008.02.018
6. de Voer RM, Schepp RM, Versteegh FG, van der Klis FR, Berbers GA. Simultaneous detection of Haemophilus influenzae type b polysaccharide-specific antibodies and Neisseria meningitidis serogroup A, C, Y, and W-135 polysaccharide-specific antibodies in a fluorescent-bead-based multiplex immunoassay. Clin Vaccine Immunol CVI (2009) 16(3):433–6. doi: 10.1128/CVI.00364-08
7. Elberse KE, Tcherniaeva I, Berbers GA, Schouls LM. Optimization and application of a multiplex bead-based assay to quantify serotype-specific IgG against Streptococcus pneumoniae polysaccharides: response to the booster vaccine after immunization with the pneumococcal 7-valent conjugate vaccine. Clin Vaccine Immunol CVI (2010) 17(4):674–82. doi: 10.1128/CVI.00408-09
8. Schepp RM, Berbers GA, Ferreira JA, Reimerink JH, van der Klis FR. A novel multiplex poliovirus binding inhibition assay applicable for large serosurveillance and vaccine studies, without the use of live poliovirus. J Virol Methods (2017) 241:15–23. doi: 10.1016/j.jviromet.2016.12.006
9. de Voer RM, van der Klis FR, Engels CW, Rijkers GT, Sanders EA, Berbers GA. Development of a fluorescent-bead-based multiplex immunoassay to determine immunoglobulin G subclass responses to Neisseria meningitidis serogroup A and C polysaccharides. Clin Vaccine Immunol CVI (2008) 15(8):1188–93. doi: 10.1128/CVI.00478-07
10. Smits GP, van Gageldonk PG, Schouls LM, van der Klis FR, Berbers GA. Development of a bead-based multiplex immunoassay for simultaneous quantitative detection of IgG serum antibodies against measles, mumps, rubella, and varicella-zoster virus. Clin Vaccine Immunol CVI (2012) 19(3):396–400. doi: 10.1128/CVI.05537-11
11. Zimmermann P, Perrett KP, van der Klis FRM, Curtis N. The immunomodulatory effects of measles-mumps-rubella (MMR) vaccination on persistence of heterologous vaccine responses. Immunol Cell Biol (2019) 97(6):577–85. doi: 10.1111/imcb.12246
12. Black SB, Cimino CO, Hansen J, Lewis E, Ray P, Corsaro B, et al. Immunogenicity and safety of measles-mumps-rubella, varicella and Haemophilus influenzae type b vaccines administered concurrently with a fourth dose of heptavalent pneumococcal conjugate vaccine compared with the vaccines administered without heptavalent pneumococcal conjugate vaccine. Pediatr Infect Dis J (2006) 25(4):306–11. doi: 10.1097/01.inf.0000207409.92198.6f
13. Blatter MM, Klein NP, Shepard JS, Leonardi M, Shapiro S, Schear M, et al. Immunogenicity and safety of two tetravalent (measles, mumps, rubella, varicella) vaccines coadministered with hepatitis a and pneumococcal conjugate vaccines to children twelve to fourteen months of age. Pediatr Infect Dis J (2012) 31(8):e133–40. doi: 10.1097/INF.0b013e318259fc8a
14. Durando P, Esposito S, Bona G, Cuccia M, Desole MG, Ferrera G, et al. The immunogenicity and safety of a tetravalent measles-mumps-rubella-varicella vaccine when co-administered with conjugated meningococcal C vaccine to healthy children: A phase IIIb, randomized, multi-center study in Italy. Vaccine (2016) 34(36):4278–84. doi: 10.1016/j.vaccine.2016.07.009
15. Lipsitch M, Li LM, Patterson S, Trammel J, Juergens C, Gruber WC, et al. Serotype-specific immune responses to pneumococcal conjugate vaccine among children are significantly correlated by individual: Analysis of randomized controlled trial data. Vaccine (2018) 36(4):473–8. doi: 10.1016/j.vaccine.2017.12.015
Keywords: antibodies, immunization, titre, concentration, vaccination, live vaccines, pneumococcal
Citation: Zimmermann P, Ritz N, Perrett KP, Messina NL, van der Klis FRM and Curtis N (2021) Correlation of Vaccine Responses. Front. Immunol. 12:646677. doi: 10.3389/fimmu.2021.646677
Received: 27 December 2020; Accepted: 05 March 2021;
Published: 02 April 2021.
Edited by:
Fabio Bagnoli, GlaxoSmithKline, ItalyReviewed by:
Simone Joosten, Leiden University Medical Center, NetherlandsJavier Carbone, Gregorio Marañón Hospital, Spain
Copyright © 2021 Zimmermann, Ritz, Perrett, Messina, van der Klis and Curtis. This is an open-access article distributed under the terms of the Creative Commons Attribution License (CC BY). The use, distribution or reproduction in other forums is permitted, provided the original author(s) and the copyright owner(s) are credited and that the original publication in this journal is cited, in accordance with accepted academic practice. No use, distribution or reproduction is permitted which does not comply with these terms.
*Correspondence: Nicole Ritz, Nicole.ritz@unibas.ch