 Xiaorui Wang1,2†
 Han Bai1,2†
 Junpeng Ma1,2†Hongyu Qin1,2†Qiqi Zeng1,2†
 Fang Hu1,2†Tingting Jiang3†Weikang Mao3†Yang Zhao4Xiaobei Chen5Xin Qi1,2Mengyang Li1,6Jiao Xu1,2Jingcan Hao7Yankui Wang8Xi Ding6Yuanrui Liu3Tianlong Huang3Chao Fang3Changli Ge3Dong Li9
 Ke Hu4
 Xianwen Ren10
 Baojun Zhang11Binghong Zhang12*
 Bingyin Shi6*
 Chengsheng Zhang1,2,7,13*‡
- 1Precision Medicine Center, The First Affiliated Hospital of Xi’an Jiaotong University, Xi’an, China
- 2The MED-X Institute, The First Affiliated Hospital of Xi’an Jiaotong University, Xi’an, China
- 3LC-Bio Technologies, Co., Ltd., Hangzhou, China
- 4Department of Respiratory and Critical Care Medicine, Renmin Hospital of Wuhan University, Wuhan, China
- 5Department of Infectious Diseases, The Renmin Hospital of Wuhan University, Wuhan, China
- 6Department of Endocrinology, The First Affiliated Hospital of Xi’an Jiaotong University, Xi’an, China
- 7Cancer Center, The First Affiliated Hospital of Xi’an Jiaotong University, Xi’an, China
- 8Dialysis Center, The Renmin Hospital of Wuhan University, Wuhan, China
- 9Department of Clinical Laboratory, The Renmin Hospital of Wuhan University, Wuhan, China
- 10Biomedical Pioneering Innovation Center (BIOPIC), School of Life Sciences, Peking-Tsinghua Center for Life Sciences, Academy for Advanced Interdisciplinary Studies, Beijing Advanced Innovation Center for Genomics (ICG), Peking University, Beijing, China
- 11Department of Pathogenic Microbiology and Immunology, School of Basic Medical Sciences, Xi’an Jiaotong University, Xi’an, China
- 12The Renmin Hospital of Wuhan University, Wuhan, China
- 13The Jackson Laboratory for Genomic Medicine, Farmington, CT, United States
The cell-mediated protective and pathogenic immune responses to SARS-CoV-2 infection remain largely elusive. Here we identified 76 distinct cell subsets in the PBMC samples that were associated with various clinical presentations of COVID-19 using scRNA-seq technology coupled with a deep and comprehensive analysis of unique cell surface markers and differentially expressed genes. We revealed that (TRAV1-2+CD8+)MAIT cells and (NCAM1hiCD160+)NK cells significantly enriched in the asymptomatic subjects whereas (LAG3+CD160+CD8+)NKT cells increased in the symptomatic patients. We also observed that (CD68-CSF1R-IL1BhiCD14+)classical monocytes were positively correlated with the disease severity. Moreover, (CD33-HLA-DMA-CD14+)classical monocytes and (CLEC10A-S100A9lo)pDC were associated with the viral persistence. The GO and KEGG analyses identified enriched pathways related to immune responses, inflammation, and apoptosis. These findings may enhance our understanding of the immunopathogenesis of COVID-19 and help develop novel strategies against SARS-CoV-2 infection.
Introduction
The pandemic of COVID-19 has posed unprecedented challenges to the international communities. As of January 28, 2022, there have been 364,191,494 confirmed cases of COVID-19, including 5,631,457 deaths worldwide reported to the World Health Organization (1). Despite the ongoing vaccination programs, the emerging variants of SARS-CoV-2 have resulted in the devastating surge of COVID-19 cases in several regions and countries, which reminds us that we still have a tremendous task to fight the SARS-CoV-2 infections and control this devastating pandemic.
The clinical presentations of SARS-CoV-2 infection are highly variable, ranging from asymptomatic infections to critical conditions (2–13). One of these reports by a living systematic review of 86 studies in different populations and settings suggested that approximately 20%-31% of SARS-COV-2 infected individuals remained asymptomatic state (AS) during the follow-up period (5). Among the symptomatic patients (SM), approximately 80% of them showed mild or moderate diseases (MD) whereas 20% displayed severe conditions (SD). While the previous studies have suggested that both the host factors and viral mutations may contribute to the diverse manifestations of the COVID-19 (14–17), the underlying molecular mechanisms remain to be further dissected and elucidated. An increasing number of studies have demonstrated the involvement of T cells, B cells, NK cells, monocytes, neutrophils, and inflammatory macrophages in the pathogenesis of COVID-19 patients with moderate or severe diseases (18–25), suggesting that host immune responses play important roles in the pathogenesis of COVID-19. On the other hand, only a few studies have reported the immune responses in the asymptomatic individuals (AS) (26–29). It is conceivable that examining the differences in the immune responses between the AS subjects and the SM patients may help understand the protective and pathogenic immune responses to SARS-CoV-2 infection. In addition, some of the hospitalized patients were tested positive for the nucleic acid of SARS-CoV-2 by RT-PCR but did not become negative for a longer period of time (>45 days, herein designated as long-term nucleic acid test positive, LTNP) whereas others turned into negative for the viral nucleic acid in a shorter period of time (≤45 days, designated as short-term nucleic acid test positive, STNP). However, the immune cells alternations in the LTNP and STNP patients remain largely unknown.
In this study, we employed the scRNA-seq technology coupled with a deep and comprehensive analysis of unique cell surface markers and differentially expressed genes to profile 51 PBMC samples from eleven HC individuals, five AS subjects and 33 SM patients. We identified 76 distinct immune cell subsets in the PBMC samples and revealed a large number of distinct immune cell subsets that were associated with various clinical presentations and viral persistence in the COVID-19 patients. These findings have shed new light on understanding the immunopathogenesis of COVID-19 and may help develop novel strategies against SARS-CoV-2 infection.
Materials and Methods
Patient Cohort and Case Definition
This study was reviewed and approved by the Ethics Committee of The First affiliated Hospital of Xi’an Jiaotong University (XJTU1AF2020LSK-015) and The Renmin Hospital of Wuhan University (WDRY2020-K130). All participants enrolled in this study offered the written informed consent by themselves or their surrogates. The definition and classification of all COVID-19 patients in this study follow the Guidelines of the World Health Organization and the “Guidelines on the Diagnosis and Treatment of the Novel Coronavirus Infected Pneumonia” developed by the National Health Commission of People’s Republic of China (30–32). We collected 53 samples of peripheral blood mononuclear cells (PBMCs), including 42 COVID-19 patient samples and 11 healthy controls (HC) samples (Figure 1A and Table S1). Two samples were excluded in this study, of which COV077 was a fatal case whereas COV166 was an immunocompromised case. The number of patients included five asymptomatic subjects (AS, n=5) and 33 symptomatic patients (SM, n=33) consisting of 13 moderate disease (MD, n=13), 10 severe disease (SD, n=10), and 10 SD recovery (SDR, n=10), and two samples collected at two different time points during hospitalization from patient C-19 and C-26, respectively. The SM group was further divided into the long-term nucleic acid test positive (LTNP, n=12) and the short-term nucleic acid test positive (STNP, n=21) sub-groups. In this study, based on the clinical observation that most of the COVID-19 patients hospitalized in the Renmin Hospital in Wuhan became negative for the nucleic acid test within 45 days, we therefore defined the STNP was ≤45 days whereas the LTNP was >45 days (Table S1). The demographic features, clinical laboratory testing results and other relevant information were provided in Table S1.
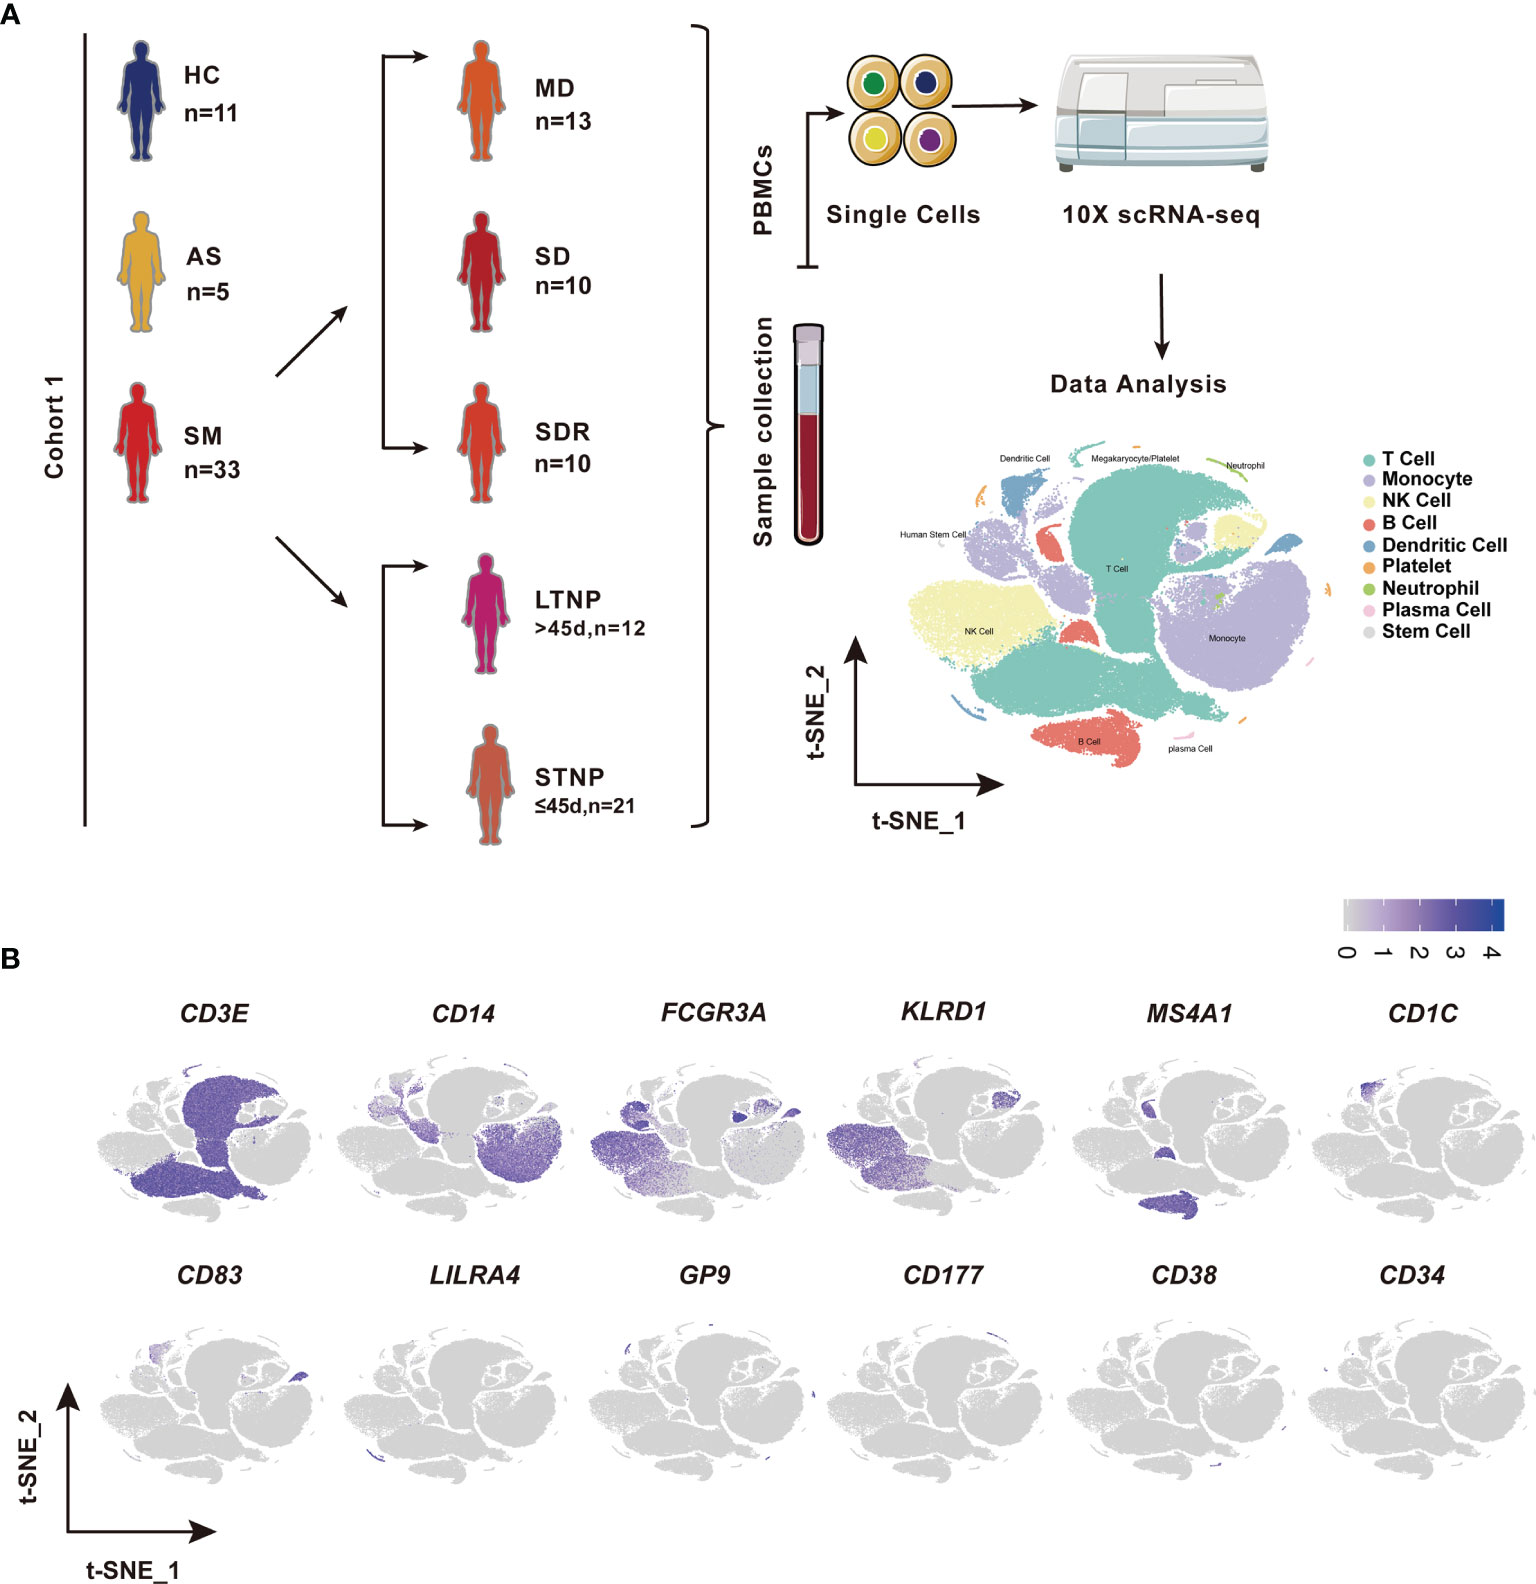
Figure 1 Identification of nine cell types in the peripheral blood mononuclear cells (PBMCs). (A) A schematic diagram of the study design for single-cell RNA sequencing (scRNA-seq). Peripheral blood mononuclear cells (PBMCs) were collected from eleven healthy controls (HC) and 39 SARS-CoV-2 infected individuals followed by scRNA-seq using the 10x Genomics platform. The T-distributed Stochastic Neighbor Embedding (t-SNE) plot of 119,799 cells showing nine cell types (i.e., T cells, Monocytes, NK cells, B cells, Dendritic cells, platelets neutrophils, plasma cells, and stem cells) identified from this study. (B) The t-SNE plots showing the expression of canonical cell marker genes used for identification of the nine cell types described above. Each dot represents a single cell. The plots are color-labelled based on the expression level of the respective marker gene in log scale, which was calculated via LogNormalize method of the “NormalizeData” function of the Seurat software. HC, Healthy controls; AS, Asymptomatic subjects; SM, Symptomatic patients; MD, Moderate disease; SD, Severe disease; SDR, Recovery patients from SD; LTNP, Long term nucleic acid test positive; STNP, Short term nucleic acid test positive.
Preparation of Single-Cell Suspensions
The frozen PBMCs were retrieved from the liquid nitrogen storage tank and thawed in a 37°C water bath, followed by washing with 10mL of 90% DMEM+10% FBS in a 15-mL polypropylene tube and then centrifuged at 500g for 20 min. The supernatant was removed (repeated this step twice). The cell pellet was resuspended with 500μl of 1x PBS with 0.04% BSA (A1933-25G, SIGMA), followed by adding 5ml of 1x Red blood cell (RBC) lysis buffer (130-094-183, 10x stock solution, Miltenyi Biotech) and incubated at room temperature for 10 min to lyse the remaining red blood cells. After incubation, the cell suspension was centrifuged at 500g for 20 min at room temperature and then resuspended in 100μl of Dead Cell Removal MicroBeads to remove dead cells using Miltenyi Dead Cell Removal Kit (130-090-101-1, Miltenyi Biotech). The live cells were collected and resuspended in 1x PBS with 0.04% BSA and centrifuged at 300g for 3 min at 4°C (repeated twice). The cell pellet was resuspended in 50μl of 1x PBS with 0.04% BSA. The cell viability was measured by the trypan blue exclusion method and confirmed to be 85% or higher. The cell number of the single cell suspension was counted using a Countess II Automated Cell Counter and the final concentration was adjusted to 700-1200 cells/μl.
Chromium 10x Genomics Library Construction and Sequencing
Approximately 5000 single cells each sample were captured using the Chromium Single-Cell 5’ kit (V1) according to the manufacturer’s instructions (PN-1000020, 10x Genomics), followed by cDNA amplification and library construction performed according to the standard protocols. The libraries were sequenced on an Illumina NovaSeq 6000 sequencing platform (paired-end multiplexing run, 150bp) by LC-Bio Technology Co. Ltd., (HangZhou, China) at a minimum depth of 20,000 reads per cell. To avoid batch effects, the scRNA-seq data sets were generated by the same operators at the same laboratories using the standard operation protocols (SOPs) for cell dissociation, library preparation and sequencing.
Single-Cell RNA-Seq Data Processing
The sequencing results were demultiplexed and converted to FASTQ format using Illumina Bcl2fastq2 software (v2.20, Illumina). Sample demultiplexing, barcode processing and single-cell 5’ gene counting were completed by using the Cell Ranger pipeline (https://support.10xgenomics.com/single-cellgeneexpression/software/pipelines/latest/what-is-cell-ranger, version 3.1.0) and the scRNA-seq data were aligned to Ensembl genome GRCh38 reference genome. A total of 222,457 single cells captured from eleven healthy controls and 42 COVID-19 patient samples were processed using 10x Genomics Chromium Single Cell 5’ Solution (PN-1000006, 10x Genomics). The Seurat (version 3.1.1) was used for dimensional reduction, clustering, and analysis of scRNA-seq data (33). Overall, 207,718 cells passed the quality control threshold: all genes expressed in less than one cell were removed, number of genes expressed per cell >500 as low cut-off, UMI counts less than 500, and the percentage of mitochondrial-DNA derived gene-expression < 25%. To visualize the data, we further reduced the dimensionality of all 207,718 cells by Seurat and used t-Distributed Stochastic Neighbor Embedding (t-SNE) to project the cells into 2D space. The steps included: (1) Using the LogNormalize method of the “Normalization” function of the Seurat software to calculate the expression level of genes; (2) The principal component analysis (PCA) was performed using the normalized expression level, within all the PCs, the top 10 PCs were used to do clustering and t-SNE analysis; (3) Using weighted Shared Nearest Neighbor (SNN) graph-based clustering method to find clusters. The marker genes for each cluster were identified with the “bimod”(Likelihood-ratio test) with default parameters via the FindAllMarkers function in Seurat. This selects marker genes that were expressed in more than 10% of the cells in a cluster and the average log (Fold Change) of greater than 0.26. To further avoid interference of putative multiplets (where more than one cell was loaded into a given well on an array), cells in a defined cluster that had high expression of more than one cell type canonical marker gene were filtered to ensure the data quality. In detail, we identified nine major cell types using the canonical markers (T cell: CD3E+; NK: KLRD1(CD94)+ or CD16A+; Monocyte: CD14+ or CD16A+ or LYZ+; B cell: CD20 (MS4A1)+; Dendritic cells: CD16A+ or CD83+ or LILRA4(CDF85g) or LYZ+ or CD1C+; Platelet: GP9+ or ITGA2B (CD41)+; Neutrophil: CD177+ or LYZ+; Plasma cell:CD38+; Stem cell:CD34+) and then excluded any cells that expressed more than one canonical marker genes, which could not be classified into one type. Parameters used for graph-based clustering follow: FindNeighbors with parameter reduction = pca, dims = 1:10 and FindClusters with parameter resolution = 0.8. “Cellranger aggr” in Seurat was used to integrate the samples. As a result, a total of 119,799 cells were used for the final analysis in this study. The nine cell types were integrated for further sub-clustering. After integration, genes were scaled to unit variance. Scaling, principal component analysis and clustering were performed as described above.
Analysis of Differentially Expressed Genes and Functional Enrichment
The analysis of differentially expressed genes (DEGs) between each pair of cells from different groups (e.g., the asymptomatic, symptomatic, and healthy control groups) was performed using “bimod” with default parameters in Seurat. DEGs were filtered using a minimum log2 (fold change) of 0.26, a P value <0.05 and >10% of cells expressed in at least one group. To further understand the associations and function of the DEGs, GO and KEGG pathway analysis was performed using the OmicStudio tools at https://www.omicstudio.cn/tool. DEGs with a log2 mean expression difference ≥0.26 enriched in GO or KEGG pathways were considered as significant candidate biomarkers or pathways.
Clinical and Laboratory Tests
All clinical and laboratory tests were conducted in the Renmin Hospital of Wuhan University, including the tests of SARS-COV-2-specific IgM (Cat#20203400769, YHLO Biotech) and SARS-COV-2-specific IgG (Cat#20203400770, YHLO Biotech) antibodies.
Statistical Analysis
All data and statistical analyses were performed using SPSS (Statistical Package for the Social Sciences, Version 23.0 software, SPSS Inc.). R (https://www.cran.r-project.org, Vienna, Austria) and GraphPad Prism 8.0.2 (GraphPad Software, San Diego, USA) were also used for analysis in this study. Categorical variables were described as frequency rates and percentages, whereas continuous variables were described using mean, median, and inter quartile range (IQR) values. Difference analysis of HC vs AS and STNP vs LTNP were conducted using two-groups comparison strategy, whereas multiple groups comparison strategy was employed for analysis of HC vs AS vs SM and HC vs AS vs MD vs SD vs SDR. The cell cluster analysis was performed using cell abundance data to identify the distinct cell subsets associated with various clinical presentations. The gene expression analysis was performed to identify the differential expression genes (DEGs). We also analyzed the data distribution in each group. Independent group t-tests were performed for two-groups comparisons when the data were normally distributed; otherwise, the Mann-Whitney test was used. For three-groups comparison, One-way Anova test was conducted when the data were normally distributed and homoscedasticity, otherwise, Kruskal-Wallis was employed. In addition, Bonferrion correction was used for the multiple- groups comparison. Of note, Bonferrion correction (Bonferroni adjustment) include the following steps: First, divide the desired alpha-level by the number of comparisons; Second, calculate the p-value and evaluate the significance. SPSS employed a mathematically equivalent adjustment in this study for pairwise comparisons. The Bonferrion correction was performed by taking the observed (uncorrected) p-value and multiply it by the number of comparisons. Proportions for categorical variables were compared using the χ2 test, whereas the Fisher exact test was employed when the data were limited. For unadjusted comparisons, a two-sided α of less than 0.05 was considered statistically significant. Correlation analyses were performed using Spearman, whereas Mann-Whitney and Wilcoxon tests were employed for unpaired and paired comparisons, respectively. The details of the statistical analysis were provided in the respective figure legends.
Results
Identification of 76 Cell Subsets in the PBMCs of COVID-19 Patients by scRNA-Seq
To identify the immune cell alternations in the peripheral blood of COVID-19 patients with various clinical presentations, we performed the droplet-based scRNA-seq to profile the immune cell landscape in 51 PBMC samples collected from eleven healthy controls (HC), five asymptomatic individuals (AS), and 33 symptomatic patients (SM) with moderate diseases (MD, n=13) or severe diseases (SD, n=10), and the patients recovered from SD (SDR, n=10), as well as three samples collected at two different time points during hospitalization from patient C-19 and C-26, respectively (Figure 1A). In addition, this study cohort included 12 long-term nucleic acid test positive (LTNP) patients, 21 short-term nucleic acid test positive (STNP) patients. (Figure 1A and Table S1). The demographic features, clinical characteristics and the laboratory testing results of these study subjects were presented in the Supplementary Materials (Table S1). After a series of stringent high-quality filtering and removal of multiplets, a total of 119,799 single cells captured from all the participants were used for the final data analysis. As shown by the t-Distributed Stochastic Neighbor Embedding (t-SNE) plot, we first identified nine major cell types, including T cells (CD3E), B cells (MS4A1), monocytes (CD14, FCGR3A), natural killer (KLRD1), dendritic cells (CD1C, CD83, LILRA4), platelets (GP9), neutrophils (CD177), plasma cells (CD38), and stem cells (CD34) using the unique marker genes (Figures 1A, B). We also examined the distribution patterns of these cell types in each of the study sub-groups (Figure S1A) and calculated the relative abundance of these cell types in each sample, respectively (Figure S1B). We then identified 24 cell clusters from the 119,799 single cells, including (CD8+GZMK-)naïve T cells (cluster 0), (CD7hi)NK cells (cluster 1), (CD4+GATA3+GPR183+) naïve CD4 T cells (cluster 2), (CD3+KLRD1+)NKT cells (cluster 3), (CD4hiCD68+CD14+) classical monocytes (cluster 4), (GZMK+CD8+)effector/memory CD8 T cells (cluster 5), (CD4loCSF1R-CD33-CD14+)classical monocytes (cluster 6), (CD14+CD16+)intermediate monocytes (cluster 7), (CD4-CD8-)double negative T cells (cluster 8), (CCR7+)naïve B cells (cluster 9), (Siglec10+CD16+)non-classical monocytes (cluster 10), (CD7lo)NK cells (cluster 11), (CD4loCSF1R-CD33+CD14+)classical monocytes (cluster 12), (CD27+)memory B cells (cluster 13), (CD4hiCD68-CD14+)classical monocytes (cluster 14), (CD14-CD16-)immature monocytes (cluster 15), (CD1C+)myeloid DC (mDC) (cluster 16), (ITGA2B+)platelets (cluster 17), (MKI67+)proliferation T cells (cluster 18), (CD83hi)mDC (cluster 19), (LILRA4+)plasmacytoid DC (pDC) (cluster 20), (CD177+)neutrophils (cluster 21), (CD38hiIGHG4+)plasma cells (cluster 22), and (CD34+)stem cells (cluster 23) (Figures 2A–C and Table S2), and calculated the relative abundance of the 24 cell clusters in each of the samples, respectively (Figure S2A). Furthermore, we identified 76 distinct cell subsets from the nine cell types with a combination of unique cell surface markers and the differentially expressed genes, including sixteen T cell subsets, twelve monocyte subsets, twelve dendritic cell subsets, eight NK cell subsets, ten B cell subsets, six platelet subsets, five neutrophil subsets, four plasma cell subsets, and three stem cell subsets (Figures 2B, C, S2B, and Table S2). We also calculated the relative abundance of the cell types, clusters and subclusters described above (Tables S3 and S4), which allowed us to compare the cell alternations between various groups of individuals and understand their associations with the pathogenesis of COVID-19.
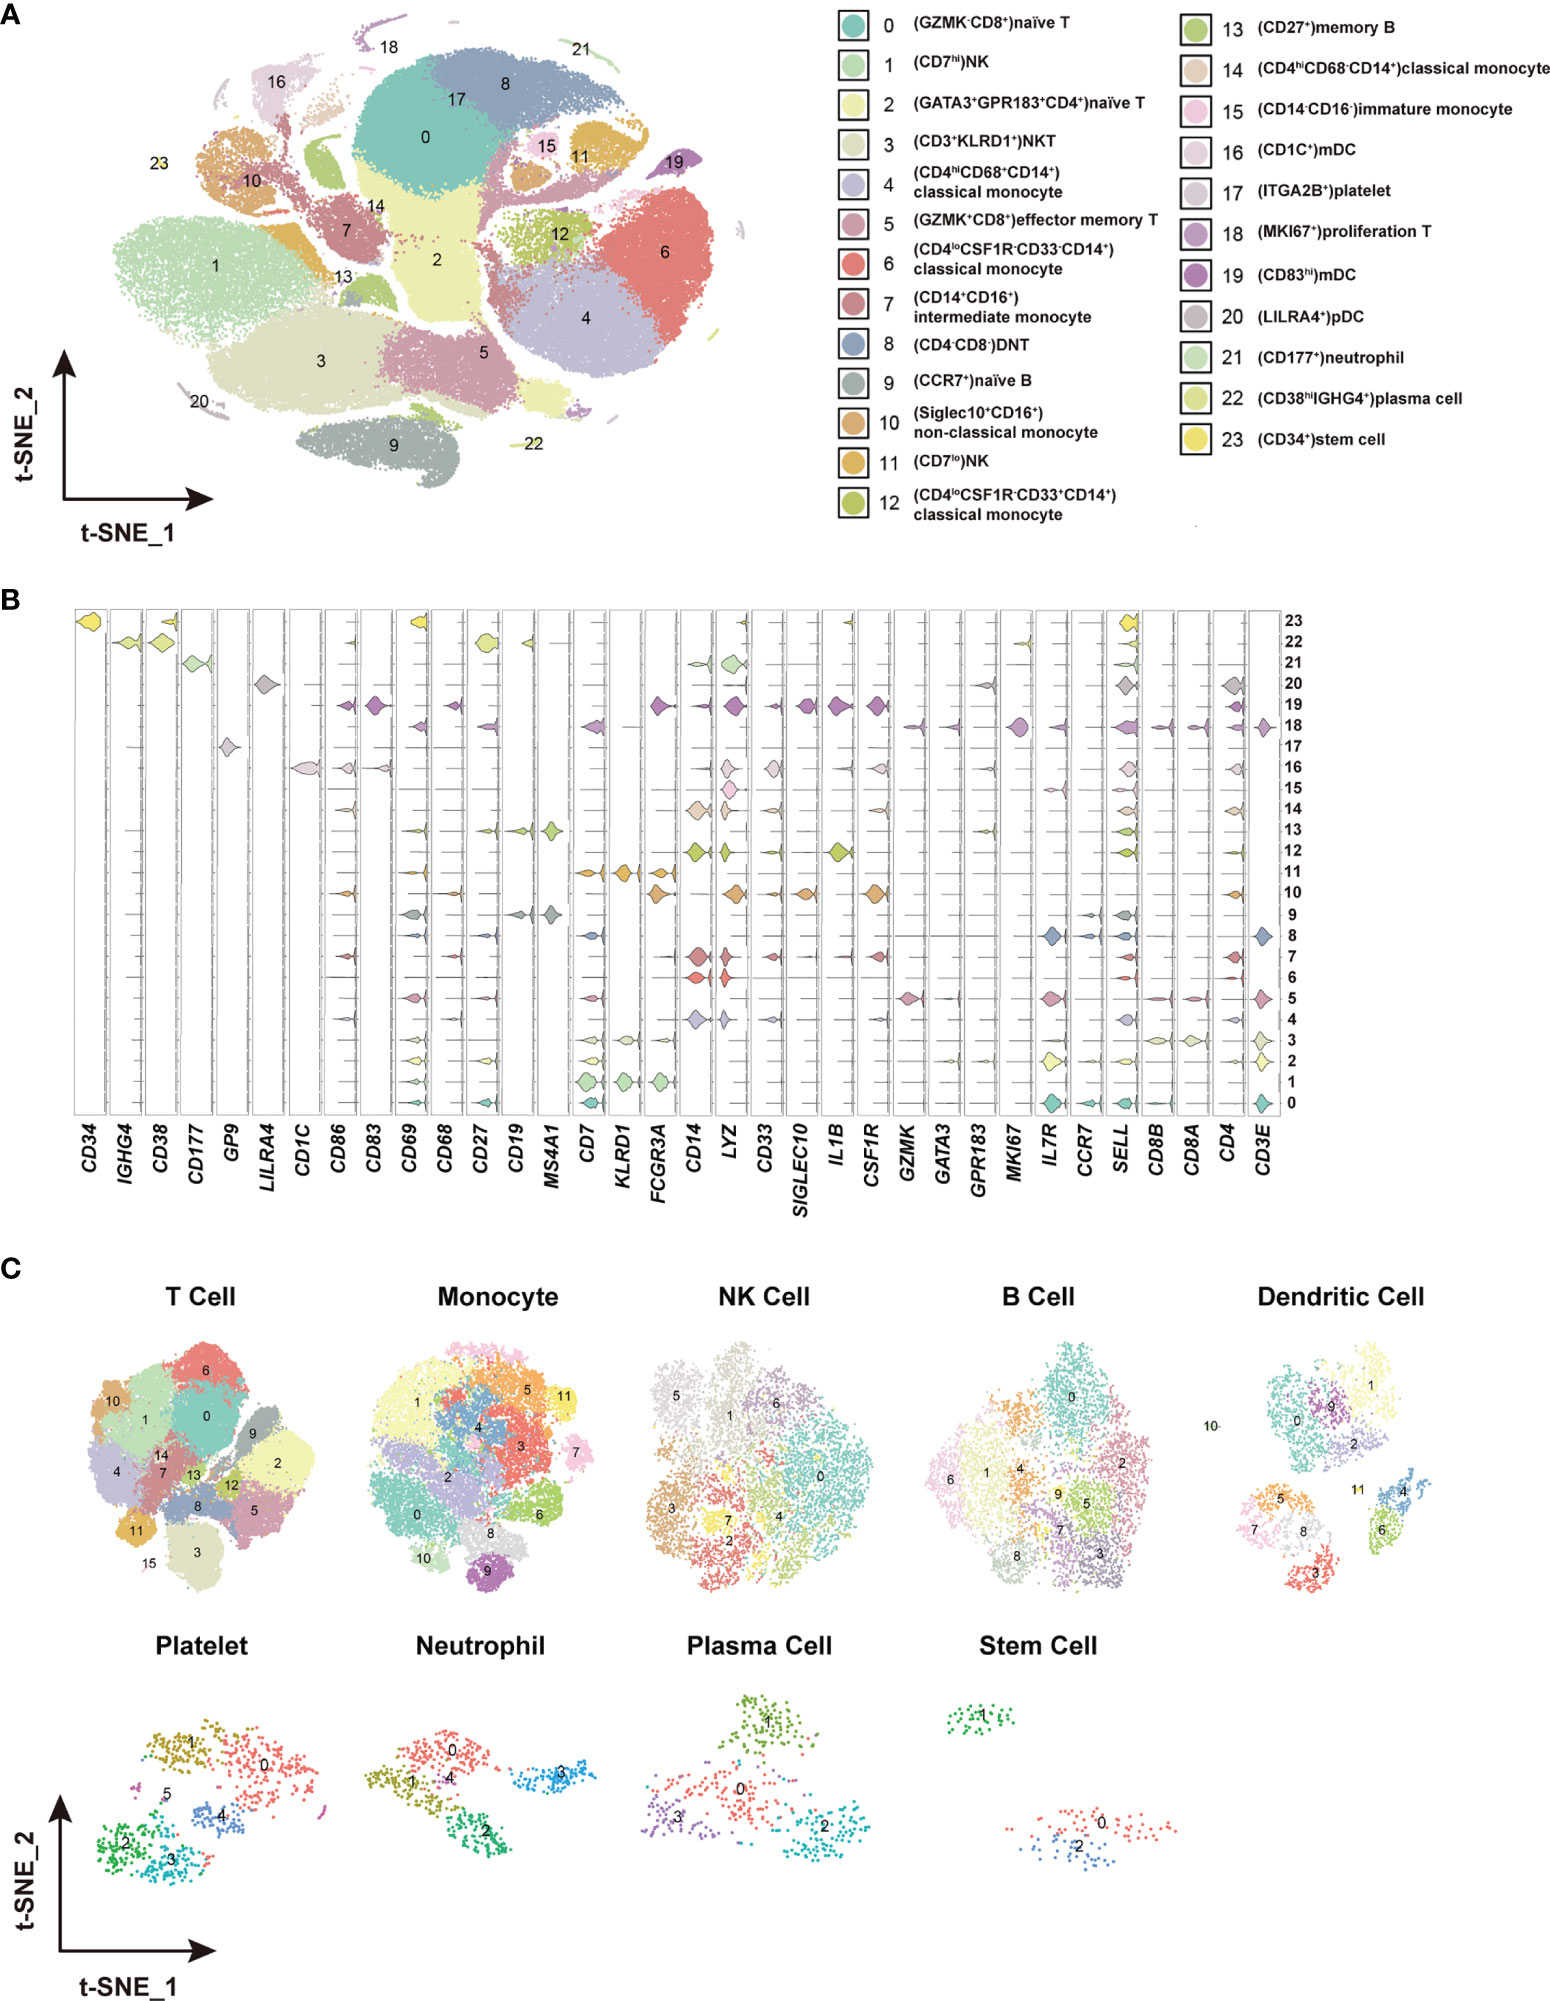
Figure 2 Identification of distinct cell clusters and sub-clusters in the PBMCs. (A) The t-SNE plot showing 24 cell clusters with separate color labels and marked by signature gene. (B) The violin plots showing the expression pattern of the selected cell markers in each of the 24 clusters. The marker gene expression level was calculated via LogNormalize method of the “NormalizeData” function of the Seurat software. (C) The t-SNE plots showing the sub-clusters of T cells, monocytes, NK cells, B cells dendritic cells, platelets, neutrophils, plasma cells and stem cells.
Distinct Immune Cell Subsets Associated With Asymptomatic Infection of SARS-COV-2
To understand the protective and pathogenic immune responses to SARS-CoV-2 infection, we first compared the percentage of each cell type between the healthy controls (HC) and the asymptomatic subjects (AS). We found that (TRAV1-2+CD8+)MAIT cells, (NCAM1hiCD160+) NK cells, (CD4loCSF1R-CD33-CD14+)classical monocytes and (CD33-HLA-DMA-CD14+) classical monocytes increased significantly in the AS group and were positively correlated with the AS (Figures 3A, B and Table 1). We further analyzed the differentially expressed genes (DEGs) in these cell subsets (Table S5). The heatmap in Figure 3C showed the average level of 51 DEGs in the (TRAV1-2+CD8+)MAIT cells from the HC and AS individuals, of which twelve genes (such as CD6, CD69 and KLRB1) were related to immune responses, and five genes (such as KLRB1, KLRG1, and GNLY) were linked to cytotoxicity. Of note, the Killer Cell Lectin Like Receptor B1(KLRB1) and the Killer Cell Lectin Like Receptor G1 (KLRG1), which have been suggested to be involved in innate immune responses, NK cell-mediated cytotoxicity and T cell activations (34, 35), were overexpressed in the AS subjects (Figure 3E). The heatmap in Figure 3D showed the average level of 134 DEGs in the (NCAM1hiCD160+)NK cells from the HC and AS individuals, of which 39 genes (such as GSK3B, CANX and KLRD1) were related to immune responses, and 13 genes (such as DAD1, ATG3, and TRAF2) were linked to apoptosis pathways (Figure 3C). Of note, the Defender Against Cell Death 1 (DAD1) was overexpressed in the AS subjects (Figure 3F). Additional analysis of Gene Ontology (GO) and KEGG pathways revealed significant enrichments in viral transcription (Figure S3C). These findings suggest that the innate immune responses may play important roles in controlling the SARS-CoV-2 infections in the AS individuals.
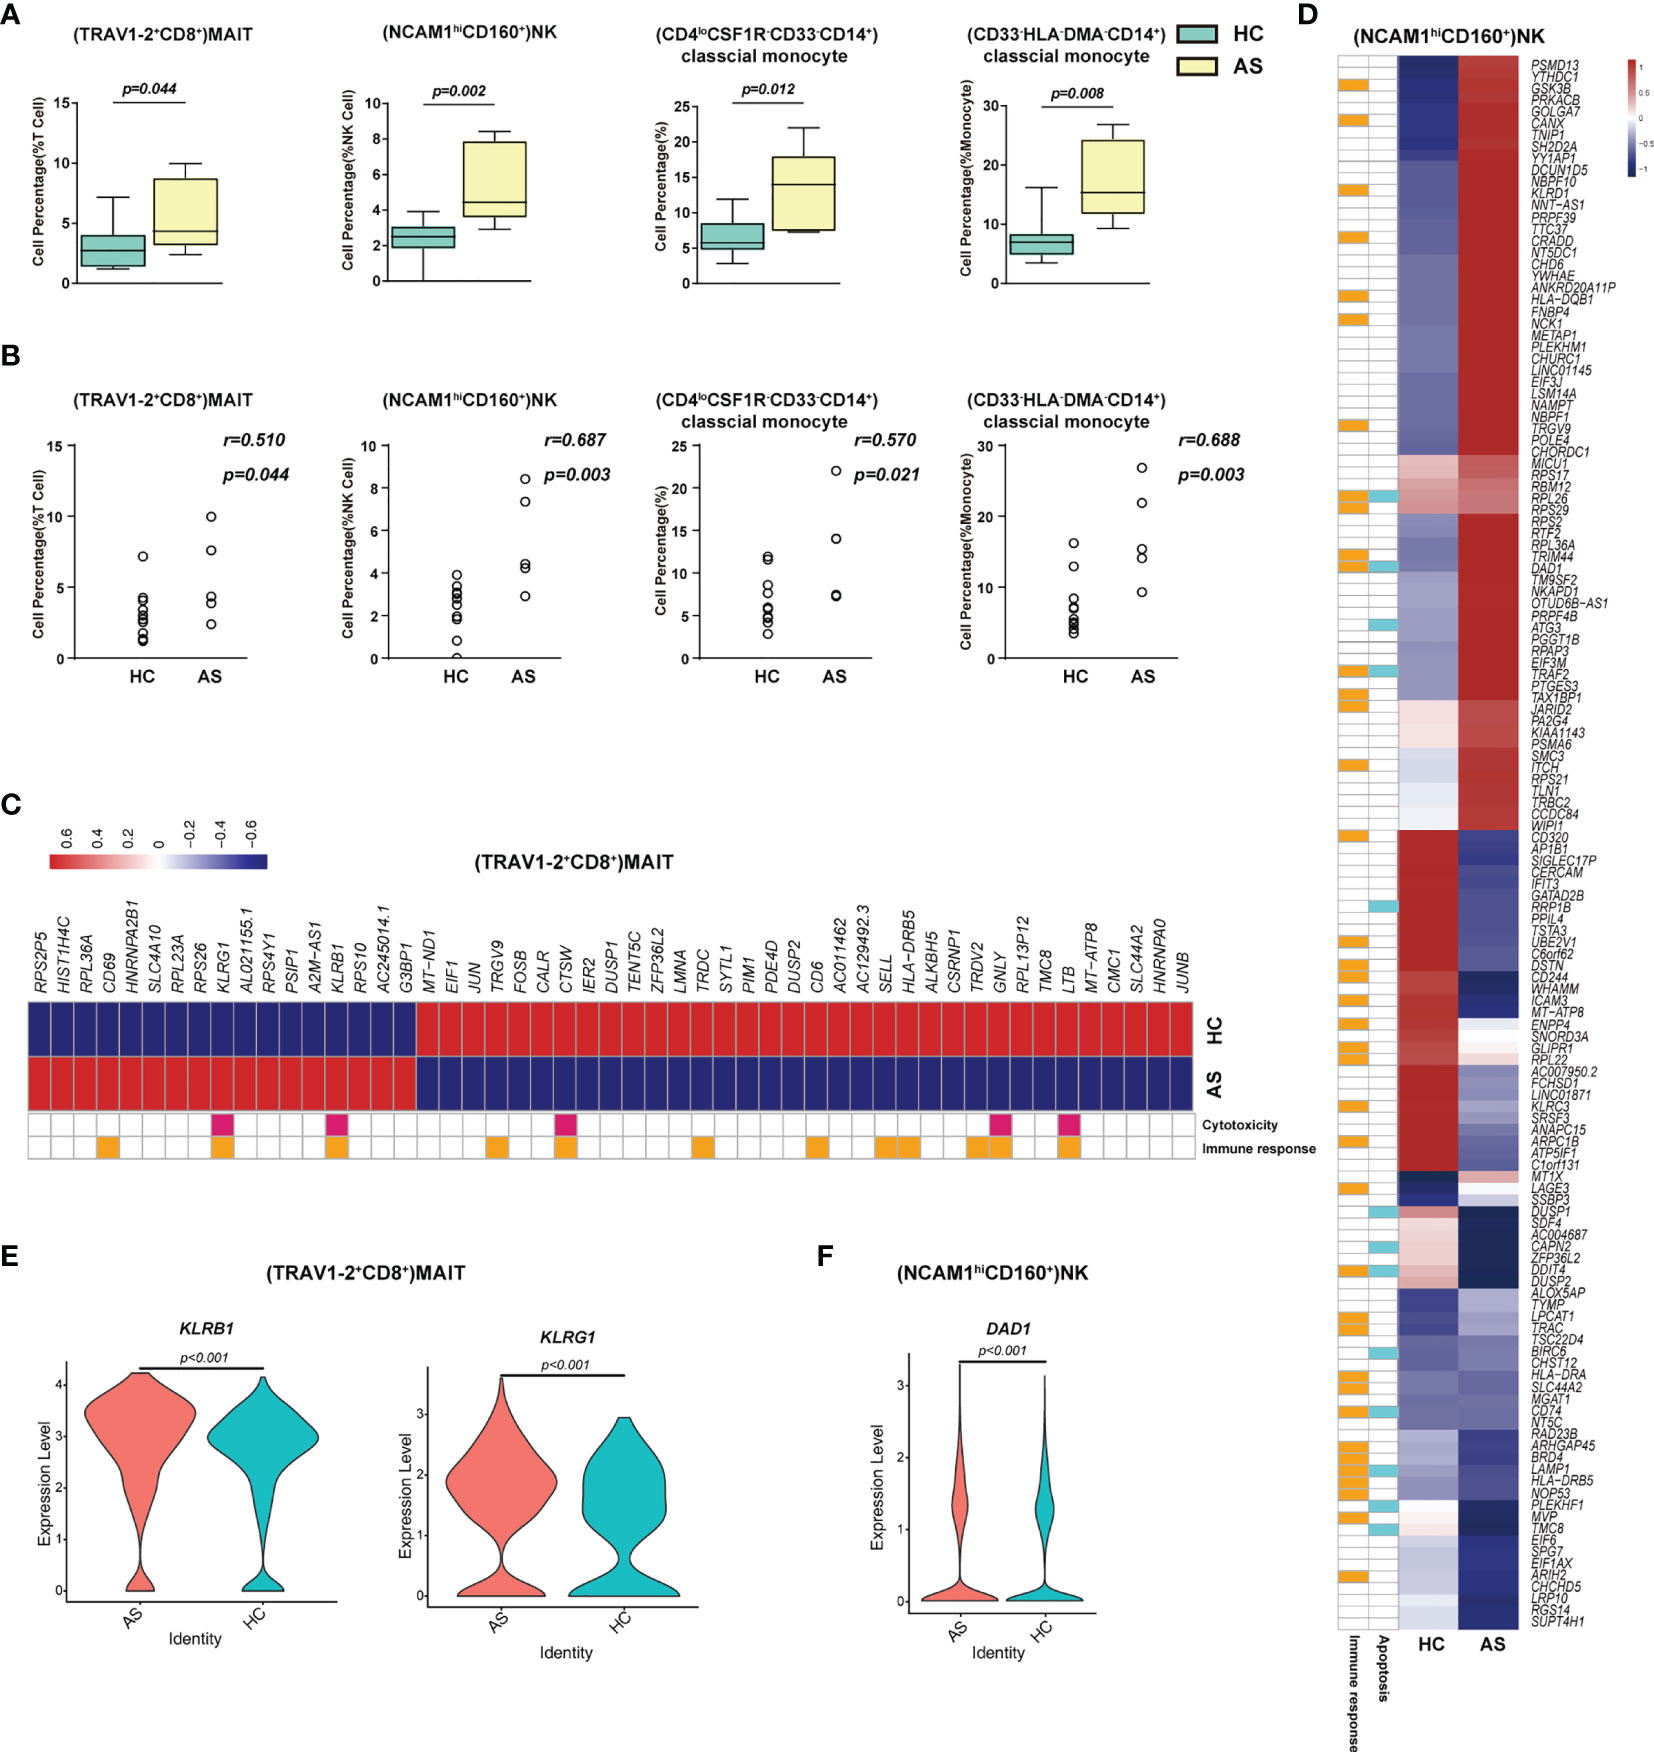
Figure 3 Immune cell subsets associated with asymptomatic COVID-19 patients. (A) The Box and whisker plots showing the percentage of four cell clusters that had significant differences (p < 0.05) HC and AS groups. The horizontal lines, box and whiskers correspond to median values, interquartile range (IQR) and minimum/maximum value, respectively. (B) Spearman rank order correlation analysis showing the percentage of the four cell types described above are positive associated with the asymptomatic state (C) A Heatmap showing the average level of the differentially expressed genes (DEGs) in the (TRAV1-2+CD8+)MAIT cells with p < 0.05 and log2 fold change (FC) ≥0.26 in HC and AS. The gene function (immune responses and cytotoxicity) is indicated in the heatmap. The gene expression was calculated via LogNormalize method of the “NormalizeData” function of the Seurat software. (D) A Heatmap showing the average level of the DEGs in the (NCAM1hiCD160+)NK cells with p < 0.05 and log2 fold change (FC) ≥0.26 in HC and AS. The gene function (immune responses and apoptosis) is indicated in the heatmap. The gene expression was calculated via LogNormalize method of the “NormalizeData” function of the Seurat software. (E) The violin plot showing the expression levels of two representative DEGs (KLRB1 and KLRG1) in (TRAV1-2+CD8+)MAIT cells, which was involved in cytotoxicity and/or immune responses. (F) The violin plot showing the expression levels of one representative DEG (DAD1) in (NCAM1hiCD160+)NK cells, which was involved in apoptosis and/or immune responses (also see Figure S3). p < 0.05 was considered significant. The samples included HC (n=11) and AS (n=5).
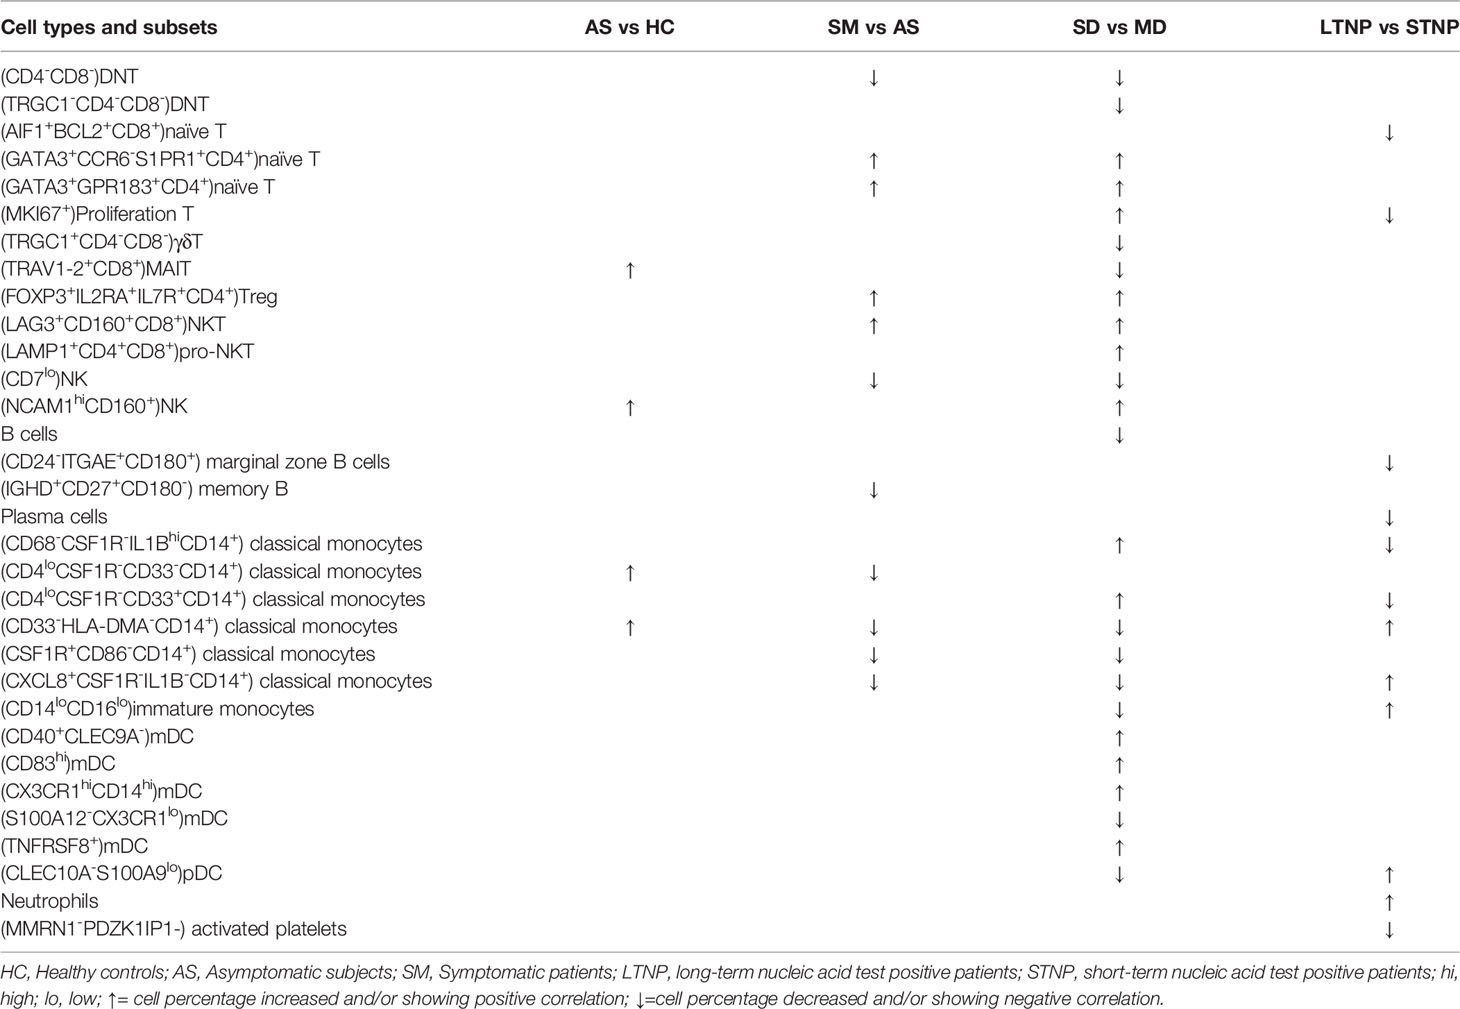
Table 1 Distinct cell subsets associated with various clinical presentations of SARS-CoV-2 infection.
Immune Cell Subsets Associated With the Symptomatic COVID-19 Patients
To identify the potential cell subsets that may contribute to the development of clinical symptoms in COVID-19 patients, we compared the percentage of each cell type between the HC, AS and symptomatic (SM) groups, respectively, and detected 21 cell subsets that either increased or decreased significantly in these groups (Figures 4A, S3A and Table 1). In particular, we observed that (LAG3+CD160+CD8+)NKT cells, (FOXP3+IL2RA+ IL7R+CD4+)Treg cells, (GATA3+GPR183+CD4+)naïve T cells, (GATA3+CCR6-S1PR1+CD4+)naïve T cells, (MKI67+)proliferation T cells, (CCR6+CD4+)Th17 cells, and (LAMP1+ CD4+CD8+)pro-NKT cells increased significantly whereas (CD4-CD8-)DNT (the double negative T cells), (CSF1R+CD86-CD14+)classical monocytes, (CXCL8+CSF1R-IL1B-CD14+)classical monocytes, (AIF1+BCL2+CD8+)naïve T cells, (TRGC1+CD4-CD8-)γδT cells, (CD4loCSF1R-CD33-CD14+)classical monocytes, (CD68+IL1BloCD14+)classical monocytes, (CD33-HLADMA-CD14+)classical monocytes, (CD7lo)NK cells, (IGHD+CD27+ CD80-)memory B cells, (CD1C+)mDC, (LILRA4+)pDC, and (CLEC10A-S100A9-)pDC decreased significantly in the SM patients compared with the AS subjects (Figures 4A and S3A). We further analyzed the differentially expressed genes (DEGs) in these cell subsets to understand the immune responses and pathogenesis of SARS-CoV-2 infection. Here, we showed a representative heatmap with the average level of 89 DEGs in the (LAG3+CD160+CD8+)NKT cells from the HC, AS and SM individuals, of which 35 genes (e.g. CXCR4, IFNG and XCL2) were related to immune responses, and eight genes (RHOB, PMAIP1, CXCR4, MCL1, IFNG, LGALS1, DDIT4 and TNFAIP3) were linked to apoptosis pathways (Figures 4B, C). Additional analysis of Gene Ontology (GO) and KEGG pathways revealed a number of DEGs that were associated with viral transcription, response to cytokines, interferon-gamma-mediated signaling pathway, TNF signaling pathway, Th1 and Th2 cell differentiation, Th17 cell differentiation, antigen processing and presentation, and other pathways (Figures 4E, F and S3B–D). Of note, all the genes associated with the apoptosis pathways were up-regulated in the SM group, indicating that (LAG3+CD160+CD8+)NKT cells may play a critical role in the pathogenesis of COVID-19.
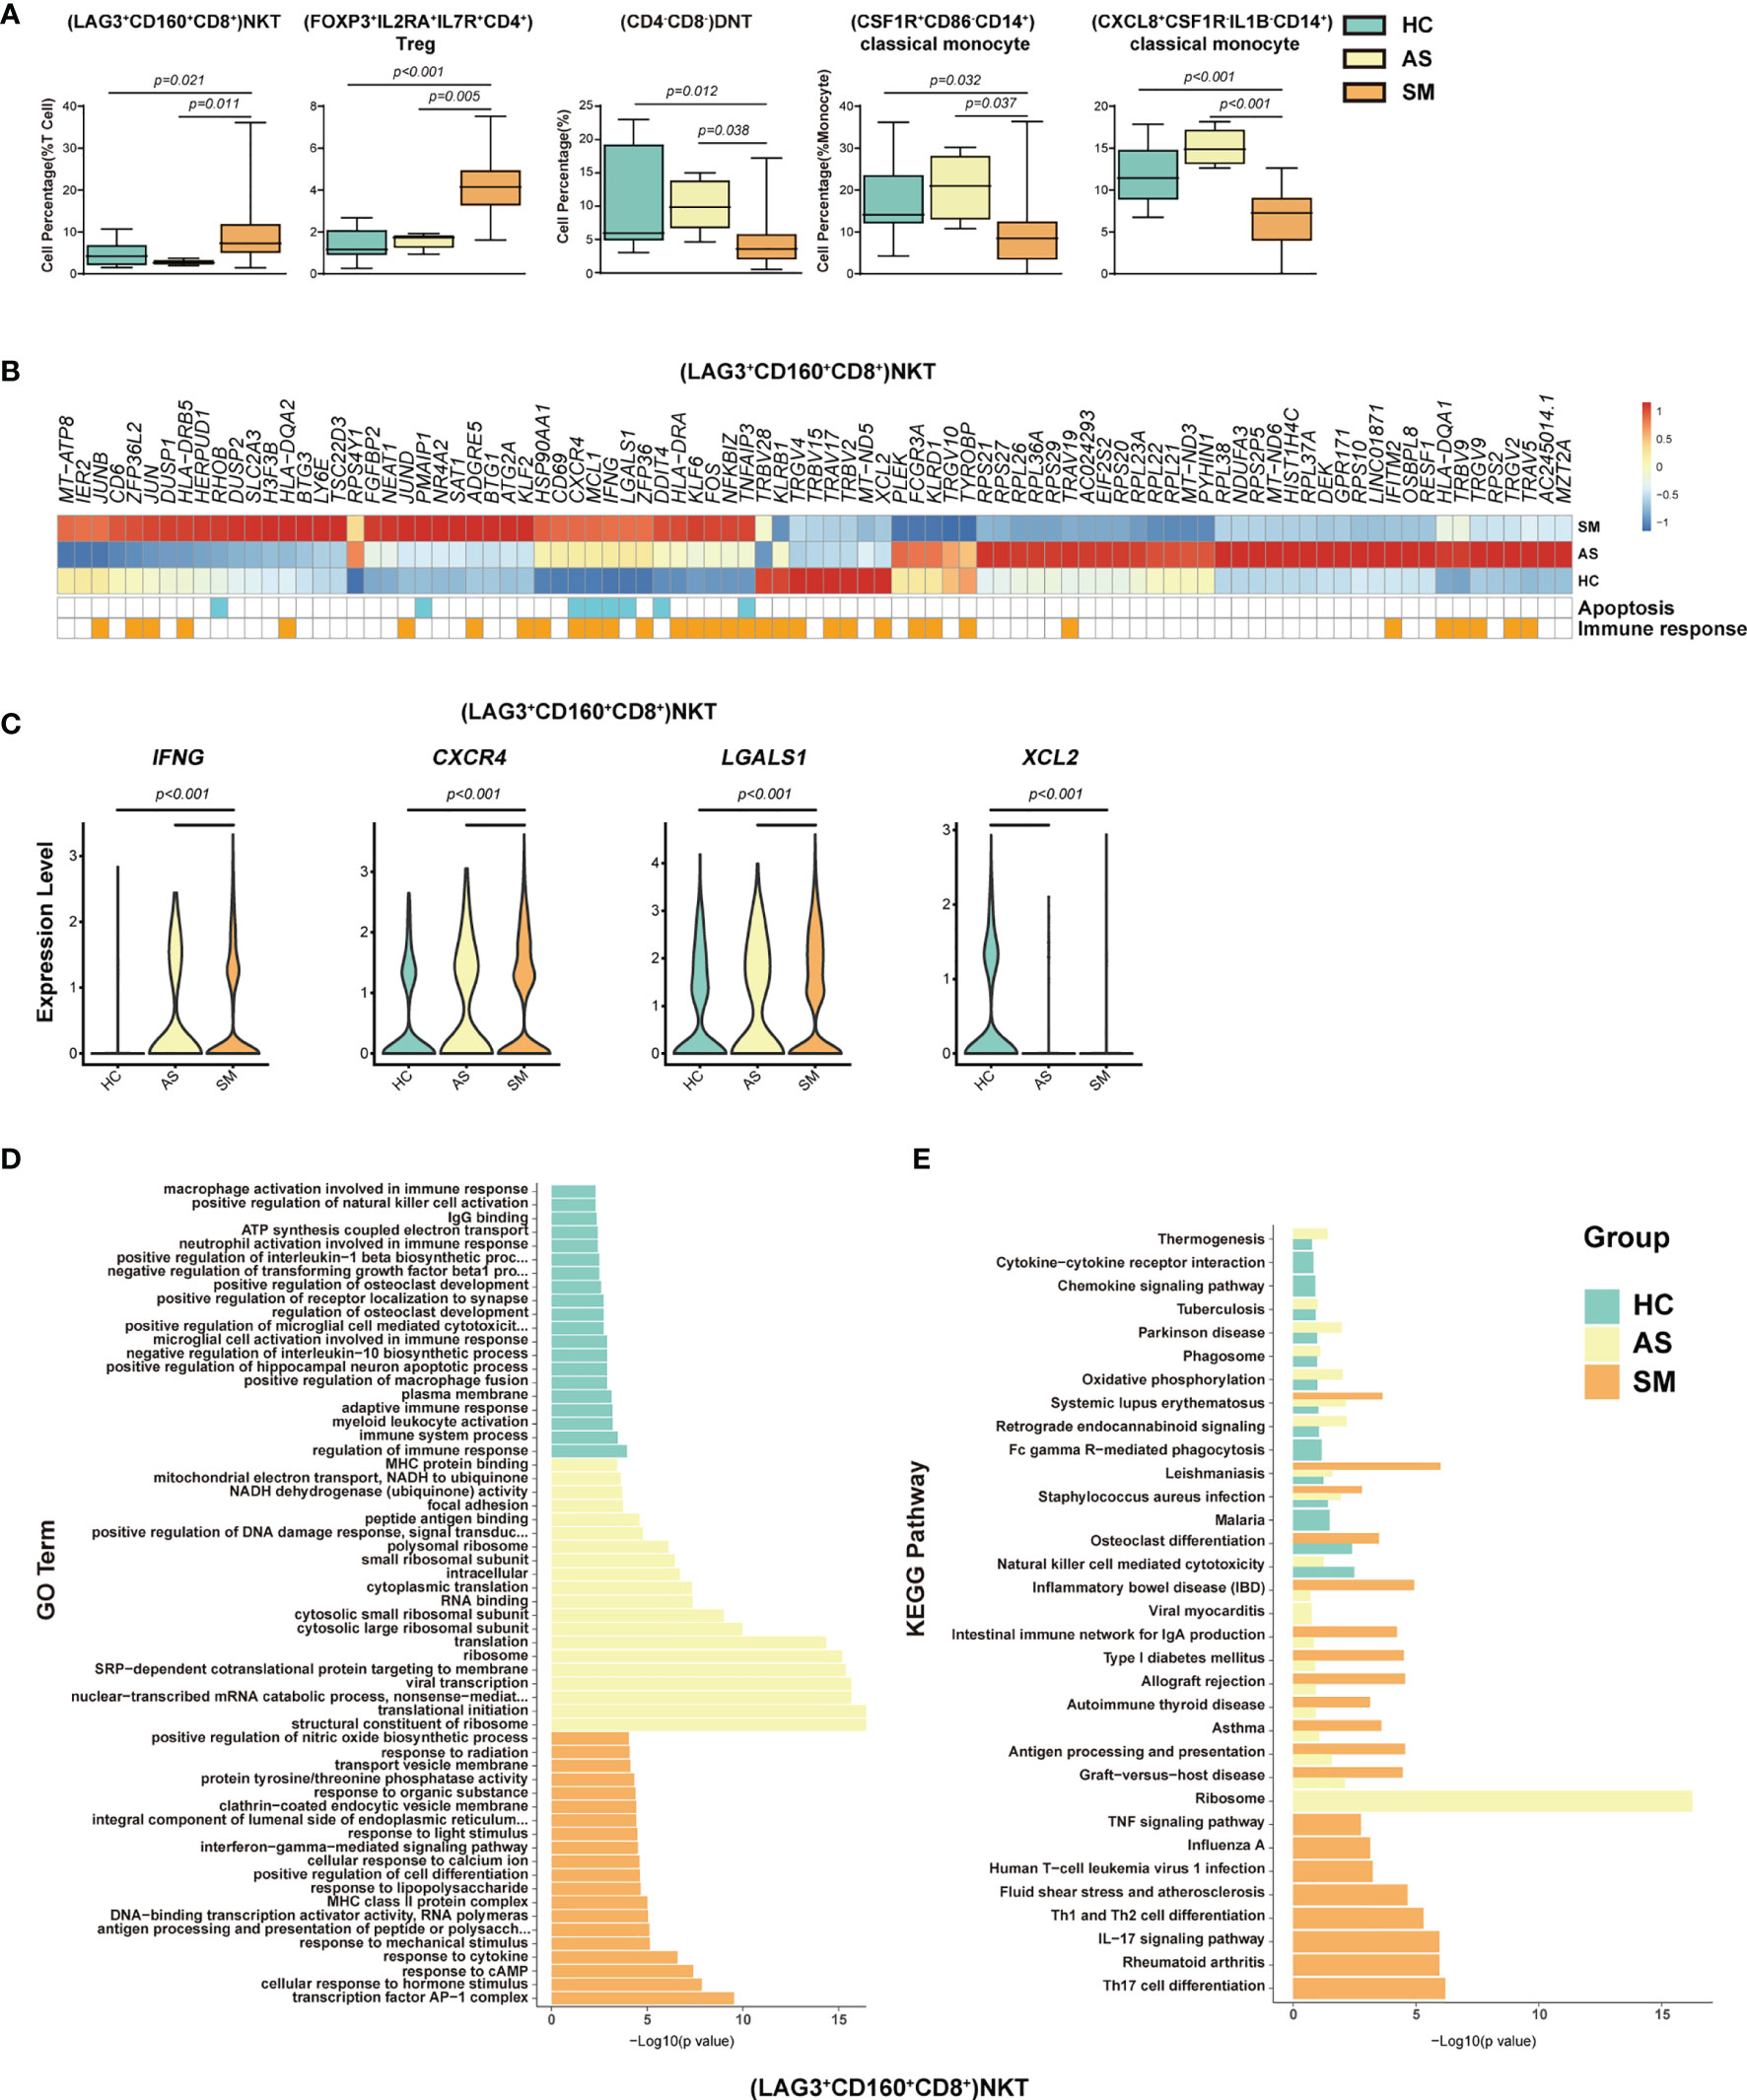
Figure 4 Immune cell subsets associated with symptomatic COVID-19 patients. (A) The Box and whisker plots showing the percentage of five distinct cell clusters that exhibited significant differences (p < 0.05) between HC, AS, and SM groups. The horizontal lines, box and whiskers correspond to median values, interquartile range (IQR) and minimum/maximum value, respectively. (B) A Heatmap showing the average level of the DEGs in the (LAG3+CD160+CD8+)NKT cells with p < 0.05 and log2 fold change (FC) ≥0.26 in HC, AS and SM. The gene function (immune responses and apoptosis) is indicated in the heatmap. The gene expression was calculated via LogNormalize method of the “NormalizeData” function of the Seurat software. (C) The violin plots showing the expression levels of four representative DEGs (IFNG, CXCR4, LGALS1, and XCL2) in (LAG3+CD160+CD8+)NKT cells, which were involved in apoptosis and/or immune responses. (D) Gene Ontology (GO) analysis. Top 20 significant GO terms sorted by − Gene Ontology (GO) analysis. Top 20 significant GO ter+CD160+CD8+)NKT cells. (E) KEGG pathway analysis. Top 20 significant KEGG pathways sorted by −log10 (p value) from HC, AS, and SM were shown in (LAG3+CD160+CD8+)NKT cells (also see Figure S3). p < 0.05 was considered significant. The samples included HC (n=11), AS (n=5) and SM (n=35, total 33 patients and two patients were sampled twice at different disease stages).
Immune Cell Subsets Associated With the Disease Severity of COVID-19
To delineate the immune cell subsets associated with the disease severity of COVID-19, we compared the percentage of each cell type, cluster and sub-cluster between HC, AS, MD, SD, and SDR, respectively. We identified 27 distinct cell subsets that increased or decreased significantly in these groups, 23 of which were positively or negatively correlated with the disease severity by the Spearman rank order correlation analysis (Figures 5A, B, S4A, B and Table 1). When we compared the SD with MD, we observed that (GATA3+CCR6-S1PR1+CD4+)naïve T, (GATA3+GPR183+CD4+)naïve T, (MKI67+)Proliferation T, (FOXP3+IL2RA+IL7R+CD4+)Treg, (LAG3+CD160+CD8+)NKT, (LAMP1+CD4+CD8+)pro-NKT, (NCAM1hiCD160+)NK, (CD68-CSF1R-IL1BhiCD14+)classical monocytes, (CD4loCSF1R-CD33+CD14+)classical monocytes, (CD40+CLEC9A-)mDC, (CD83hi)mDC, (CX3CR1hiCD14hi)mDC and (TNFRSF8+)mDC increased significantly, whereas (CD4-CD8-)DNT, (TRGC1-CD4-CD8-)DNT, (TRGC1+CD4-CD8-)γδT, (TRAV1-2+CD8+)MAIT, (CD7lo)NK, (CD33-HLA-DMA-CD14+)classical monocytes, (CSF1R+CD86-CD14+)classical monocytes, (CXCL8+CSF1R-IL1B-CD14+)classical monocytes, (CD14loCD16lo)immature monocytes, (S100A12-CX3CR1lo)mDC, and (CLEC10A-S100A9lo)pDC decreased significantly (Figures 5A, B, S4A, B, and Table 1). Here, we showed (CD68-CSF1R-IL1BhiCD14+)classical monocytes as a representative cell subset that was positively correlated with the disease severity (Figures 5A, B).
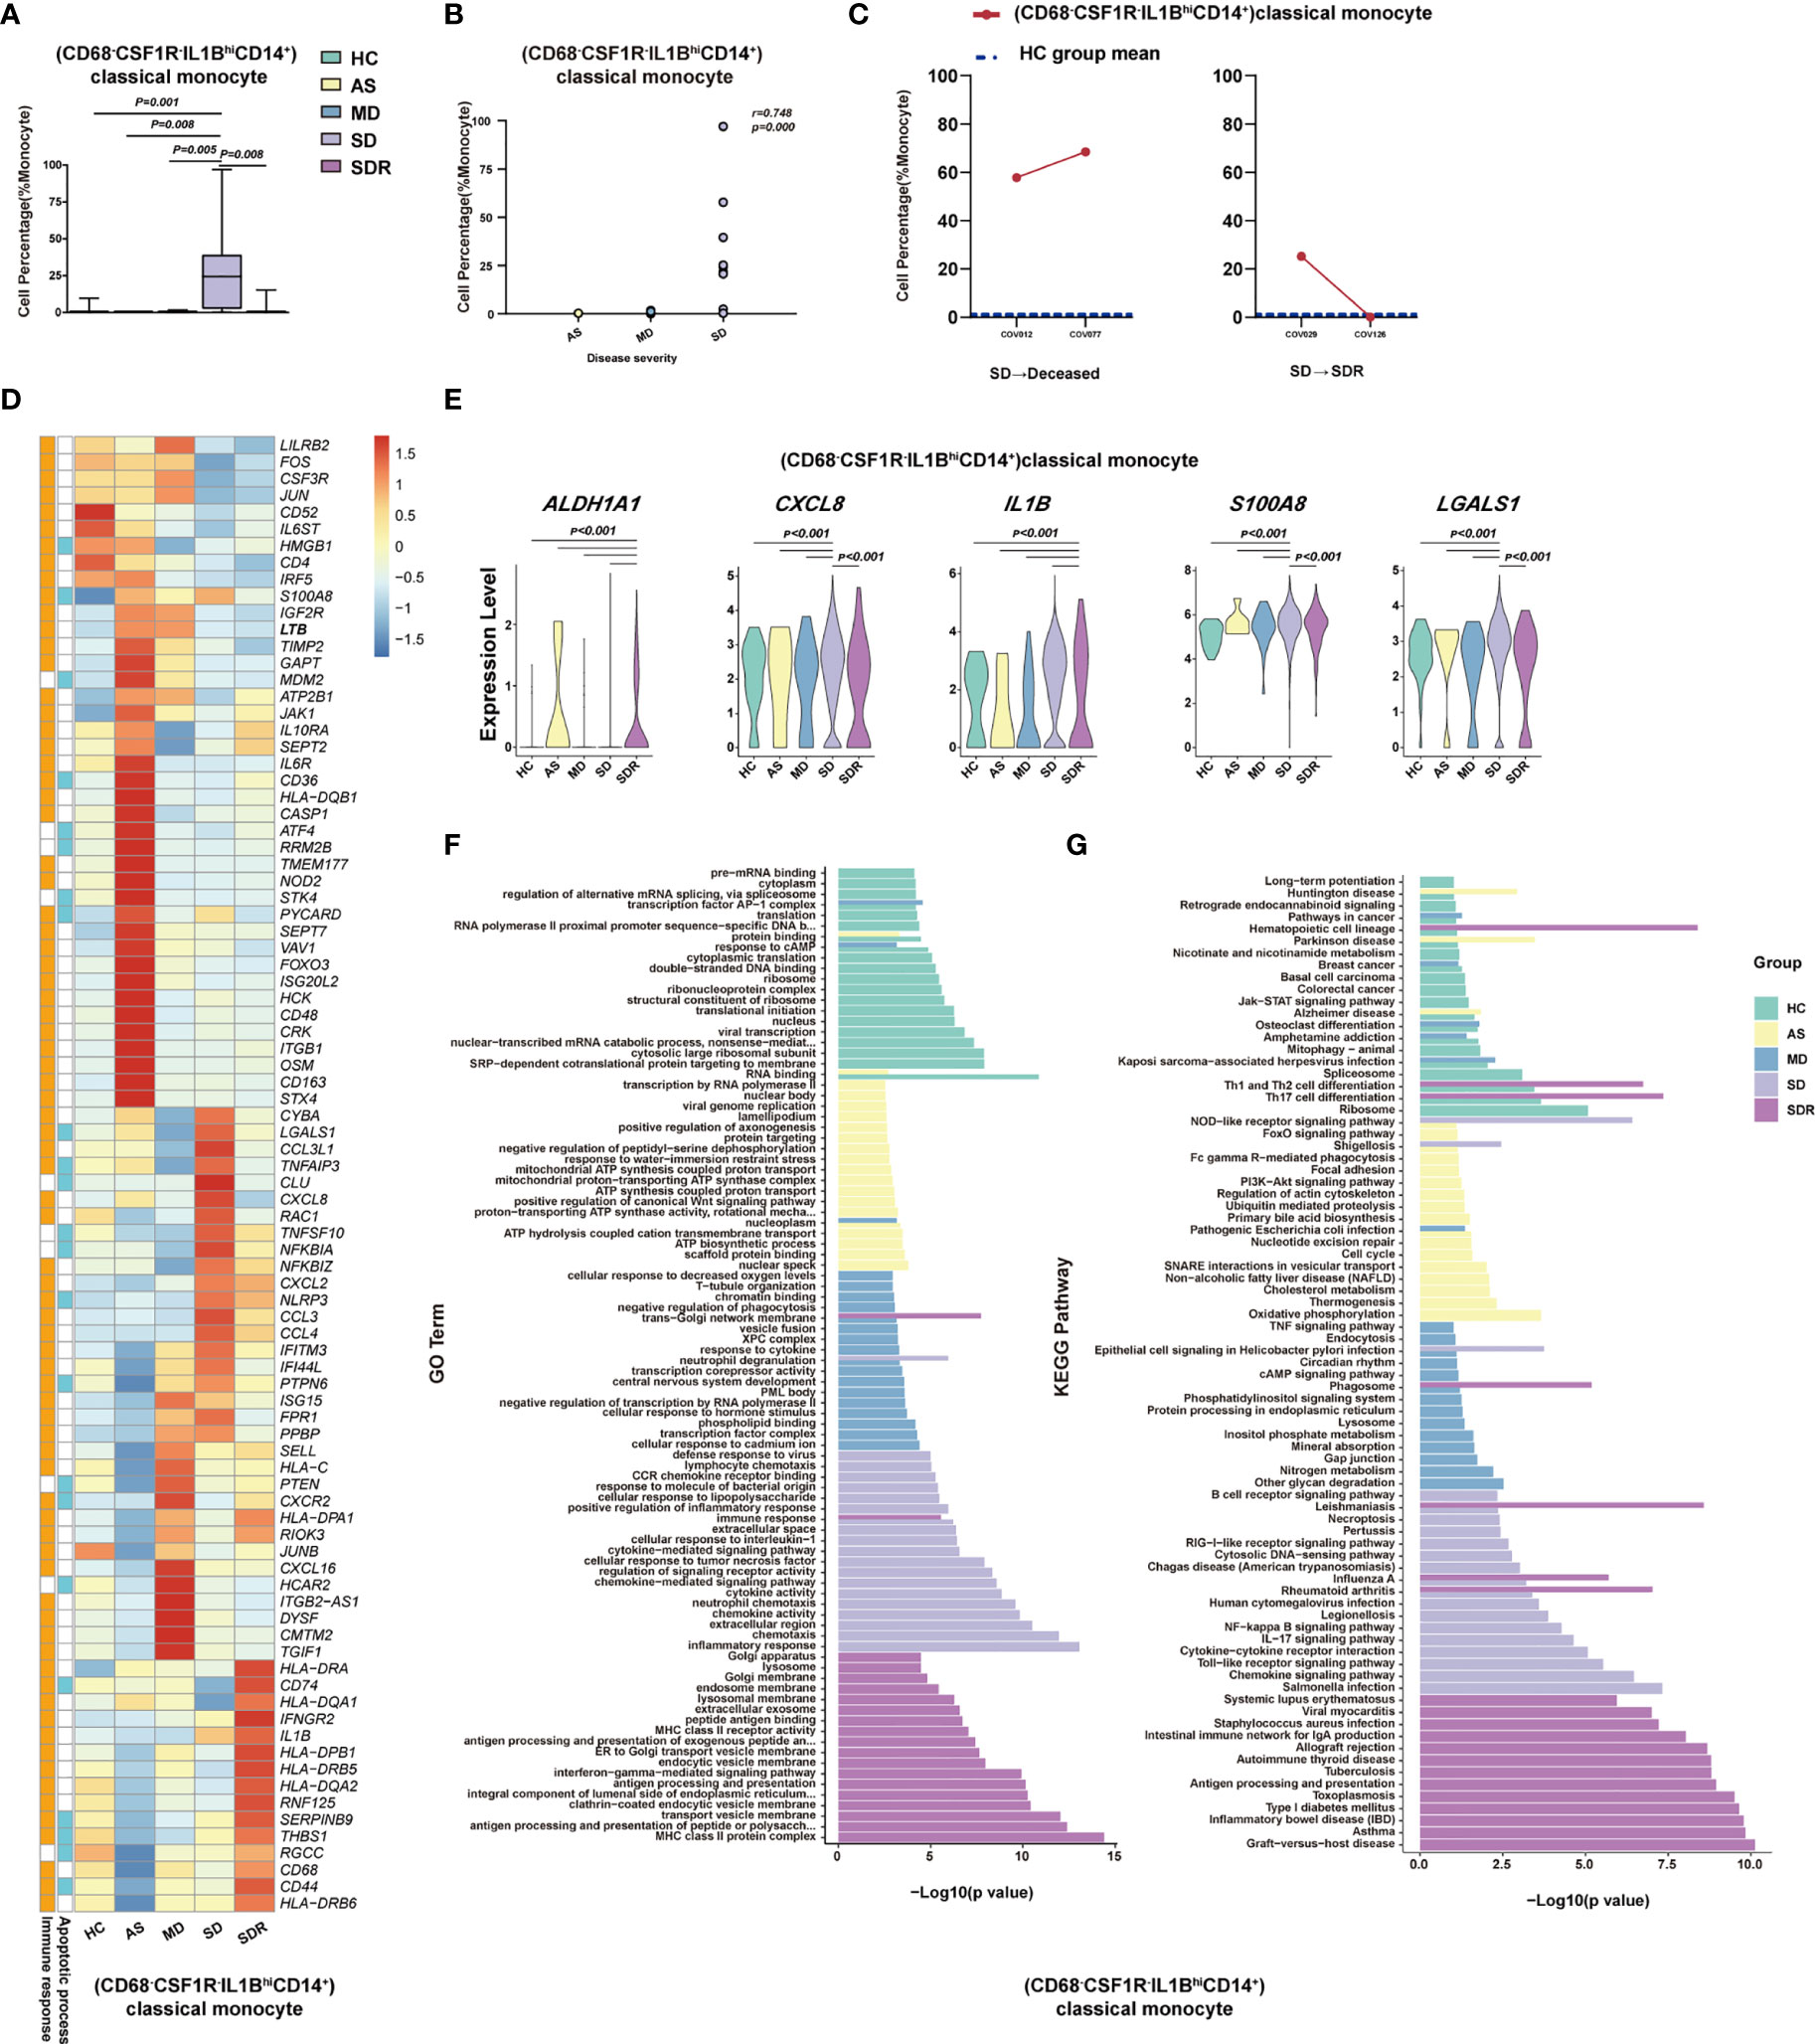
Figure 5 (CD68-CSF1R-IL1BhiCD14+)classical monocyte correlated with disease severity of COVID-19 patients. (A) The Box and whisker plots showing the percentage of (CD68-CSF1R-IL1BhiCD14+)classical monocytes that showed significant differences (p< 0.05) between the HC, AS, MD, SD and/or SDR groups. The horizontal lines, box and whiskers correspond to median value, interquartile range (IQR) and minimum/maximum value, respectively. (B) Spearman rank order correlation analysis showing the significant associations between (CD68-CSF1R-IL1BhiCD14+)classical monocytes with the disease severity. (C) The alternation trend of (CD68-CSF1R-IL1BhiCD14+)classical monocytes in the fatal patient (COV012/COV077) and one recovery SD patient (COV029/COV126). (D) The Heatmap showing the average level of the DEGs in the (CD68-CSF1R-IL1BhiCD14+)classical monocytes with p< 0.05 and log2 fold change (FC) ≥0.26 in HC, AS, MD, SD, and SDR. The gene function (immune responses and apoptosis) is indicated in the heatmap. The gene expression was calculated via LogNormalize method of the “NormalizeData” function of the Seurat software. (E) The violin plots showing the expression levels of five representative DEGs (ALADH1A1, CXCL8, IL1B, S100A8, and LGALS1) in (CD68-CSF1R-IL1BhiCD14+)classical monocytes, which were involved in apoptosis and/or immune responses. (F) Gene Ontology (GO) analysis. Top 20 significant GO terms sorted by −log10 (p) value from HC, AS, MD, SD, and SDR were shown, respectively. (G) KEGG pathway analysis. Top 20 significant KEGG pathways sorted by −log10 (p value) from HC, AS, MD, SD, and SDR were shown, respectively (also see Figure S4). p< 0.05 was considered significant. The samples included HC (n=11), AS (n=5), MD (n=13), SD (n=11, one patient was sampled twice at different disease stages) and SDR (n=11, one sample was sampled at different disease stages).
To investigate whether (CD68-CSF1R-IL1BhiCD14+)classical monocytes were associated with the disease progression, we examined two SM patients who had PBMC samples collected at two different time-points, including patient #1 (a fatal patient): COV012 (time-point 1) and COV077 (time-point 2); and patient #2 (an SD patient at the recovery stage): COV029 (time-point 1) and COV126 (time-point 2). We observed that (CD68-CSF1R-IL1BhiCD14+)classical monocytes dramatically increased in both time points in the fatal patient (COV012→ COV077), and the second time point was higher than the first one (Figure 5C). In contrast, for the SD patient at the recovery stage (SDR) (COV029→COV126), the percentage of (CD68-CSF1R-IL1BhiCD14+)classical monocytes at the second time point resumed to the level similar to the healthy control (HC) group (Figure 5C), suggesting that (CD68-CSF1R-IL1BhiCD14+)classical monocytes may play an important role in the pathogenesis of COVID-19.
We also analyzed the DEGs in these cell subsets and presented a representative heatmap showing the average level of 88 DEGs in the (CD68-CSF1R-IL1BhiCD14+)classical monocytes in the HC, AS, MD, SD and SDR individuals. Most of the DEGs were related to immune responses and apoptosis pathways (Figure 5D), such as ALADH1A1, CXCL8, IL1B, S100A8, and LGALS1 (Figure 5E). The DEGs were also detected in other cell subsets, such as (CD4-CD8-)DNT cells, (TRGC1+CD4-CD8-)γδT cells, (CD4loCSF1R-CD33+CD14+)classical monocytes and (CLEC10A-S100A9lo)pDC (Figure S4C, D). Additional analysis of the GO and KEGG pathways revealed a number of DEGs that were involved in chemotaxis, inflammatory and immune responses, and the signaling pathways of chemokine, NF-kappa B, IL-17, Toll-like receptor and apoptosis (Figures 5F, G and S4E, F).
Immune Cell Subsets Associated With the Viral Persistence of SARS-CoV-2 Infection
To understand the immune cell alternations associated with the LTNP and STNP, we compared the percentage of each of the major cell types and 76 cell subsets, and found that the LTNP subjects had significant increases in (CD33-HLA-DMA-CD14+)classical monocytes, (CXCL8+CSF1R-IL1B-CD14+)classical monocytes, (CD14loCD16lo)immature monocytes, and (CLEC10A-S100A9-)pDC and neutrophils, as well as significant decreases in (AIF1+BCL2-CD4+)naive T cells, (MKI67+)proliferation T cells, (CD24-ITGAE+CD180+)marginal zone B cells, plasma cells, (CD68-CSF1R-IL1BhiCD14+)classical monocytes, and (CD4loCSF1R-CD33+CD14+)classical monocytes (Figure 6A, S5A, and Table 1). The Spearman rank order correlation analysis suggested that (CD33-HLA-DMA-CD14+)classical monocytes, (CLEC10A-S100A9-)pDC, (CXCL8+CSF1R-IL1B-CD14+)classical monocytes, (CD14loCD16lo)immature monocytes, and neutrophil were positively correlated with LTNP, whereas (CD24-ITGAE+CD180+)marginal zone B cells and (MMRN1-PDZK1IP1-)activated platelets were negatively correlated with LTNP (Figure 6B, S5B, and Table 1). Additional analysis of DEGs on two representative cell subsets found that the expression level of S100A8, S100A9, S100A12, CXCL8, KIF6, IFITM2, IFITM3, and IL1B significantly increased in STNP whereas CD74, CD52, HLA-DRB5, IL17RA, TNFSF10, IFI30, ITGA4, and LILRP1 significantly increased in LTNP in the (CD33-HLA-DMA-CD14+)classical monocytes (Figure 5C, D). On the other hand, HLA-DRB5, S100A4, HLA-DQA2, BTG1, PECAM1, IFITM3, S100A8, S100A9, CD48, CD68, and SIGLEC6 significantly increased in LTNP in the (CLEC10A-S100A9-)pDC (Figures 6C, D). The GO and KEGG analysis showed significant enrichments in antigen processing and presentation, neutrophil aggregation, chemokine production, Th1 and Th2 cell differentiation and other pathways (Figures 6E, F). To our knowledge, this is the first scRNA-seq study showing the immune cell alternations associated with the viral persistence of SARS-CoV-2 infection.
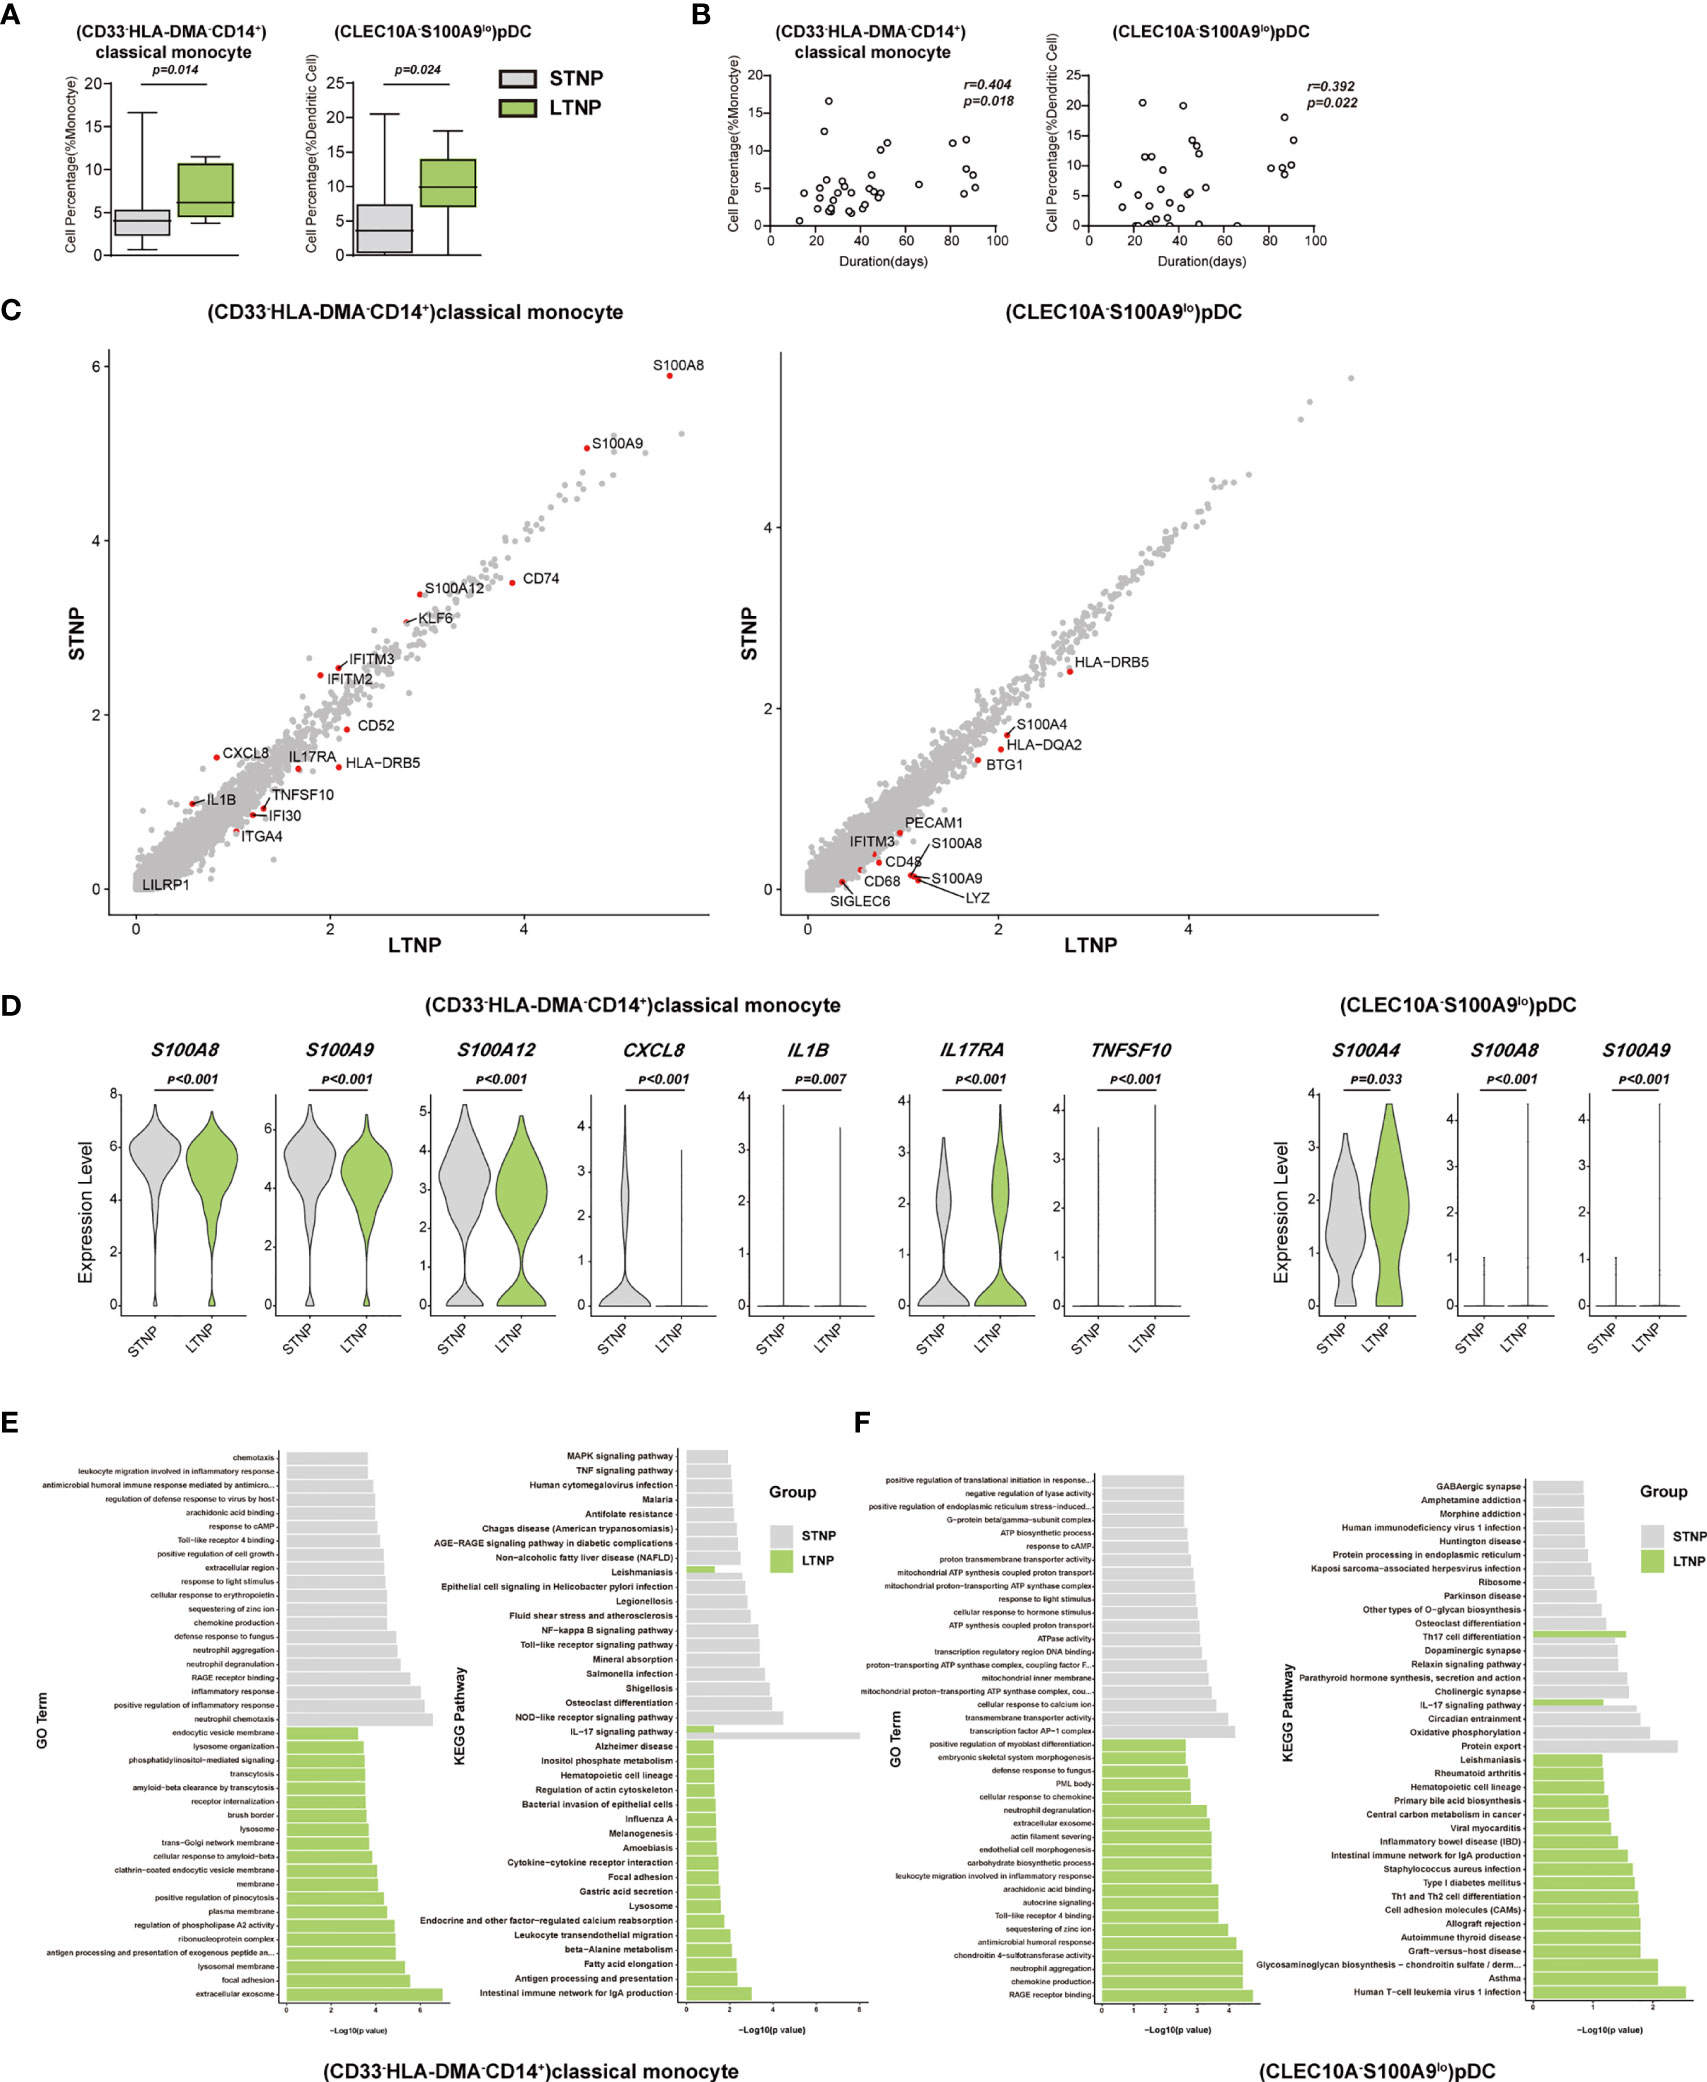
Figure 6 (CD33-HLA-DMA-CD14+)classical monocytes and (CLEC10A-S100A9lo)pDC were positively correlated with the viral persistence. (A) The Box and whisker plots showing the percentage of (CD33-HLA-DMA-CD14+)classical monocytes and (CLEC10A-S100A9lo)pDC that had significant differences (p < 0.05) between the STNP and LTNP groups, respectively. The horizontal lines, box and whiskers correspond to median values, interquartile range (IQR) and minimum/maximum value, respectively. (B) Spearman rank order correlation analysis showing the (CD33-HLA-DMA-CD14+)classical monocytes and (CLEC10A-S100A9lo)pDC were positively correlated with the viral persistence. (C) The M-versus-A (MA) plots showing the differentially expressed genes (DEGs) in the (CD33-HLA-DMA-CD14+)classical monocytes and (CLEC10A-S100A9lo)pDC with p < 0.05 and log2 fold change (FC) ≥0.26 in STNP and LTNP. The gene expression was calculated via LogNormalize method of the “NormalizeData” function of the Seurat software. The X and Y axis represent log (1+average expression value), respectively. (D) The violin plots showing the expression levels of seven representative DEGs (S100A8, S100A9, S100A12, IL17RA, TNFSF10, CXCL8, and IL1B) in (CD33-HLA-DMA-CD14+)classical monocytes and three representative DEGs (S100A4, S100A8, S100A9) in (CLEC10A-S100A9lo)pDC. (E) Gene Ontology (GO) and KEGG analysis for (CD33-HLA-DMA-CD14+)classical monocytes. Top 20 significant GO terms and KEGG pathways sorted by −log10 (p value) from STNP and LTNP were shown. (F) GO and KEGG analysis for (CLEC10A-S100A9lo) pDC. Top 20 significant GO terms and KEGG pathways sorted by −log10 (p value) from STNP and LTNP were shown (also see Figure S5). p < 0.05 was considered significant. The samples included LTNP (n=12) and STNP (n=21).
Discussion
In this study, we identified a huge number of distinct cell subsets that were associated with asymptomatic infection, disease severity, and viral persistence in COVID-19 patients. In particular, we revealed that (TRAV1-2+CD8+)MAIT cells and (NCAM1hiCD160+)NK cells were significantly enriched in the AS subjects compared with the HC individuals (Figure 4A, Table 1 and Table S2). On the other hand, (TRAV1-2+CD8+)MAIT cells were negatively correlated with the disease severity in COVID-19 patients (Table 1). The mucosa-associated invariant T (MAIT) cells were suggested to be associated with the mucosa immunity to a variety of microbial infections (36–39). In addition, recent studies reported that MAIT cells significantly declined in COVID-19 patients with severe diseases and resumed to normal level when the disease was resolved (40–42). These findings suggest that (TRAV1-2+CD8+)MAIT cells might be involved in the protective immune responses against SARS-CoV-2 infection.
Natural killer (NK) cells are important components of the innate and adaptive immune responses and have been suggested to play protective or pathogenic roles in the pathogenesis of human diseases, including SARS-CoV-2 infections (43–49). In this study, (NCAM1+CD160+)NK cells increased significantly in all of the SARS-CoV-2 infected individuals compared to the HC (Figures 3A, B, and Table 1) and were positively correlated with the disease severity (Figure S4B), suggesting that this NK cell subset may play both protective and pathogenic roles in the pathogenesis of COVID-19. In contrast, (CD7lo)NK cells decreased significantly in all of the SARS-CoV-2 infected individuals compared to the HC and were negatively correlated with the disease severity (Figure S4B), indicating that this NK cell subset may function differently from (NCAM1+CD160+)NK cells. Moreover, our results also suggest that (CD4loCSF1R-CD33-CD14+) and (CD33-HLA-DMA-CD14+) classical monocytes were involved in the innate immune responses against SARS-CoV-2 infections. Therefore, it is possible that robust innate immune responses may control the virus replication and allow sufficient time to mount acquired immune responses, resulting in an asymptomatic infection and disease-free state in the AS subjects.
Natural killer T cells (NKT) and regulatory T cells (Treg) have been suggested to play important roles in immune responses to viral infections and tumors (50–58). In this study, (LAG3+CD160+CD8+)NKT and (FOXP3+IL2RA+IL7R+)Treg cells increased significantly in the SM patients (Figure 4B). In addition, we observed a trend towards increasing levels of these cell subsets in the SD patients. The differentially expressed genes (DEGs) in the (LAG3+CD160+CD8+)NKT cells (e.g. IFNG, CXCR4, LGALS1 and XCL2) and (FOXP3+IL2RA+IL7R+) Treg cells (e.g. CCR7, IFI16, TNFRSF4 and TNFRSF18), which were linked to immune responses, inflammation and apoptosis, suggest that these cells may contribute to the development of clinical symptoms and the subsequent disease progression (Figures 4C–F and S3B–D). Since (LAG3+CD160+ CD8+)NKT cells were also positively correlated with the disease severity, suggesting that it may function as a double edge sword, playing both protective and pathogenic roles in the pathogenesis of COVID-19.
Myeloid cell subsets, such as monocytes, macrophages, dendric cells and neutrophils have been suggested to be involved in a variety of inflammatory responses, including the pathogenesis of COVID-19 (19, 25, 59–67). In this study, we identified a large number of myeloid cell subsets that were associated with the disease severity and viral persistence in the COVID-19 patients (Table 1). Notably, (CD4loCSF1R-CD33-CD14+), (CD33-HLA-DMA-CD14+), (CSF1R+CD86-CD14+) and (CXCL8+CSF1R-IL1B-CD14+) classical monocytes decreased significantly in the SM patients (Table 1), suggesting that these cell subsets may negatively associated with the disease symptoms. On the other hand, (CD68-CSF1R-IL1BhiCD14+) and (CD33-HLADMA-CD14+) classical monocytes were positively correlated with the disease severity and were associated with aggregation of neutrophils. Of note, (CD68-CSF1R-IL1BhiCD14+) and (CD33-HLADMA-CD14+) classical monocytes as well as neutrophils dramatically increased in the fatal patient (COV077). Moreover, these cells overexpressed a number of cytokines, chemokines, acute-phase proteins and other proinflammatory factors (e.g. CCL3, CCL4, CXCL2, CXCL8, IL1B, S100A8, TNFSF10, LGALS1), suggesting that these cell subsets might be associated with the cytokine storm and other pathological processes. On the other hand, (CLEC10A-S100A9lo) pDC were negatively correlated with the disease severity of COVID-19 patients.
Another novel and important aspect of this study was the profiling of PBMCs from the COVID-19 patients with short and long duration of viral persistence (i.e. STNP and LTNP). In particular, (CD33-HLA-DMA-CD14+)classical monocytes and (CLEC10A-S100A9-)pDC were found to be positively correlated with LTNP (Figure 6A). Moreover, we detected a panel of DEGs (e.g. S100A8, S100A9, S100A12, CXCL8, KIF6, IFITM2, IFITM3, and IL1B) that may discriminate the LTNP from the STNP patients (Figures 6C, D). HLA-DMA is a member of the HLA class II alpha chain paralogues and plays a critical role in the antigen presentations (68, 69). The enrichment of (CD33-HLA-DMA-CD14+)classical monocytes may weaken the antigen presentation ability and antiviral immune responses, and subsequently result in the prolonged viral persistence in the LTNP patients.
In conclusion, this study identified a large number of distinct immune cell subsets that were associated with various clinical presentations and viral persistence. Our findings may enhance our understanding of the immunopathogenesis of COVID-19. In addition, our huge datasets will become a valuable resource for future studies in the scientific communities.
Data Availability Statement
The raw sequence data reported in this paper have been deposited in GEO repository, under accession code GSE165080 and are publicly accessible at https://www.ncbi.nlm.nih.gov/geo/query/acc.cgi?acc=GSE165080. Other supporting raw data are available from the corresponding author upon reasonable request. Source data are provided with this paper.
Ethics Statement
This study was reviewed and approved by the Ethics Committee of The First affiliated Hospital of Xi’an Jiaotong University (XJTU1AF2020LSK-015) and The Renmin Hospital of Wuhan University (WDRY2020-K130). All participants enrolled in this study offered the written informed consent by themselves or their surrogates. The patients/participants provided their written informed consent to participate in this study.
Author Contributions
Conceptualization: CZ and BS. Methodology and Investigation: XW, HB, JM, HQ, QZ, FH, TJ, WM, YZ, XC, XQ, ML, JX, JH, YW, XD, YL, TH, CF, CG, and CZ. Resources: CZ, BS, BHZ, and KH. Writing: CZ, BS, BJZ, XR, XW, HB, JM, TJ, and WM. Review and editing: CZ, HB, JM, BJZ, XR, and BS. Supervision: CZ, BS, BHZ, KH, CF, and DL. Funding: CZ and BS. Project administration: CZ and BS. All authors contributed to the article and approved the submitted version.
Funding
This study is supported in part by the Department of Science and Technology of Shaanxi Province (Grant No. 2020ZDXM2-SF-02) (CZ and BS) and the operational funds from The First Affiliated Hospital of Xi’an Jiaotong University (CZ and BS).
Conflict of Interest
The authors TJ, WM, YL, TH, CF, and CG are employed by the LC-BIO TECHNOLOGIES (HANGZHOU) CO., LTD., China.
The remaining authors declare that the research was conducted in the absence of any commercial or financial relationships that could be construed as a potential conflict of interest.
Publisher’s Note
All claims expressed in this article are solely those of the authors and do not necessarily represent those of their affiliated organizations, or those of the publisher, the editors and the reviewers. Any product that may be evaluated in this article, or claim that may be made by its manufacturer, is not guaranteed or endorsed by the publisher.
Acknowledgments
We are grateful to all the patients and their families for participation of this study and providing the valuable information. We also thank our colleagues at The First Affiliated Hospital of Xi’an Jiaotong University and The Renmin Hospital of Wuhan University for their kind help and strong support throughout the course of this study.
Supplementary Material
The Supplementary Material for this article can be found online at: https://www.frontiersin.org/articles/10.3389/fimmu.2022.812514/full#supplementary-material
References
1. World Health Organization. WHO Coronavirus (COVID-19) Dashboard. Available at: https://covid19.who.int/.
2. Rothe C, Schunk M, Sothmann P, Bretzel G, Froeschl G, Wallrauch C, et al. Transmission of 2019-Ncov Infection From an Asymptomatic Contact in Germany. N Engl J Med (2020) 382(10):970–1. doi: 10.1056/NEJMc2001468
3. Kim GU, Kim MJ, Ra SH, Lee J, Bae S, Jung J, et al. Clinical Characteristics of Asymptomatic and Symptomatic Patients With Mild COVID-19. Clin Microbiol Infect (2020) 26(7):948 e1–3. doi: 10.1016/j.cmi.2020.04.040
4. Meng H, Xiong R, He R, Lin W, Hao B, Zhang L, et al. CT Imaging and Clinical Course of Asymptomatic Cases With COVID-19 Pneumonia at Admission in Wuhan, China. J Infect (2020) 81(1):e33–e9. doi: 10.1016/j.jinf.2020.04.004
5. Buitrago-Garcia D, Egli-Gany D, Counotte MJ, Hossmann S, Imeri H, Ipekci AM, et al. Occurrence and Transmission Potential of Asymptomatic and Presymptomatic SARS-CoV-2 Infections: A Living Systematic Review and Meta-Analysis. PLoS Med (2020) 17(9):e1003346. doi: 10.1371/journal.pmed.1003346
6. Guan WJ, Ni ZY, Hu Y, Liang WH, Ou CQ, He JX, et al. Clinical Characteristics of Coronavirus Disease 2019 in China. N Engl J Med (2020) 382(18):1708–20. doi: 10.1056/NEJMoa2002032
7. Wang D, Hu B, Hu C, Zhu F, Liu X, Zhang J, et al. Clinical Characteristics of 138 Hospitalized Patients With 2019 Novel Coronavirus-Infected Pneumonia in Wuhan, China. JAMA (2020) 323(11):1061–9. doi: 10.1001/jama.2020.1585
8. Huang C, Wang Y, Li X, Ren L, Zhao J, Hu Y, et al. Clinical Features of Patients Infected With 2019 Novel Coronavirus in Wuhan, China. Lancet (2020) 395(10223):497–506. doi: 10.1016/S0140-6736(20)30183-5
9. Chen N, Zhou M, Dong X, Qu J, Gong F, Han Y, et al. Epidemiological and Clinical Characteristics of 99 Cases of 2019 Novel Coronavirus Pneumonia in Wuhan, China: A Descriptive Study. Lancet (2020) 395(10223):507–13. doi: 10.1016/S0140-6736(20)30211-7
10. Wu Z, McGoogan JM. Characteristics of and Important Lessons From the Coronavirus Disease 2019 (COVID-19) Outbreak in China: Summary of a Report of 72314 Cases From the Chinese Center for Disease Control and Prevention. JAMA (2020) 323(13):1239–42. doi: 10.1001/jama.2020.2648
11. Argenziano MG, Bruce SL, Slater CL, Tiao JR, Baldwin MR, Barr RG, et al. Characterization and Clinical Course of 1000 Patients With Coronavirus Disease 2019 in New York: Retrospective Case Series. BMJ (2020) 369:m1996. doi: 10.1136/bmj.m1996
12. Price-Haywood EG, Burton J, Fort D, Seoane L. Hospitalization and Mortality Among Black Patients and White Patients With Covid-19. N Engl J Med (2020) 382(26):2534–43. doi: 10.1056/NEJMsa2011686
13. Richardson S, Hirsch JS, Narasimhan M, Crawford JM, McGinn T, Davidson KW, et al. Presenting Characteristics, Comorbidities, and Outcomes Among 5700 Patients Hospitalized With COVID-19 in the New York City Area. JAMA (2020) 323(20):2052–9. doi: 10.1001/jama.2020.6775
14. Li X, Xu S, Yu M, Wang K, Tao Y, Zhou Y, et al. Risk Factors for Severity and Mortality in Adult COVID-19 Inpatients in Wuhan. J Allergy Clin Immunol (2020) 146(1):110–8. doi: 10.1016/j.jaci.2020.04.006
15. Zhang X, Tan Y, Ling Y, Lu G, Liu F, Yi Z, et al. Viral and Host Factors Related to the Clinical Outcome of COVID-19. Nature (2020) 583(7816):437–40. doi: 10.1038/s41586-020-2355-0
16. Young BE, Fong SW, Chan YH, Mak TM, Ang LW, Anderson DE, et al. Effects of a Major Deletion in the SARS-CoV-2 Genome on the Severity of Infection and the Inflammatory Response: An Observational Cohort Study. Lancet (2020) 396(10251):603–11. doi: 10.1016/S0140-6736(20)31757-8
17. Zhang Q, Bastard P, Liu Z, Le Pen J, Moncada-Velez M, Chen J, et al. Inborn Errors of Type I IFN Immunity in Patients With Life-Threatening COVID-19. Science (2020) 370(6515):eabd4570. doi: 10.1126/science.abd4570
18. Bost P, Giladi A, Liu Y, Bendjelal Y, Xu G, David E, et al. Host-Viral Infection Maps Reveal Signatures of Severe COVID-19 Patients. Cell (2020) 181(7):1475–88.e12. doi: 10.1016/j.cell.2020.05.006
19. Bost P, De Sanctis F, Cane S, Ugel S, Donadello K, Castellucci M, et al. Deciphering the State of Immune Silence in Fatal COVID-19 Patients. Nat Commun (2021) 12(1):1428. doi: 10.1038/s41467-021-21702-6
20. Xu G, Qi F, Li H, Yang Q, Wang H, Wang X, et al. The Differential Immune Responses to COVID-19 in Peripheral and Lung Revealed by Single-Cell RNA Sequencing. Cell Discov (2020) 6:73. doi: 10.1038/s41421-020-00225-2
21. Chua RL, Lukassen S, Trump S, Hennig BP, Wendisch D, Pott F, et al. COVID-19 Severity Correlates With Airway Epithelium-Immune Cell Interactions Identified by Single-Cell Analysis. Nat Biotechnol (2020) 38(8):970–9. doi: 10.1038/s41587-020-0602-4
22. Liao M, Liu Y, Yuan J, Wen Y, Xu G, Zhao J, et al. Single-Cell Landscape of Bronchoalveolar Immune Cells in Patients With COVID-19. Nat Med (2020) 26(6):842–4. doi: 10.1038/s41591-020-0901-9
23. Fiege JK, Thiede JM, Nanda HA, Matchett WE, Moore PJ, Montanari NR, et al. Single Cell Resolution of SARS-CoV-2 Tropism, Antiviral Responses, and Susceptibility to Therapies in Primary Human Airway Epithelium. PLoS Pathog (2021) 17(1):e1009292. doi: 10.1371/journal.ppat.1009292
24. Guo C, Li B, Ma H, Wang X, Cai P, Yu Q, et al. Single-Cell Analysis of Two Severe COVID-19 Patients Reveals a Monocyte-Associated and Tocilizumab-Responding Cytokine Storm. Nat Commun (2020) 11(1):3924. doi: 10.1038/s41467-020-17834-w
25. Ren X, Wen W, Fan X, Hou W, Su B, Cai P, et al. COVID-19 Immune Features Revealed by a Large-Scale Single-Cell Transcriptome Atlas. Cell (2021) 184(7):1895–913.e19. doi: 10.1016/j.cell.2021.01.053
26. Long QX, Tang XJ, Shi QL, Li Q, Deng HJ, Yuan J, et al. Clinical and Immunological Assessment of Asymptomatic SARS-CoV-2 Infections. Nat Med (2020) 26(8):1200–4. doi: 10.1038/s41591-020-0965-6
27. Sekine T, Perez-Potti A, Rivera-Ballesteros O, Stralin K, Gorin JB, Olsson A, et al. Robust T Cell Immunity in Convalescent Individuals With Asymptomatic or Mild COVID-19. Cell (2020) 183(1):158–68.e14. doi: 10.1016/j.cell.2020.08.017
28. Feng S, Phillips DJ, White T, Sayal H, Aley PK, Bibi S, et al. Correlates of Protection Against Symptomatic and Asymptomatic SARS-CoV-2 Infection. Nat Med (2021) 27(11):2032–40. doi: 10.1038/s41591-021-01540-1
29. Zhao XN, You Y, Cui XM, Gao HX, Wang GL, Zhang SB, et al. Single-Cell Immune Profiling Reveals Distinct Immune Response in Asymptomatic COVID-19 Patients. Signal Transduct Target Ther (2021) 6(1):342. doi: 10.1038/s41392-021-00753-7
30. World Health Organization. Laboratory Testing for 2019 Novel Coronavirus (2019-Ncov) in Suspected Human Cases (2020). Available at: https://www.who.int/health-topics/coronavirus/laboratory-diagnostics-for-novel-coronavirus (Accessed March 19, 2020).
31. World Health Organization. COVID-19: Surveillance, Case Investigation and Epidemiological Protocols (2020). Available at: https://www.who.int/internal-publications-detail/considerations-in-the-investigation-of-cases-and-clusters-of-covid-19 (Accessed October 22, 2020).
32. Government of China. New Coronavirus Pneumonia Prevention and Control Program (2021). Available at: http://www.nhc.gov.cn/jkj/s3577/202105/6f1e8ec6c4a540d99fafef52fc86d0f8/files/4a860a7e85d14d55a22fbab0bbe77cd9.pdf (Accessed May 14, 2021).
33. Stuart T, Butler A, Hoffman P, Hafemeister C, Papalexi E, Mauck WM 3rd, et al. Comprehensive Integration of Single-Cell Data. Cell (2019) 177(7):1888–902.e21. doi: 10.1016/j.cell.2019.05.031
34. Joshi NS, Cui W, Chandele A, Lee HK, Urso DR, Hagman J, et al. Inflammation Directs Memory Precursor and Short-Lived Effector CD8(+) T Cell Fates via the Graded Expression of T-Bet Transcription Factor. Immunity (2007) 27(2):281–95. doi: 10.1016/j.immuni.2007.07.010
35. Cosgrove C, Ussher JE, Rauch A, Gartner K, Kurioka A, Huhn MH, et al. Early and Nonreversible Decrease of CD161++/MAIT Cells in HIV Infection. Blood (2013) 121(6):951–61. doi: 10.1182/blood-2012-06-436436
36. Napier RJ, Adams EJ, Gold MC, Lewinsohn DM. The Role of Mucosal Associated Invariant T Cells in Antimicrobial Immunity. Front Immunol (2015) 6:344. doi: 10.3389/fimmu.2015.00344
37. Dias J, Sobkowiak MJ, Sandberg JK, Leeansyah E. Human MAIT-Cell Responses to Escherichia Coli: Activation, Cytokine Production, Proliferation, and Cytotoxicity. J Leukoc Biol (2016) 100(1):233–40. doi: 10.1189/jlb.4TA0815-391RR
38. Wong EB, Gold MC, Meermeier EW, Xulu BZ, Khuzwayo S, Sullivan ZA, et al. TRAV1-2(+) CD8(+) T-Cells Including Oligoconal Expansions of MAIT Cells are Enriched in the Airways in Human Tuberculosis. Commun Biol (2019) 2:203. doi: 10.1038/s42003-019-0442-2
39. Yu H, Yang A, Derrick S, Mak JYW, Liu L, Fairlie DP, et al. Artificially Induced MAIT Cells Inhibit M. Bovis BCG But Not M. Tuberculosis During In Vivo Pulmonary Infection. Sci Rep (2020) 10(1):13579. doi: 10.1038/s41598-020-70615-9
40. Parrot T, Gorin JB, Ponzetta A, Maleki KT, Kammann T, Emgard J, et al. MAIT Cell Activation and Dynamics Associated With COVID-19 Disease Severity. Sci Immunol (2020) 5(51):eabe1670. doi: 10.1126/sciimmunol.abe1670
41. Flament H, Rouland M, Beaudoin L, Toubal A, Bertrand L, Lebourgeois S, et al. Outcome of SARS-CoV-2 Infection Is Linked to MAIT Cell Activation and Cytotoxicity. Nat Immunol (2021) 22(3):322–35. doi: 10.1038/s41590-021-00870-z
42. Kuri-Cervantes L, Pampena MB, Meng W, Rosenfeld AM, Ittner CAG, Weisman AR, et al. Comprehensive Mapping of Immune Perturbations Associated With Severe COVID-19. Sci Immunol (2020) 5(49):eabd7114. doi: 10.1126/sciimmunol.abd7114
43. Cook KD, Waggoner SN, Whitmire JK. NK Cells and Their Ability to Modulate T Cells During Virus Infections. Crit Rev Immunol (2014) 34(5):359–88. doi: 10.1615/critrevimmunol.2014010604
44. Waggoner SN, Cornberg M, Selin LK, Welsh RM. Natural Killer Cells Act as Rheostats Modulating Antiviral T Cells. Nature (2011) 481(7381):394–8. doi: 10.1038/nature10624
45. Maucourant C, Filipovic I, Ponzetta A, Aleman S, Cornillet M, Hertwig L, et al. Natural Killer Cell Immunotypes Related to COVID-19 Disease Severity. Sci Immunol (2020) 5(50):eabd6832. doi: 10.1126/sciimmunol.abd6832
46. Sedy JR, Bjordahl RL, Bekiaris V, Macauley MG, Ware BC, Norris PS, et al. CD160 Activation by Herpesvirus Entry Mediator Augments Inflammatory Cytokine Production and Cytolytic Function by NK Cells. J Immunol (2013) 191(2):828–36. doi: 10.4049/jimmunol.1300894
47. Tu TC, Brown NK, Kim TJ, Wroblewska J, Yang X, Guo X, et al. CD160 is Essential for NK-Mediated IFN-Gamma Production. J Exp Med (2015) 212(3):415–29. doi: 10.1084/jem.20131601
48. Prager I, Watzl C. Mechanisms of Natural Killer Cell-Mediated Cellular Cytotoxicity. J Leukoc Biol (2019) 105(6):1319–29. doi: 10.1002/JLB.MR0718-269R
49. Masselli E, Vaccarezza M, Carubbi C, Pozzi G, Presta V, Mirandola P, et al. NK Cells: A Double Edge Sword Against SARS-CoV-2. Adv Biol Regul (2020) 77:100737. doi: 10.1016/j.jbior.2020.100737
50. Robertson FC, Berzofsky JA, Terabe M. NKT Cell Networks in the Regulation of Tumor Immunity. Front Immunol (2014) 5:543. doi: 10.3389/fimmu.2014.00543
51. Fisicaro P, Rossi M, Vecchi A, Acerbi G, Barili V, Laccabue D, et al. The Good and the Bad of Natural Killer Cells in Virus Control: Perspective for Anti-HBV Therapy. Int J Mol Sci (2019) 20(20):5080. doi: 10.3390/ijms20205080
52. Kim TJ, Park G, Kim J, Lim SA, Kim J, Im K, et al. CD160 Serves as a Negative Regulator of NKT Cells in Acute Hepatic Injury. Nat Commun (2019) 10(1):3258. doi: 10.1038/s41467-019-10320-y
53. Ishikawa H, Ino S, Yamochi T, Sasaki H, Kobayashi T, Kohda C, et al. NKT Cells are Responsible for the Clearance of Murine Norovirus Through the Virus-Specific Secretory IgA Pathway. Biochem Biophys Rep (2020) 21:100722. doi: 10.1016/j.bbrep.2019.100722
54. Zhang JY, Wang XM, Xing X, Xu Z, Zhang C, Song JW, et al. Single-Cell Landscape of Immunological Responses in Patients With COVID-19. Nat Immunol (2020) 21(9):1107–18. doi: 10.1038/s41590-020-0762-x
55. Stephen-Victor E, Das M, Karnam A, Pitard B, Gautier JF, Bayry J. Potential of Regulatory T-Cell-Based Therapies in the Management of Severe COVID-19. Eur Respir J (2020) 56(3):2002182. doi: 10.1183/13993003.02182-2020
56. Kanjana K, Chevaisrakul P, Matangkasombut P, Paisooksantivatana K, Lumjiaktase P. Inhibitory Activity of FOXP3+ Regulatory T Cells Reveals High Specificity for Displaying Immune Tolerance in Remission State Rheumatoid Arthritis. Sci Rep (2020) 10(1):19789. doi: 10.1038/s41598-020-76168-1
57. Rahimzadeh M, Naderi N. Toward an Understanding of Regulatory T Cells in COVID-19: A Systematic Review. J Med Virol (2021) 93(7):4167–81. doi: 10.1002/jmv.26891
58. Sadeghi A, Tahmasebi S, Mahmood A, Kuznetsova M, Valizadeh H, Taghizadieh A, et al. Th17 and Treg Cells Function in SARS-CoV2 Patients Compared With Healthy Controls. J Cell Physiol (2021) 236(4):2829–39. doi: 10.1002/jcp.30047
59. Gaidt MM, Ebert TS, Chauhan D, Schmidt T, Schmid-Burgk JL, Rapino F, et al. Human Monocytes Engage an Alternative Inflammasome Pathway. Immunity (2016) 44(4):833–46. doi: 10.1016/j.immuni.2016.01.012
60. Kapellos TS, Bonaguro L, Gemund I, Reusch N, Saglam A, Hinkley ER, et al. Human Monocyte Subsets and Phenotypes in Major Chronic Inflammatory Diseases. Front Immunol (2019) 10:2035. doi: 10.3389/fimmu.2019.02035
61. Arunachalam PS, Wimmers F, Mok CKP, Perera R, Scott M, Hagan T, et al. Systems Biological Assessment of Immunity to Mild Versus Severe COVID-19 Infection in Humans. Science (2020) 369(6508):1210–20. doi: 10.1126/science.abc6261
62. Hoober JK, Eggink LL, Cote R. Stories From the Dendritic Cell Guardhouse. Front Immunol (2019) 10:2880. doi: 10.3389/fimmu.2019.02880
63. Campana P, Parisi V, Leosco D, Bencivenga D, Della Ragione F, Borriello A. Dendritic Cells and SARS-CoV-2 Infection: Still an Unclarified Connection. Cells (2020) 9(9):2046. doi: 10.3390/cells9092046
64. Schulte-Schrepping J, Reusch N, Paclik D, Bassler K, Schlickeiser S, Zhang B, et al. Severe COVID-19 Is Marked by a Dysregulated Myeloid Cell Compartment. Cell (2020) 182(6):1419–40.e23. doi: 10.1016/j.cell.2020.08.001
65. Lee JS, Park S, Jeong HW, Ahn JY, Choi SJ, Lee H, et al. Immunophenotyping of COVID-19 and Influenza Highlights the Role of Type I Interferons in Development of Severe COVID-19. Sci Immunol (2020) 5(49):eabd1554. doi: 10.1126/sciimmunol.abd1554
66. Wilk AJ, Rustagi A, Zhao NQ, Roque J, Martinez-Colon GJ, McKechnie JL, et al. A Single-Cell Atlas of the Peripheral Immune Response in Patients With Severe COVID-19. Nat Med (2020) 26(7):1070–6. doi: 10.1038/s41591-020-0944-y
67. Silvin A, Chapuis N, Dunsmore G, Goubet AG, Dubuisson A, Derosa L, et al. Elevated Calprotectin and Abnormal Myeloid Cell Subsets Discriminate Severe From Mild COVID-19. Cell (2020) 182(6):1401–18.e18. doi: 10.1016/j.cell.2020.08.002
68. Alvaro-Benito M, Wieczorek M, Sticht J, Kipar C, Freund C. HLA-DMA Polymorphisms Differentially Affect MHC Class II Peptide Loading. J Immunol (2015) 194(2):803–16. doi: 10.4049/jimmunol.1401389
Keywords: SARS-CoV-2, COVID-19, asymptomatic infection, disease severity, viral persistence, singlecell RNA sequencing (scRNA-seq)
Citation: Wang X, Bai H, Ma J, Qin H, Zeng Q, Hu F, Jiang T, Mao W, Zhao Y, Chen X, Qi X, Li M, Xu J, Hao J, Wang Y, Ding X, Liu Y, Huang T, Fang C, Ge C, Li D, Hu K, Ren X, Zhang B, Zhang B, Shi B and Zhang C (2022) Identification of Distinct Immune Cell Subsets Associated With Asymptomatic Infection, Disease Severity, and Viral Persistence in COVID-19 Patients. Front. Immunol. 13:812514. doi: 10.3389/fimmu.2022.812514
Received: 10 November 2021; Accepted: 04 February 2022;
Published: 22 February 2022.
Edited by:
Tram Pham, Montreal Clinical Research Institute (IRCM), CanadaReviewed by:
James E. Thaventhiran, University of Cambridge, United KingdomMartina Severa, National Institute of Health (ISS), Italy
Copyright © 2022 Wang, Bai, Ma, Qin, Zeng, Hu, Jiang, Mao, Zhao, Chen, Qi, Li, Xu, Hao, Wang, Ding, Liu, Huang, Fang, Ge, Li, Hu, Ren, Zhang, Zhang, Shi and Zhang. This is an open-access article distributed under the terms of the Creative Commons Attribution License (CC BY). The use, distribution or reproduction in other forums is permitted, provided the original author(s) and the copyright owner(s) are credited and that the original publication in this journal is cited, in accordance with accepted academic practice. No use, distribution or reproduction is permitted which does not comply with these terms.
*Correspondence: Chengsheng Zhang, cszhang99@126.com; Bingyin Shi, shibingy@126.com; Binghong Zhang, zbhong6288@163.com
†These authors have contributed equally to this work and share the first authorship
‡Lead Contact