 Miaoyu Bai1,2†Shanjia Ke1,2†
 Hongjun Yu1,2†
 Yanan Xu2,3†Yue Yu4Shounan Lu1,2Chaoqun Wang1,2Jingjing Huang2
 Yong Ma1,2*Wenjie Dai2,4*
 Yaohua Wu2,4*
- 1Department of Minimal Invasive Hepatic Surgery, The First Affiliated Hospital of Harbin Medical University, Harbin, China
- 2Key Laboratory of Hepatosplenic Surgery, Ministry of Education, The First Affiliated Hospital of Harbin Medical University, Harbin, China
- 3Department of Hepatopancreatobiliary Surgery, Affiliated Hangzhou First People’s Hospital, Zhejiang University School of Medicine, Hangzhou, China
- 4Department of Thyroid Surgery, The First Affiliated Hospital of Harbin Medical University, Harbin, China
Background: Thyroid carcinoma (THCA) has a low mortality rate, but its incidence has been rising over the years. We need to pay attention to its progression and prognosis. In this study, a transcriptome sequencing analysis and bioinformatics methods were used to screen key genes associated with THCA development and analyse their clinical significance and diagnostic value.
Methods: We collected 10 pairs of THCA tissues and noncancerous tissues, these samples were used for transcriptome sequencing to identify disordered genes. The gene expression profiles were obtained from the Gene Expression Omnibus (GEO) database. Comprehensive analysis of thyroid clinicopathological data using The Cancer Genome Atlas (TCGA). R software was used to carry out background correction, normalization and log2 conversion. We used quantitative real-time PCR (qRT–PCR) and Western blot to determine differentially expressed genes (DEGs) expression in samples. We integrated the DEGs expression, clinical features and progression-free interval (PFI). The related functions and immune infiltration degree were established by Gene Ontology (GO), Kyoto Encyclopedia of Genes and Genomes (KEGG), Gene Set Enrichment Analysis (GSEA), and single-sample Gene Set Enrichment Analysis (ssGSEA). The UALCAN database was used to analyse the methylation level.
Results: We evaluated DEGs between normal tissue and cancer. Three genes were identified: regulator of G protein signaling 8 (RGS8), diacylglycerol kinase iota (DGKI) and oculocutaneous albinism II (OCA2). The mRNA and protein expression levels of RGS8, DGKI and OCA2 in normal tissues were higher than those in THCA tissues. Better survival outcomes were associated with higher expression of RGS8 (HR=0.38, P=0.001), DGKI (HR=0.52, P=0.022), and OCA2 (HR=0.41, P=0.003). The GO analysis, KEGG analysis and GSEA proved that the coexpressed genes of RGS8, DGKI and OCA2 were related to thyroid hormone production and peripheral downstream signal transduction effects. The expression levels of RGS8, DGKI and OCA2 were linked to the infiltration of immune cells such as DC cells. The DNA methylation level of OCA2 in cancer tissues was higher than that in the normal samples.
Conclusions: RGS8, DGKI and OCA2 might be promising prognostic molecular markers in patients with THCA and reveal the clinical significance of RGS8, DGKI and OCA2 in THCA.
Introduction
Over the past four decades, thyroid cancer morbidity has continued to increase worldwide (1). Thyroid cancer is the most common endocrine malignancy and accounts for 3.4% of all cancers diagnosed each year (2). More than 90% of thyroid cancers are papillary thyroid carcinoma (PTC) and follicular thyroid carcinoma. Medullary thyroid carcinoma and poorly differentiated thyroid cancer account for 5% each, and the proportion of anaplastic thyroid cancer (1%) is the lowest. Most patients with PTC have a good prognosis in terms of long-term survival (3), but the overall survival of patients with aggressive PTC (such as lymph node and distant metastasis potential) remains unsatisfactory (4). Therefore, revealing the molecular mechanism underlying PTC development may provide a new therapeutic direction for PTC treatment.
As tumor biology advances, genetic markers can be quantified through standardized tests to dynamically reflect the prognosis of patients based on their disease. Importantly, these genes may also play a crucial role in the progression of PTC. Furthermore, such genes may be potential targets for inhibiting recurrence and metastasis.
This study performed a bioinformatics analysis of the DEGs based on transcriptome sequencing and biological information from GEO datasets. Here, our aim is to lay a solid foundation for exploring the molecular mechanisms of THCA pathogenesis and identifying molecular targets for clinical diagnosis or treatment. In this study, we demonstrated the clinical correlation, potential diagnostic and prognostic effect of RGS8, DGKI and OCA2 in THCA using statistical and bioinformatics methods.
Materials and methods
Transcriptome sequencing
From January 2020 to December 2021, we collected 10 pairs of papillary thyroid carcinoma and adjacent thyroid tissues from patients who underwent thyroid resection at the First Affiliated Hospital of Harbin Medical University (Supplementary Table 1). Before surgery, these patients were not treated with chemotherapy or radiotherapy. With the approval of the Ethics Committee of the First Affiliated Hospital of Harbin Medical University, we collected specimens from patients after obtaining their informed consent. Then, we used these 10 samples for transcriptome sequencing to identify genes that were dysregulated.
GEO and TCGA cohorts
The GSE33630 (45 normal thyroid tissues and 49 papillary thyroid cancer tissues) and GSE29265 (20 normal thyroid tissues and 20 papillary thyroid cancer tissues) gene expression profile matrix files were downloaded from the GEO database (https://www.ncbi.nlm.nih.gov/geo) (5). The Impute and Limma packages (version: 3.42.2) in R software (version: 3.6.3) were applied to perform background correction, normalization and log2 conversion of the matrix data of our sequencing results and each GEO dataset. We defined a |log2-fold change|≥2 and adjusted p value<0.05 as the DEGs screening criteria for the thyroid carcinoma samples from our sequencing results and two GEO datasets and then generated heatmaps (R package: ComplexHeatmap), volcano maps (R package: ggplot2) and venn diagrams (R package: ggplot2). Using TCGA (https://portal.gdc.cancer.gov) (6), standardized RNA-seq data (TPM) and corresponding clinical characteristics of PTC patients were downloaded.
Clinical analysis and assessment of the prognostic status
We studied the clinical pathological factors associated with the 10 years PFI in TCGA specimens using the Kaplan–Meier method and Cox regression by R (package: survminer) (7). R (package: pROC) was used to analyse and visualize the receiver operating characteristic curve (ROC) of the genes involved in thyroid cancer, analyse their molecular expression and predict the predictive efficacy of the outcome.
Correlation and enrichment analyses
We used the EnrichGO function (R package: clusterProfiler) to perform a GO analysis and then used the EnrichKEGG function (R package: clusterProfiler) to perform a KEGG analysis. Similarly, a GSEA was performed using the gseGO, gseKEGG, and gsePathway functions (R package: clusterProfiler) (8), detailed descriptions of individual gene sets are available in MSigDB Collections. We analysed the correlation between RGS8, DGKI and OCA2 and other related genes in thyroid cancer using TCGA data. The related genes were selected for an enrichment analysis.
Immune cell infiltration
The immune invasiveness of RGS8, DGKI and OCA2 across cancers was analysed using TISIDB (http://cis.hku.hk/TISIDB) (9). The proportional infiltration levels of 24 types of immune cells were quantified using an ssGSEA, and Spearman correlation and Wilcoxon tests were used to evaluate the correlation between RGS8, DGKI and OCA2 expression and immune cell infiltration in different groups (10, 11).
Methylation analysis
The UALCAN online database (http://ualcan.path.uab.edu) is a web portal used to perform survival analyses based on DNA methylation biomarkers supported by TCGA data (12). UALCAN was used to analyse the methylation levels of OCA2. The statistical analysis and visualization of the CpG site of OCA2 were performed using the R package (V 3.6.3).
Western blot
The experimental method has been described before (13). The extracted tissues were denatured by electrophoresis and then transferred to a polyvinylidene fluoride membrane (Merck Millipore Ltd., Germany). The membrane was blocked with 5% skim milk and incubated with primary antibodies at 4°C overnight. Finally, the membrane was incubated with IRDye 800CW secondary antibodies (LI-COR, USA) (1:10000) at room temperature for 1 h, and the proteins were visualized and analyzed with Odyssey® Imaging System (LI-COR, USA). Primary antibodies against the following target proteins were used: RGS8 (Santa) (1:500), DGKI (Santa) (1:500), OCA2 (Novus) (1:500) and GAPDH (Sigma-Al-drich) (1:8000).
Quantitative real-time PCR
We used an AxyPrep Multisource Total RNA Miniprep Kit (Axygen Scientific, Inc, USA) to extract the total RNA from tissues and then reverse transcribed the RNA into cDNA using a PCR RT Kit (TOYOBO, Shanghai, China) after the RNA quantification. Quantitative real-time PCR was performed on an ABIPRISM 7500HT instrument (Applied Biosystems) using THUNDERBIRD SYBR qPCR Mix (TOYOBO, Shanghai, China) according to the manufacturer’s instructions to detect the expression of mRNA. The following primers were used: RGS8-F, 5’-GGATGCCTGTCTCACAAGTCA-3’; RGS8-R, 5’-CCTCGTAGCTTCTTCTGTCGATA-3’; DGKI-F, 5’-GCAGGTCTCGTACAGGAAAGC-3’; DGKI-R, 5’-CACTCCAGTCCAAAGTCGCTC-3’; OCA2-F, 5’-GCGGACTCGCTGAACTTGT-3’; OCA2-R, 5’-AGAAGAGTGAGACCTCCCTTTT-3’; GAPDH-F, 5’-TGACTTCAACAGCGACACCCA-3’; GAPDH-R, 5’-CACCCTGTTGCTGTAGCCAAA-3’. GAPDH was used as a control to determine changes in mRNA levels using the -ΔΔCT method.
Results
Identification of DEGs
Ten pairs of thyroid carcinoma specimens were used for transcriptome sequencing, the edgeR package was utilized to assess the DEGs between normal tissue and cancer with the cut-off values of |log2-fold change|≥2 and adjusted p value< 0.05. In total, 730 genes (362 upregulated and 368 downregulated) were identified between THCA and normal samples (Figure 1A). Then, we searched and obtained two gene expression profiles from GSE33630 and GSE29265, further validating the 730 genes. The two GEO datasets, GSE33630 and GSE29265, included in this study are shown in Figures 1B, C. According to the Venn diagrams and heatmaps (Figures 1D, E, G–I), we found 91 differentially expressed genes. We screened 32 genes in the three cogroups found to be repeatedly downregulated and 59 genes found to be repeatedly upregulated in THCA from the three cohorts (Figure 1F). Furthermore, we performed biological function correlation analysis using the TCGA data, and the results showed that the downregulated genes were highly correlated with thyroid function as shown in Supplementary Figures 1A, B.
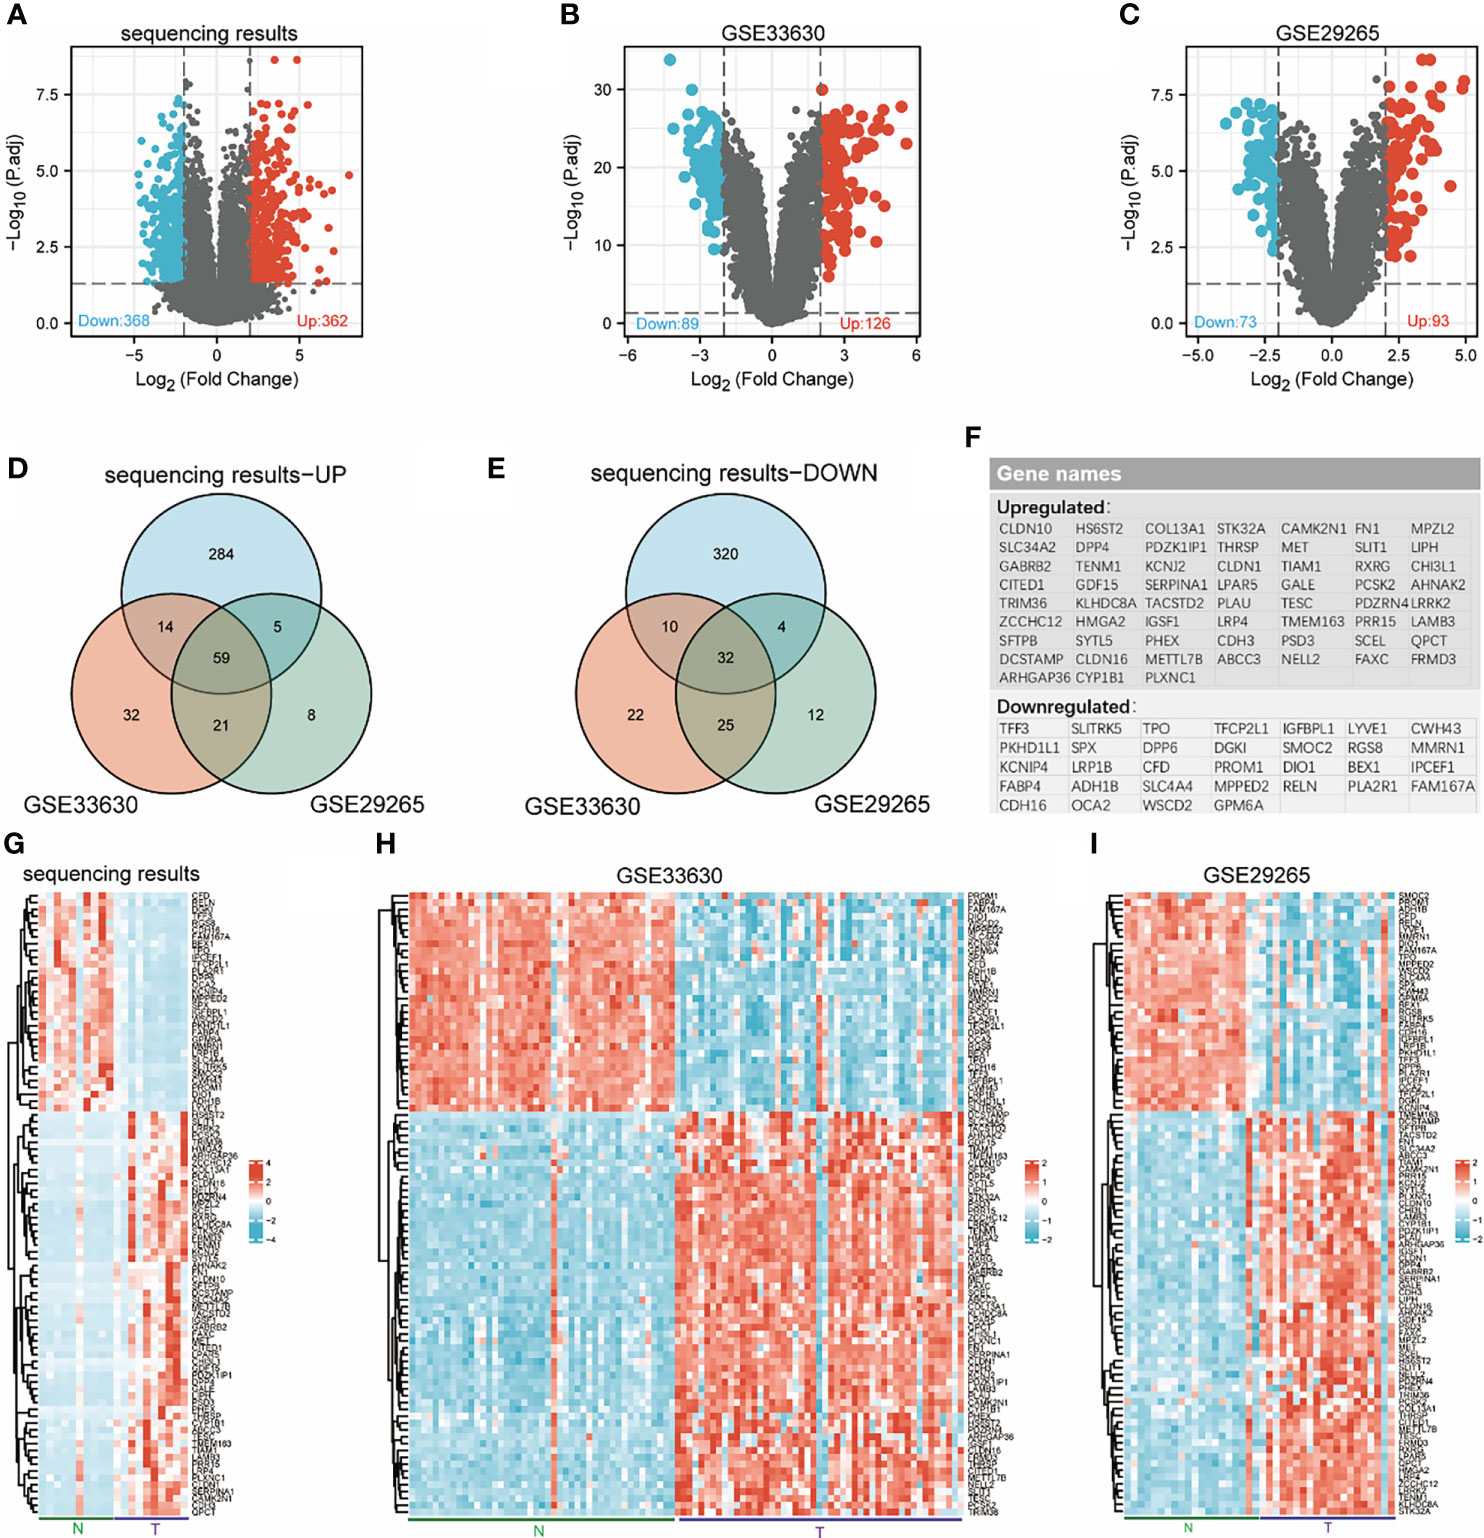
Figure 1 Identification of differentially expressed genes (DEGs). Volcanic maps for each data set: downregulated genes (blue dots) and upregulated genes (red dots) in THCA compared with normal thyroid; transcriptome sequencing results (A), GSE33630 (B), GSE29265 (C). Venn diagrams: 59 overlapping upregulated genes in sequencing data, GSE33630 and GSE29265 (D), 32 overlapping downregulated genes in sequencing data, GSE33630 and GSE29265 (E). The names of 91 overlapping differentially expressed genes (F). Heatmaps for each data set show the expression data of 91 genes: transcriptome sequencing results (G), GSE33630 (H), GSE29265 (I).
Expression of RGS8, DGKI and OCA2 was decreased in THCA tissues
We used qRT–PCR to detect some unreported genes among 91 genes in tumor tissues and adjacent noncancer tissues from 20 patients with papillary thyroid carcinoma. The results showed that the expression levels of RGS8, DGKI and OCA2 were obviously reduced in the THCA tissues compared with the corresponding noncancerous tissues (Figures 2J–L). Then, we detected the protein expression of RGS8, DGKI and OCA2 in five pairs of papillary thyroid carcinoma tissues and found that their expression levels were obviously lower than those of the paired normal thyroid tissues (Figures 2M–O). On the basis of TCGA and Genotype-Tissue Expression (GTEx) datasets, we used a Wilcoxon test to analyse the data. We first evaluated RGS8, DGKI, and OCA2 expression across cancers. The expression of RGS8, DGKI, and OCA2 was decreased in most tumors, including THCA (Figures 2A–C). Similarly, by analysing RGS8, DGKI, and OCA2 expression in the TCGA database, we found that their expression in 58 THCA tumor samples was lower than that in 58 paired normal samples. (Figures 2D–F). In addition, RGS8, DGKI, and OCA2 were expressed at low levels in thyroid cancer in our sequencing results, GSE33630 and GSE29265 (Figures 2G–I). Additionally, we established a receiver operating characteristic (ROC) curve, and the areas under the curve (AUCs) of RGS8, DGKI and OCA2 were 0.920, 0.929 and 0.934 (Figures 2P–R), respectively, indicating a high diagnostic value.
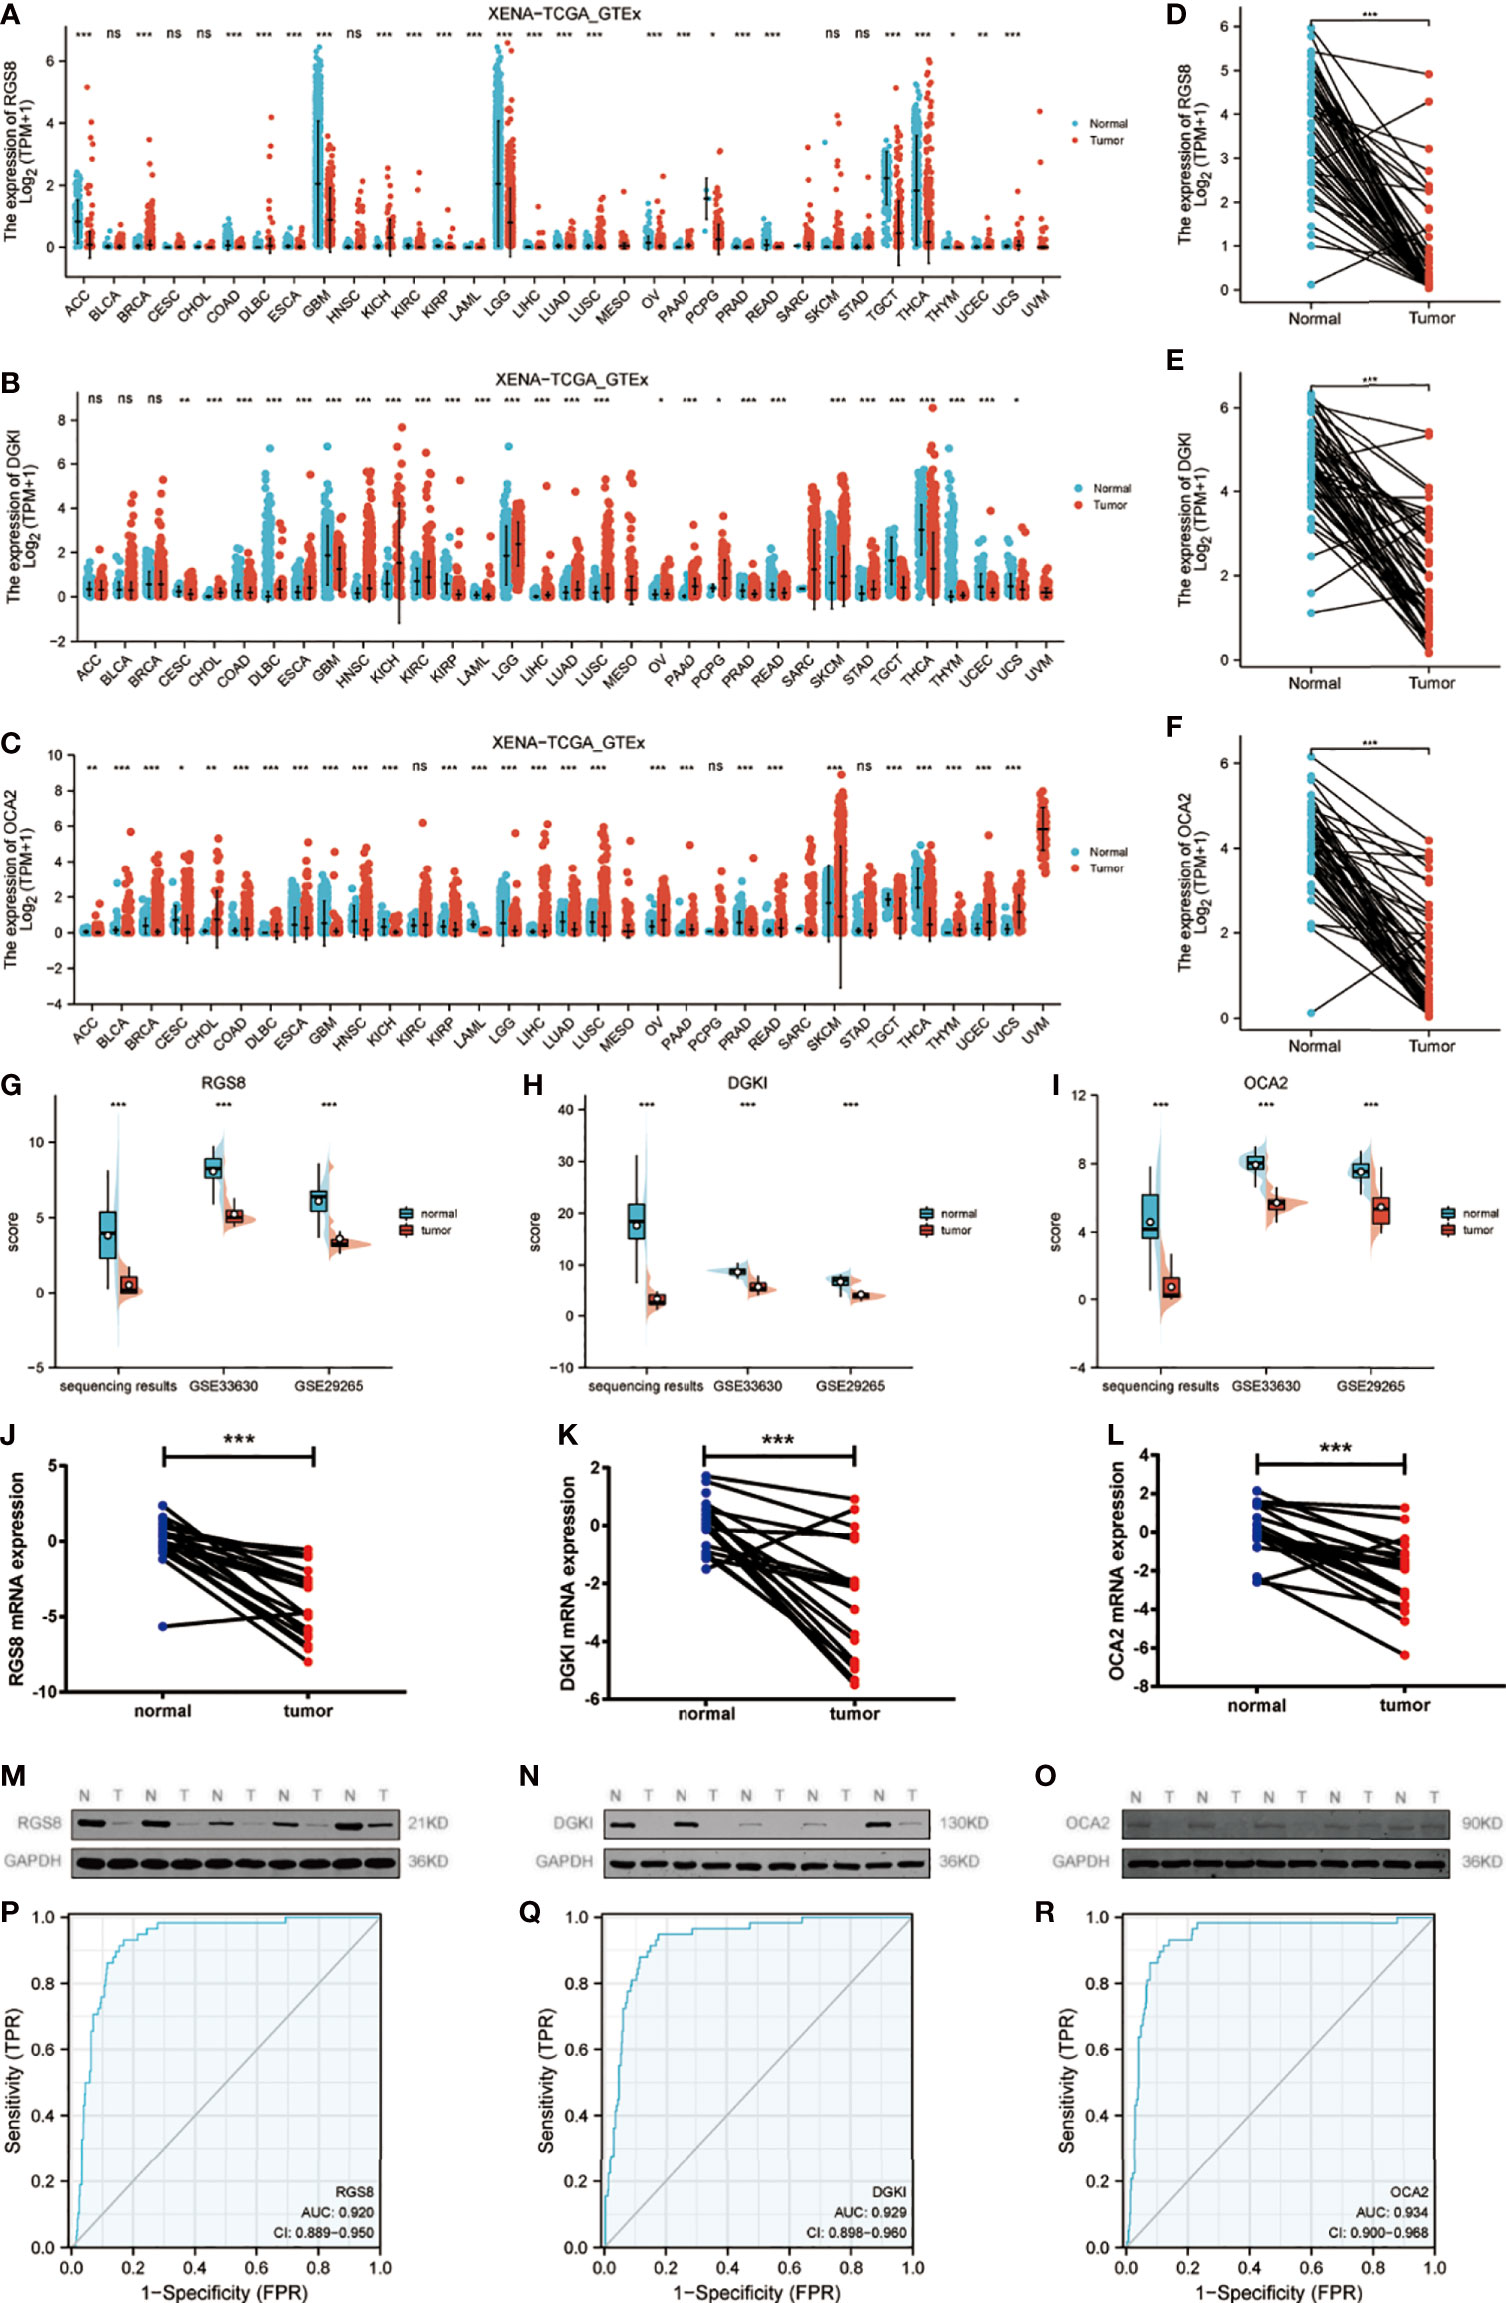
Figure 2 Expression of RGS8, DGKI and OCA2 was decreased in THCA tissues. In different cancers in TCGA and GTEx databases, the upregulation and downregulation levels of RGS8 (A), DGKI (B), OCA2 (C). The expression levels of RGS8 (D), DGKI (E), OCA2 (F) in THCA, n=58. The expression levels of RGS8 (G), DGKI (H), OCA2 (I) in transcriptome sequencing results, GSE33630 and GSE29265. The expression levels of RGS8 (J), DGKI (K), OCA2 (L) in 20 pairs of papillary thyroid carcinoma tissues and adjacent normal tissues were detected by qRT–PCR. The expression levels of RGS8 (M), DGKI (N), OCA2 (O) in 5 pairs of papillary thyroid carcinoma tissues and adjacent normal tissues were detected by western blotting. The ROC curve of RGS8 (P), DGKI (Q), OCA2 (R). *p < 0.05, **p < 0.01, ***p < 0.001, NS, no significance.
Correlation between RGS8, DGKI and OCA2 expression and clinical features
To investigate the role of RGS8, DGKI and OCA2 expression, we explored the relationship between RGS8, DGKI, and OCA2 expression and clinical features in thyroid cancer patients, and the expression data were obtained from TCGA. As demonstrated in Figures 3A–E, the expression of RGS8 was associated with the T stage (T1 and 2 vs. T3 and 4, P=6.4e-05), N stage (N0 vs. N1, P=2.2e-06), pathological stage (stages III and IV vs. stage I and II, P=0.01), gender (female vs. male, P=0.02), and extrathyroidal extension (No vs. Yes, P=3.7e-07). As shown in Figures 3F–K, the expression level of DGKI was significantly related to the T stage (T1 and 2 vs. T3 and 4, P=1.1e-04), N stage (N0 vs. N1, P=1.1e-05), pathological stage (stages III and IV vs. stage I and II, P=3.5e-05), histological type (follicular vs. classical, P=3.0e-07, follicular vs. tall cell P=4.7e-09, classical vs. tall cell P=3.1e-03), extrathyroidal extension (No vs. Yes, P=3.7e-06), and thyroid gland disorder history (lymphocytic thyroiditis vs. nodular hyperplasia, P=0.01). The expression of OCA2 was correlated with the T stage (T1 and 2 vs. T3 and 4, P=2.5e-04), N stage (N0 vs. N1, P=4.1e-03), pathological stage (stages III and IV vs. stage I and II, P=6.3e-04), age (≤45 years vs. >45 years, P=6.5e-03), and extrathyroidal extension (No vs. Yes, P=1.3e-05) as shown in Figures 3L–P. The correlation between the expression of RGS8, DGKI and OCA2 and other clinicopathological features was shown in Supplementary Tables 2, 3 and 4. Our research demonstrates that THCA patients with a low expression of RGS8, DGKI, and OCA2 were more likely to develop to a more advanced stage.
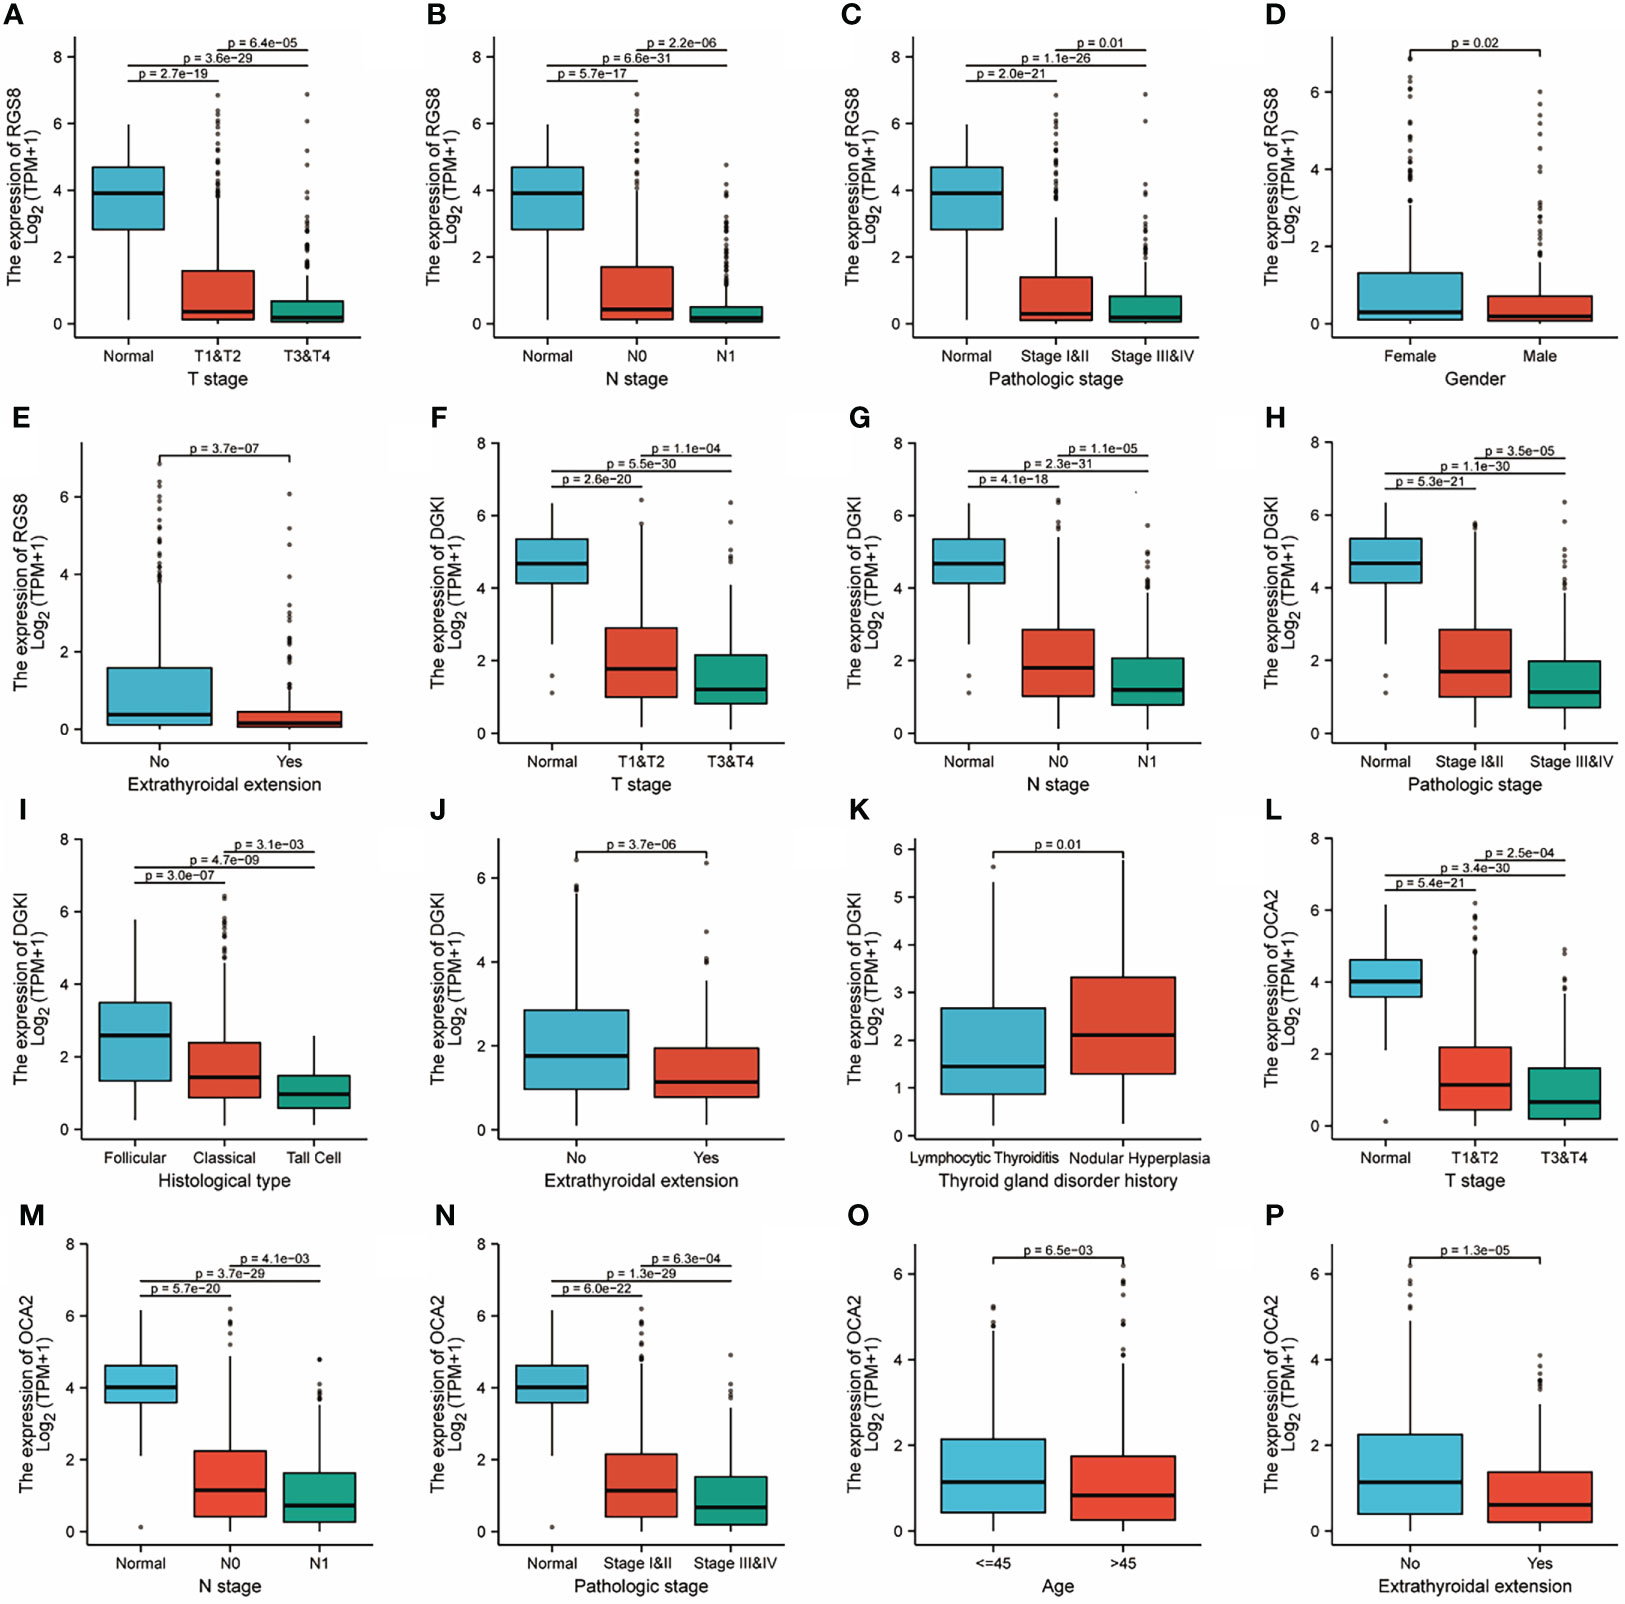
Figure 3 Clinicopathological features and expression of RGS8, DGKI and OCA2 in THCA. RGS8 expression level with T stage (A), N stage (B), pathological stage (C), gender (D), extrathyroidal extension (E). DGKI expression level with T stage (F), N stage (G), pathological stage (H), histological type (I), extrathyroidal extension (J), thyroid gland disorder history (K). OCA2 expression level with T stage (L), N stage (M), pathological stage (N), age (O), extrathyroidal extension (P).
High expression of RGS8, DGKI and OCA2 was significantly related to a better prognosis in patients with THCA
To determine whether the expression of RGS8, DGKI and OCA2 affect the prognosis of patients, we classified the THCA patients in the TCGA database and conducted a prognostic analysis on the basis of the expression values of RGS8, DGKI and OCA2. Among the THCA patients, the PFI rates in the RGS8 (HR=0.38, P=0.001), DGKI (HR=0.52, P=0.022), and OCA2 (HR=0.41, P=0.003) high expression group were obviously higher than those in the low expression group (Figures 4A–C). Then, based on the PFI, we performed a prognostic subgroup analysis, and the results showed that the PFI rates of the THCA samples with higher RGS8 (HR=0.42, P=0.005), DGKI (HR=0.51, P=0.025) and OCA2 (HR=0.54, P=0.037) expression were better in the T stage (T 2/3/4), the PFI rates of the THCA samples with higher RGS8 (HR=0.33, P=0.002), DGKI (HR=0.53, P=0.055) and OCA2 (HR=0.32, P=0.002) were better in the histological type (classical), the PFI rates of the THCA samples with higher RGS8 (HR=0.20, P=0.004), DGKI (HR=0.15, P=0.002) and OCA2 (HR=0.14, P=0.001) expression were better in the primary neoplasm focus type (multifocal) and that the PFI rates of the THCA samples with higher RGS8 (HR=0.35, P=0.004), DGKI (HR=0.46, P=0.026) and OCA2 (HR=0.33, P=0.002) expression were better in the residual tumor (R0) (Figures 4D–O). In univariate analysis, RGS8, DGKI and OCA2 expression were associated with PFI (Supplementary Table 5). These data demonstrate that an increased expression of RGS8, DGKI, and OCA2 is associated with a better PFI, and it has the ability to predict prognosis in some specific types of thyroid cancer.
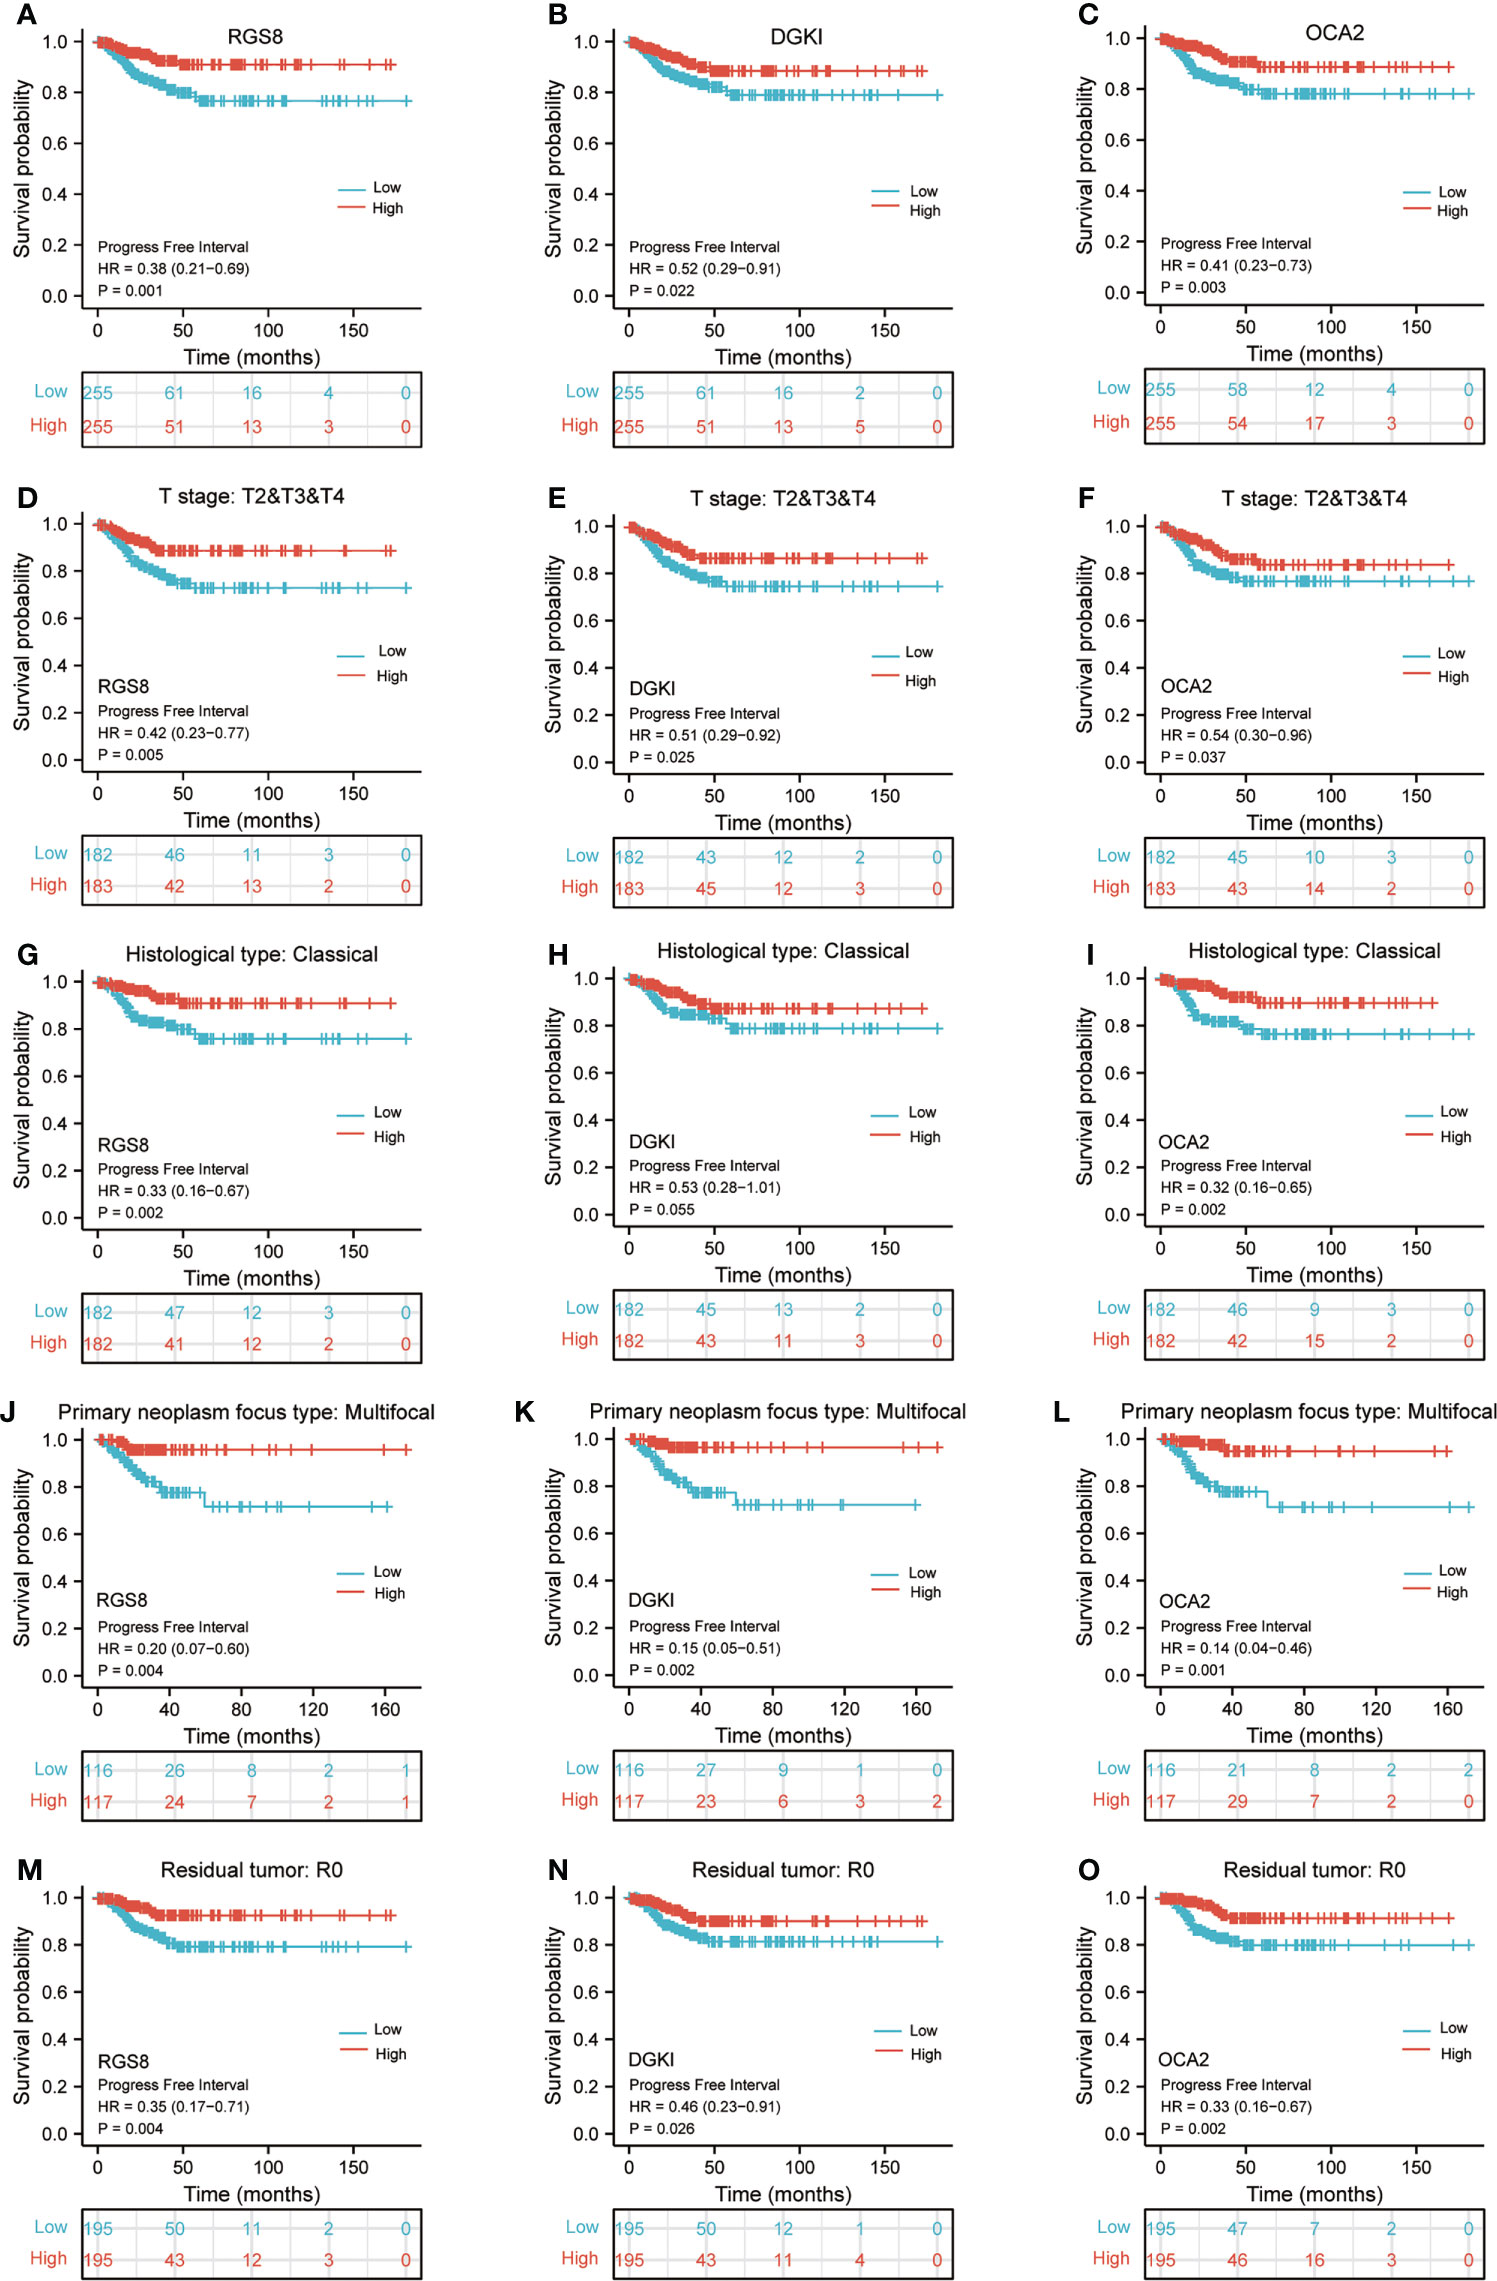
Figure 4 Kaplan–Meier survival plots comparing the low and high expression of RGS8, DGKI and OCA2 in THCA. PFI survival curves of patients with THCA between high and low expression of RGS8 (A), DGKI (B) and OCA2 (C). PFI survival curves of T stages 2, 3 and 4 between RGS8-high and -low patients (D), DGKI-high and -low patients (E), OCA2-high and -low patients (F) with THCA. PFI survival curves of classical histological type between RGS8-high and -low patients (G), DGKI-high and -low patients (H), OCA2-high and -low patients (I) with THCA. PFI survival curves of multifocal primary neoplasm focus type between RGS8-high and -low patients (J), DGKI-high and -low patients (K), OCA2-high and -low patients (L) with THCA. PFI survival curves of R0 between RGS8-high and -low patients (M), DGKI-high and -low patients (N), OCA2-high and -low patients (O) with THCA.
Enrichment of biofunction and associated genes analysis of RGS8, DGKI and OCA2 in THCA
To analyse the biological function and associated pathways of RGS8-related genes, DGKI-related genes and OCA2-related genes, we performed a biological function correlation analysis using TCGA data, and the results demonstrated that RGS8-, DGKI- and OCA2- related genes were involved in numerous of biological processes (BPs), cellular compositions (CCs), molecular functions (MFs) and KEGG pathways. Regarding the GO analysis, RGS8 was mostly enriched in the regulation of the membrane potential, transporter complex, ion gated channel activity and more importantly, thyroid hormone generation and thyroid hormone metabolic process (Figure 5A). The differential expression of DGKI could modulate the regulation of the immune effector process, the external side of the plasma membrane, and passive transmembrane transporter activity, including thyroid hormone generation and thyroid hormone metabolic process (Figure 5B). OCA2 is mainly related to cellular divalent inorganic cation homeostasis, synaptic membrane, passive transmembrane transporter activity and neuroactive ligand–receptor interaction (Figure 5C).
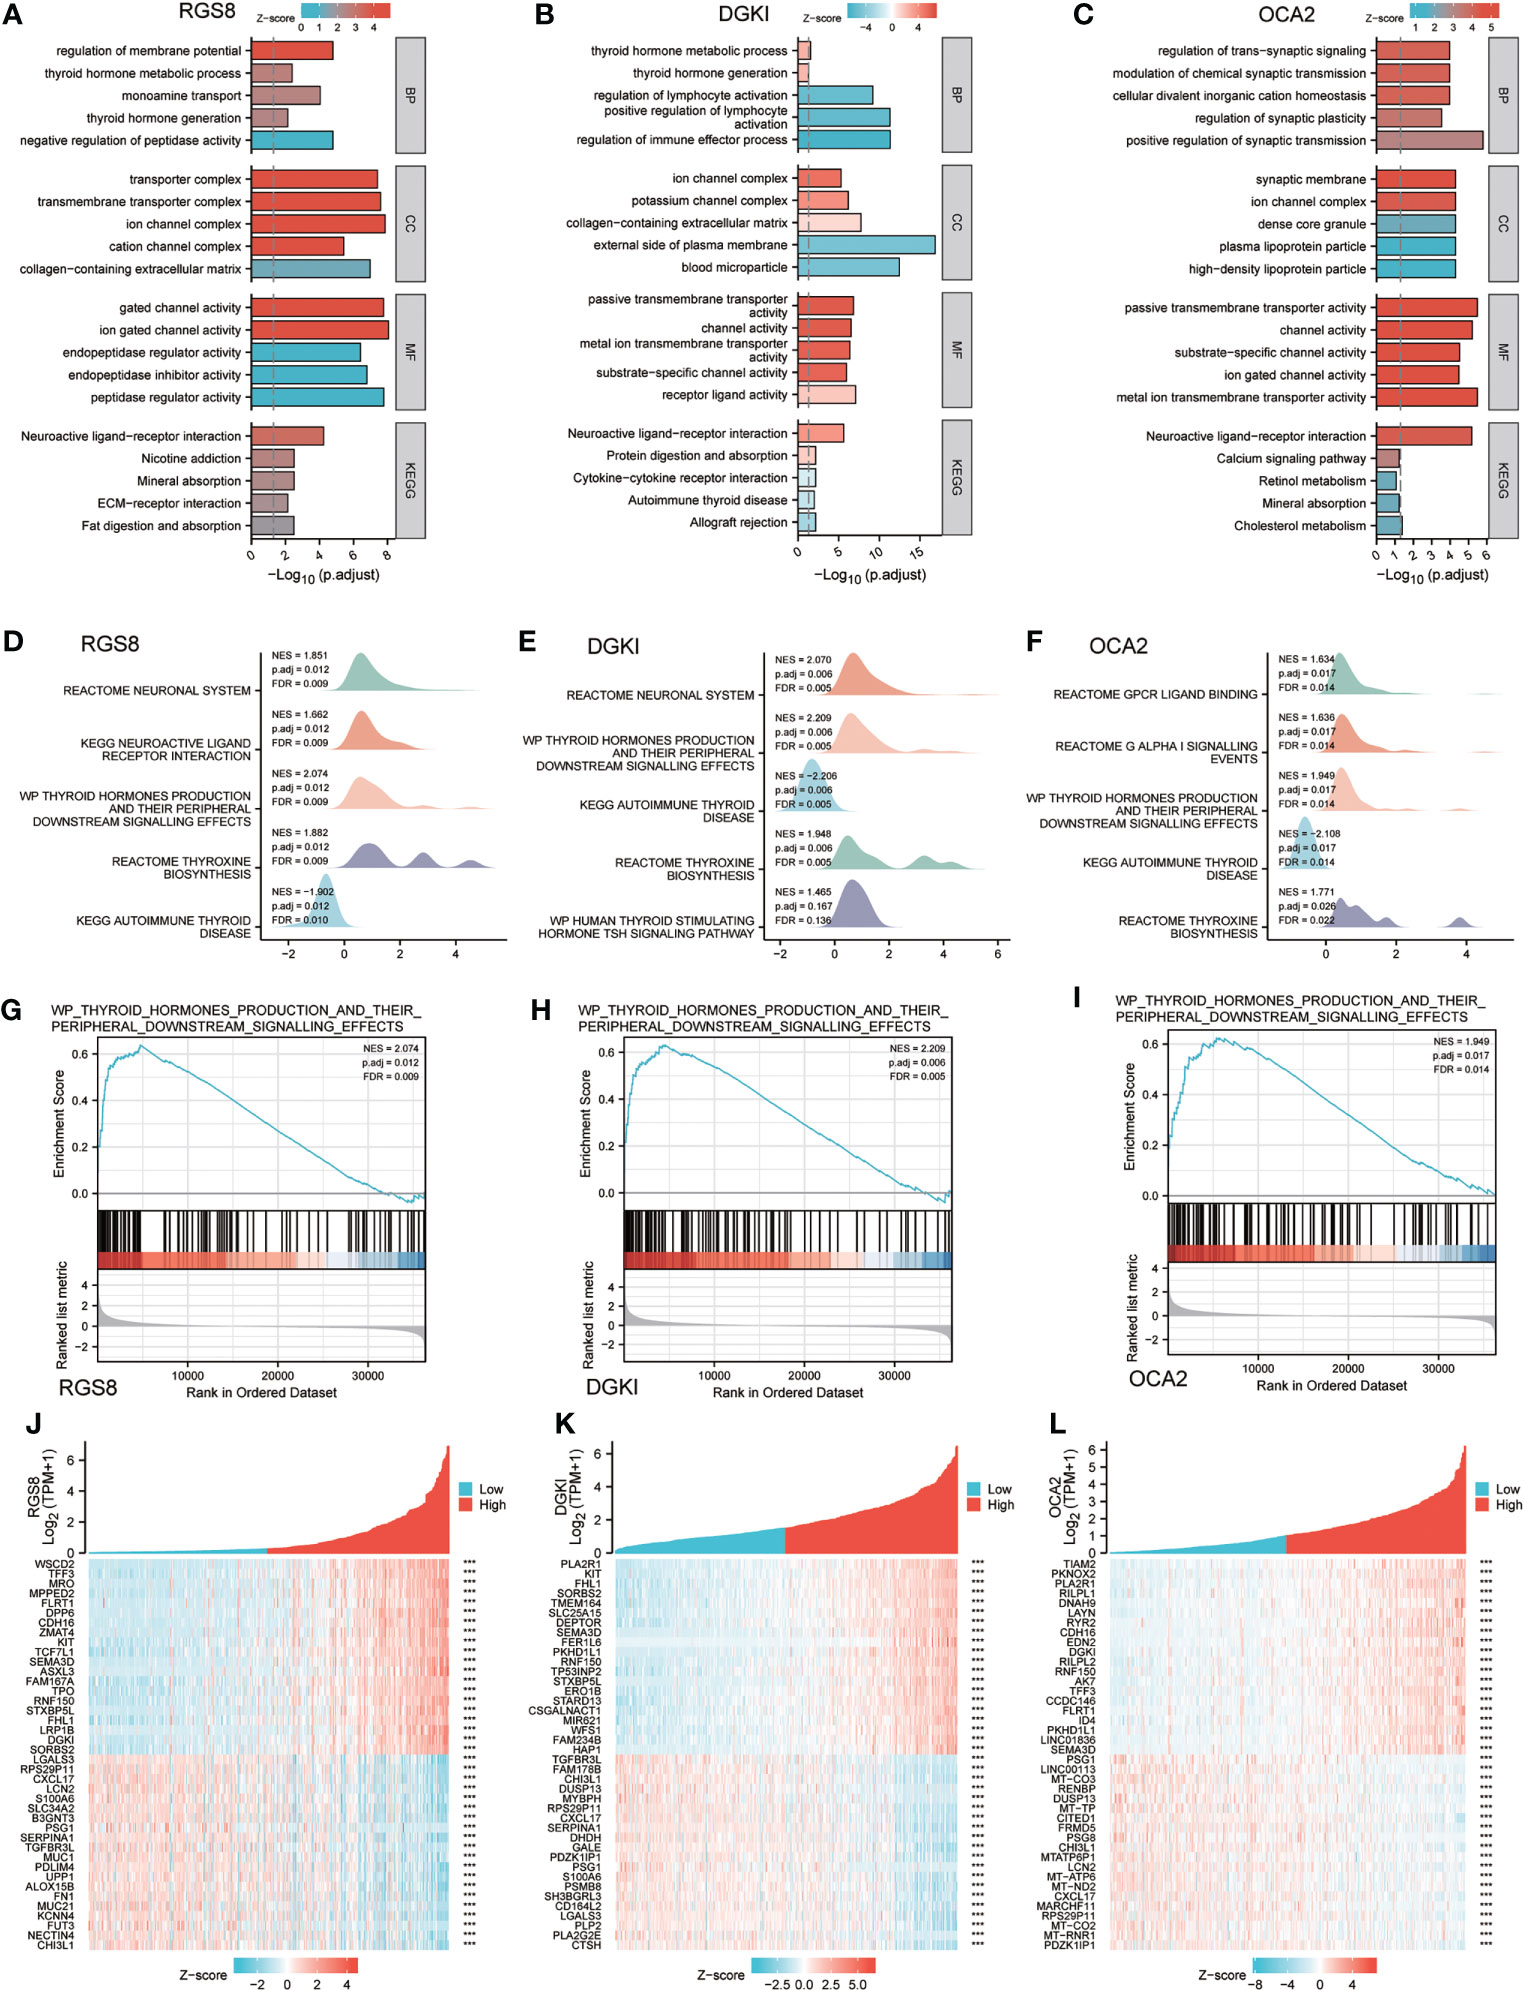
Figure 5 Enrichment of biofunction and associated genes analysis of RGS8, DGKI and OCA2 in THCA. The GOKEGG analysis of RGS8 (A), DGKI (B), OCA2 (C). The GSEA of RGS8 (D), DGKI (E), OCA2 (F), and the thyroid hormones production and their peripheral downstream signalling effects of RGS8 (G), DGKI (H), OCA2 (I) in GSEA analysis. Heatmap of coexpression patterns of RGS8 (J), DGKI (K) and OCA2 (L) related genes. ***p < 0.001.
To explore RGS8-, DGKI- and OCA2- associated pathways in THCA, we performed a GSEA using gene sets from the Molecular Signatures Database Collection (MSigDB) (c2.cp.reactome/biocarta/kegg.v6.2.symbols.gmt). The enrichment plots of the GSEA showed that thyroid hormone production and its peripheral downstream signalling effects, thyroxine biosynthesis, and autoimmune thyroid disease were significantly enriched in RGS8, DGKI and OCA2 (Figures 5D–I). We also studied the coexpression pattern of RGS8, DGKI and OCA2 in THCA in the TCGA database. (Figures 5J–L).
Correlation between RGS8, DGKI, OCA2 expression and immune characteristics
Previous studies have shown that tumor infiltrating immune cells (TIICs) play a crucial regulatory role in the occurrence and development of tumors. By quantifying ssGSEA in the THCA tumor environment, we applied the Spearman correlation to prove the correlation between the level of immune cell infiltration and the expression of RGS8, DGKI and OCA2. First, using TISIDB, we analysed the relationship between the expression levels of RGS8, DGKI and OCA2 and the level of immune cell infiltration in different cancers (Supplementary Figures 1C–E). As shown in Figures 6A–E, RGS8 expression was negatively correlated with activated DCs (R=-0.352, P<0.01), DCs (R=-0.365, P<0.01), macrophages (R=-0.312, P<0.01), and neutrophils (R=-0.326, P<0.01) and positively associated with T cells (R=0.163, P<0.01). Similarly, as shown in Figures 6F–J, DGKI expression was negatively correlated with activated DCs (R=-0.398, P<0.01), DCs (R=-0.413, P<0.01), macrophages (R=-0.376, P<0.01), neutrophils (R=-0.337, P<0.01) and positively associated with T cells (R=0.169, P<0.01). As illustrated in Figures 6K–O, OCA2 expression was negatively correlated with activated DCs (R=-0.229, P<0.01), DCs (R=-0.211, P<0.01), TRegs (R=-0.224, P<0.01), and Th2 cells (R=-0.207, P<0.01) and positively associated with NK cells (R=0.226, P<0.01).
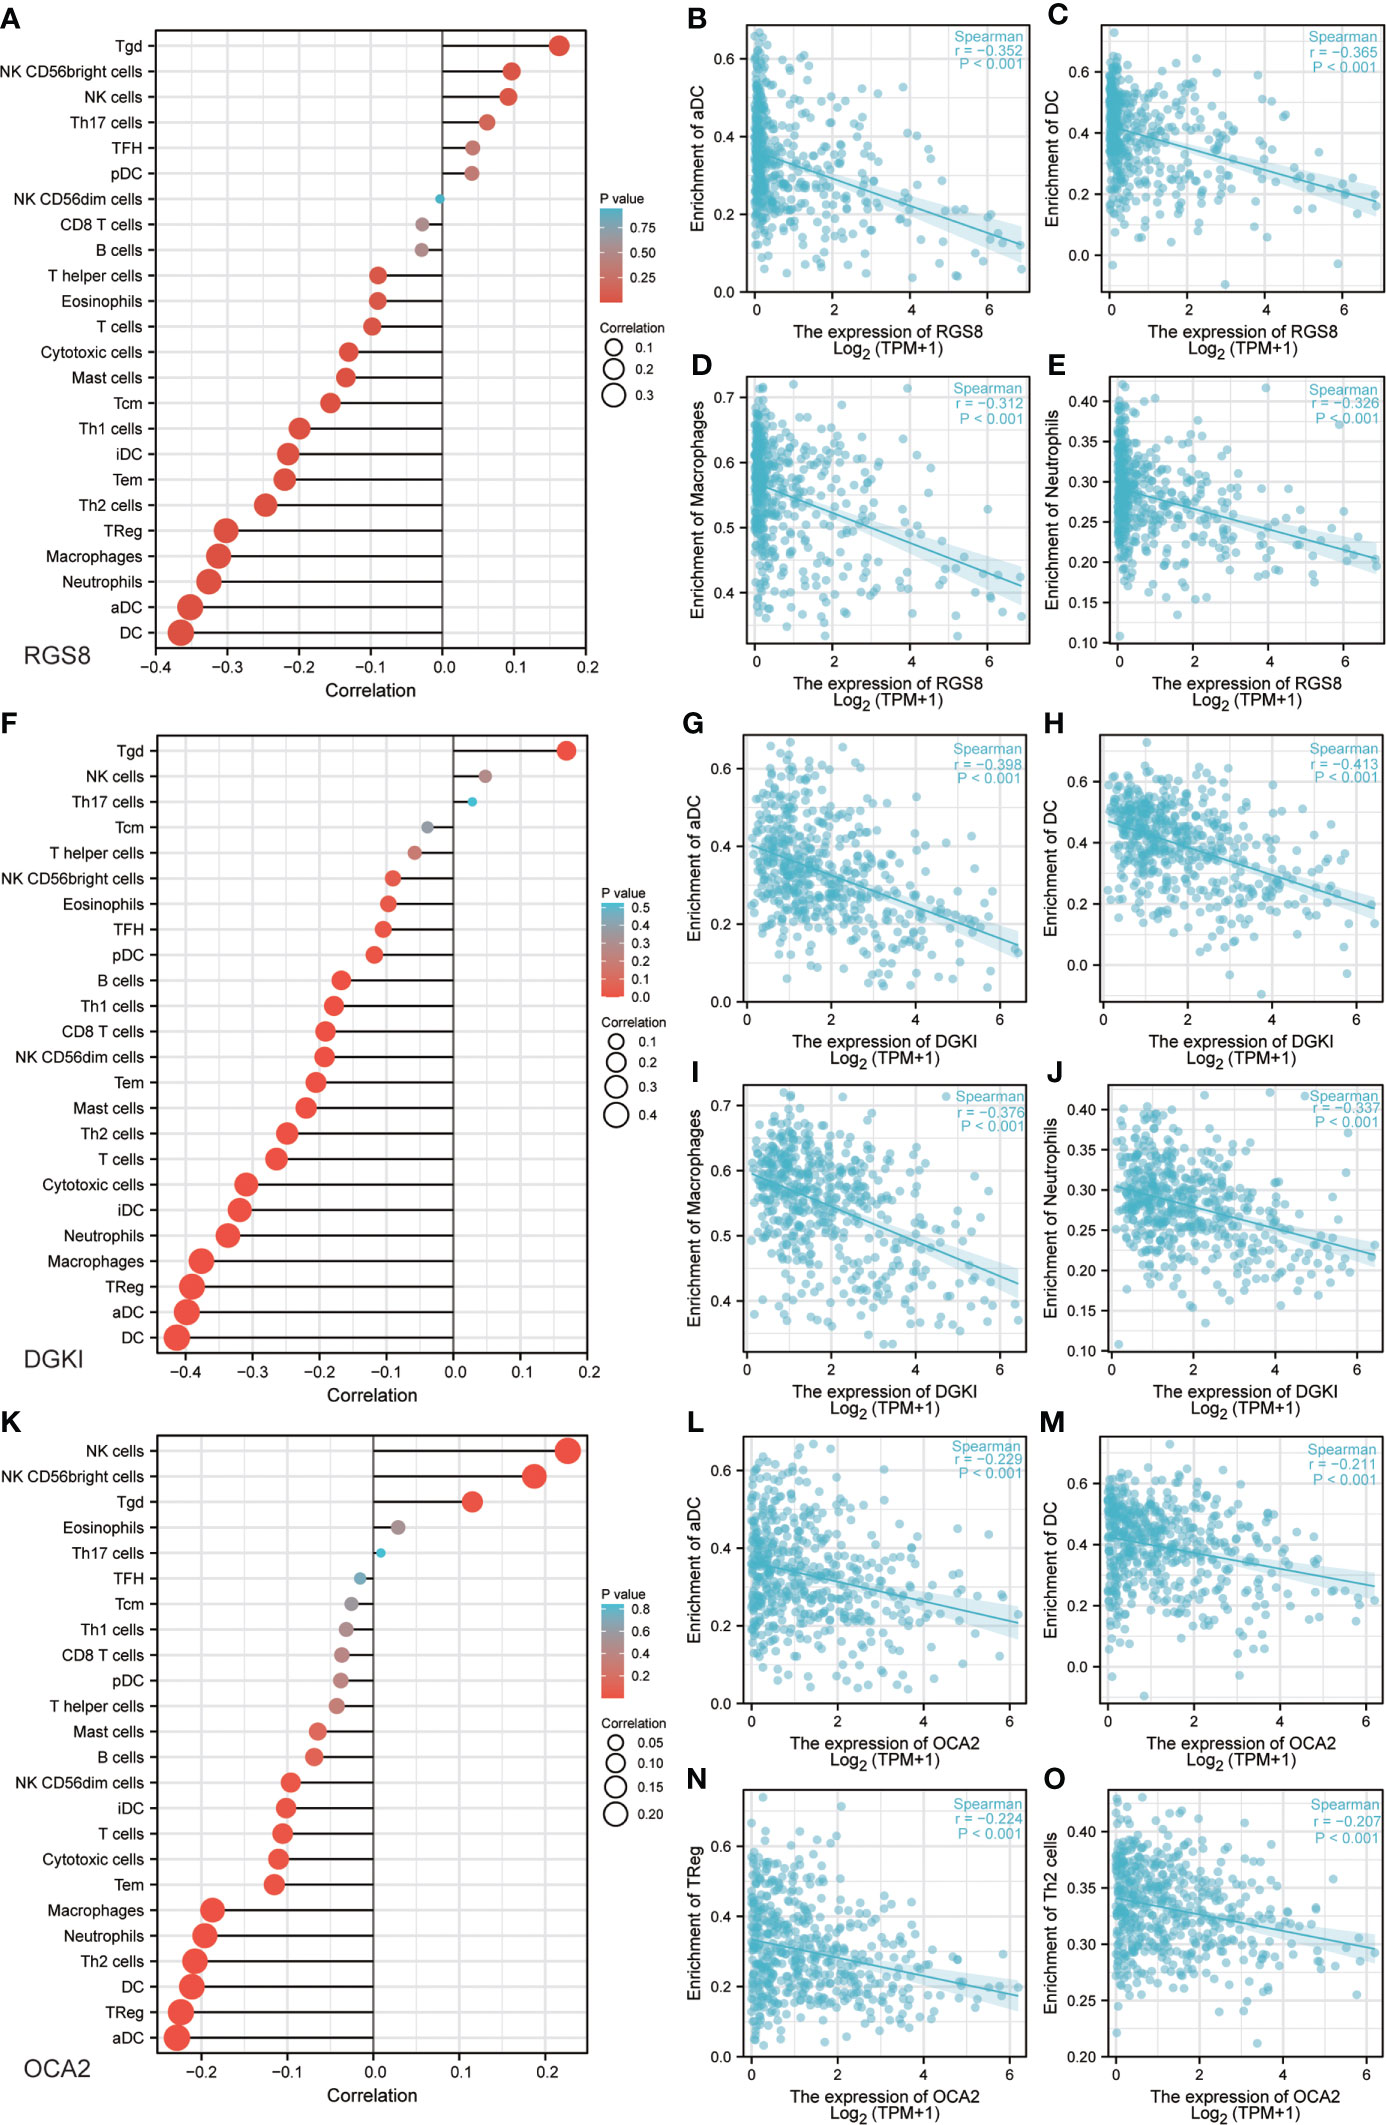
Figure 6 Correlation between RGS8, DGKI, OCA2 expression and immune characteristics. Association between the RGS8 (A), DGKI (F), OCA2 (K) expression level and relative abundances of 24 immune cells. Scatter plot of RGS8 (B–E), DGKI (G–J), OCA2 (L–O) expression and individual immune cell infiltration levels.
DNA methylation of OCA2
DNA methylation is an indispensable component of epigenetics and can silence the expression of methylated genes. To explore the cause of the low expression of OCA2 in THCA, the UALCAN online database was used to analyse the methylation status of OCA2. The DNA methylation level of OCA2 was expressively elevated in the THCA tumor tissue compared with that in normal tissue (Figure 7A). OCA2 is highly methylated in old age and advanced tumors (Figures 7B, C). Some predicted CpG sites of OCA2 were negatively correlated with the methylation levels (Figures 7D–O). These results suggest that abnormal methylation is a main cause of OCA2 gene silencing.
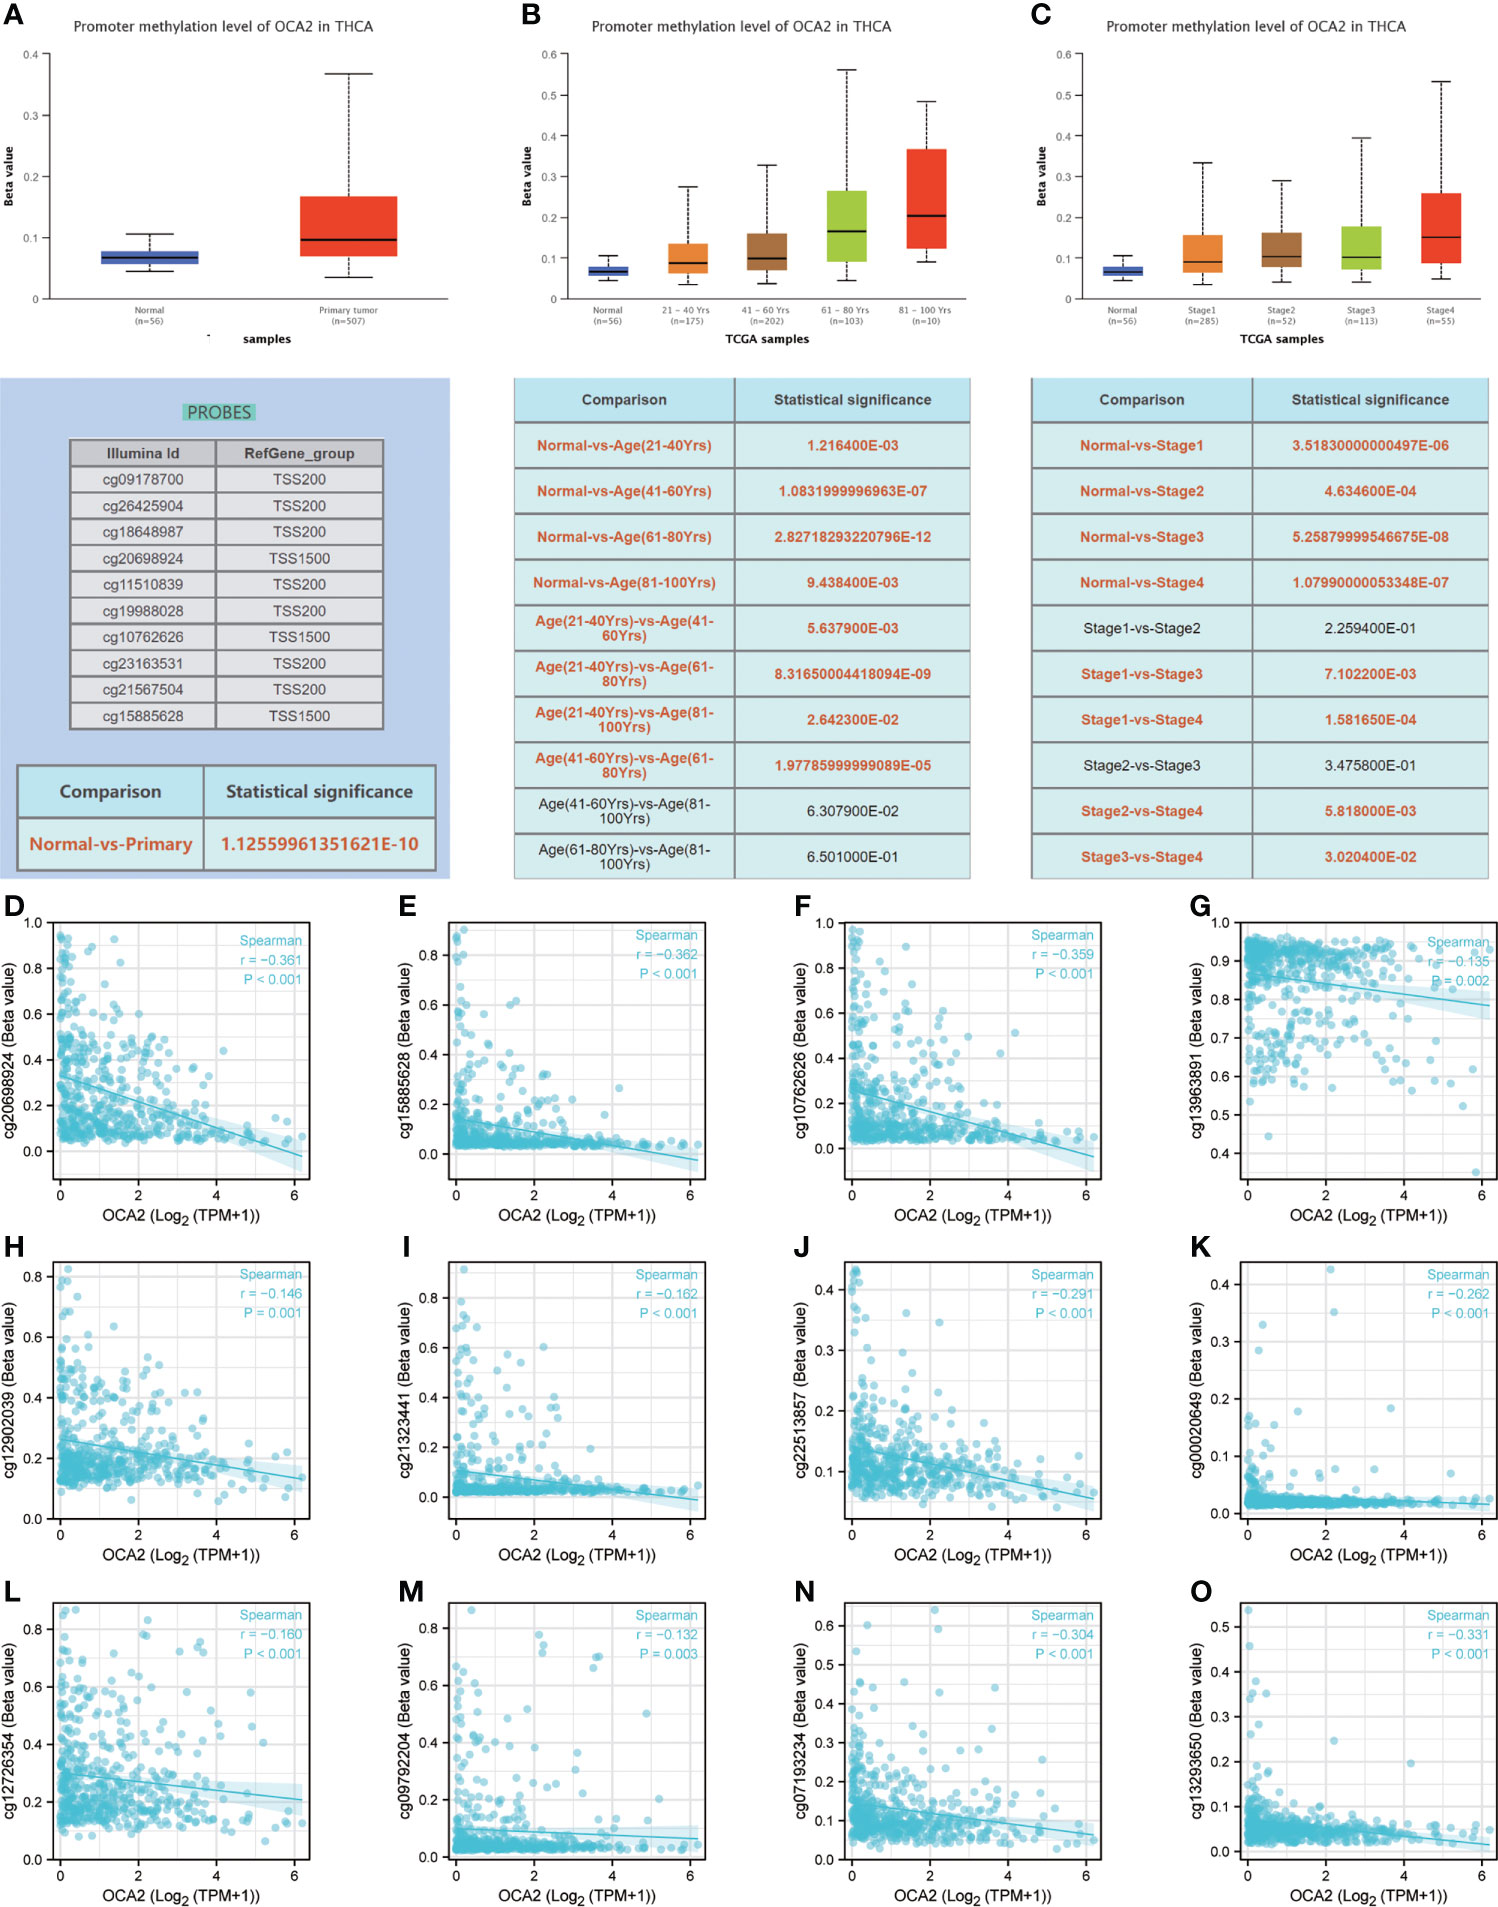
Figure 7 DNA methylation of OCA2. Expression of OCA2 DNA methylation level in THCA and normal tissues (A). Expression of OCA2 DNA methylation levels in THCA patients of different ages (B). Expression of OCA2 DNA methylation levels THCA patients with different pathologic stages (C). Different CpG sites of OCA2 methylation levels in THCA (D–O).
Discussion
Thyroid carcinoma is the most common endocrine malignant tumor, among these; papillary thyroid carcinoma (PTC) is particularly important (14). On a global scale, the incidence of PTC has been rising (15). Although the prognosis of PTC is optimistic, the survival rate of PTC patients with invasive characteristics is not satisfactory (16). Currently, reliable and specific markers for the detection and staging of the disease are lacking, requiring additional surgery to obtain a definitive diagnosis (17). As a result, patients with PTC have the additional risks of surgical trauma and surgical complications. Traditional clinicopathological parameters, such as TNM staging, can forecast PTC-related mortality, but it is difficult to estimate the risk of recurrence (18). It is very urgent to explore the molecular mechanism underlying PTC and predict the prognosis of PTC.
In this study, 91 reliable differentially expressed genes were identified in PTC by sequencing and a comprehensive analysis of GEO and TCGA datasets. We experimentally verified these genes and found that the expression of RGS8, DGKI and OCA2 was closely related to THCA PFI.
G protein signal regulatory proteins were originally described as inhibitors of G protein-coupled receptor (GPCR)-induced signal transduction cascades and can enhance the inherent GTPase activity of heterotrimer G proteins (19). RGS8 expression seems to be mainly distributed in the brain (20) and is a brain-enriched protein. RGS8 has been reported in human breast cancer and pancreatic cancer (21, 22), and was downregulated in ovarian cancer (23), but the molecular mechanism remains unclear. RGS8 has not been reported to be associated with thyroid cancer.
Diacylglycerol (DAG) plays a central role in complex lipid synthesis and intracellular signal transduction. Diacylglycerol kinases are special lipid kinases that convert glycerol diacylglycerol to phosphatidic acid and terminate DAG-based signal transduction (24). Diacylglycerol kinase iota (DGKI) is a member of the subfamily of type IV diacylglycerol kinases and has been reported to be isolated from human retinas and brain libraries (25). The latest studies have reported that DGKI is overexpressed in colon, gastric and liver carcinomas and is linked to an unsatisfactory prognosis (26–28). DGKI has also been reported to be associated with a better prognosis in glioblastoma (29). Nevertheless, the association between DGKI and thyroid cancer has not been reported.
OCA2, also known as pink eye dilution protein or P-protein, is a protein with a crucial function in pigmentation (30). The OCA2 gene is homologous to the ion permeable membrane and encodes a pigment cell-specific 12 transmembrane domain protein (31). Mutations in the OCA2 gene have been proven to be related to an increased risk of skin melanoma or basal cell carcinoma (32, 33). OCA2 gene have been reported to be associated with overall survival among patients with estrogen receptor–negative tumors, with the rare G allele being associated with increased overall survival (34). However, the relationship between OCA2 and other carcinomas has not been reported.
In multiple databases, we found that these three genes are abnormally expressed in many tumors and significantly reduced in thyroid cancer. Then, we used qRT–PCR and a Western blot analysis to detect the expression of RGS8, DGKI and OCA2 in tumor tissues and corresponding noncancer tissues from THCA patients. The results showed that the mRNA and protein expression levels of RGS8, DGKI and OCA2 were obviously decreased in the THCA tissues compared to those in the adjacent noncancer tissues. The ROC scores of these three genes in the TCGA database were high, indicating a high diagnostic value.
To further investigate the significance and mechanism of RGS8, DGKI and OCA2 in thyroid cancer, we summarized the relationship between RGS8, DGKI and OCA2 expression and clinical features in the TCGA database of THCA patients. The results indicated that THCA patients with a low expression of RGS8, DGKI and OCA2 were more likely to develop advanced-stage. We also classified the THCA patients in the TCGA database and analysed their prognosis based on the expression values of RGS8, DGKI and OCA2. The PFI rate of the THCA patients with a high expression of RGS8, DGKI and OCA2 was obviously higher than that of the patients in the low expression group.
To explore the related pathways and biological functions of RGS8-, DGKI- and OCA2-related genes, a biological function correlation analysis was performed. The results showed that RGS8-, DGKI- and OCA2-related genes were involved in multiple BPs, CCs, MFs and KEGG pathways, including enrichment in thyroid hormone production and thyroid hormone metabolism. The GSEA showed that RGS8, DGKI and OCA2 were enriched in thyroid hormone production and its peripheral downstream signal transduction effects, thyroxine biosynthesis, and autoimmune thyroid diseases.
Research studies have reported that TIICs play an indispensable role in regulating the occurrence and development of tumors (35). The key to antitumor action is an effective immune response, but cancer cells have evolved various mechanisms that allow tumor cells to evade immune cell attacks, such as antigen presentation dysfunction and immunosuppressive cell collection (36). Previous studies have reported that immune infiltration can influence patient outcomes (37). Our results revealed that the expression of RGS8, DGKI, and OCA2 in thyroid carcinoma was negatively correlated with multiple types of immune cell infiltration, including dendritic cells (DCs and aDCs), macrophages and neutrophils. Many studies have proven that dendritic cells (38), macrophages (39) and neutrophils (40) play vital roles in the regulation of tumor development. These results explain why RGS8, DGKI and OCA2 may play important regulatory roles in the tumor immune microenvironment and THCA development.
In mammals, DNA methylation is a type of epigenetic modification that has been well studied. Methylation in normal cells can guarantee the proper regulation of gene expression and stable gene silencing (41). Proper DNA methylation is critical for development and normal cell function; thus, any abnormality in this process can lead to a variety of diseases, such as cancer. Numerous tumor suppressor genes silenced by DNA hypermethylation were found in tumor tissues. Undoubtedly, DNA methylation-related silencing can be a marker of cancer in humans because it plays a key role in tumors (42). We discovered that the DNA methylation level of OCA2 in cancer tissues was significantly higher than that in normal samples, suggesting that the high methylation level of OCA2 may be a reason for the low expression of OCA2 in THCA.
Although our study determined the prognostic value of RGS8, DGKI and OCA2 in THCA through a bioinformatics analysis, there are still some limitations and deficiencies. First, although we have identified the relationship between RGS8, DGKI and OCA2 expression levels and prognosis, their important regulatory mechanisms in THCA need to be further validated and evaluated by analyzing clinical samples from more centers, and the use of a single cohort to predict prognosis in public data sets is far from perfect. Second, in order to better assess the important role of genes in the progression of THCA, all types of clinical features should be involved, including treatment modalities in different patients, and loss of information in public databases was inevitable. The molecular mechanisms of RGS8, DGKI and OCA2 in THCA genesis and development have not been studied. Relevant experiments will be designed and implemented in our future research.
Conclusions
In summary, this study proved that RGS8, DGKI and OCA2 are downregulated in THCA tissues and are closely related to the clinical stage, prognosis, immune infiltration and DNA methylation, which are valuable prognostic markers of THCA.
Data availability statement
The datasets presented in this study can be found in online repositories. The names of the repository/repositories and accession number(s) can be found below: https://www.ncbi.nlm.nih.gov/-PRJNA861677
Ethics statement
The studies involving human participants were reviewed and approved by the Ethics Committee of the First Affiliated Hospital of Harbin Medical University. The patients/participants provided their written informed consent to participate in this study.
Author contributions
MB, SK, HY and YX made equal contributions to this article. MB, SK, HY planned the research trials and engaged in article writing. YX, CW, SL attended in information generation and analysis. JH, YY provided assistance with analysis. All authors contributed to the article and approved the submitted version.
Funding
This work was supported by the Research Fund of the National Natural Scientific Foundation of China (81100305, 81470876, 81502605 and 81270527), Natural Science Foundation of Heilongjiang Province of China (QC2013C094, LC2018037), Chen Xiaoping Foundation for the Development of Science and Technology of Hubei Province (CXPJJH11900001-2019349), Outstanding Youth Training Fund from Academician Yu Weihan of Harbin Medical University (2014), and the First Affiliated Hospital of Harbin Medical University (2019L01, HYD2020JQ0007, HYD2020JQ0012).
Acknowledgments
The authors thank the researchers, staff and patients who participated in the study.
Conflict of interest
The authors declare that the research was conducted in the absence of any commercial or financial relationships that could be construed as a potential conflict of interest.
Publisher’s note
All claims expressed in this article are solely those of the authors and do not necessarily represent those of their affiliated organizations, or those of the publisher, the editors and the reviewers. Any product that may be evaluated in this article, or claim that may be made by its manufacturer, is not guaranteed or endorsed by the publisher.
Supplementary material
The Supplementary Material for this article can be found online at: https://www.frontiersin.org/articles/10.3389/fimmu.2022.964891/full#supplementary-material
Supplementary Figure 1 | The GOKEGG analysis of upregulated genes (A) and downregulated genes (B). Relationship between the expression of RGS8 (C), DGKI (D), OCA2 (E) and the level of immune cell infiltration in different cancers.
References
1. Prete A, Borges de Souza P, Censi S, Muzza M, Nucci N, Sponziello M. Update on fundamental mechanisms of thyroid cancer. Front Endocrinol (Lausanne) (2020) 11:102. doi: 10.3389/fendo.2020.00102
2. Seib CD, Sosa JA. Evolving understanding of the epidemiology of thyroid cancer. Endocrinol Metab Clin North Am (2019) 48(1):23–35. doi: 10.1016/j.ecl.2018.10.002
3. Ito Y, Miyauchi A, Kihara M, Fukushima M, Higashiyama T, Miya A. Overall survival of papillary thyroid carcinoma patients: A single-institution long-term follow-up of 5897 patients. World J Surg (2018) 42(3):615–22. doi: 10.1007/s00268-018-4479-z
4. Xue C, Cheng Y, Wu J, Ke K, Miao C, Chen E, et al. Circular RNA CircPRMT5 accelerates proliferation and invasion of papillary thyroid cancer through regulation of miR-30c/E2F3 axis. Cancer Manag Res (2020) 12:3285–91. doi: 10.2147/CMAR.S249237
5. Clough E, Barrett T. The gene expression omnibus database. Methods Mol Biol (2016) 1418:93–110. doi: 10.1007/978-1-4939-3578-9_5
6. Wang Z, Jensen MA, Zenklusen JC. A practical guide to the cancer genome atlas (TCGA). Methods Mol Biol (2016) 1418:111–41. doi: 10.1007/978-1-4939-3578-9_6
7. Liu J, Lichtenberg T, Hoadley KA, Poisson LM, Lazar AJ, Cherniack AD, et al. An integrated TCGA pan-cancer clinical data resource to drive high-quality survival outcome analytics. Cell (2018) 173(2):400–16.e11. doi: 10.1016/j.cell.2018.02.052
8. Yu G, Wang LG, Han Y, He QY. clusterProfiler: An r package for comparing biological themes among gene clusters. Omics (2012) 16(5):284–7. doi: 10.1089/omi.2011.0118
9. Ru B, Wong CN, Tong Y, Zhong JY, Zhong SSW, Wu WC, et al. TISIDB: An integrated repository portal for tumor-immune system interactions. Bioinformatics (2019) 35(20):4200–2. doi: 10.1093/bioinformatics/btz210
10. Hänzelmann S, Castelo R, Guinney J. GSVA: Gene set variation analysis for microarray and RNA-seq data. BMC Bioinf (2013) 14:7. doi: 10.1186/1471-2105-14-7
11. Bindea G, Mlecnik B, Tosolini M, Kirilovsky A, Waldner M, Obenauf AC, et al. Spatiotemporal dynamics of intratumoral immune cells reveal the immune landscape in human cancer. Immunity (2013) 39(4):782–95. doi: 10.1016/j.immuni.2013.10.003
12. Chandrashekar DS, Bashel B, Balasubramanya SAH, Creighton CJ, Ponce-Rodriguez I, Chakravarthi B, et al. UALCAN: A portal for facilitating tumor subgroup gene expression and survival analyses. Neoplasia (2017) 19(8):649–58. doi: 10.1016/j.neo.2017.05.002
13. Wang C, Dong L, Li X, Li Y, Zhang B, Wu H, et al. The PGC1α/NRF1-MPC1 axis suppresses tumor progression and enhances the sensitivity to sorafenib/doxorubicin treatment in hepatocellular carcinoma. Free Radic Biol Med (2021) 163:141–52. doi: 10.1016/j.freeradbiomed.2020.11.035
14. Sipos JA, Mazzaferri EL. Thyroid cancer epidemiology and prognostic variables. Clin Oncol (R Coll Radiol) (2010) 22(6):395–404. doi: 10.1016/j.clon.2010.05.004
15. Xu Y, Zheng X, Qiu Y, Jia W, Wang J, Yin S. Distinct metabolomic profiles of papillary thyroid carcinoma and benign thyroid adenoma. J Proteome Res (2015) 14(8):3315–21. doi: 10.1021/acs.jproteome.5b00351
16. Xue C, Cheng Y, Wu J, Ke K, Miao C, Chen E, et al. Circular RNA CircPRMT5 accelerates proliferation and invasion of papillary thyroid cancer through regulation of miR-30c/E2F3 axis. Cancer Manag Res (2020) 12:3285–91. doi: 10.2147/CMAR.S249237
17. Coelho M, Raposo L, Goodfellow BJ, Atzori L, Jones J, Manadas B, et al. The potential of metabolomics in the diagnosis of thyroid cancer. Int J Mol Sci (2020) 21(15):5272. doi: 10.3390/ijms21155272
18. Haugen BR, Alexander EK, Bible KC, Doherty GM, Mandel SJ, Nikiforov YE, et al. 2015 American Thyroid association management guidelines for adult patients with thyroid nodules and differentiated thyroid cancer: The American thyroid association guidelines task force on thyroid nodules and differentiated thyroid cancer. Thyroid (2016) 26(1):1–133. doi: 10.1089/thy.2015.0020
19. Bansal G, Druey KM, Xie Z. R4 RGS proteins: regulation of G-protein signaling and beyond. Pharmacol Ther (2007) 116(3):473–95. doi: 10.1016/j.pharmthera.2007.09.005
20. Larminie C, Murdock P, Walhin JP, Duckworth M, Blumer KJ, Scheideler MA, et al. Selective expression of regulators of G-protein signaling (RGS) in the human central nervous system. Brain Res Mol Brain Res (2004) 122(1):24–34. doi: 10.1016/j.molbrainres.2003.11.014
21. Wiechec E, Wiuf C, Overgaard J, Hansen LL. High-resolution melting analysis for mutation screening of RGSL1, RGS16, and RGS8 in breast cancer. Cancer Epidemiol Biomarkers Prev (2011) 20(2):397–407. doi: 10.1158/1055-9965.EPI-10-0514
22. Zolghadri Y, Pal Choudhuri S, Ocal O, Layeghi-Ghalehsoukhteh S, Berhe F, Hale MA, et al. Malnutrition in pancreatic ductal adenocarcinoma (PDA): Dietary pancreatic enzymes improve short-term health but stimulate tumor growth. Am J Pathol (2018) 188(3):616–26. doi: 10.1016/j.ajpath.2017.11.014
23. Hu Y, Zheng M, Wang S, Gao L, Gou R, Liu O, et al. Identification of a five-gene signature of the RGS gene family with prognostic value in ovarian cancer. Genomics (2021) 113(4):2134–44. doi: 10.1016/j.ygeno.2021.04.012
24. Merida I, Arranz-Nicolas J, Rodriguez-Rodriguez C, Avila-Flores A. Diacylglycerol kinase control of protein kinase c. Biochem J (2019) 476(8):1205–19. doi: 10.1042/BCJ20180620
25. Ding L, Traer E, McIntyre TM, Zimmerman GA, Prescott SM. The cloning and characterization of a novel human diacylglycerol kinase, DGKiota. J Biol Chem (1998) 273(49):32746–52. doi: 10.1074/jbc.273.49.32746
26. Penrose HM, Heller S, Cable C, Nakhoul H, Ungerleider N, Baddoo M, et al. In colonic ρ(0) (rho0) cells reduced mitochondrial function mediates transcriptomic alterations associated with cancer. Oncoscience (2017) 4(11-12):189–98. doi: 10.18632/oncoscience.386
27. Huang C, Zhao J, Luo C, Zhu Z. Overexpression of DGKI in gastric cancer predicts poor prognosis. Front Med (Lausanne) (2020) 7:320. doi: 10.3389/fmed.2020.00320
28. Wang XK, Liao XW, Huang R, Huang JL, Chen ZJ, Zhou X, et al. Clinical significance of long non-coding RNA DUXAP8 and its protein coding genes in hepatocellular carcinoma. J Cancer (2020) 11(20):6140–56. doi: 10.7150/jca.47902
29. Etcheverry A, Aubry M, Idbaih A, Vauleon E, Marie Y, Menei P, et al. DGKI methylation status modulates the prognostic value of MGMT in glioblastoma patients treated with combined radio-chemotherapy with temozolomide. PloS One (2014) 9(9):e104455. doi: 10.1371/journal.pone.0104455
30. Brilliant MH. The mouse p (pink-eyed dilution) and human p genes, oculocutaneous albinism type 2 (OCA2), and melanosomal pH. Pigment Cell Res (2001) 14(2):86–93. doi: 10.1034/j.1600-0749.2001.140203.x
31. Sitaram A, Piccirillo R, Palmisano I, Harper DC, Dell'Angelica EC, Schiaffino MV, et al. Localization to mature melanosomes by virtue of cytoplasmic dileucine motifs is required for human OCA2 function. Mol Biol Cell (2009) 20(5):1464–77. doi: 10.1091/mbc.e08-07-0710
32. Fernandez LP, Milne RL, Pita G, Floristan U, Sendagorta E, Feito M, et al. Pigmentation-related genes and their implication in malignant melanoma susceptibility. Exp Dermatol (2009) 18(7):634–42. doi: 10.1111/j.1600-0625.2009.00846.x
33. Duffy DL, Zhao ZZ, Sturm RA, Hayward NK, Martin NG, Montgomery GW. Multiple pigmentation gene polymorphisms account for a substantial proportion of risk of cutaneous malignant melanoma. J Invest Dermatol (2010) 130(2):520–8. doi: 10.1038/jid.2009.258
34. Azzato EM, Tyrer J, Fasching PA, Beckmann MW, Ekici AB, Schulz-Wendtland R, et al. Association between a germline OCA2 polymorphism at chromosome 15q13.1 and estrogen receptor-negative breast cancer survival. J Natl Cancer Inst (2010) 102(9):650–62. doi: 10.1093/jnci/djq057
35. Goc J, Germain C, Vo-Bourgais TK, Lupo A, Klein C, Knockaert S, et al. Dendritic cells in tumor-associated tertiary lymphoid structures signal a Th1 cytotoxic immune contexture and license the positive prognostic value of infiltrating CD8+ T cells. Cancer Res (2014) 74(3):705–15. doi: 10.1158/0008-5472.CAN-13-1342
36. Vinay DS, Ryan EP, Pawelec G, Talib WH, Stagg J, Elkord E, et al. Immune evasion in cancer: Mechanistic basis and therapeutic strategies. Semin Cancer Biol (2015) 35 Suppl:S185–s98. doi: 10.1016/j.semcancer.2015.03.004
37. Slack FJ, Chinnaiyan AM. The role of non-coding RNAs in oncology. Cell (2019) 179(5):1033–55. doi: 10.1016/j.cell.2019.10.017
38. Fu C, Jiang A. Dendritic cells and CD8 T cell immunity in tumor microenvironment. Front Immunol (2018) 9:3059. doi: 10.3389/fimmu.2018.03059
39. Jiang X, Cao G, Gao G, Wang W, Zhao J, Gao C. Triptolide decreases tumor-associated macrophages infiltration and M2 polarization to remodel colon cancer immune microenvironment via inhibiting tumor-derived CXCL12. J Cell Physiol (2021) 236(1):193–204. doi: 10.1002/jcp.29833
40. Zhou SL, Zhou ZJ, Hu ZQ, Huang XW, Wang Z, Chen EB, et al. Tumor-associated neutrophils recruit macrophages and T-regulatory cells to promote progression of hepatocellular carcinoma and resistance to sorafenib. Gastroenterology (2016) 150(7):1646–58.e17. doi: 10.1053/j.gastro.2016.02.040
41. Kulis M, Esteller M. DNA Methylation and cancer. Adv Genet (2010) 70:27–56. doi: 10.1016/B978-0-12-380866-0.60002-2
Keywords: RGS8, DGKI, OCA2, thyroid carcinoma, prognosis, immune infiltration, DNA methylation, transcriptome sequencing
Citation: Bai M, Ke S, Yu H, Xu Y, Yu Y, Lu S, Wang C, Huang J, Ma Y, Dai W and Wu Y (2022) Key molecules associated with thyroid carcinoma prognosis: A study based on transcriptome sequencing and GEO datasets. Front. Immunol. 13:964891. doi: 10.3389/fimmu.2022.964891
Received: 09 June 2022; Accepted: 01 August 2022;
Published: 17 August 2022.
Edited by:
Said Dermime, National Center for Cancer Care and Research, QatarReviewed by:
Alaaeldin Shablak, Hamad Medical Corporation, QatarAli Tiss, Dasman Diabetes Institute, Kuwait
Copyright © 2022 Bai, Ke, Yu, Xu, Yu, Lu, Wang, Huang, Ma, Dai and Wu. This is an open-access article distributed under the terms of the Creative Commons Attribution License (CC BY). The use, distribution or reproduction in other forums is permitted, provided the original author(s) and the copyright owner(s) are credited and that the original publication in this journal is cited, in accordance with accepted academic practice. No use, distribution or reproduction is permitted which does not comply with these terms.
*Correspondence: Yaohua Wu, wuyaohua@hrbmu.edu.cn; Wenjie Dai, davidhmu@163.com; Yong Ma, mayong@ems.hrbmu.edu.cn
†These authors have contributed equally to this work and share first authorship