 Patricia García-Fernández1*
 Klemens Höfflin1Antonia Rausch1Katharina Strommer2
 Astrid Neumann2Nadine Cebulla1
 Ann-Kristin Reinhold3
 Heike Rittner3
 Nurcan Üçeyler1
 Claudia Sommer1
- 1Department of Neurology, University Hospital of Würzburg, Würzburg, Germany
- 2Department of Bioanalytics, Bionorica research GmbH, Innsbruck, Austria
- 3Department of Anesthesiology, University Hospital of Würzburg, Würzburg, Germany
Introduction: In patients with peripheral neuropathies (PNP), neuropathic pain is present in 50% of the cases, independent of the etiology. The pathophysiology of pain is poorly understood, and inflammatory processes have been found to be involved in neuro-degeneration, -regeneration and pain. While previous studies have found a local upregulation of inflammatory mediators in patients with PNP, there is a high variability described in the cytokines present systemically in sera and cerebrospinal fluid (CSF). We hypothesized that the development of PNP and neuropathic pain is associated with enhanced systemic inflammation.
Methods: To test our hypothesis, we performed a comprehensive analysis of the protein, lipid and gene expression of different pro- and anti-inflammatory markers in blood and CSF from patients with PNP and controls.
Results: While we found differences between PNP and controls in specific cytokines or lipids, such as CCL2 or oleoylcarnitine, PNP patients and controls did not present major differences in systemic inflammatory markers in general. IL-10 and CCL2 levels were related to measures of axonal damage and neuropathic pain. Lastly, we describe a strong interaction between inflammation and neurodegeneration at the nerve roots in a specific subgroup of PNP patients with blood-CSF barrier dysfunction.
Conclusion: In patients with PNP systemic inflammatory, markers in blood or CSF do not differ from controls in general, but specific cytokines or lipids do. Our findings further highlight the importance of CSF analysis in patients with peripheral neuropathies.
Introduction
Polyneuropathy (PNP) is a term to describe a group of diseases with peripheral nerve dysfunction of various etiologies. Symptoms may affect the motor, sensory and/or autonomic system, and in 50% of the cases, patients experience neuropathic pain. Why some patients with PNP have pain and others not, is unknown, and even PNPs with the same etiology may be painful or painless (1). The available treatments have modest efficacy in reducing pain and present considerable side effects (2, 3). One approach toward better symptom control and potentially causative treatment might be to find common pathophysiologic pathways in PNP of different etiologies.
Although merely 14%-20% of PNP have a definite immune-related cause (4), inflammatory processes have been found to be involved in neuro-degeneration, -regeneration and pain in neuropathies of different origin (5–7). One of the main pro-inflammatory pathways that are activated upon damage is toll-like receptor (TLR) 4 mediated. Stimulation of TLR4 results in the activation of the nuclear factor k B (NFkB) pathway and the release of inflammatory cytokines, including tumor necrosis factor-alpha (TNF-α), interleukin (IL)-1β, IL-6, IL-8, IL-10, or chemokines such as the CC-chemokine ligand (CCL) 2 (8). This pathway can in turn be regulated by other mediators. For instance, the NAD-dependent deacetylase sirtuin 1 (SIRT1) has been suggested to be able to inhibit the pro-inflammatory cascade by deacetylating the p65 subunit of NFkB (9). Fractalkine (Cx3CL1) is an algesic chemokine which is cleaved from neurons and activates glial cells (10). Furthermore, small fragments of RNA, or microRNAs (miR), can regulate the expression of genes coding for pro- and anti-inflammatory proteins and have been found altered in different neuropathies of the central or peripheral nervous system, nociception and pain (11). While many miRs might be involved in the development of neuropathic pain, miR-146a-5p, miR-132-3p and miR-155-5p participate in the regulation of the NFkB pathway and have been described altered in patients with painful PNP (12–14). In addition, alterations in ion channels such as voltage gated sodium channels or those of the transient receptor potential cation channel subfamily like TRPV1 might lead to enhanced excitatory responses in nociceptors and promote axonal degeneration and the release of pro-inflammatory mediators, exacerbating the immune response (15). Furthermore, TRPV1 is expressed in blood mononuclear cells, and a direct role in cytokine production and immune responses has been proposed (16, 17).
Several lipid compounds, such as prostaglandins (PGs) or thromboxanes, are known to be involved in inflammation and pain, and can in turn be upregulated upon inflammation or tissue injury. Moreover, high levels of PGs have been described in serum from patients with peripheral neuropathies, as well as in the spinal cord of animal models with peripheral injury (18, 19). In fact, non-steroidal anti-inflammatory drugs (NSAIDs), a very common treatment against pain, have anti-inflammatory and analgesic properties mediated by blocking the synthesis of PGs and thromboxanes (18, 20, 21). Short-chain and long-chain acylcarnitines can be found upstream their synthesis pathway and have been reported upregulated in sera, nerve and spinal cord in animal models of neurodegeneration, in particular, palmitoylcarnitine (C16:0) and oleoylcarnitine (C18:1) (20, 22–24).
In PNP, signs and symptoms are typically length-dependent and thus more severe in the distal extremities of the body, such as feet and hands, than in the proximal regions or in the torso. Previous studies found a local upregulation of inflammatory mediators such as IL-2, IL-6, IL-8 or IL-10 in skin or nerve from patients with PNP (5, 25). The study of local inflammation, especially in the nerve, is difficult in humans, since it implies an invasive nerve biopsy, while systemic samples, such as blood and cerebrospinal fluid (CSF), are drawn and analyzed routinely. Since several inflammatory cytokines have been seen upregulated locally in patients with PNP, we studied whether some of these markers might be found systemically in sera or CSF. Different studies have shown a high variability in the cytokines present in serum from patients with PNP or nerve root compression, associated with the severity and symptoms of the neuropathy (26–31). Furthermore, extensive studies have shown that the CSF is directly altered by diseases of the central nervous system, while in diseases of the peripheral nervous system (PNS), differences in the levels of cytokines in CSF have yet to be explained. A factor that can influence these levels is the integrity of the barrier between blood and CSF, also called blood-CSF-barrier (B-CSF barrier) (32–34) or blood brain barrier (BBB) (35).
We hypothesized that PNP is associated with enhanced systemic inflammation that may correlate with the severity of the disease and the development of neuropathic pain. To test our hypothesis, we performed a comprehensive analysis of the protein, lipid, and gene expression of selected pro- and anti-inflammatory markers in blood and CSF from patients with PNP and controls. Furthermore, we measured the levels of neurofilament light-chain (NFL), as a cytoskeletal protein expressed by neurons and released upon cell damage, to assess the level of neurodegeneration present in patients with PNP (36), and to correlate NFL levels with the degree of inflammation. We also aimed to identify new systemic markers that might be important in the pursuit of a more accurate diagnosis and the prediction of neuropathic pain.
Materials and methods
Patient recruitment and diagnostic assessment
Between 2019 and 2021, 28 patients with PNP were prospectively recruited at the Department of Neurology, University of Würzburg, Germany, where they were seen for diagnostic work-up. In addition, 10 patients with acute headaches of unclear etiology were used as disease controls for the CSF analysis, and serum data from twelve healthy volunteers were included in the analysis to determine the inflammatory state of the headache group. Our study was approved by the Würzburg Medical Faculty Ethics Committee (# 15/19 and # 242/17) and all participants gave written informed consent prior to inclusion.
Diagnoses were based on history taking and neurological examination, laboratory studies, and nerve conduction examinations. All patients underwent laboratory tests including full blood count, electrolytes, kidney and liver function tests, C-reactive protein, thyroid stimulating hormone, vitamin B12, HbA1c, oral glucose tolerance test (OGTT), screening for autoimmune antibodies (i.e., ANA, ENA, ANCA, anti-ganglioside antibodies), and lumbar puncture. Electrophysiological assessment with nerve conduction studies of the affected nerves including tibial motor nerve and sural sensory nerve was performed in all PNP patients.
To rate the severity of the neuropathy, we used standardized scales, including the modified Toronto clinical neuropathy score (mTCNS), the overall disability sum score (ODSS) and the Medical Research Council-sumscore (MRC-sumscore). Depression was assessed with the “Allgemeine Depressionsskala” (ADS) (37). Pain was evaluated by a numerical rating scale (NRS) from 0 (no pain) to 10 (worst pain), the neuropathic pain symptom inventory (NPSI) and the graded chronic pain scale (GCPS). After the diagnostic work-up, the examining neurologists categorized the neuropathies into a mild (1), moderate (2) or severe (3) clinical phenotype.
Sample collection
From each patient, venous blood was drawn in the morning between 8 a.m. and 9 a.m. into S-Monovette® Serum-Gel Tubes (Sarstedt, Nümbrecht, Germany) and Tempus™ Blood RNA Tubes (Thermo Fisher Scientific, Waltham, MA, USA). For the collection of sera, whole blood was left to clot for 30 min at room temperature and later centrifuged for 10 min at 1200 g. Supernatant was aliquoted and stored at -20°C until further analysis. Tempus™ Blood RNA Tubes were immediately shaken for 30 s to lyse the cells and stabilize the RNA and stored at -80°C until extraction.
CSF samples were obtained after a lumbar puncture at the L4/5 level. The amount of CSF taken varied between 10-15 ml. Samples of 2 ml were aliquoted and subsequently stored at -20 °C.
Gene expression analysis
RNA was extracted from Tempus™ Blood RNA Tubes following the manufacturer’s protocol (38, 39) from the MagMAX™ for Stabilized Blood Tubes RNA Isolation Kit (Thermo Fisher Scientific, Waltham, MA, USA). RNA quality and quantity were assessed with a NanoDrop™ One (Thermo Fisher Scientific, Waltham, MA, USA), and RNA was stored at -80°C.
For cDNA synthesis from mRNA, TaqMan Reverse Transcription reagents (Thermo Fisher Scientific, Waltham, MA, USA) were used. 250 ng mRNA of each sample were pre-incubated with 5 µl random hexamer at 85°C for 3 min. Next, 10 μL 10× PCR buffer, 22 μL MgCl2, 20 μL deoxyribonucleoside triphosphate, 6.25 μL multiscribe reverse transcriptase and 2 μL RNase inhibitor were added per sample. Lastly, reaction was performed under these conditions: annealing (25°C, 10 min), reverse transcription (48°C, 60 min), and enzyme inactivation (95°C, 5 min).
For miRNA, reverse transcription was carried out with the miRCURY LNA RT Kit (Qiagen, Hilden, Germany). 10 ng of RNA were mixed with 2 μL of 5x reaction buffer, 5 μL of nuclease free water and 1 μL of enzyme mix, per sample. Reaction was performed using the following program: reverse transcription (42°C, 60 min) and enzyme deactivation (95°C, 5 min).
Reactions were carried out on a PRISM 7700 Cycler (Applied Biosystems, Waltham, MA, USA) and transcribed cDNA was stored at -20°C until further analysis.
Real time qPCR of mRNA and miRNA targets was performed to analyze gene expression using the StepOnePlus Real-Time PCR System (Thermo Fisher Scientific, Waltham, MA, USA). For mRNA, RT-qPCR was carried out with TaqMan qRT-PCR reagents (all Thermo Fisher Scientific, Waltham, MA, USA) and pre-designed assays. For target normalization, different endogenous controls were used: ribosomal protein L13a (RPL13A), actin beta (ACTb), Hydroxymethylbilane Synthase (HMBS) and TATA-Box binding protein (TBP) were tested. TBP was the most stable across groups, and thus selected as suitable endogenous control. For each reaction, 3.5 µl cDNA (8.75 ng cDNA) was mixed with 0.5 µl nuclease free water, 5 µl Fast Advanced Mastermix and 0.5 µl TBP primer and 0.5 µl target primer (see list of primers in Table 1).
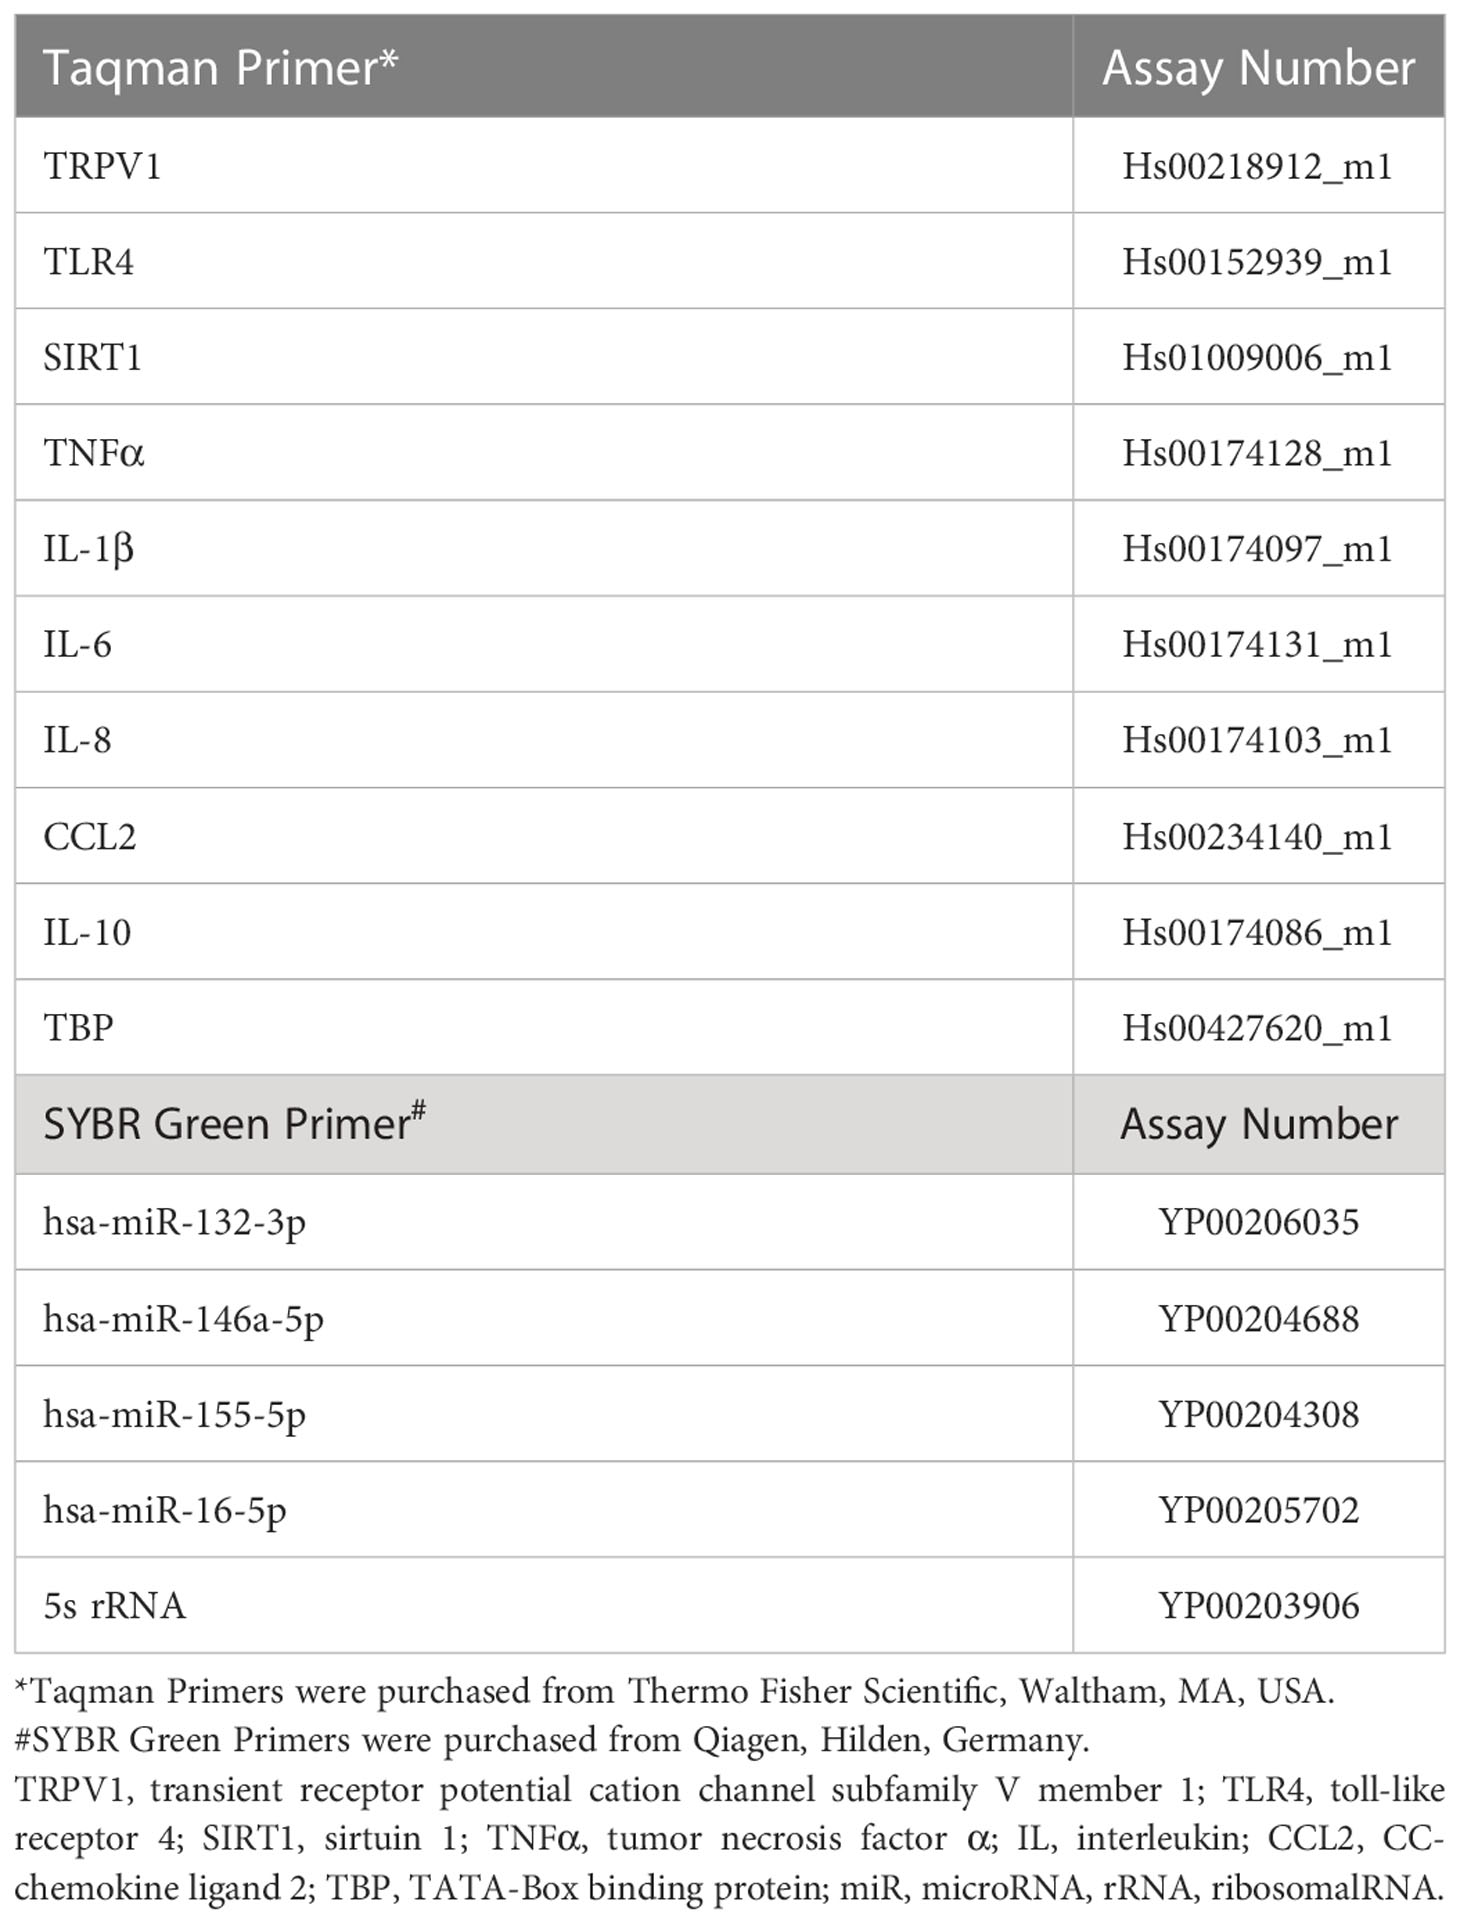
Table 1 List of primer assays.
For miRNA, the miRCURY LNA SYBR Green PCR Kit (Qiagen, Hilden, Germany) and pre-designed miRCURY LNA miR PCR assays (Qiagen, Hilden, Germany) were used. Based on previous experience from our group (12, 13) and on the recommendations by TaqMan Advanced miRNA Assays (https://assets.thermofisher.com/TFS-Assets/GSD/Reference-Materials/identifying-mirna-normalizers-white-paper.pdf), the ribosomal RNA 5s and hsa-miR-16 were tested as endogenous controls. Due to differences found in the expression of 5s between groups, hsa-miR-16 was selected as suitable endogenous control, based on its comparability and standard deviation across groups and samples. Each miRNA was run adding 5 µl 2× miRCURY SYBR Green Master Mix with 1 µl ROX per 50 µl and 1 µl primer (see list of primers in Table 1) to 4 µl of 1:80 diluted cDNA.
Each mRNA and miRNA was amplified in triplicates and relative quantitation (RQ) values were obtained by the StepOnePlus™ Software v2.3 (Thermo Fisher Scientific, Waltham, MA, USA) using interplate calibrators through the 2-ΔΔCt method.
Protein analysis
Cytokine levels were measured in serum and CSF using the Ella™ technology (ProteinSimple, San Jose, Cal, USA). Ella™ is a fully automated cartridge-based system that allows you to perform multiple sample, multi-analyte immunoassays with the specificity of a traditional single-plex ELISA (enzyme-linked immunosorbent assay). Samples were thawed on ice and more than two freeze-thaw cycles were avoided. Samples were diluted 1:1 in the appropriate sample diluent from each kit and 50 µl were added to each sample well of the Simple Plex™ cartridge, after 1 ml of washing buffer was added to their corresponding wells. Each sample was measured in triplicates, and the levels of each cytokine were displayed in pg/ml.
Lipid analysis
Serum and CSF samples were quantitatively analyzed for their levels of the endogenous metabolites carnitine (CAR), palmitoylcarnitine (PC) and oleoylcarnitine (OC) by LC-MS/MS (liquid chromatography coupled with tandem mass spectrometry).
All samples were thawed on ice for the first time for this analysis, in order to avoid freeze-thaw cycles, and processed within two years upon collection. Serum samples were analyzed at a neat dilution and after applying a 1:10 dilution step in 70% (v/v) ethanol. For sample preparation, 50 µl of serum or CSF samples were mixed with 150 µl internal standard solution (100 ng/ml acetylcarnitine-d3 in acetonitrile). Samples were centrifuged (13000 rpm, 1.5 min) and the supernatant was used for analysis.
Chromatographic separation was performed with a UHPLC System (1290 Infinity series, Agilent) using a Waters Acquity UHPL CSH™ Fluoro-Phenyl (75 × 2.1 mm, 1.7 µm) column. The injection volume was 2 µl and the flow rate was set to 0.3 mL/min. For the chromatographic separation a gradient was run using 0.1% formic acid in water (solvent A) and 0.1% formic acid in acetonitrile (solvent B). Detection was performed by means of a triple quadrupole mass spectrometer (API 4000®, Sciex) in multiple reaction monitoring (MRM) mode. Measurements were carried out in the positive electrospray ionization (ESI) mode. The LC-MS/MS system was operated with the Software Analyst®, Version 1.7.1 (Sciex).
Calibration samples were prepared in 30% acetonitrile and covered calibration ranges of 5 - 500 ng/ml for PC and OC and 5 - 1500 ng/ml for CAR. To verify method performance at medium analyte concentrations, QC samples with a concentration of 50.00 ng/ml CAR, OC and PC were prepared in 30% acetonitrile or in a surrogate matrix comparable to the analyzed biological samples (2% bovine serum albumin (BSA) or PBS buffer pH 7.4 diluted 1:10 in 30% acetonitrile were used to mimic serum or CSF, respectively).
Correlation coefficients of 0.9996 (CAR, OC) and 0.9992 (PC) were obtained. Accuracies of the calibration samples were found within +/-15% or within +/-20% for the lowest calibration level, respectively. Mean accuracies for all QC samples were found between 87.07% and 109.77% with CVs < 15%, indicating an acceptable method performance for all matrices investigated.
Further analytical information can be found in the Supplementary Material.
Statistical analysis and visualization
Statistical analysis was performed in SPSS 27 (IBM, Armonk, NY, USA), where the Shapiro-Wilk test was used to determine the normal distribution of the data. For parametric data, a T-test was used for comparison between two groups and a Pearson test was performed for correlations. In non-parametric data, the Mann–Whitney U Test was applied for comparison of two groups, and the Spearman test was used for correlations. Data results were plotted in GraphPad Prism 9 (GraphPad Software, Inc., La Jolla, CA, USA) for visualization. Graphical images were incorporated from Smart Servier Medical Art, https://smart.servier.com/, under the Creative common Attribution 3.0 Unported Licence.
Results
Clinical characteristics of patient cohort
Baseline characteristics of the study group and the diagnostic subgroups are summarized in Table 2. Patients were included if they presented for diagnostic work-up for their PNP, including lumbar puncture. To be included, they further needed to have either no pain (NRS = 0) or pain ≥ 4 at the time of admission. Patients with an NRS between one and three were excluded from the cohort. After applying the exclusion criteria, twenty-eight patients with PNP of different etiologies were included [median body max index (BMI) 28.3, range 19.2-35.1; median age 54.5 years, range 20–80]. The median disease duration was 2.5 years (range 0.02–29 years). Nine patients were diagnosed with an inflammatory neuropathy including non-systemic vasculitis (six patients), chronic inflammatory demyelinating polyneuropathy (CIDP) (two patients) and multifocal motor neuropathy (MMN) (one patient). Nineteen patients were classified as non-inflammatory, including idiopathic neuropathy (nine patients), hereditary neuropathy (five patients), a neuropathy caused by vitamin B deficiency (three patients) or diabetic neuropathy (two patients).
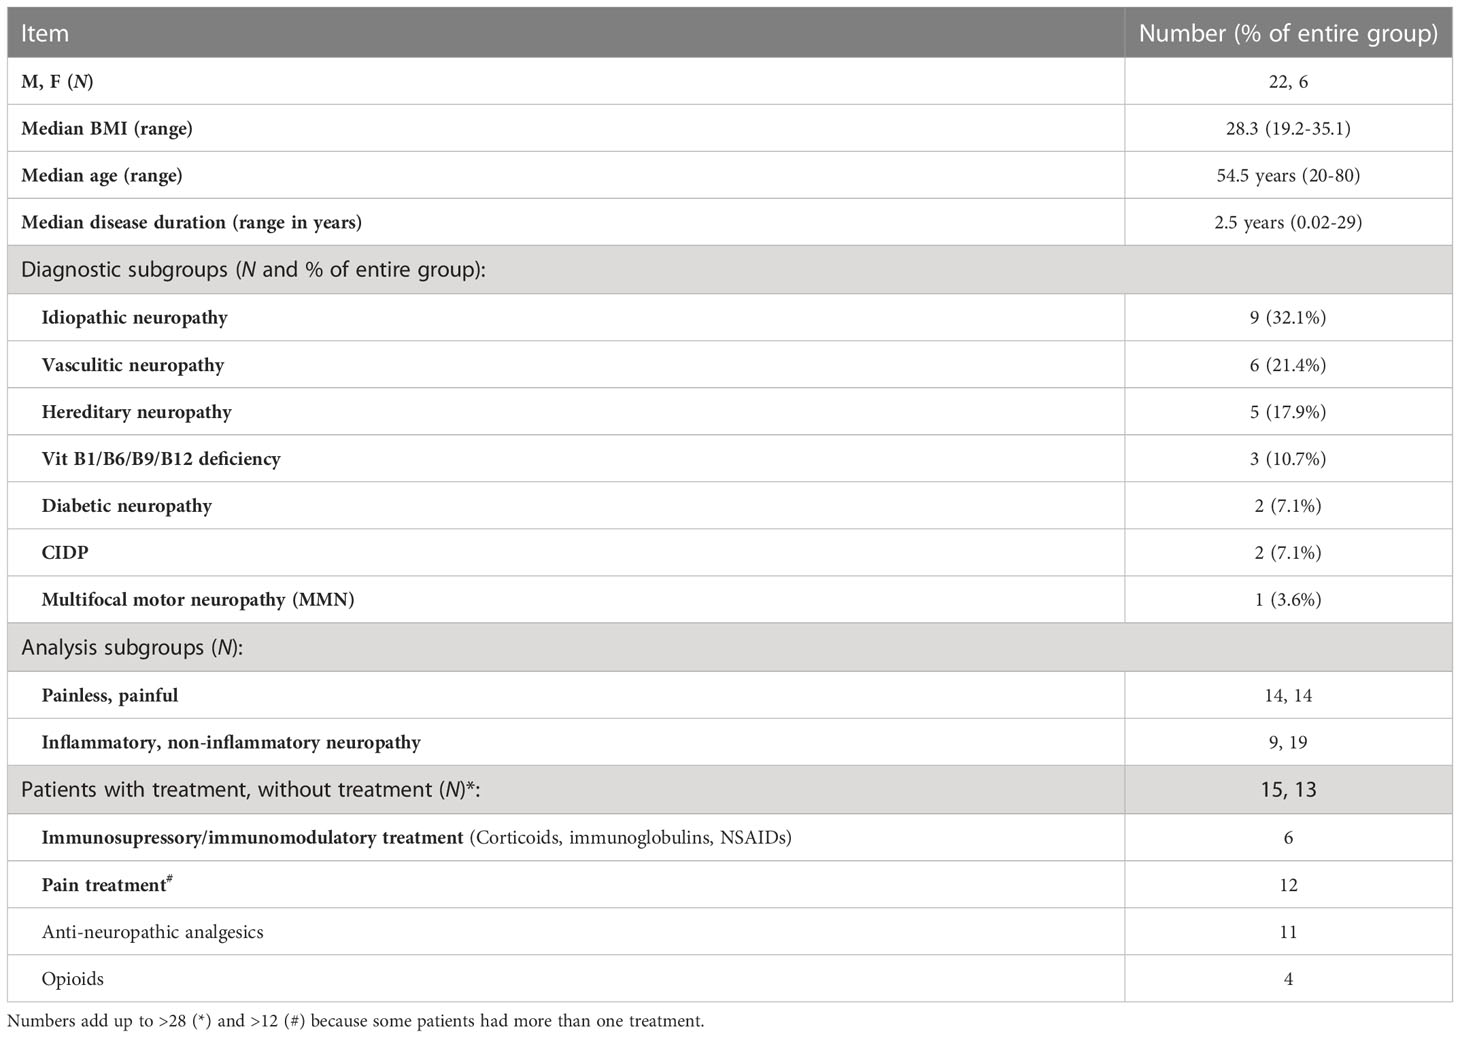
Table 2 Description and diagnostic subgroups of patient cohort.
Patients were classified as painless when they presented an NRS = 0 (fourteen patients; 50%), and as painful with an NRS ≥ 4 (fourteen patients; 50%). From the full cohort of PNP patients, at the time of inclusion fifteen patients had been treated for their neuropathy with either an immunosuppressive/immunomodulatory drug (six patients) and/or pain treatment (twelve patients), while thirteen received no treatment.
Further laboratory and electrophysiological data are given in Table 3. The median CRP value in serum was 0.24 mg/dl (range 0-2.37 mg/dl). In CSF, patients presented a median of 2 leukocytes/µl (range 0-6 cells/µl) and a median total protein of 46.3 mg/dl (range 19.3-194.6 mg/dl). Nerve conduction studies showed a median sural nerve sensory nerve action potential (SNAP) of 4.9 µV (range 2.5-12.6 µV) with a median nerve conduction velocity (NCV) of 45.9 m/s (range 32.4-57.3 m/s), and in the tibial nerve a median compound motor action potential (CMAP) upon stimulation at the ankle of 5.4 mV (range 0.1-23.4 mV) and a median nerve conduction velocity (NCV) of 38.3 m/s (range 26.8-52.2 m/s).
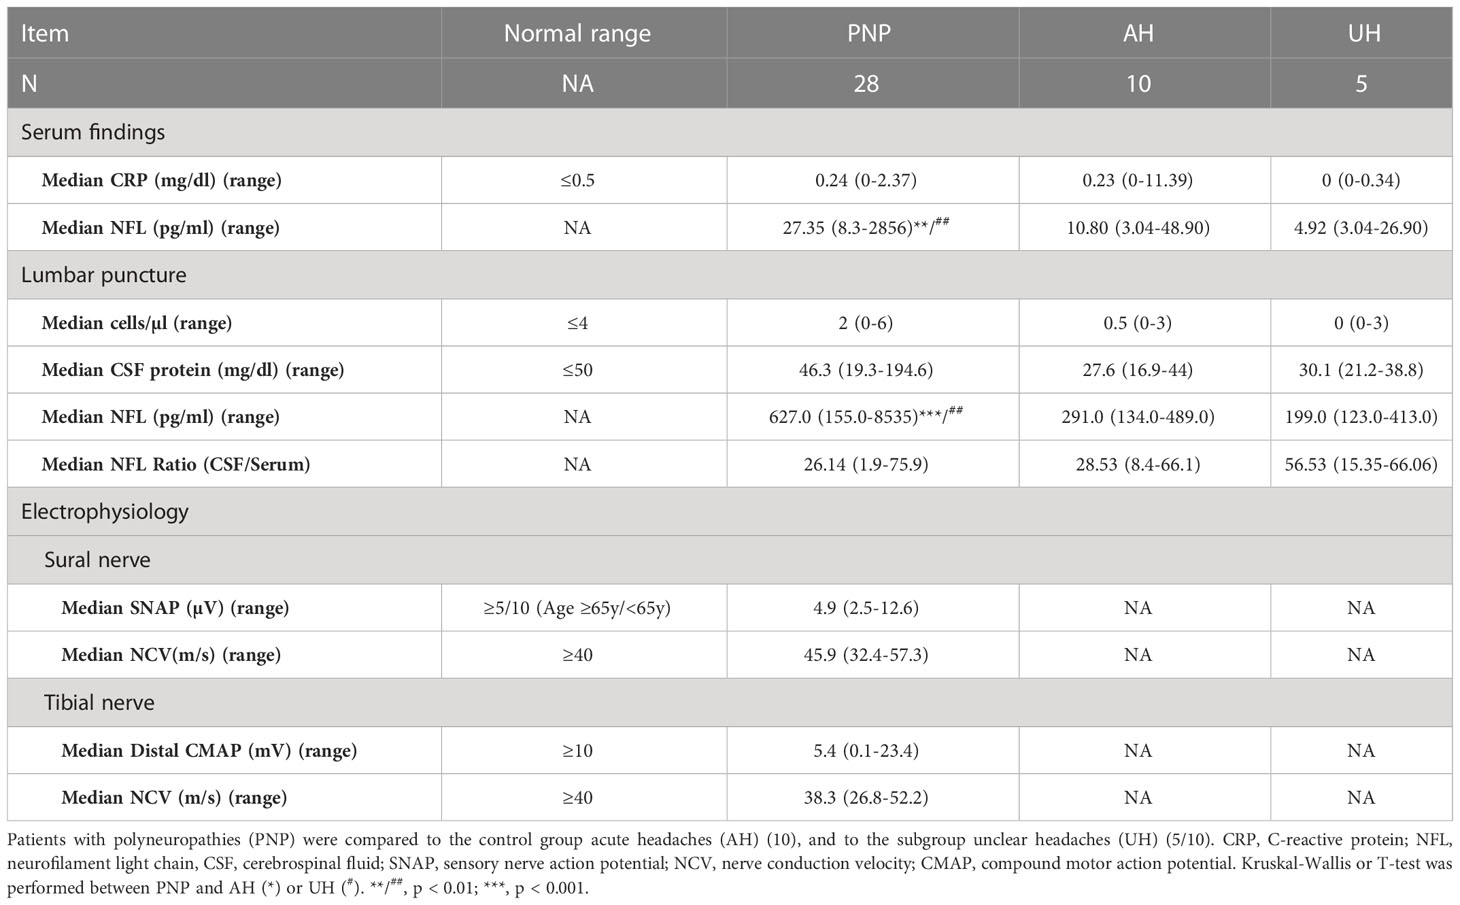
Table 3 Clinical findings in PNP patients versus controls.
Control group
Patients that presented with acute headaches of unclear etiology (AH) and had a lumbar puncture to exclude meningitis or a subarachnoid bleed were used as controls for the CSF data. Only patients that had less than four leukocytes/µl in their CSF and normal protein values were included. After full clinical work-up, five of these patients had some signs of inflammation (elevated CRP, n = 3; sinusitis, n = 1; or elevated ANA and ANCA titers, n = 1). Thus, the AH group was divided into two groups (unclear headache, UH, and inflammatory headache, IH), and only patients with UH were further used as controls for inflammatory markers (Table 4, Figure 1A). Twelve healthy volunteers (HC) were included as controls for NFL and inflammatory markers in serum. HC and AH did not differ in age or NFL levels in pg/ml in serum (Figures 1B, C), and in both groups a positive correlation between age and NFL was present (HC, p < 0.05; AH, p < 0.01) (Figure 1D). When separating AH into UH and IH, NFL levels did not differ between groups, but IL-6 was higher in IH in comparison to HC (p < 0.001) (Figure 1E). These results supported our decision to continue the study on inflammatory markers with the UH exclusively, while the whole cohort (AH) was used for the NFL analysis.
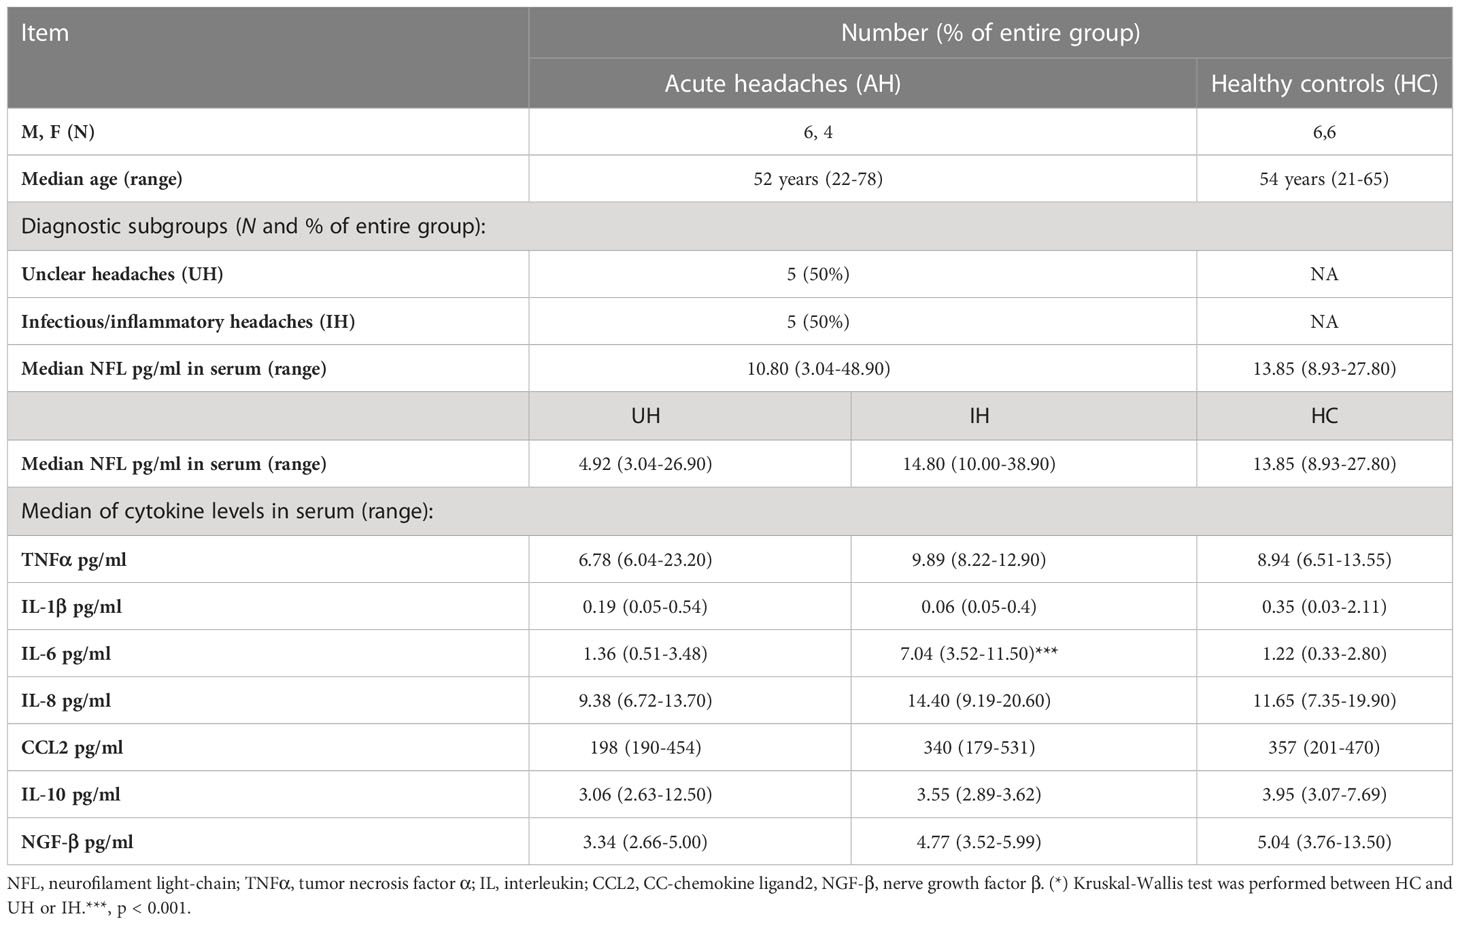
Table 4 Description of the control groups.
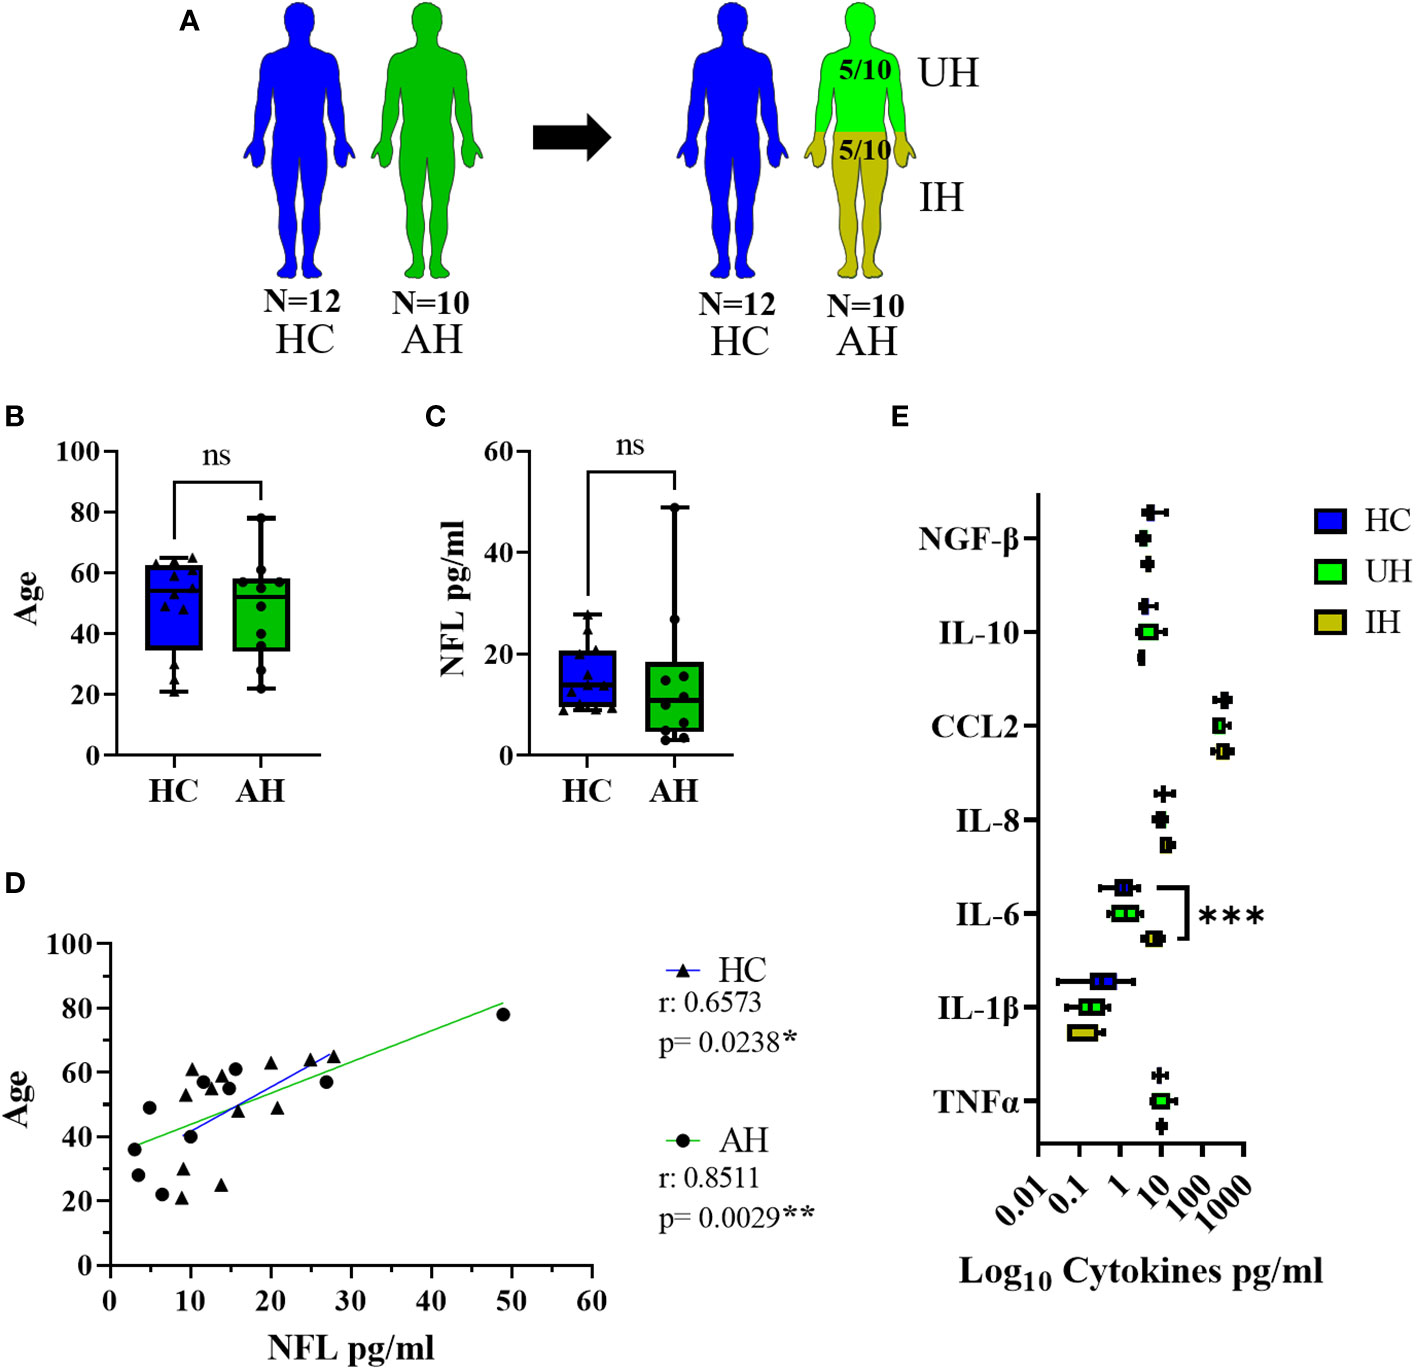
Figure 1 Description of the control groups. (A) Visual representation of the healthy controls (HC) (blue) and acute headaches group (AH) (green), further divided into unclear headaches (UH, light green) and inflammatory headaches (IH, olive green). (B) Age values in HC and AH. (C) NFL levels in serum in pg/ml between HC and AH. (D) Correlation between age and NFL levels in serum in pg/ml in HC and AH. (E) Log10 representation of cytokine values in serum from HC, UH and IH. ns, not significant; *, p < 0.05; **, p < 0.01; ***, p < 0.001. All graphical images were incorporated from Smart Servier Medical Art, https://smart.servier.com/, under the Creative common Attribution 3.0 Unported Licence.
NFL levels in serum and CSF from PNP patients
NFL was measured in serum and CSF in twenty-eight patients with PNP in comparison to ten age-matched AH (Figures 2A, B). PNP patients had higher serum levels of NFL than AH (p < 0.01) (Figure 2C). There was a positive correlation between age and NFL levels in AH (p < 0.01) but not in PNP patients (Figure 2D). NFL levels correlated negatively to sural nerve SNAP in PNP patients (Figure 2E), which translated into higher levels of NFL in patients with abnormal SNAP values (< 5 µV) in comparison to those with normal SNAP (≥ 5 µV) (p < 0.01) (Figure 2F).
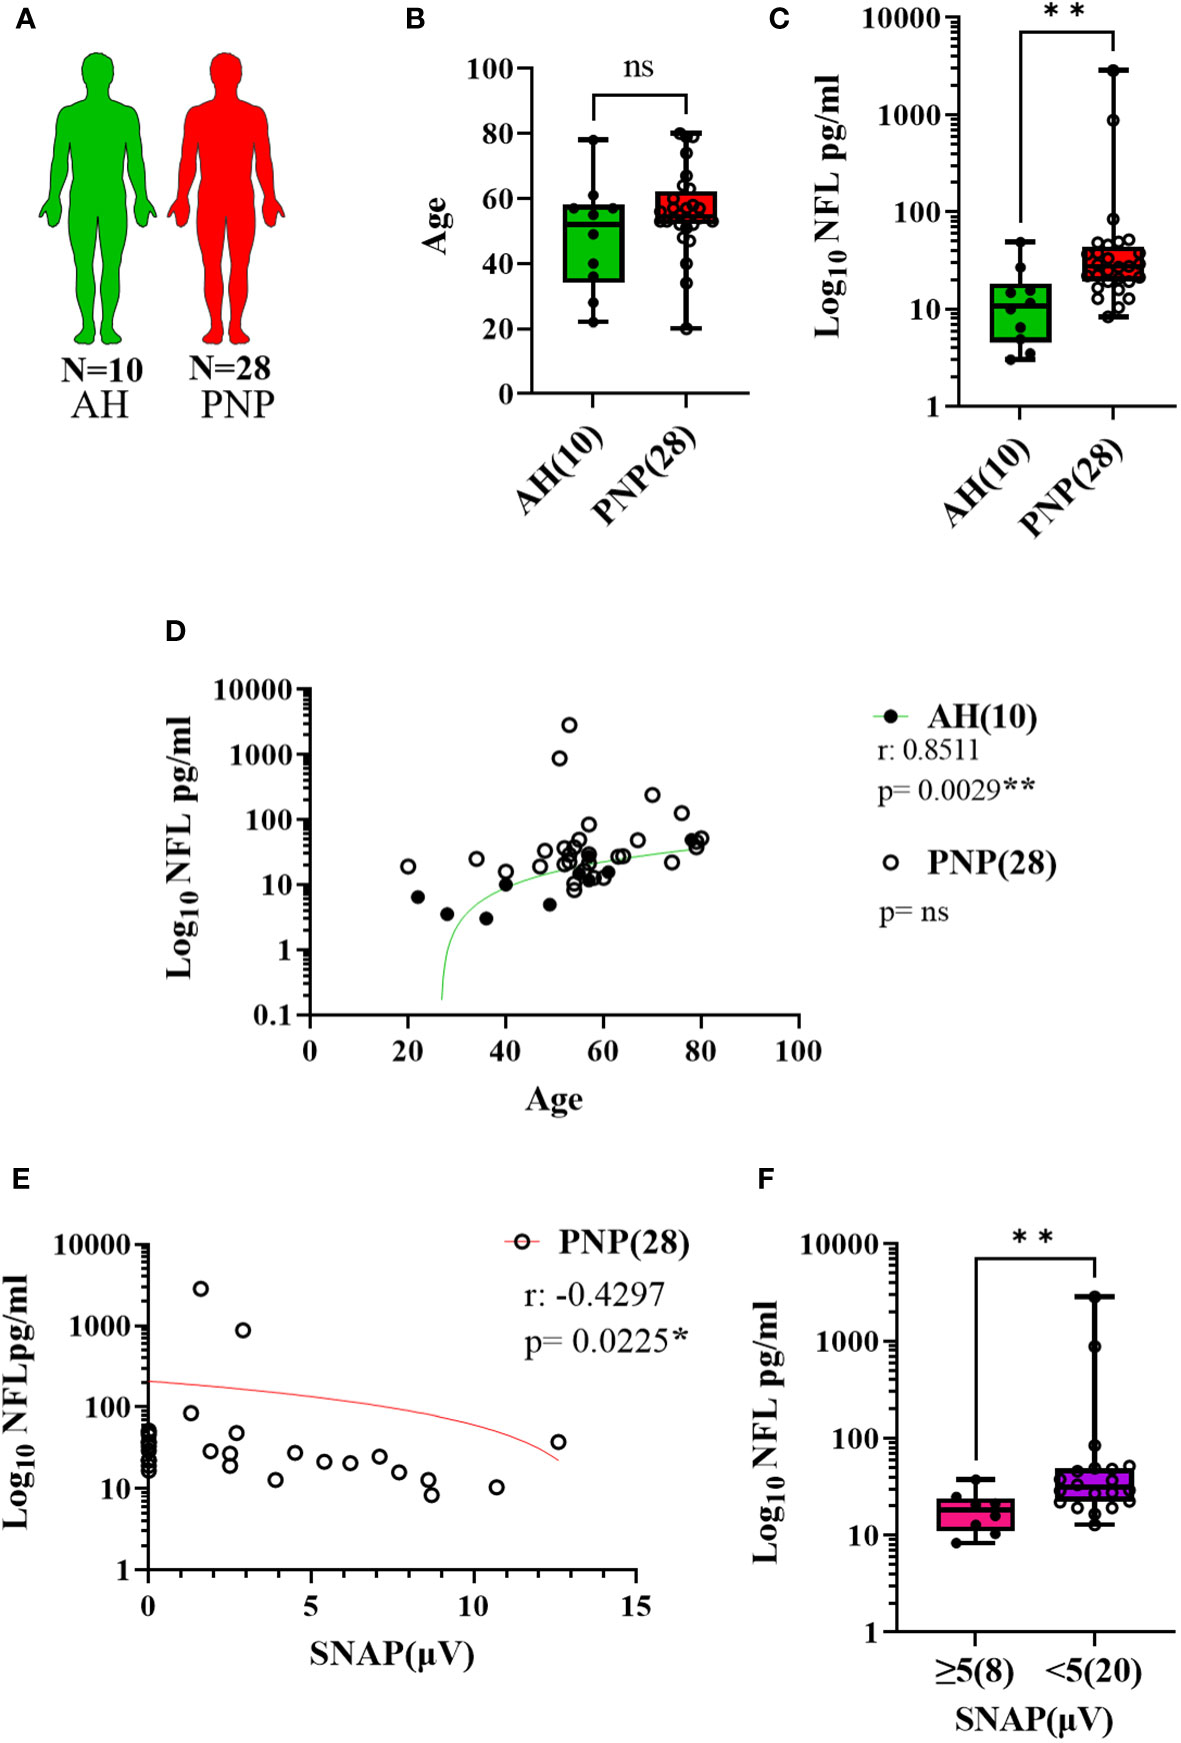
Figure 2 NFL levels in serum from patients with PNP. (A) Visual representation of the analyzed 10 AH (green) and 28 PNP patients (red). (B) Age values in AH and PNP. (C) Log 10 of NFL levels in pg/ml between AH and PNP. (D) Correlation between age and log 10 of NFL levels in pg/ml in AH and PNP. (E) Correlation between log10 of NFL levels in pg/ml and SNAP. (F) Log10 of NFL levels in pg/ml between PNP patients with normal (≥ 5µV) (pink) and abnormal (< 5µV) (purple) sural nerve SNAP. ns, not significant; *, p < 0.05; **, p < 0.01. All graphical images were incorporated from Smart Servier Medical Art, https://smart.servier.com/, under the Creative common Attribution 3.0 Unported Licence.
The same analysis was performed with CSF samples (Figure 3A) and we observed higher levels of NFL in PNP patients in comparison to AH (p < 0.001) (Figure 3B). Again, a correlation between age and NFL was present in AH (p < 0.001) but not in PNP patients (Figure 3C). Furthermore, our results showed a negative correlation between the levels of NFL in CSF and the MRC sumscore (Figure 3D), therefore suggesting an involvement of NFL release in the severity of the neuropathy.
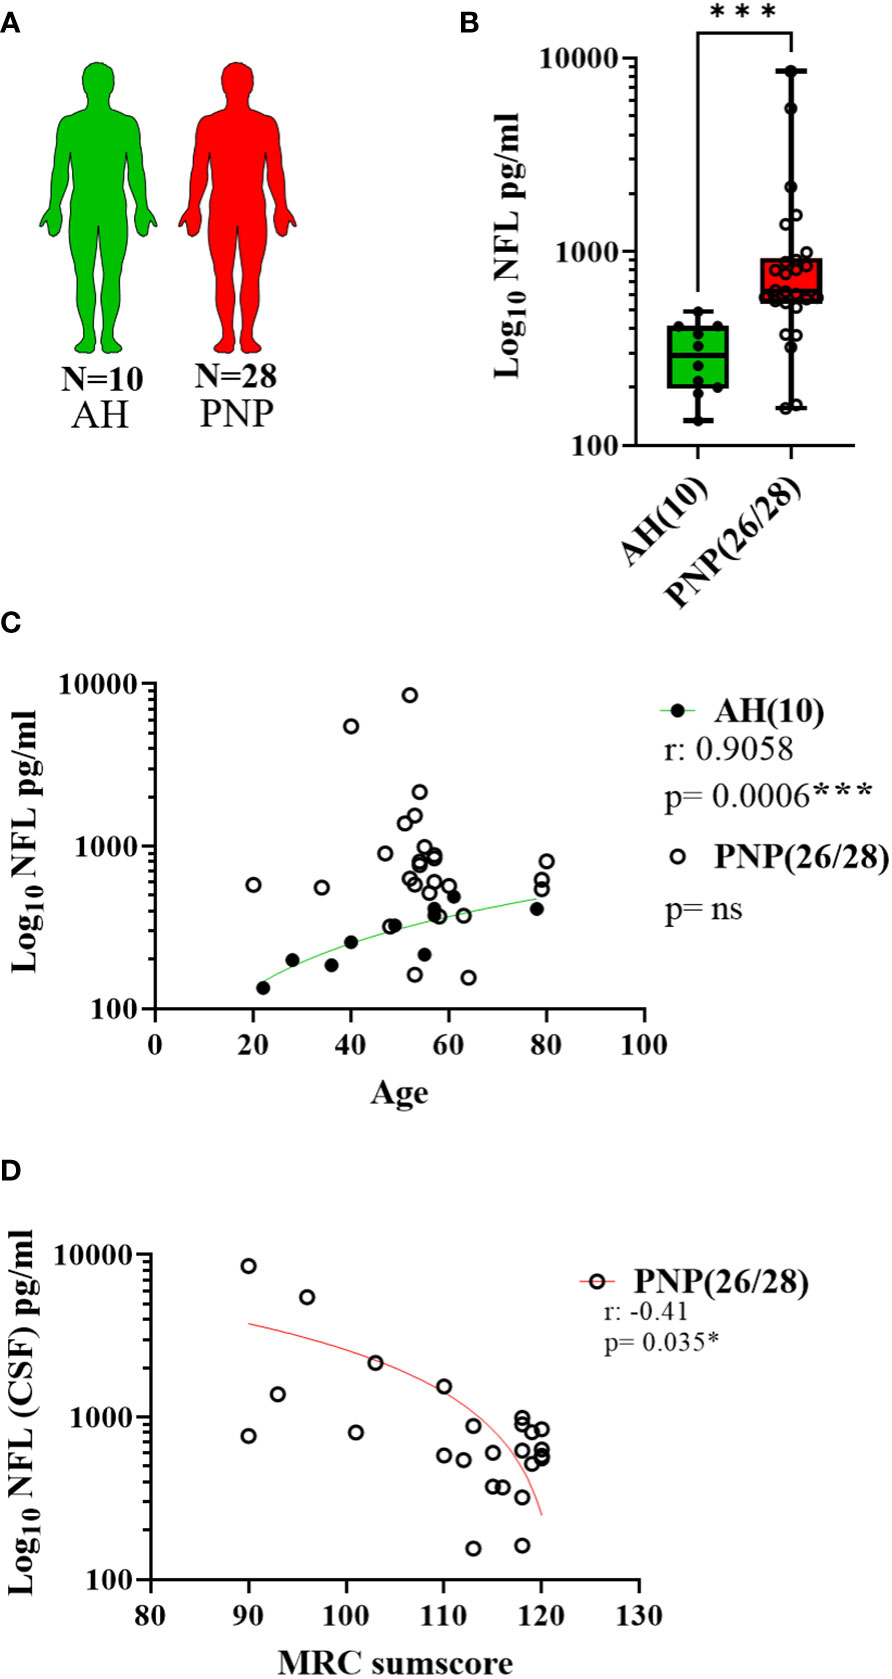
Figure 3 NFL levels in CSF from patients with PNP. (A) Visual representation of the analyzed 10 AH (green) and 28 PNP patients (red). (B) Log 10 of NFL levels in pg/ml between AH and PNP. (C) Correlation between age and log 10 of NFL levels in pg/ml in AH and PNP. (D) Correlation between the levels of NFL levels in pg/ml (Log10) and the MRC sumscore in PNP patients. ns, not significant; *, p < 0.05; ***, p < 0.001. All graphical images were incorporated from Smart Servier Medical Art, https://smart.servier.com/, under the Creative common Attribution 3.0 Unported Licence.
Gene expression of pro- and anti-inflammatory markers in whole blood
In twenty-seven out of twenty-eight PNP patients and five UH, we analyzed the gene expression of the receptors TRPV1 and TLR4; the deacetylase SIRT1; the pro-inflammatory cytokines TNFα, IL-1β, IL-6 and IL-8, and chemokine CCL2; the anti-inflammatory cytokine IL-10; and the microRNAs miR-146a-5p, miR-132-3p and miR-155-5p in whole blood (Figure 4A). The expression results of PNP patients, with painful and painless PNP, and inflammatory and non-inflammatory PNP are displayed as fold change in comparison to UH in Table 5. Comparisons between PNP patients and controls, as well as between painful and painless PNP subgroups, and inflammatory and non-inflammatory did not show any differences in the expression of these components.
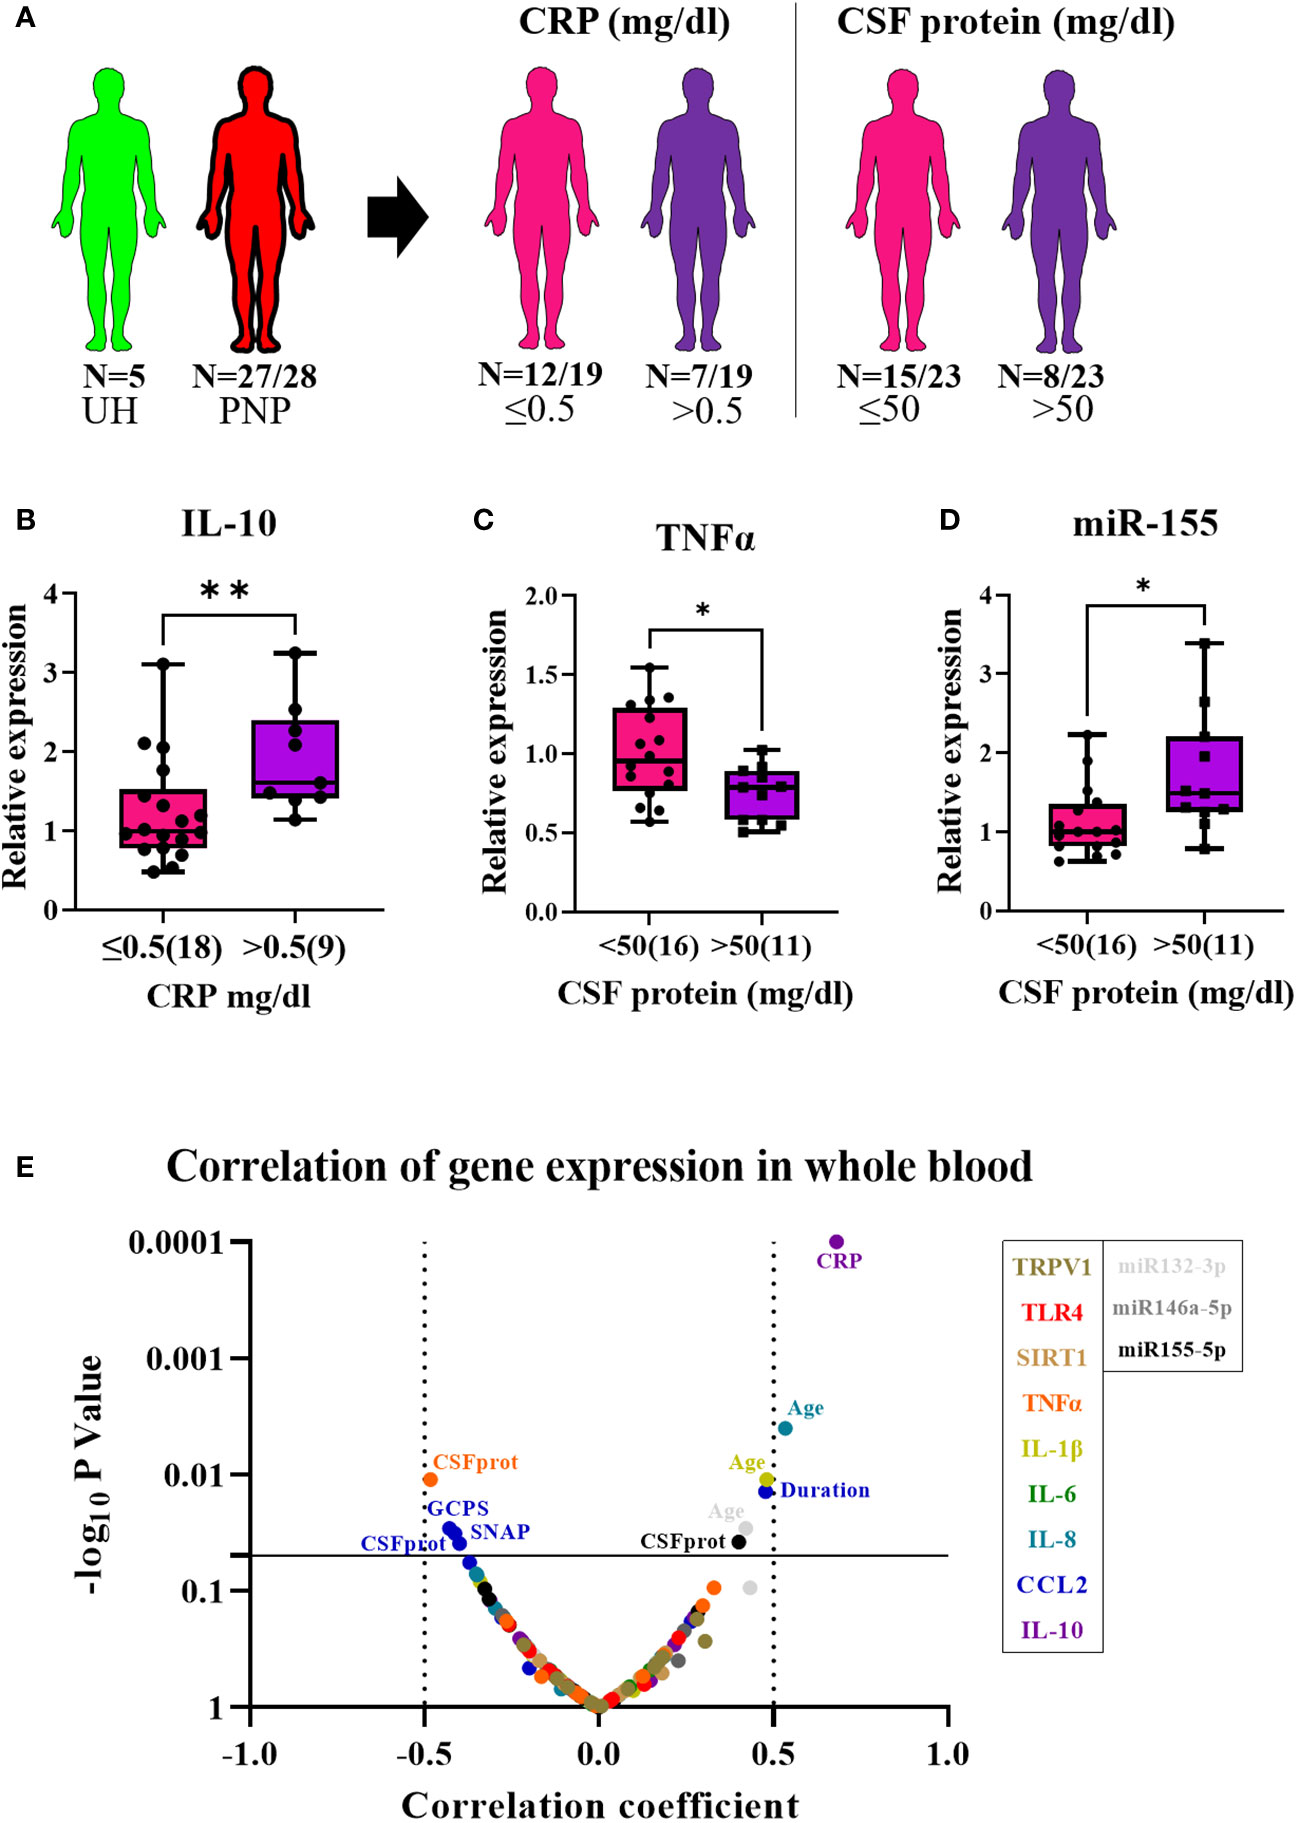
Figure 4 Relative gene expression of pro- and anti-inflammatory markers in whole blood from patients with PNP. (A) Visual representation of the analyzed 5 UH (light green) and 27 out of 28 PNP patients (red), further divided into 18 PNP patients with normal (≤0.5mg/dl, pink) and seven with increased (> 0.5 mg/dl, purple) CRP levels in serum, and into 16 PNP patients with normal (≤ 50 mg/dl, pink) and seven with abnormal (> 50 mg/dl, purple) protein levels in CSF. (B) Relative expression of IL-10 in PNP patients with increased CRP in comparison to those with normal values. Relative expression of TNFα (C) and miR-155 (D) in PNP patients with normal and abnormal protein levels in CSF. (E) Volcano plot of the Spearman multivariate correlations between each studied target and the neuropathy scores. *, p < 0.05; **, p < 0.01. All graphical images were incorporated from Smart Servier Medical Art, https://smart.servier.com/, under the Creative common Attribution 3.0 Unported Licence.
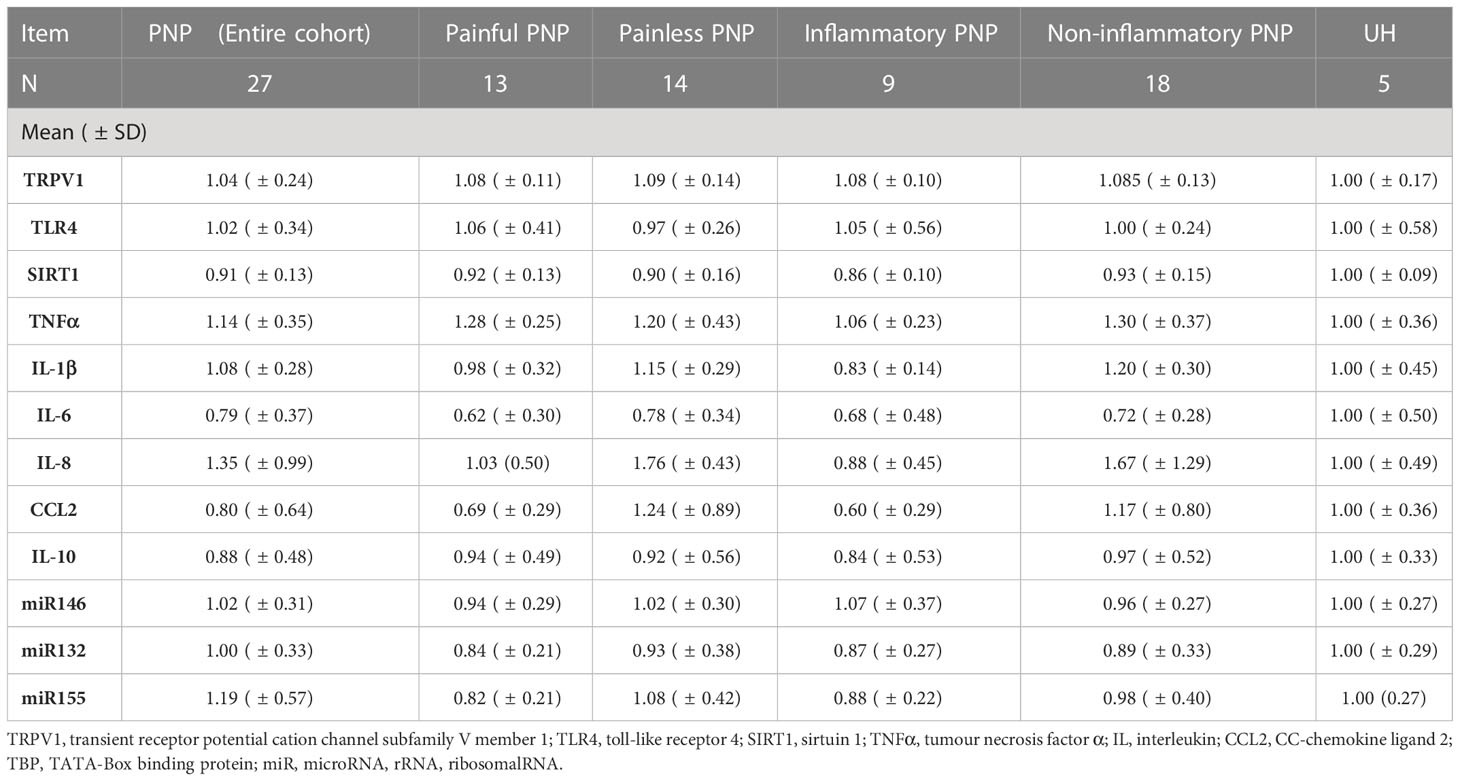
Table 5 Fold change of the gene expression of pro- and anti-inflammatory markers in whole blood from patients with PNP, in comparison to UH.
Interestingly, PNP patients were next grouped into patients with and without systemic inflammation based on increased CRP levels in the serum (cut-off 0.5 mg/dl). Patients with systemic inflammation had a higher expression of IL-10 in comparison to those with normal CRP levels (≤0.5 mg/dl) (p < 0.001) (Figure 4B) and a positive correlation was found between CRP levels and IL-10 expression (p < 0.01) (Figure 4E). Furthermore, PNP patients with high CSF total protein (> 50 mg/dl) also presented lower expression of TNFα (Figure 4C) and higher expression of miR-155 (Figure 4D) than those with normal levels (≤ 50 mg/dl). Moreover, a multivariate correlation analysis (Figure 4E) showed that CCL2 correlated positively with the duration of the disease (p < 0.001) while negatively with several neuropathy scores such as sural nerve SNAP amplitudes (p < 0.01) or GCPS, indicating a relation between inflammation and axonal degeneration.
Cytokine protein levels in sera
As indicators of systemic inflammation, we analyzed the levels of the pro-inflammatory cytokines TNFα, IL-1β, IL-6 and IL-8, the chemokine CCL2, and the anti-inflammatory cytokine IL-10 in sera from twenty-eight patients with PNP and five UH (Figure 5A). Furthermore, we measured the levels of nerve growth factor beta (NGF-β) in sera, since it is involved in nociceptive processing and a target of novel analgesics (40). The CSF from the same cohort was available and we measured the levels of the pro-inflammatory cytokines IL-6 and IL-8, and the chemokines CCL2 and fractalkine (Cx3CL1). TNFα, IL-1β and IL-10 were not detected in these samples (data not shown). All results are detailed in Table 6.
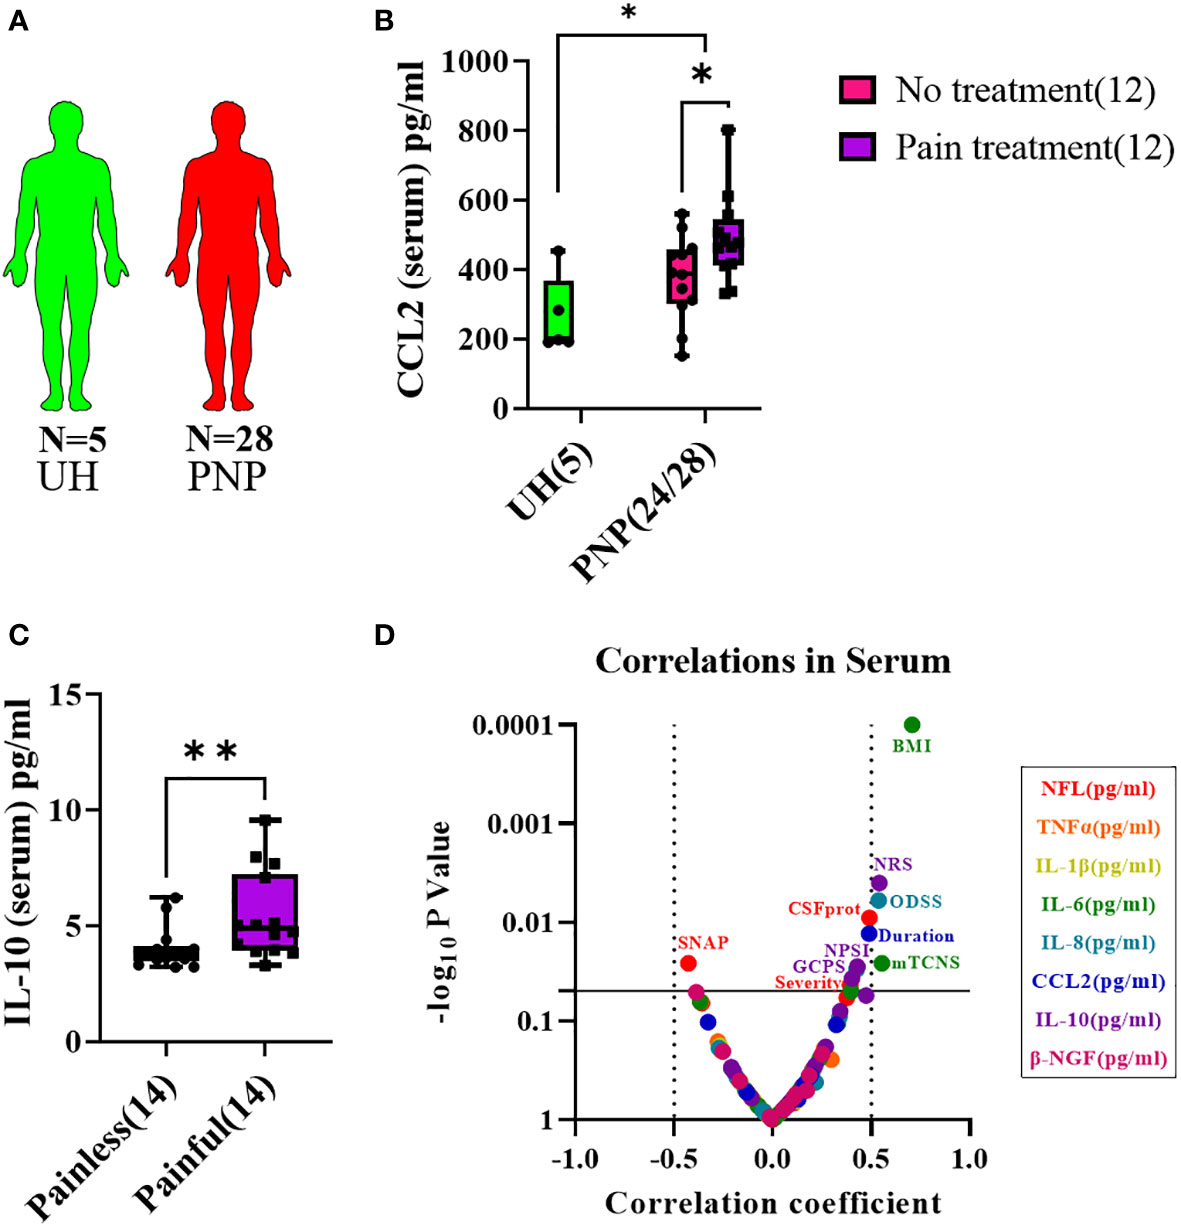
Figure 5 Cytokine levels in serum from patients with PNP. (A) Visual representation of the analyzed 5 UH (light green) and 28 PNP patients (red). (B) CCL2 levels in pg/ml in serum from UH and PNP patients, further divided between those without (pink) and with pain treatment (purple). (C) IL-10 levels in pg/ml in serum from PNP patients with painless (pink) and painful (purple) neuropathies. (D) Volcano plot of the Spearman multivariate correlations between each studied target and the neuropathy scores. *, p < 0.05; **, p < 0.01. All graphical images were incorporated from Smart Servier Medical Art, https://smart.servier.com/, under the Creative common Attribution 3.0 Unported Licence.
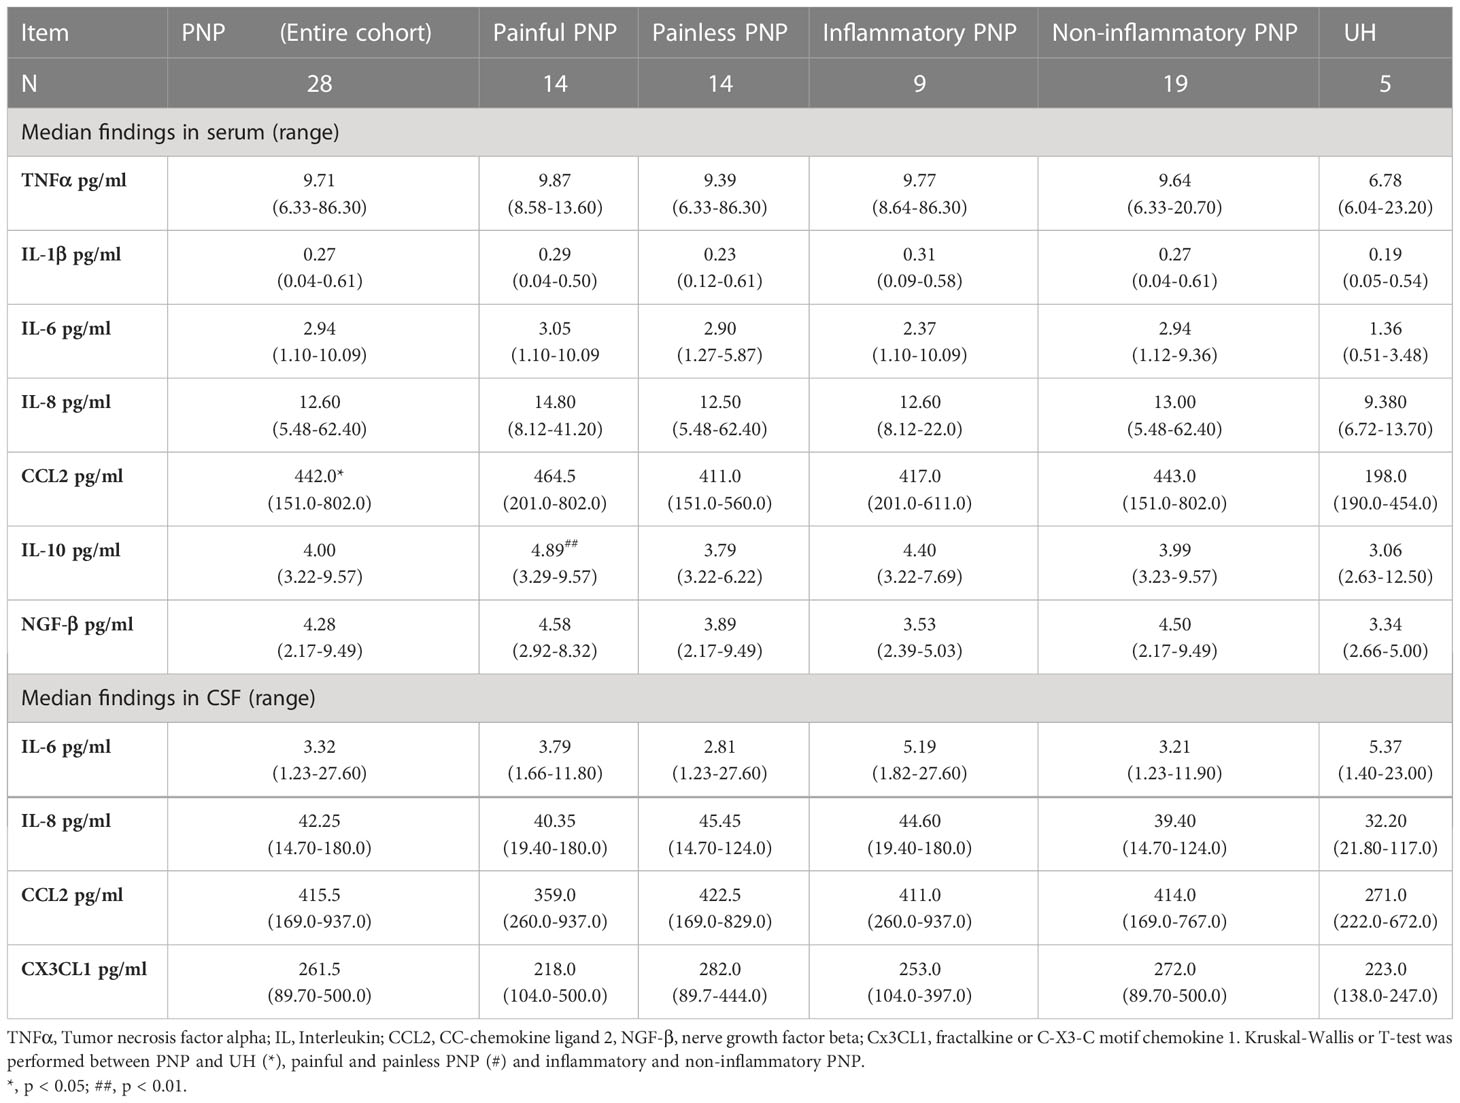
Table 6 Cytokine levels in serum and CSF from patients with PNP and UH.
CCL2 was present in higher levels in serum in PNP in comparison to UH, while no differences were discovered for the other analyzed markers. CCL2 was specifically upregulated in PNP patients under analgesic treatment (p < 0.05, Figure 5B). No differences were discovered between the PNP subgroups inflammatory and non-inflammatory. On the other hand, patients with a painful PNP had higher levels of IL-10 in sera than those with no pain (p < 0.01, Figure 5C). A multivariate analysis showed that the levels of IL-10 positively correlated with the pain scores in NRS (p < 0.01), NPSI (p < 0.05) and GCPS (p < 0.05) (Figure 5D).
Analysis of the relation of proteins between sera and CSF in PNP patients
The proteins present in CSF, such as NFL or inflammatory components, may be intrathecally produced or have infiltrated from the blood vessels due to a permeabilization of the B-CSF barrier. In order to study the origin of NFL and cytokines in CSF, we compared the levels of albumin between CSF and serum (albumin ratio in CSF/in serum: QAlb) and divided the patients in subgroups according to the B-CSF barrier integrity: Normal B-CSF barrier integrity (QAlb < 0.007) and mild (0.007 < QAlb < 0.01), moderate (0.01 < QAlb < 0.02) and severe (QAlb > 0.02) B-CSF barrier dysfunction (Figure S1A) (41). Due to a low number of patients with severe B-CSF barrier dysfunction (2), moderate and severe groups were analyzed together. A moderate/severe B-CSF barrier dysfunction was present more often in inflammatory neuropathies than normal or mild dysfunction (Figure S1B). Furthermore, the albumin ratio (QAlb) correlated with the severity of the clinical phenotype (Figure S1C). As expected, the levels of total protein in CSF increased as the B-CSF barrier dysfunction became more severe (Figure S1D), thus indicating a higher permeabilization or a relation between an intrathecal production and a B-CSF barrier dysfunction.
NFL measurements in serum and CSF in the different subgroups of twenty-eight PNP patients and ten AH (Figure 6A) showed higher levels in those patients with moderate/severe B-CSF barrier dysfunction in comparison to those with a normal B-CSF barrier integrity and to AH (Figures 6B, C). This resulted in a constant QNFL (NFL ratio in CSF/serum) among subgroups and between PNP and AH (Figure 6D). Furthermore, NFL in serum and CSF correlated positively with the severity of the clinical phenotype (Figure 6E), suggesting that the release of NFL might be a consequence of the severe neurodegeneration.
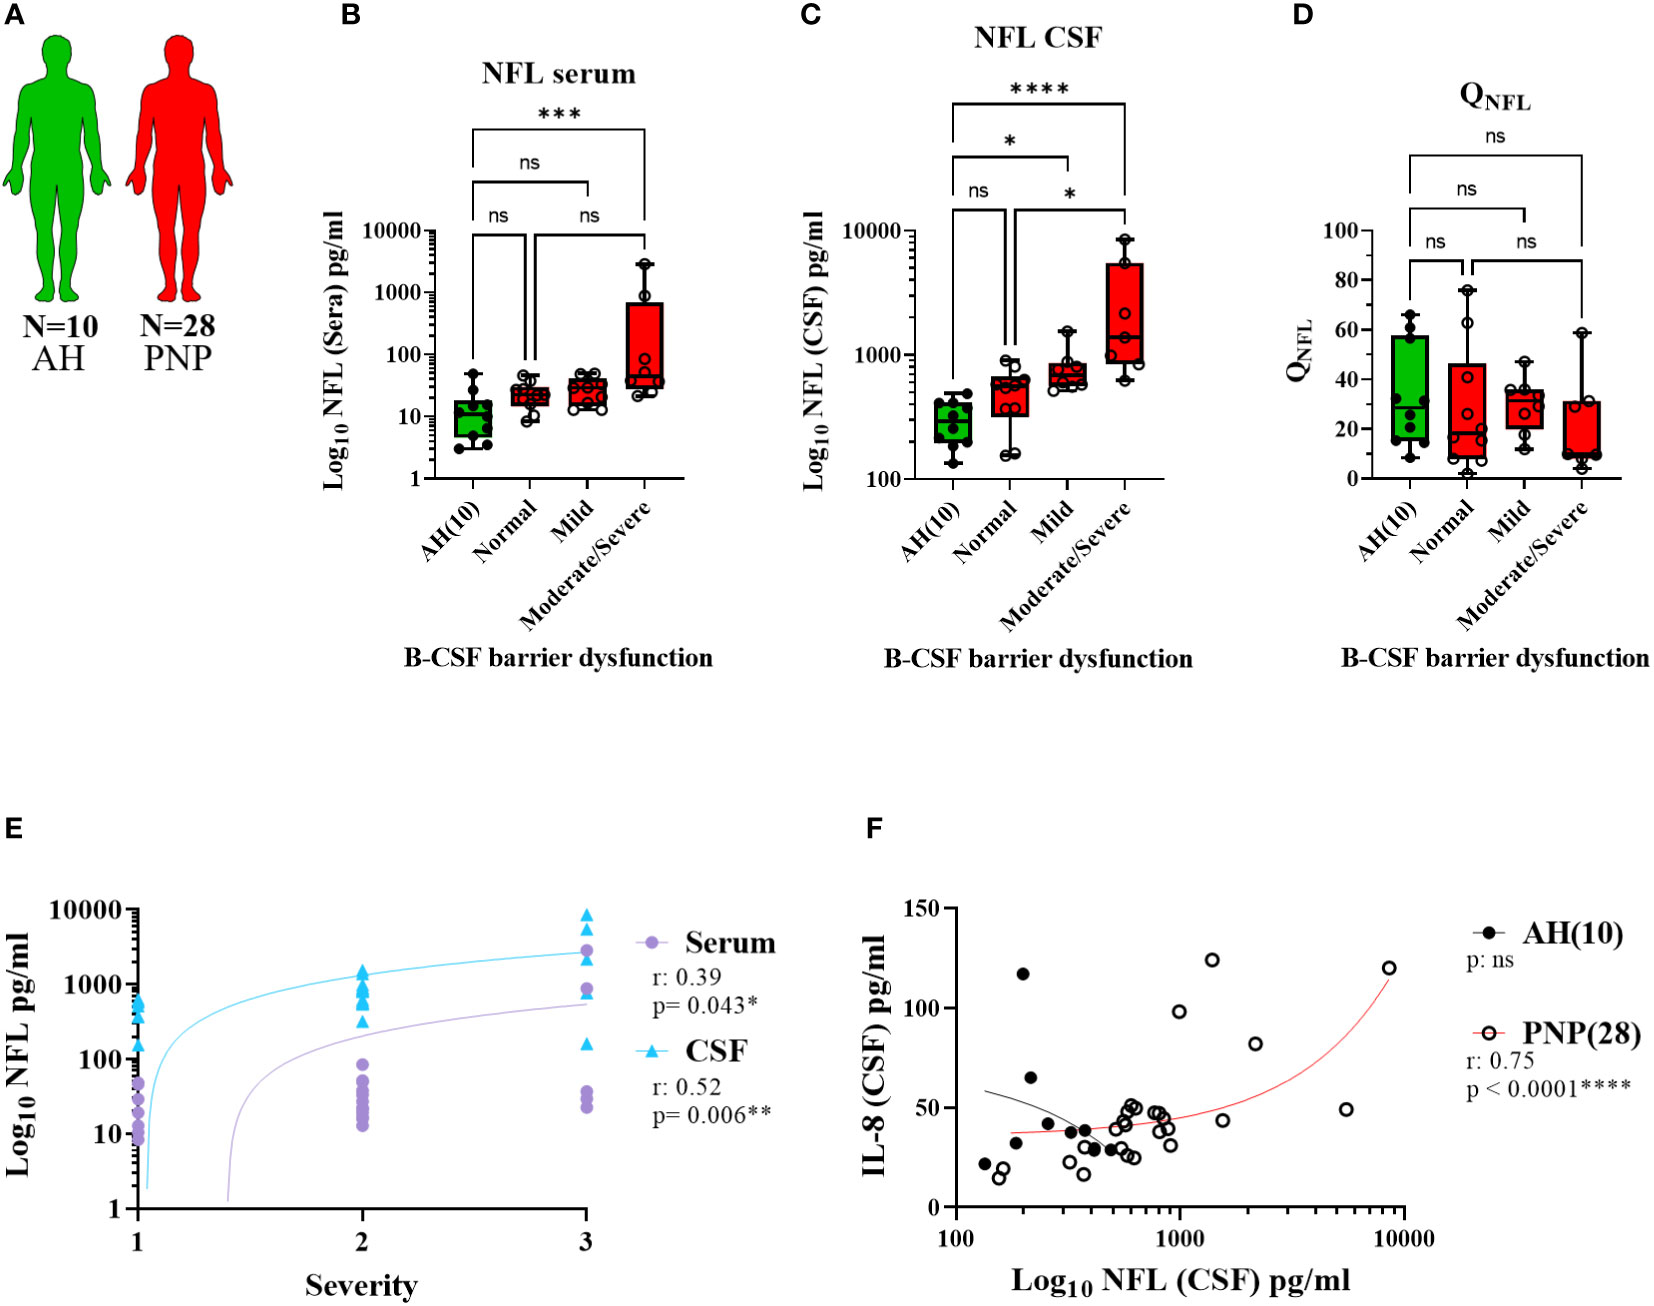
Figure 6 Levels of NFL between CSF and serum from patients with PNP. (A) Visual representation of the analyzed 5 AH (green) and 28 PNP patients (red). Levels of NFL in serum (B) and CSF (C) in patients with normal B-CSF barrier function, or mild, moderate and severe B-CSF barrier dysfunction. (D). NFL ratio between CSF and serum (QNFL) in AH and the subgroups of PNP patients according to their B-CSF barrier dysfunction. (E) Correlation between the levels of NFL in serum ( ) and CSF (
 ) and the subjective severity. (F) Correlations between the levels of IL-8 and NFL in CSF in pg/ml. ns, not significant; *, p < 0.05; **, p < 0.01; ***, p < 0.001; ****, p < 0.0001. All graphical images were incorporated from Smart Servier Medical Art, https://smart.servier.com/, under the Creative common Attribution 3.0 Unported Licence.
Interestingly, we found a correlation between the levels of NFL and IL-8 in CSF (Figure 6F), thus indicating a relation between neurodegeneration and inflammation. With this discovery, we decided to study the levels of cytokines between CSF and serum, in order to determine their origin, in the different subgroups of twenty-eight PNP patients and five UH (Figure 7A). This analysis showed that PNP patients with a moderate/severe B-CSF barrier dysfunction present higher levels of IL-6 and IL-8 in CSF and a higher QIL-6 and QCCL2 (cytokine ratio in CSF/in serum), than those with a normal B-CSF barrier integrity (Figure 7B). A multivariate analysis showed that the levels of IL-6 in CSF correlated with the overall severity, thus indicating a relation between the production or release of IL-6 and severe PNP (Figure 7C). Interestingly, a second multivariate analysis showed that the levels of most cytokines analyzed in CSF correlated with each other (Figure 7D), therefore suggesting a common stimulus triggering their production, or their involvement in a common pathway
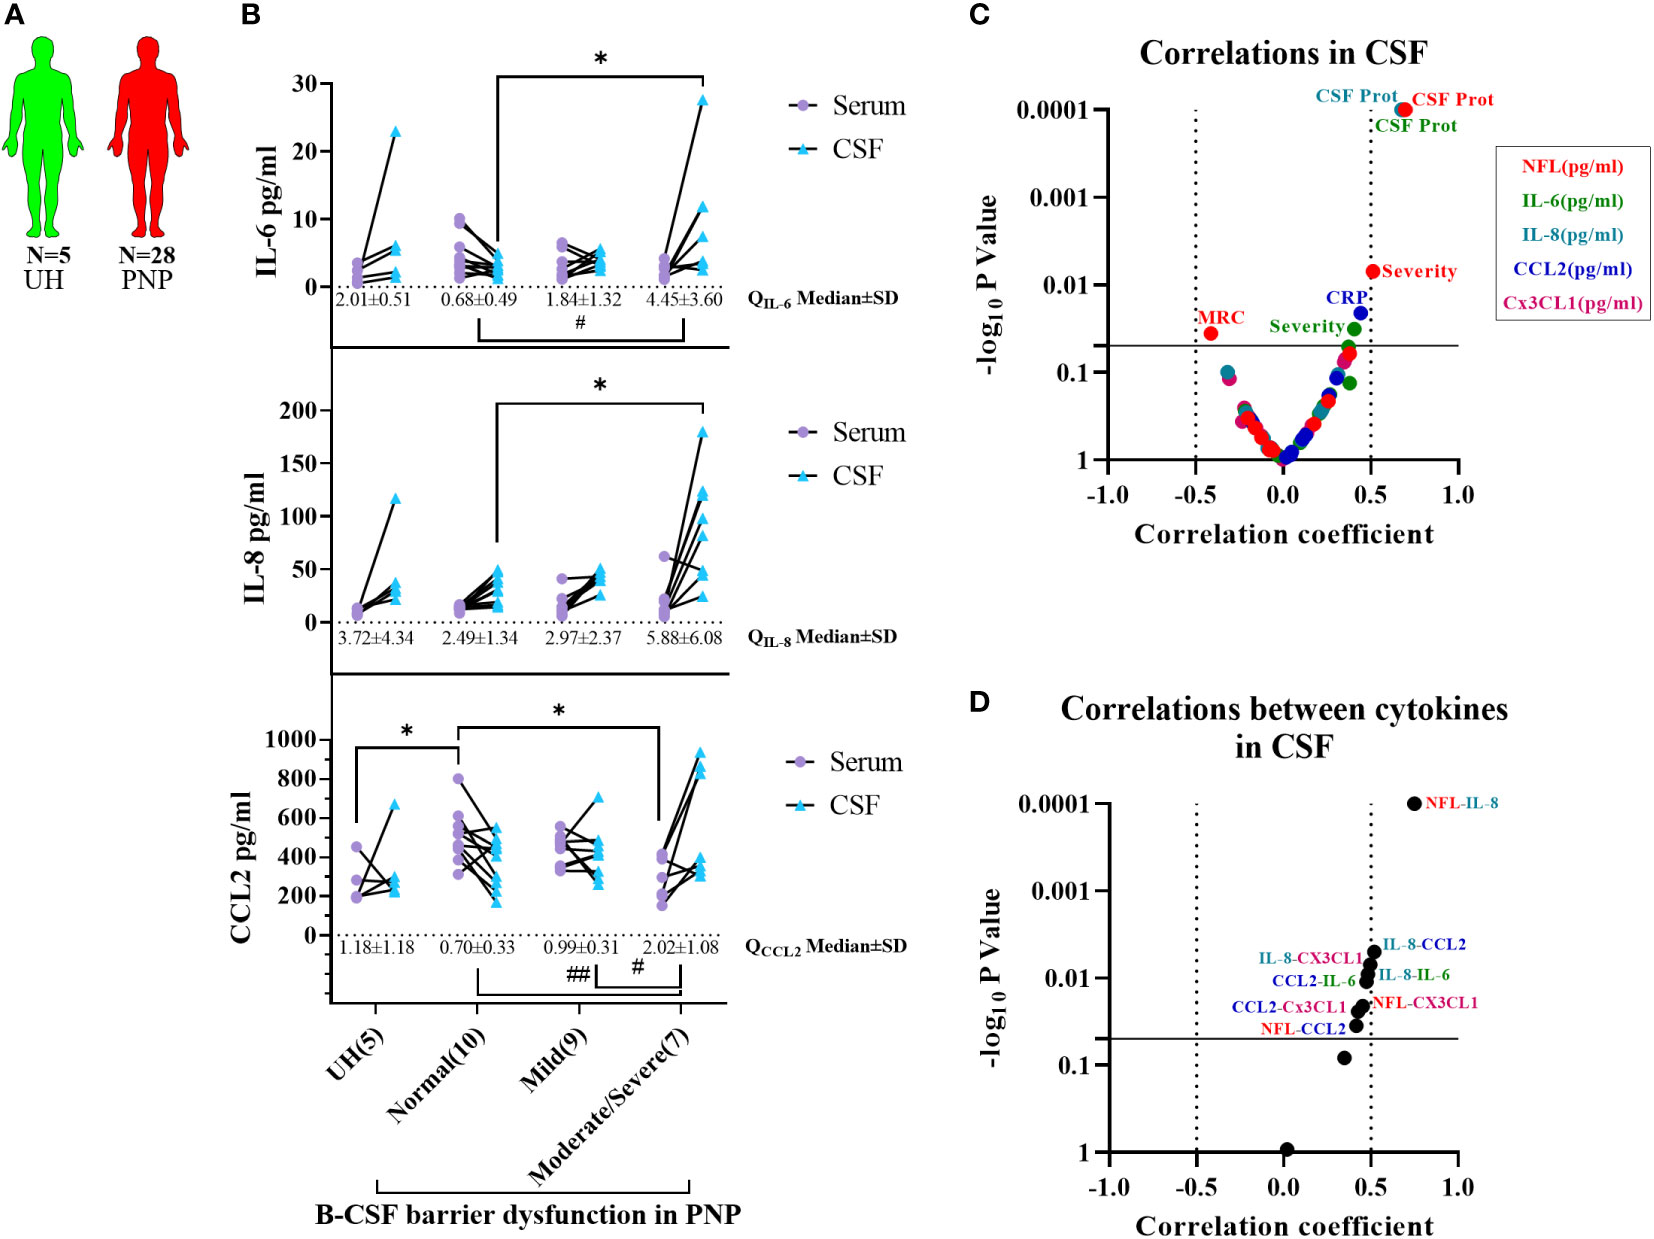
Figure 7 Comparison of cytokine levels between CSF and serum from patients with PNP. (A) Visual representation of the analyzed 5 UH (light green) and 28 PNP patients (red). (B) Levels of IL-6, IL-8 and CCL2 in serum () and CSF () in patients with normal B-CSF barrier function, or mild, moderate and severe B-CSF barrier dysfunction. (C) Volcano plot of the Spearman multivariate correlations between each cytokine in CSF and the neuropathy scores (C), and among each cytokine in CSF (D) */# p < 0.05; ##, p < 0.01. All graphical images were incorporated from Smart Servier Medical Art, https://smart.servier.com/, under the Creative common Attribution 3.0 Unported Licence.
Acyl-carnitine levels in serum and CSF from PNP patients
In order to complete our study with the analysis of lipid compounds involved in pro-inflammatory pathways, we performed LC-MS to measure the levels of carnitine, palmitoylcarnitine and oleoylcarnitine in serum and CSF from twenty-three PNP patients and five UH (Figure 8A). While carnitine and palmitoylcarnitine in serum did not differ between PNP and UH, oleoylcarnitine was found in higher levels in patients with PNP in comparison to UH (Figure 8B). Carnitine was also not different in CSF between PNP patients and UH (Figure 8C). Palmitoylcarnitine and oleoylcarnitine were not detected in CSF samples (data not shown).
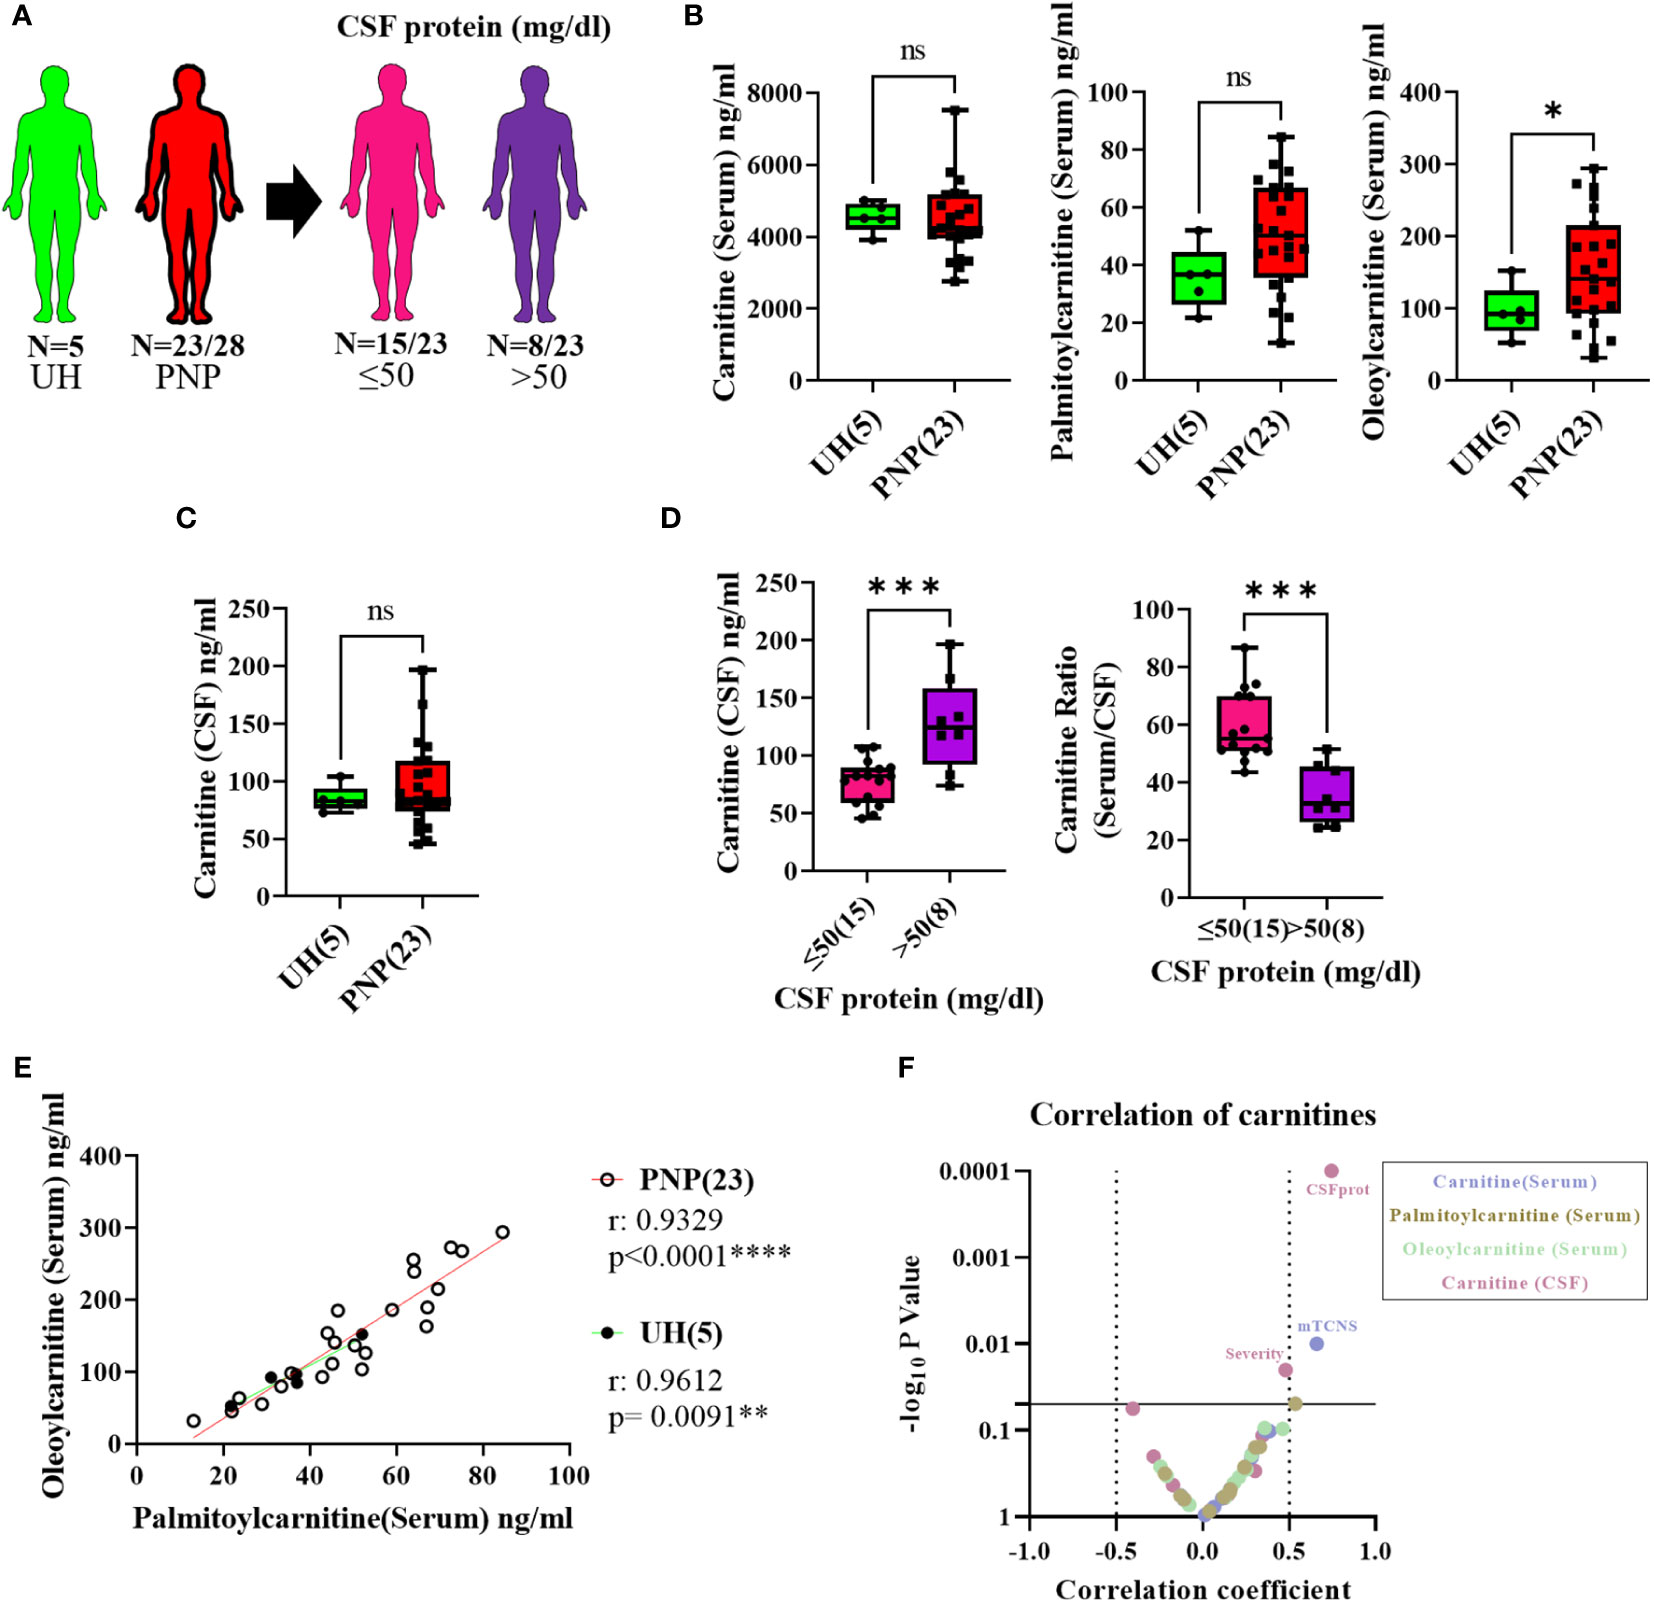
Figure 8 Levels of pro-inflammatory lipids in serum and CSF from patients with PNP. (A) Visual representation of the analyzed 5 UH (light green) and 23 out of 28 PNP patients (red), further divided into 15 PNP patients with normal (≤ 50 mg/dl) (pink) and 8 with an abnormal (> 50 mg/dl) (purple) CSF total protein. (B) Levels of carnitine, palmitoylcarnitine and oleoylcarnitine in ng/ml in serum from UH and PNP patients. (C) Levels of carnitine in ng/ml in CSF from UH and PNP patients. (D) Levels of carnitine in ng/ml in CSF (left) and its ratio (serum/CSF) (right) in PNP patients with normal and abnormal CSF total protein. Correlations can be found between oleoylcarnitine and palmitoylcarnitine (ng/ml) in serum from UH and PNP patients (E). (F) Volcano plot of the Spearman multivariate correlations between each carnitine and the neuropathy scores. * p < 0.05; **, p < 0.01; ***, p < 0.001; ****, p < 0.0001. All graphical images were incorporated from Smart Servier Medical Art, https://smart.servier.com/, under the Creative common Attribution 3.0 Unported Licence.
Our results also showed that PNP patients with high CSF protein (>50mg/dl) had higher levels of carnitine in CSF and a lower serum/CSF ratio than those with normal protein levels (p < 0.001) (Figure 8D).
Furthermore, we observed that the levels of palmitoylcarnitine and oleoylcarnitine in serum positively correlated in patients with PNP (p < 0.0001) and in UH (p < 0.001) (Figure 8E). Interestingly, a multivariate analysis found a positive correlation between the levels of carnitine in serum and the mTCNS (p < 0.001) as well as between the levels of carnitine in serum and the overall severity (Figure 8F).
Discussion
In this study, we investigated the gene expression, protein and lipid levels of different pro-inflammatory markers in blood and CSF from patients with PNP, in comparison to a control group of patients with acute headaches of unclear etiology.
Our results showed that, contrary to our initial hypothesis of PNP being associated with enhanced systemic inflammation, PNP patients and disease controls did not present major differences in systemic inflammatory markers. Receptors of great interest in the fields of inflammation and pain, TLR4 and TRPV1, were not informative in our cohort. While only CCL2 and oleoylcarnitine were present in higher levels in sera from PNP patients than in controls, the levels of CCL2 were associated to pain treatment.
Oleoylcarnitine, as one of the long-chain acylcarnitines found upstream of the synthesis of prostaglandins and thromboxanes, has been described upregulated in patients with systemic inflammation, as well as in different neuronal tissues in models of neurodegeneration (20, 22, 24). This suggests that the levels of oleoylcarnitine indicate an inflammatory process or neurodegeneration taking place in patients with PNP. Since it did not correlate with any neuropathy scores, we postulate that oleoylcarnitine is upregulated in all patients with PNP, and it might be of interest to explore as a potential early diagnostic marker in larger groups of different types of PNP versus controls.
Secondly, we hypothesized that a systemic inflammation may correlate with the severity of the disease and the development of neuropathic pain. Our study showed that IL-10 was the only inflammatory mediator consistently upregulated at the gene and protein level in patients with severe pain, in comparison to those without pain. IL-10 is understood as an anti-inflammatory cytokine, mainly produced by anti-inflammatory macrophages, and secreted to suppress pro-inflammatory responses and maintain tissue homeostasis (42). In patients with different neuropathies, levels of IL-10 have been described downregulated in serum and CSF and negatively correlating with pain scores, therefore suggesting an increased systemic inflammation (26–30). Our study, on the other hand, showed a positive correlation between IL-10 and CRP, confirming the involvement of IL-10 in inflammatory responses, potentially in a counter-regulatory function. Our results are in accordance with previous studies where higher levels of IL-10 were reported in serum from patients with neuropathies (27, 43, 44). This suggests that the higher expression of IL-10 might act as a compensatory mechanism against the inflammation triggered by neuropathy-specific processes. However, high levels of IL-10 as well as of IL-10 expressing blood mononuclear cells have been found related to large nerve fiber sensory and motor axonal damage, as well as motor nerve demyelination (28, 45). Therefore, we cannot exclude the option that the overexpression of IL-10 might also play a direct role in the pathogenesis of nerve fiber damage
Severe neuropathy indicated by a low SNAP correlated with high gene expression of CCL2. CCL2 and its receptor CCR2 can cause hyperalgesia through the upregulation of cation channels (46–48). In addition, CCL2, also named monocyte chemoattractant protein-1 (MCP-1), is directly involved in the migration and infiltration of monocytes, memory T lymphocytes, and natural killer (NK) cells, therefore also promoting local inflammatory processes (49). High systemic levels of CCL2 might thus correlate with the development of neuropathic symptoms and could serve as a severity marker of the neuropathy. Furthermore, the high levels of CCL2 might also be due to the treatment of pain as previously mentioned. More specifically, PNP patients with the highest levels of CCL2 were those that had been treated with opioids. This could either be indicate of a molecular interaction or simply support that severe neuropathy is more likely to be painful and therefore being properly treated. Kaminski et al. provided evidence for a molecular interaction because inhibition of opioid receptors led to a downregulation of CCL2 (50). On the other hand, high levels of CCL2 can inhibit the activation of opioid receptors, thus attenuating analgesia (51, 52). This suggests that the high CCL2 levels might be a compensatory effect from the opioid treatment. Further studies need to elucidate the role of CCL2 in the development of PNP and its symptoms.
Interestingly, we found that patients with a severe B-CSF barrier dysfunction, determined by the CSF/serum albumin ratio (41), also presented higher levels of NFL in serum and CSF, as well as higher levels of IL-6 and IL-8 in CSF. NFL constitutes one of the subunits of the neurofilament that forms the cytoskeleton in neurons. Neurofilaments are especially abundant in large myelinated axons, while relatively scarce in dendrites, and their release has been described as a marker of neurodegeneration or upon neuroaxonal damage (36, 53–59). As expected, NFL levels in CSF and serum of our PNP group were increased in comparison to the controls, indicating neurodegeneration. This increase seemed to be present especially in those PNP patients with B-CSF barrier dysfunction, both in serum and CSF, while no difference was found in PNP patients with a normal B-CSF barrier and controls. The correlation we found between the albumin ratio (QAlb) and the severity of the neuropathy may indicate that patients with a moderate to severe B-CSF barrier dysfunction also present more severe neuropathy and thus, more neurodegeneration, explaining the higher levels of NFL in these patients. Furthermore, while a break of the B-CSF barrier would allow the exchange of proteins between serum and CSF, the levels of NFL were consistently higher in CSF than in sera, thus indicating an intrathecal production. Since we found higher NFL levels in serum related with a decreased SNAP, and in accordance with previous studies (59–62), we believe that in diseases of the PNS, NFL in serum could come from the degeneration of peripheral axons. Since the prognosis of a neuropathy is often uncertain in an individual patient, NFL in serum could be used prospectively to monitor progress and eventually to detect unexpected accelerations of the progression. In CSF, on the other hand, differences in the levels of NFL in peripheral neuropathies have yet to be explained. In 2018, Axelsson et al. described for the first time higher NFL levels in CSF in patients with Guillain-Barré syndrome (GBS), a neuropathy of the PNS, than in controls. This increase was postulated to be due to axonal damage of nerve roots, which are surrounded by CSF in the subarachnoid space of the spinal cord (63). This idea has been restated in a more recent study in acute and chronic inflammatory polyneuropathies (57). Later in 2018, similar levels of NFL were found in CSF by Mariotto et al. in a cohort of acquired peripheral neuropathies. This study, however, discusses a possible ongoing axonal damage in both the CNS and PNS, and that the levels of NFL might be affected by a disrupted blood nerve barrier (64). Following the idea raised by Axelsson et al., we postulate that neurodegeneration takes place at the nerve roots, which constitute the very beginning of the PNS, leading to the intrathecal release of NFL. Recent studies have also found a lowered NFL CSF/Serum ratio in patients with peripheral neuropathies, therefore proposing peripheral axonal damage contributing to higher levels of NFL in serum (64, 65). Our results showed a constant CSF/serum ratio among PNP subgroups and controls, suggesting a constant increment of NFL in both tissues and therefore neurodegeneration taking place at the nerve roots as well as in peripheral nerves.
Interestingly, patients with a severe B-CSF barrier dysfunction also presented higher levels of IL-6 and IL-8 in CSF, while the levels in sera remained constant, therefore causing an increment of their CSF/serum ratio. Since 1993, high levels of IL-6 and IL-8 have been reported in CSF of patients with GBS and CIDP. This study as well as more recent ones suggest a prominent intrathecal activation of cells of the monocyte/macrophage lineage, leading to the intrathecal production of the cytokines (66–68). Following a similar line of thought, we postulate that inflammation is present at the level of the nerve roots and leads to the release of pro-inflammatory cytokines directly to the CSF. Furthermore, this inflammation may cause neuronal damage and disruption of the axonal cell membrane, inducing the releases of NFL into the CSF compartment (69). The finding of a strong correlation between the levels of IL-8 and NFL in CSF supports this assumption and leads to the question whether they are simultaneously released from the same cell type, or whether they consecutively induce each other’s release. Moreover, the levels of IL-6 in CSF correlated with the severity of neuropathy, thus indicating that the inflammation at the nerve roots might be the cause or consequence of the neurodegeneration. This would indicate that patients with more severe neuropathic symptoms would present an affection of the nerve roots and a break of the B-CSF barrier, supporting the importance of CSF analysis as a diagnostic tool for patients with PNP (70). Being an invasive procedure, lumbar puncture to obtain CSF is not without risks, and patients need to sign informed consent, however, the risk of headache, the most frequent adverse effect of lumbar puncture, can be markedly reduced by that use of an atraumatic needle (71). Other adverse effects are extremely rare when the lumbar puncture is properly performed.
Although our study includes the analysis of a large number of pro- and anti-inflammatory markers, non-biased omics-based analysis might be necessary to identify all involved markers and elucidate the specific pathways taking place in PNP. Furthermore, our results are limited by the very well characterized but low number of recruited patients and the variance in etiologies. A larger cohort might help separating the patients into males and females and into diagnostic subgroups that could lead to clearer results.
We conclude that in patients with PNP systemic inflammatory markers in blood or CSF do not differ from controls in general, but specific cytokines or lipids do. Nevertheless, we found several indications of a correlation between inflammation and the neuropathy severity and symptoms. In particular, we described a strong interaction between inflammation and neurodegeneration at the nerve roots in a specific subgroup of PNP patients with B-CSF barrier dysfunction, which highlights the importance of CSF analysis in patients with peripheral neuropathies. We believe that the diagnostic marker panel provided in our study may help improving patient stratification not only to increase diagnostic validity, but also to guide treatment decisions.
Data availability statement
The original contributions presented in the study are included in the article/Supplementary Material. Further inquiries can be directed to the corresponding author.
Ethics statement
The studies involving human participants were reviewed and approved by Würzburg Medical Faculty Ethics Committee (# 15/19 and # 242/17). The patients/participants provided their written informed consent to participate in this study.
Author contributions
PG-F, NÜ and CS contributed to conception and design of the study. AR performed the gene expression analysis. KH and NC performed the protein analysis. KS and AN performed the lipid analysis. KH, NC, A-KR, HR, NÜ and CS contributed to recruitment of patients and collection of clinical data. A-KR and HR provided samples from healthy controls. PG-F organized the database and performed the statistical analysis. PG-F wrote the first draft of the manuscript. KS and AN wrote a section of the manuscript. All authors contributed to the article and approved the submitted version.
Funding
This project has received funding from the European Union’s Horizon 2020 research and innovation programme under the Marie Skłodowska-Curie Grant Agreement No. 764860. This publication was supported by the Open Access Publication Fund of the University of Würzburg
Acknowledgments
The authors thank Sonja Gommersbach for her skillful technical assistance and Christoph Erbacher, MSc for his advice on data analysis and figures.
Conflict of interest
Author CS has been a consultant for Merz, Omega, Ipsen and Bayer on the subject of neuropathic pain. She has given educational talks for GSK and Pfizer. Authors KS and AN are employed by Bionorica research GmbH.
The remaining authors declare that the research was conducted in the absence of any commercial or financial relationships that could be construed as a potential conflict of interest.
Publisher’s note
All claims expressed in this article are solely those of the authors and do not necessarily represent those of their affiliated organizations, or those of the publisher, the editors and the reviewers. Any product that may be evaluated in this article, or claim that may be made by its manufacturer, is not guaranteed or endorsed by the publisher.
Supplementary material
The Supplementary Material for this article can be found online at: https://www.frontiersin.org/articles/10.3389/fimmu.2023.1067714/full#supplementary-material
References
1. JA R. General approach to peripheral nerve disorders. Am Acad Neurology. Continuum (Minneap Minn) (2017) 23:1241–62. doi: 10.1212/CON.0000000000000519
2. Finnerup NB, Attal N, Haroutounian S, McNicol E, Baron R, Dworkin RH, et al. Pharmacotherapy for neuropathic pain in adults: a systematic review and meta-analysis. Lancet Neurol (2015) 14(2):162–73. doi: 10.1016/S1474-4422(14)70251-0
3. Cavalli E, Mammana S, Nicoletti F, Bramanti P, Mazzon E. The neuropathic pain: An overview of the current treatment and future therapeutic approaches. Int J Immunopathol Pharmacol (2019) 33:2058738419838383. doi: 10.1177/2058738419838383
4. Tavee JO. Immune axonal polyneuropathy. Am Acad Neurology. Continuum (Minneap Minn) (2017) 23:1394–410. doi: 10.1212/CON.0000000000000523
5. Sommer C, Leinders M, Üçeyler N. Inflammation in the pathophysiology of neuropathic pain. Pain (2018) 159(3):595–602. doi: 10.1097/j.pain.0000000000001122
6. Fakhoury M. Immune-mediated processes in neurodegeneration: where do we stand? J Neurol (2016) 263(9):1683–701. doi: 10.1007/s00415-016-8052-0
7. Grace PM, Hutchinson MR, Maier SF, Watkins LR. Pathological pain and the neuroimmune interface. Nat Rev Immunol (2014) 14(4):217–31. doi: 10.1038/nri3621
8. Liu T, Zhang L, Joo D, Sun SC. NF-kappaB signaling in inflammation. Signal Transduct Target Ther (2017) 2. doi: 10.1038/sigtrans.2017.23
9. Kauppinen A, Suuronen T, Ojala J, Kaarniranta K, Salminen A. Antagonistic crosstalk between NF-kappaB and SIRT1 in the regulation of inflammation and metabolic disorders. Cell Signal (2013) 25(10):1939–48. doi: 10.1016/j.cellsig.2013.06.007
10. Liu W, Jiang L, Bian C, Liang Y, Xing R, Yishakea M, et al. Role of CX3CL1 in diseases. Arch Immunol Ther Exp (Warsz) (2016) 64(5):371–83. doi: 10.1007/s00005-016-0395-9
11. Bali KK, Gandla J, Rangel DR, Castaldi L, Mouritzen P, Agarwal N, et al. A genome-wide screen reveals microRNAs in peripheral sensory neurons driving painful diabetic neuropathy. Pain (2021) 162(5):1334–51. doi: 10.1097/j.pain.0000000000002159
12. Leinders M, Üçeyler N, Pritchard RA, Sommer C, Sorkin LS. Increased miR-132-3p expression is associated with chronic neuropathic pain. Exp Neurol (2016) 283(Pt A):276–86. doi: 10.1016/j.expneurol.2016.06.025
13. Leinders M, Üçeyler N, Thomann A, Sommer C. Aberrant microRNA expression in patients with painful peripheral neuropathies. J Neurol Sci (2017) 380:242–9. doi: 10.1016/j.jns.2017.07.041
14. Juzwik CA, S SD, Zhang Y, Paradis-Isler N, Sylvester A, Amar-Zifkin A, et al. microRNA dysregulation in neurodegenerative diseases: A systematic review. Prog Neurobiol (2019) 182:101664. doi: 10.1016/j.pneurobio.2019.101664
15. Hoeijmakers JG, Faber CG, Merkies IS, Waxman SG. Painful peripheral neuropathy and sodium channel mutations. Neurosci Lett (2015) 596:51–9. doi: 10.1016/j.neulet.2014.12.056
16. Parenti A, De Logu F, Geppetti P, Benemei S. What is the evidence for the role of TRP channels in inflammatory and immune cells? Br J Pharmacol (2016) 173(6):953–69. doi: 10.1111/bph.13392
17. Cakir M, Sacmaci H, Sabah-Ozcan S. Selected transient receptor potential channel genes' expression in peripheral blood mononuclear cells of multiple sclerosis. Hum Exp Toxicol (2021) 40(12_suppl):S406–13. doi: 10.1177/09603271211043476
18. Ito S, Okuda-Ashitaka E, Minami T. Central and peripheral roles of prostaglandins in pain and their interactions with novel neuropeptides nociceptin and nocistatin. Neurosci Res (2001) 41(4):299–332. doi: 10.1016/S0168-0102(01)00289-9
19. Hu W, Mathey E, Hartung HP, Kieseier BC. Cyclo-oxygenases and prostaglandins in acute inflammatory demyelination of the peripheral nerve. Neurology (2003) 61(12):1774–9. doi: 10.1212/01.WNL.0000098884.75756.4D
20. To KK, Lee KC, Wong SS, Lo KC, Lui YM, Jahan AS, et al. Lipid mediators of inflammation as novel plasma biomarkers to identify patients with bacteremia. J Infect (2015) 70(5):433–44. doi: 10.1016/j.jinf.2015.02.011
21. Maroon JC, Bost JW, Borden MK, Lorenz KM, Ross NA. Natural antiinflammatory agents for pain relief in athletes. Neurosurg Focus (2006) 21(4):E11. doi: 10.3171/foc.2006.21.4.12
22. McGill MR, Li F, Sharpe MR, Williams CD, Curry SC, Ma X, et al. Circulating acylcarnitines as biomarkers of mitochondrial dysfunction after acetaminophen overdose in mice and humans. Arch Toxicol (2014) 88(2):391–401. doi: 10.1007/s00204-013-1118-1
23. Viader A, Sasaki Y, Kim S, Strickland A, Workman CS, Yang K, et al. Aberrant schwann cell lipid metabolism linked to mitochondrial deficits leads to axon degeneration and neuropathy. Neuron (2013) 77(5):886–98. doi: 10.1016/j.neuron.2013.01.012
24. Quanico J, Hauberg-Lotte L, Devaux S, Laouby Z, Meriaux C, Raffo-Romero A, et al. 3D MALDI mass spectrometry imaging reveals specific localization of long-chain acylcarnitines within a 10-day time window of spinal cord injury. Sci Rep (2018) 8(1):16083. doi: 10.1038/s41598-018-34518-0
25. Üçeyler N, Riediger N, Kafke W, Sommer C. Differential gene expression of cytokines and neurotrophic factors in nerve and skin of patients with peripheral neuropathies. J Neurol (2015) 262(1):203–12. doi: 10.1007/s00415-014-7556-8
26. Andrade P, Cornips EMJ, Sommer C, Daemen MA, Visser-Vandewalle V, Hoogland G. Elevated inflammatory cytokine expression in CSF from patients with symptomatic thoracic disc herniation correlates with increased pain scores. Spine J (2018) 18(12):2316–22. doi: 10.1016/j.spinee.2018.07.023
27. Stork ACJ, Rijkers GT, Vlam L, Cats EA, de Jong BAW, Fritsch-Stork RDE, et al. Serum cytokine patterns in immunoglobulin m monoclonal gammopathy-associated polyneuropathy. Muscle Nerve (2019) 59(6):694–8. doi: 10.1002/mus.26462
28. Magrinelli F, Briani C, Romano M, Ruggero S, Toffanin E, Triolo G, et al. The association between serum cytokines and damage to Large and small nerve fibers in diabetic peripheral neuropathy. J Diabetes Res 2015 (2015) p:547834. doi: 10.1155/2015/547834
29. Beppu M, Sawai S, Misawa S, Sogawa K, Mori M, Ishige T, et al. Serum cytokine and chemokine profiles in patients with chronic inflammatory demyelinating polyneuropathy. J Neuroimmunol (2015) 279:7–10. doi: 10.1016/j.jneuroim.2014.12.017
30. Baka P, Escolano-Lozano F, Birklein F. Systemic inflammatory biomarkers in painful diabetic neuropathy. J Diabetes Complications (2021) 35(10):108017. doi: 10.1016/j.jdiacomp.2021.108017
31. Purohit S, Tran PMH, Tran LKH, Satter KB, He M, Zhi Wb, et al. Serum levels of inflammatory proteins are associated with peripheral neuropathy in a cross-sectional type-1 diabetes cohort. Front Immunol (2021) 12:654233. doi: 10.3389/fimmu.2021.654233
32. Redzic Z. Molecular biology of the blood-brain and the blood-cerebrospinal fluid barriers: similarities and differences. Fluids Barriers CNS (2011) 8(1):3. doi: 10.1186/2045-8118-8-3
33. Puthenparampil M, Tomas-Ojer P, Hornemann T, Lutterotti A, Jelcic I, Ziegler M, et al. Altered CSF albumin quotient links peripheral inflammation and brain damage in MS. Neurol Neuroimmunol Neuroinflamm (2021) 8(2). doi: 10.1212/NXI.0000000000000951
34. Solar P, Zamani A, Kubickova L, Dubovy P, Joukal M. Choroid plexus and the blood-cerebrospinal fluid barrier in disease. Fluids Barriers CNS (2020) 17(1):35. doi: 10.1186/s12987-020-00196-2
35. Meixensberger S, Bechter K, Dersch R, Feige B, Maier S, Schiele MA, et al. Sex difference in cerebrospinal fluid/blood albumin quotients in patients with schizophreniform and affective psychosis. Fluids Barriers CNS (2020) 17(1):67. doi: 10.1186/s12987-020-00223-2
36. van Ballegoij WJC, van de Stadt SIW, Huffnagel IC, Kemp S, Willemse EAJ, Teunissen CE, et al. Plasma NfL and GFAP as biomarkers of spinal cord degeneration in adrenoleukodystrophy. Ann Clin Transl Neurol (2020) 7(11):2127–36. doi: 10.1002/acn3.51188
37. L.S. R. The CES-d scale: a self-report depression scale for research in the general population. Appl Psychol Meas. (1977) 1(3):385–401. doi: 10.1177/014662167700100306
38. Duale N, Lipkin WI, Briese T, Aarem J, Ronningen KS, Aas KK, et al. Long-term storage of blood RNA collected in RNA stabilizing tempus tubes in a large biobank–evaluation of RNA quality and stability. BMC Res Notes (2014) 7:633. doi: 10.1186/1756-0500-7-633
39. Aarem J, Brunborg G, Aas KK, Harbak K, Taipale MM, Magnus P, et al. Comparison of blood RNA isolation methods from samples stabilized in tempus tubes and stored at a large human biobank. BMC Res Notes (2016) 9(1):430. doi: 10.1186/s13104-016-2224-y
40. Barker PA, Mantyh P, Arendt-Nielsen L, Viktrup L, Tive L. Nerve growth factor signaling and its contribution to pain. J Pain Res (2020) 13:1223–41. doi: 10.2147/JPR.S247472
41. Csuka E, Morganti-Kossmann MC, Lenzlinger PM, Joller H, Trentz O, Kossmann T. IL-10 levels in cerebrospinal fluid and serum of patients with severe traumatic brain injury: relationship to IL-6, TNF-alpha, TGF-beta1 and blood-brain barrier function. J Neuroimmunol (1999) 101(2):211–21. doi: 10.1016/S0165-5728(99)00148-4
42. Ouyang W, Rutz S, Crellin NK, Valdez PA, Hymowitz SG. Regulation and functions of the IL-10 family of cytokines in inflammation and disease. Annu Rev Immunol (2011) 29:71–109. doi: 10.1146/annurev-immunol-031210-101312
43. Üçeyler N, Kafke W, Riediger N, He L, Necula G, Toyka KV, et al. Elevated proinflammatory cytokine expression in affected skin in small fiber neuropathy. Neurology (2010) 74(22):1806–13. doi: 10.1212/WNL.0b013e3181e0f7b3
44. Azevedo EP, Guimaraes-Costa AB, Bandeira-Melo C, Chimelli L, Waddington-Cruz M, Saraiva EM, et al. Inflammatory profiling of patients with familial amyloid polyneuropathy. BMC Neurol (2019) 19(1):146. doi: 10.1186/s12883-019-1369-4
45. Press R, Deretzi G, Zou LP, Zhu J, Fredman P, Lycke J, et al. IL-10 and IFN-gamma in Guillain-barre syndrome. network members of the Swedish epidemiological study group. J Neuroimmunol (2001) 112(1-2):129–38. doi: 10.1016/s0165-5728(00)00388-x
46. White FA, Wilson NM. Chemokines as pain mediators and modulators. Curr Opin Anaesthesiol (2008) 21(5):580–5. doi: 10.1097/ACO.0b013e32830eb69d
47. Dansereau MA, Midavaine E, Begin-Lavallee V, Belkouch M, Beaudet N, Longpre JM, et al. Mechanistic insights into the role of the chemokine CCL2/CCR2 axis in dorsal root ganglia to peripheral inflammation and pain hypersensitivity. J Neuroinflamm (2021) 18(1):79. doi: 10.1186/s12974-021-02125-y
48. Kao DJ, Li AH, Chen JC, Luo RS, Chen YL, Lu JC, et al. CC chemokine ligand 2 upregulates the current density and expression of TRPV1 channels and Nav1.8 sodium channels in dorsal root ganglion neurons. J Neuroinflamm (2012) 9:189. doi: 10.1186/1742-2094-9-189
49. Deshmane SL, Kremlev S, Amini S, Sawaya BE. Monocyte chemoattractant protein-1 (MCP-1): an overview. J Interferon Cytokine Res (2009) 29(6):313–26. doi: 10.1089/jir.2008.0027
50. Kaminsky DE, Rogers TJ. Suppression of CCL2/MCP-1 and CCL5/RANTES expression by nociceptin in human monocytes. J Neuroimmune Pharmacol (2008) 3(2):75–82. doi: 10.1007/s11481-007-9086-y
51. Kwiatkowski K, Popiolek-Barczyk K, Piotrowska A, Rojewska E, Ciapala K, Makuch W, et al. Chemokines CCL2 and CCL7, but not CCL12, play a significant role in the development of pain-related behavior and opioid-induced analgesia. Cytokine (2019) 119:202–13. doi: 10.1016/j.cyto.2019.03.007
52. Heles M, Mrozkova P, Sulcova D, Adamek P, Spicarova D, Palecek J. Chemokine CCL2 prevents opioid-induced inhibition of nociceptive synaptic transmission in spinal cord dorsal horn. J Neuroinflamm (2021) 18(1):279. doi: 10.1186/s12974-021-02335-4
53. Mattsson N, Cullen NC, Andreasson U, Zetterberg H, Blennow K. Association between longitudinal plasma neurofilament light and neurodegeneration in patients with Alzheimer disease. JAMA Neurol (2019) 76(7):791–9. doi: 10.1001/jamaneurol.2019.0765
54. Preische O, Schultz SA, Apel A, Kuhle J, Kaeser SA, Barro C, et al. Serum neurofilament dynamics predicts neurodegeneration and clinical progression in presymptomatic alzheimer's disease. Nat Med (2019) 25(2):277–83. doi: 10.1038/s41591-018-0304-3
55. Backstrom D, Linder J, Jakobson Mo S, Riklund K, Zetterberg H, Blennow K, et al. NfL as a biomarker for neurodegeneration and survival in Parkinson disease. Neurology (2020) 95(7):e827–38. doi: 10.1212/WNL.0000000000010084
56. Graham NSN, Zimmerman KA, Moro F, Heslegrave A, Maillard SA, Bernini A, et al. Axonal marker neurofilament light predicts long-term outcomes and progressive neurodegeneration after traumatic brain injury. Sci Transl Med (2021) 13(613):eabg9922. doi: 10.1126/scitranslmed.abg9922
57. Kmezic I, Samuelsson K, Finn A, Upate Z, Blennow K, Zetterberg H, et al. Neurofilament light chain and total tau in the differential diagnosis and prognostic evaluation of acute and chronic inflammatory polyneuropathies. Eur J Neurol (2022) 29(9):2810–22. doi: 10.1111/ene.15428
58. Yuan A, Rao MV, Veeranna Nixon RA. Neurofilaments and neurofilament proteins in health and disease. Cold Spring Harb Perspect Biol (2017) 9(4). doi: 10.1101/cshperspect.a018309
59. Huehnchen P, Schinke C, Bangemann N, Dordevic AD, Kern J, Maierhof SK, et al. Neurofilament proteins as a potential biomarker in chemotherapy-induced polyneuropathy. JCI Insight (2022) 7(6). doi: 10.1172/jci.insight.154395
60. Ticau S, Sridharan GV, Tsour S, Cantley WL, Chan A, Gilbert JA, et al. Neurofilament light chain as a biomarker of hereditary transthyretin-mediated amyloidosis. Neurology (2021) 96(3):e412–22. doi: 10.1212/WNL.0000000000011090
61. Hayashi T, Nukui T, Piao JL, Sugimoto T, Anada R, Matsuda N, et al. Serum neurofilament light chain in chronic inflammatory demyelinating polyneuropathy. Brain Behav (2021) 11(5):e02084. doi: 10.1002/brb3.2084
62. Millere E, Rots D, Simren J, Ashton NJ, Kupats E, Micule I, et al. Plasma neurofilament light chain as a potential biomarker in charcot-Marie-Tooth disease. Eur J Neurol (2021) 28(3):974–81. doi: 10.1111/ene.14689
63. Axelsson M, Sjogren M, Andersen O, Blennow K, Zetterberg H, Lycke J. Neurofilament light protein levels in cerebrospinal fluid predict long-term disability of Guillain-barre syndrome: A pilot study. Acta Neurol Scand (2018) 138(2):143–50. doi: 10.1111/ane.12927
64. Mariotto S, Farinazzo A, Magliozzi R, Alberti D, Monaco S, Ferrari S. Serum and cerebrospinal neurofilament light chain levels in patients with acquired peripheral neuropathies. J Peripher Nerv Syst (2018) 23(3):174–7. doi: 10.1111/jns.12279
65. Kortvelyessy P, Kuhle J, Duzel E, Vielhaber S, Schmidt C, Heinius A, et al. Ratio and index of neurofilament light chain indicate its origin in Guillain-barre syndrome. Ann Clin Transl Neurol (2020) 7(11):2213–20. doi: 10.1002/acn3.51207
66. Maimone D, Annunziata P, Simone IL, Livrea P, Guazzi GC. Interleukin-6 levels in the cerebrospinal fluid and serum of patients with Guillain-barre syndrome and chronic inflammatory demyelinating polyradiculoneuropathy. J Neuroimmunol (1993) 47(1):55–61. doi: 10.1016/0165-5728(93)90284-6
67. Sivieri S, Ferrarini AM, Lolli F, Mata S, Pinto F, Tavolato B, et al. Cytokine pattern in the cerebrospinal fluid from patients with GBS and CIDP. J Neurol Sci (1997) 147(1):93–5. doi: 10.1016/S0022-510X(96)00319-X
68. Sainaghi PP, Collimedaglia L, Alciato F, Leone MA, Naldi P, Molinari R, et al. The expression pattern of inflammatory mediators in cerebrospinal fluid differentiates Guillain-barre syndrome from chronic inflammatory demyelinating polyneuropathy. Cytokine (2010) 51(2):138–43. doi: 10.1016/j.cyto.2010.05.005
69. Kuhle J, Gaiottino J, Leppert D, Petzold A, Bestwick JP, Malaspina A, et al. Serum neurofilament light chain is a biomarker of human spinal cord injury severity and outcome. J Neurol Neurosurg Psychiatry (2015) 86(3):273–9. doi: 10.1136/jnnp-2013-307454
70. Ludwig J, Binder A, Steinmann J, Wasner G, Baron R. Cytokine expression in serum and cerebrospinal fluid in non-inflammatory polyneuropathies. J Neurol Neurosurg Psychiatry (2008) 79(11):1268–73. doi: 10.1136/jnnp.2007.134528
Keywords: cytokines, polyneuropathy, cerebrospinal fluid, neurofilament light chain, blood CSF barrier
Citation: García-Fernández P, Höfflin K, Rausch A, Strommer K, Neumann A, Cebulla N, Reinhold A-K, Rittner H, Üçeyler N and Sommer C (2023) Systemic inflammatory markers in patients with polyneuropathies. Front. Immunol. 14:1067714. doi: 10.3389/fimmu.2023.1067714
Received: 12 October 2022; Accepted: 31 January 2023;
Published: 13 February 2023.
Edited by:
Rowan S. Hardy, University of Birmingham, United KingdomReviewed by:
Nicholas Veldhuis, Monash University, AustraliaParisa Gazerani, Oslo Metropolitan University, Norway
Copyright © 2023 García-Fernández, Höfflin, Rausch, Strommer, Neumann, Cebulla, Reinhold, Rittner, Üçeyler and Sommer. This is an open-access article distributed under the terms of the Creative Commons Attribution License (CC BY). The use, distribution or reproduction in other forums is permitted, provided the original author(s) and the copyright owner(s) are credited and that the original publication in this journal is cited, in accordance with accepted academic practice. No use, distribution or reproduction is permitted which does not comply with these terms.
*Correspondence: Patricia García-Fernández, garcia_P@ukw.de